Gold: Up 1.8% to $4184.90 — Testing 61.8% Fibonacci Support
· Commodities · QuoteReporter
Gold: Up 1.8% to $4184.90 — Testing 61.8% Fibonacci Support
Analysis Date: July 03, 2026
📊 Current Market Data
CURRENT PRICE
$4184.90
DAILY CHANGE
+1.76%
WEEKLY CHANGE
+2.60%
52W HIGH
$5586.20
52W LOW
$3263.90
💡 Key Market Factors
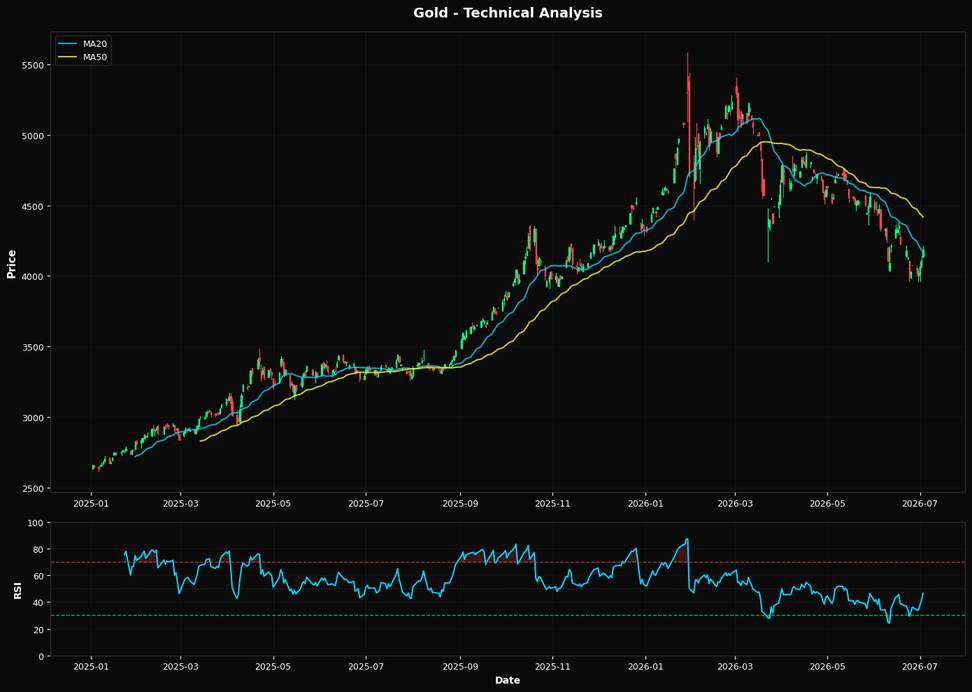
Gold's recent price action suggests a potential bullish reversal, driven by its proximity to key technical levels and macroeconomic factors. The most critical macro driver for gold right now is the Federal Reserve's interest rate policy. With the price of gold at $4184.90, up +1.76% daily and +2.60% weekly, the market is likely reacting to expectations of a more dovish Fed stance. As inflationary pressures show signs of moderating, the Fed may slow its rate hikes, weakening the USD and enhancing gold's appeal as a hedge against currency devaluation. This dynamic is crucial, as a softer dollar typically boosts gold prices by making it cheaper for holders of other currencies. From a technical perspective, gold's current RSI of 46.4 indicates that it is neither overbought nor oversold, suggesting room for upward movement. The price is above the 20-day moving average of $4170.54, but still below the 50-day and 200-day moving averages of $4418.71 and $4458.76, respectively. This positioning implies a short-term bullish bias, especially as the price hovers near the 61.8% Fibonacci retracement level at $4151.02, which acts as a strong support. The convergence of these technical indicators suggests that gold could be poised for a continued rally if it can break through the resistance posed by the longer-term moving averages. A key risk to this bullish outlook would be a stronger-than-expected U.S. economic data release, such as a robust jobs report, which could prompt the Fed to maintain or even increase its hawkish stance. This would likely strengthen the USD and apply downward pressure on gold prices. Conversely, a weaker economic report could reinforce the current bullish sentiment by increasing the likelihood of a Fed pivot. Looking ahead, the upcoming Federal Open Market Committee (FOMC) meeting will be pivotal. Should the Fed signal a pause or slowdown in rate hikes, it would likely confirm the bullish thesis for gold, potentially driving prices higher. Conversely, any indication of continued aggressive tightening could invalidate this view, reinforcing the importance of monitoring Fed communications closely.📈 Technical Indicators Summary
RSI (14)
46.4
50-Day MA
$4418.71
200-Day MA
$4458.76
Fib Level
61.8%
📊 Technical Analysis Chart (18-Month View)
📐 Fibonacci Retracement Analysis
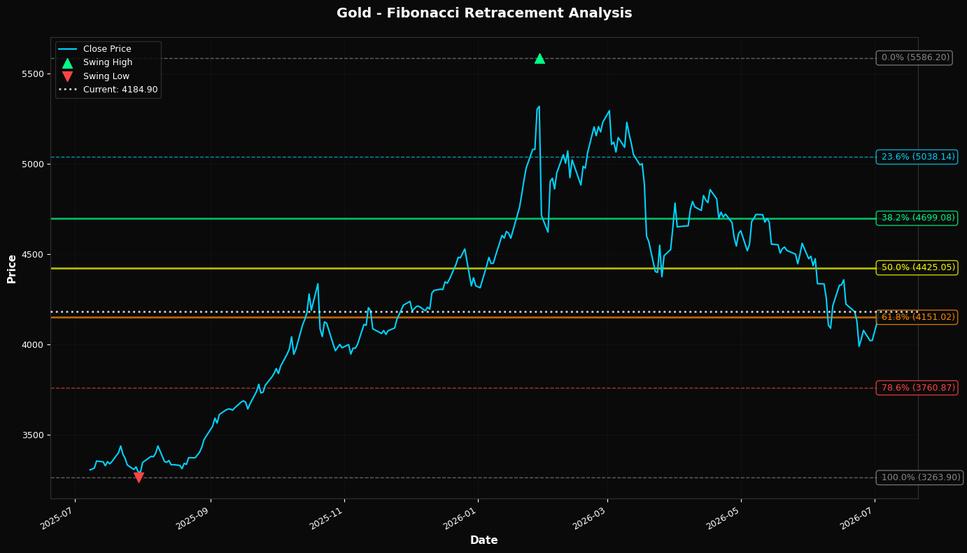
🎯 Key Trading Levels
Key Fibonacci Levels:
- 38.2%: $4699.08
- 50.0%: $4425.05
- 61.8%: $4151.02
Support: $3263.90 (Swing Low), $4418.71 (50-Day MA)
Resistance: $5586.20 (Swing High)
Disclaimer
The content on MarketsFN.com is provided for educational and informational purposes only. It does not constitute financial advice, investment recommendations, or trading guidance. All investments involve risks, and past performance does not guarantee future results. You are solely responsible for your investment decisions and should conduct independent research and consult a qualified financial advisor before acting. MarketsFN.com and its authors are not liable for any losses or damages arising from your use of this information.