Nasdaq 100 2026 YTD Highs & Lows Radar: Micron Technology (MU), Microsoftoration (MSFT) and more
· Stocks · MarketsFN Team
Nasdaq 100 2026 YTD Highs & Lows Radar: Micron Technology (MU), Microsoftoration (MSFT) and more
Screening all 101 Nasdaq 100 constituents for stocks nearest to their 2026 year-to-date high and their 2026 YTD low. Data as of June 26, 2026. % Realized = total return since Jan 1 2026.
Legend: RSI > 70 = overbought · RSI < 30 = oversold · Green % Realized = positive YTD return · Red = negative.
📈 Nearest to 2026 High
Sectors represented: Technology (3), Consumer Defensive (1), Communication Services (1)
| Ticker | Company | Sector | Price Last | % Realized | 2026 YTD High Date | RSI | % above MA200 | Trend |
|---|---|---|---|---|---|---|---|---|
| MU | Micron Technology Inc | Technology | $1213.56 | +284.74% | 2026-06-25 | 59.7 | +184.9% | Above MA20, MA50, MA200 |
| AMAT | Applied Materials Inc | Technology | $668.00 | +148.45% | 2026-06-25 | 64.1 | +102.8% | Above MA20, MA50, MA200 |
| MNST | Monster Beverage Corp | Consumer Defensive | $95.83 | +25.83% | 2026-06-25 | 75.3 | +24.6% | Above MA20, MA50, MA200 |
| FTNT | Fortinet Inc | Technology | $149.93 | +92.51% | 2026-06-25 | 66.9 | +63.6% | Above MA20, MA50, MA200 |
| EA | Electronic Arts, Inc | Communication Services | $204.73 | +0.16% | 2026-06-25 | 68.7 | +2.3% | Above MA20, MA50, MA200 |
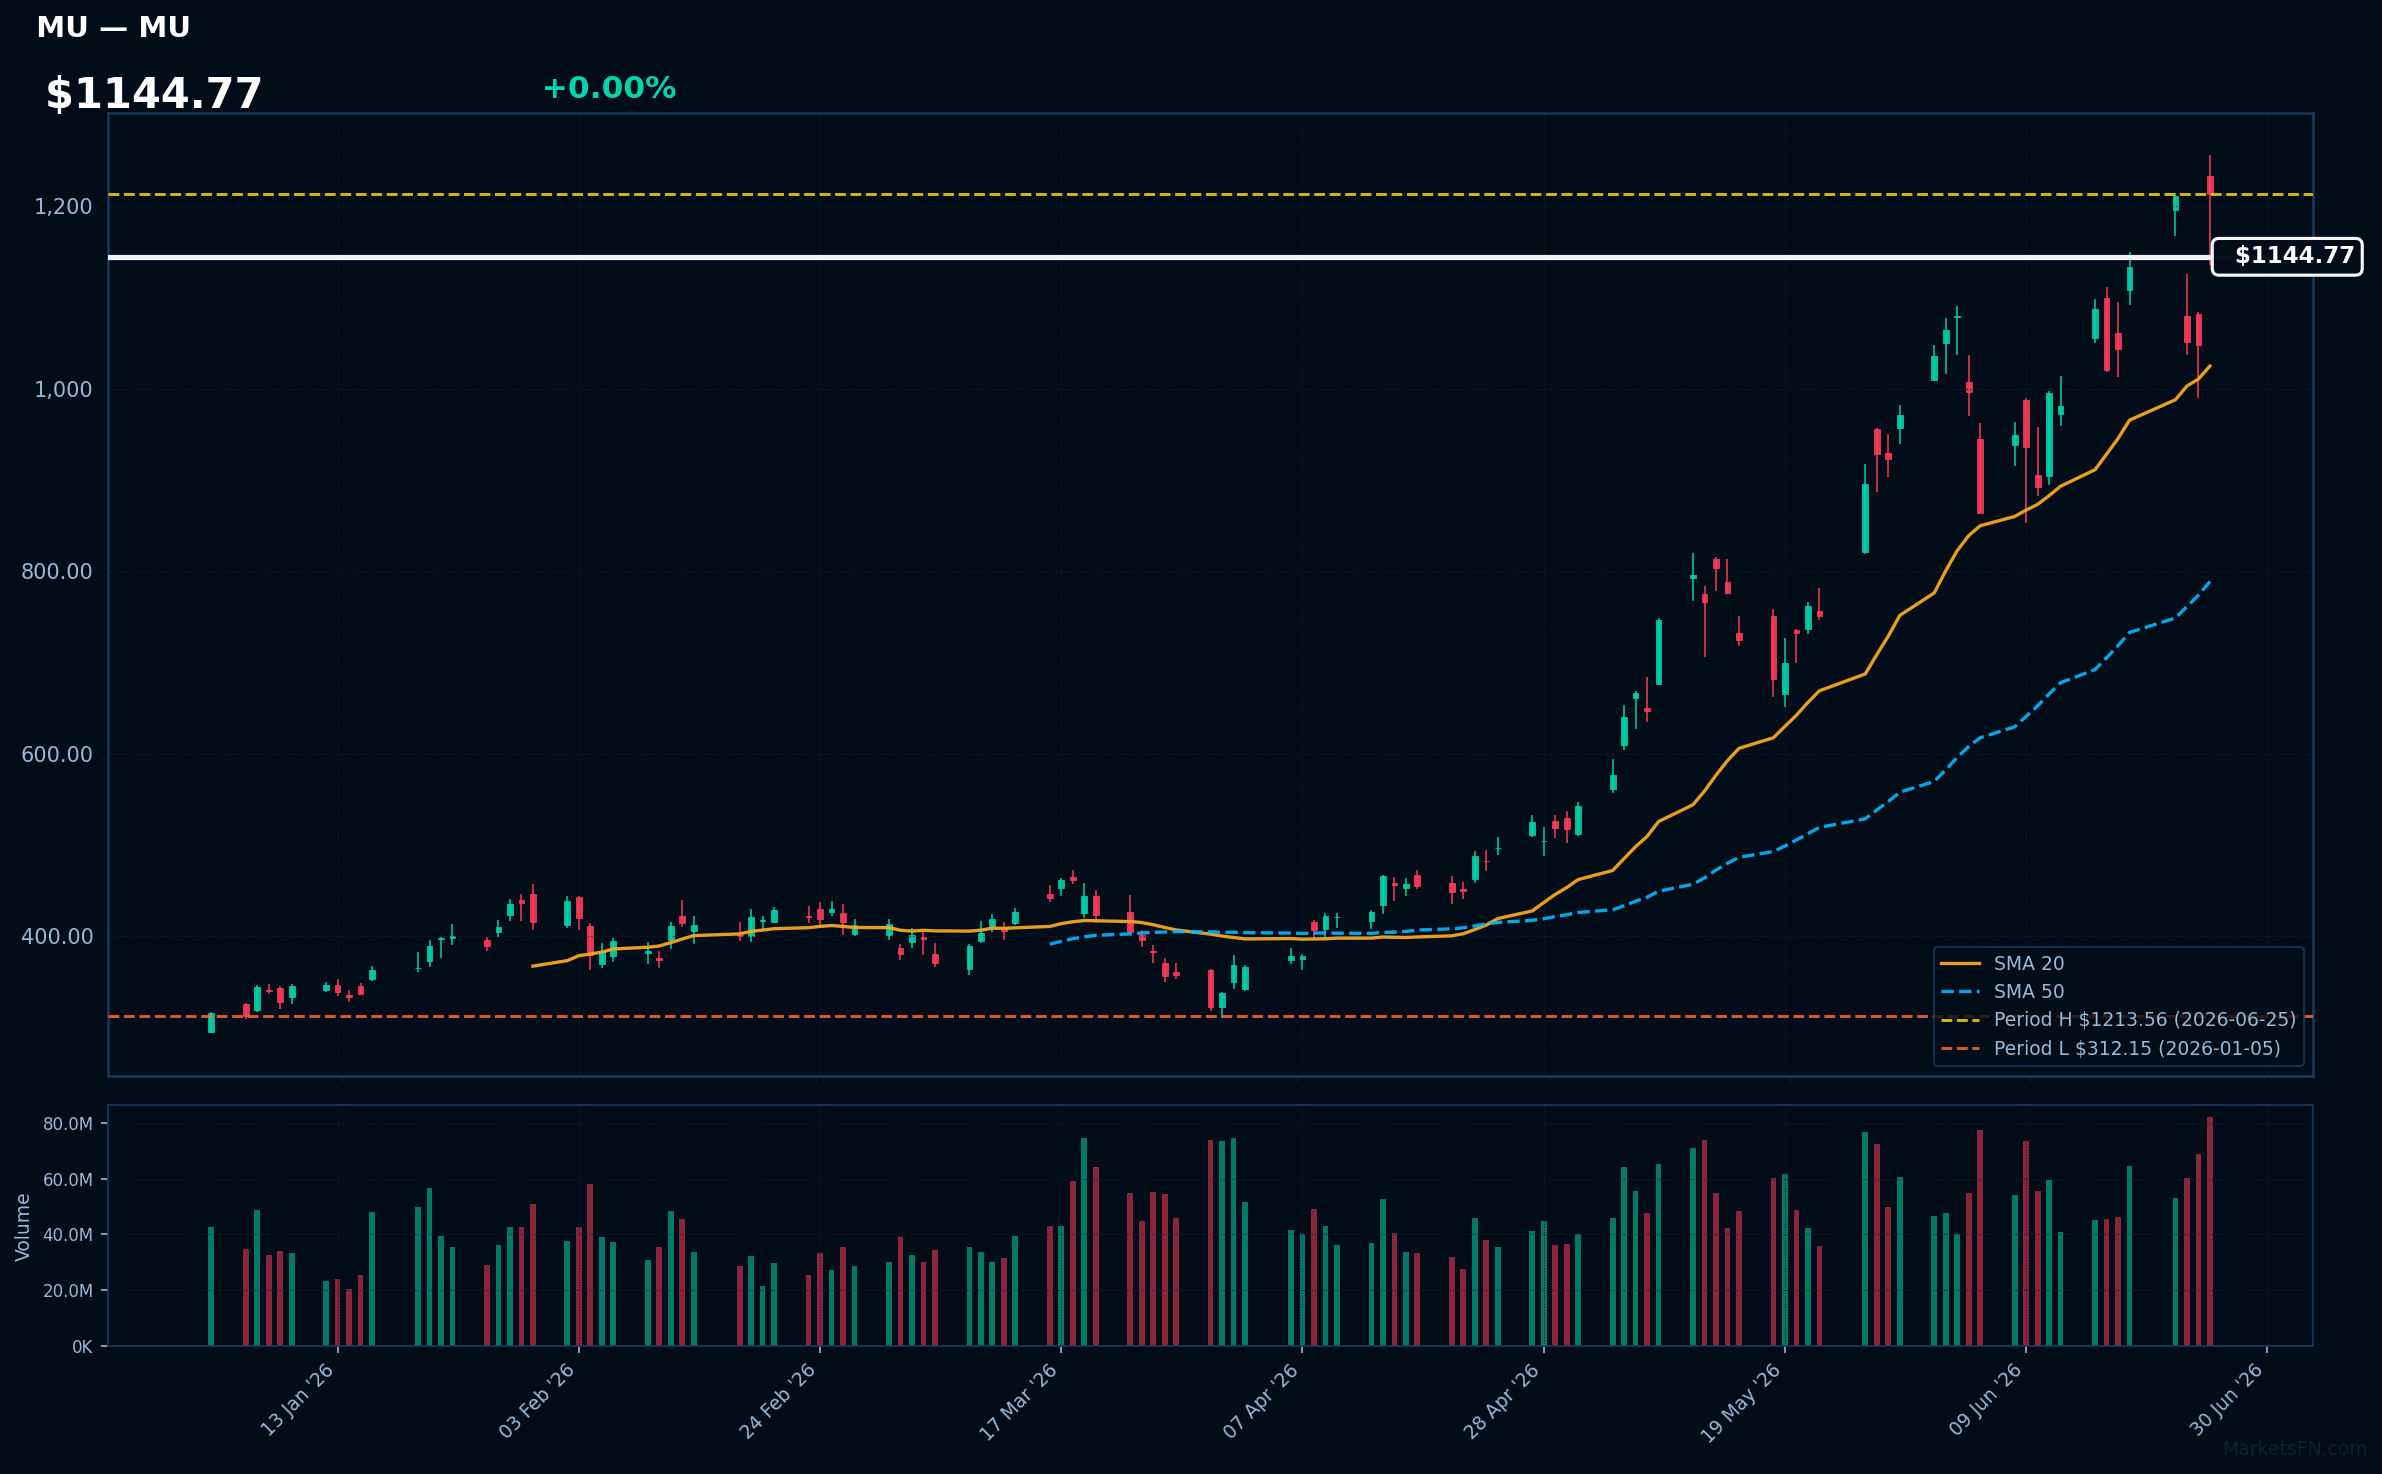
MU | Micron Technology Inc | Technology | Price Last: $1213.56 | % Realized: +284.74% | RSI: 59.7 | % above MA200: +184.9% | Trend: Above MA20, MA50, MA200
Micron Technology Inc is a leading memory and storage solutions provider, manufacturing DRAM and NAND products crucial for AI, cloud computing, and data center growth, making it a key player in the tech industry's infrastructure.
Micron's current technical situation indicates sustained uptrend momentum with price > MA20 > MA50 > MA200, RSI(14) at 59.7, and 0.0% below its 2026 YTD high, suggesting potential for further breakout.
Related headlines
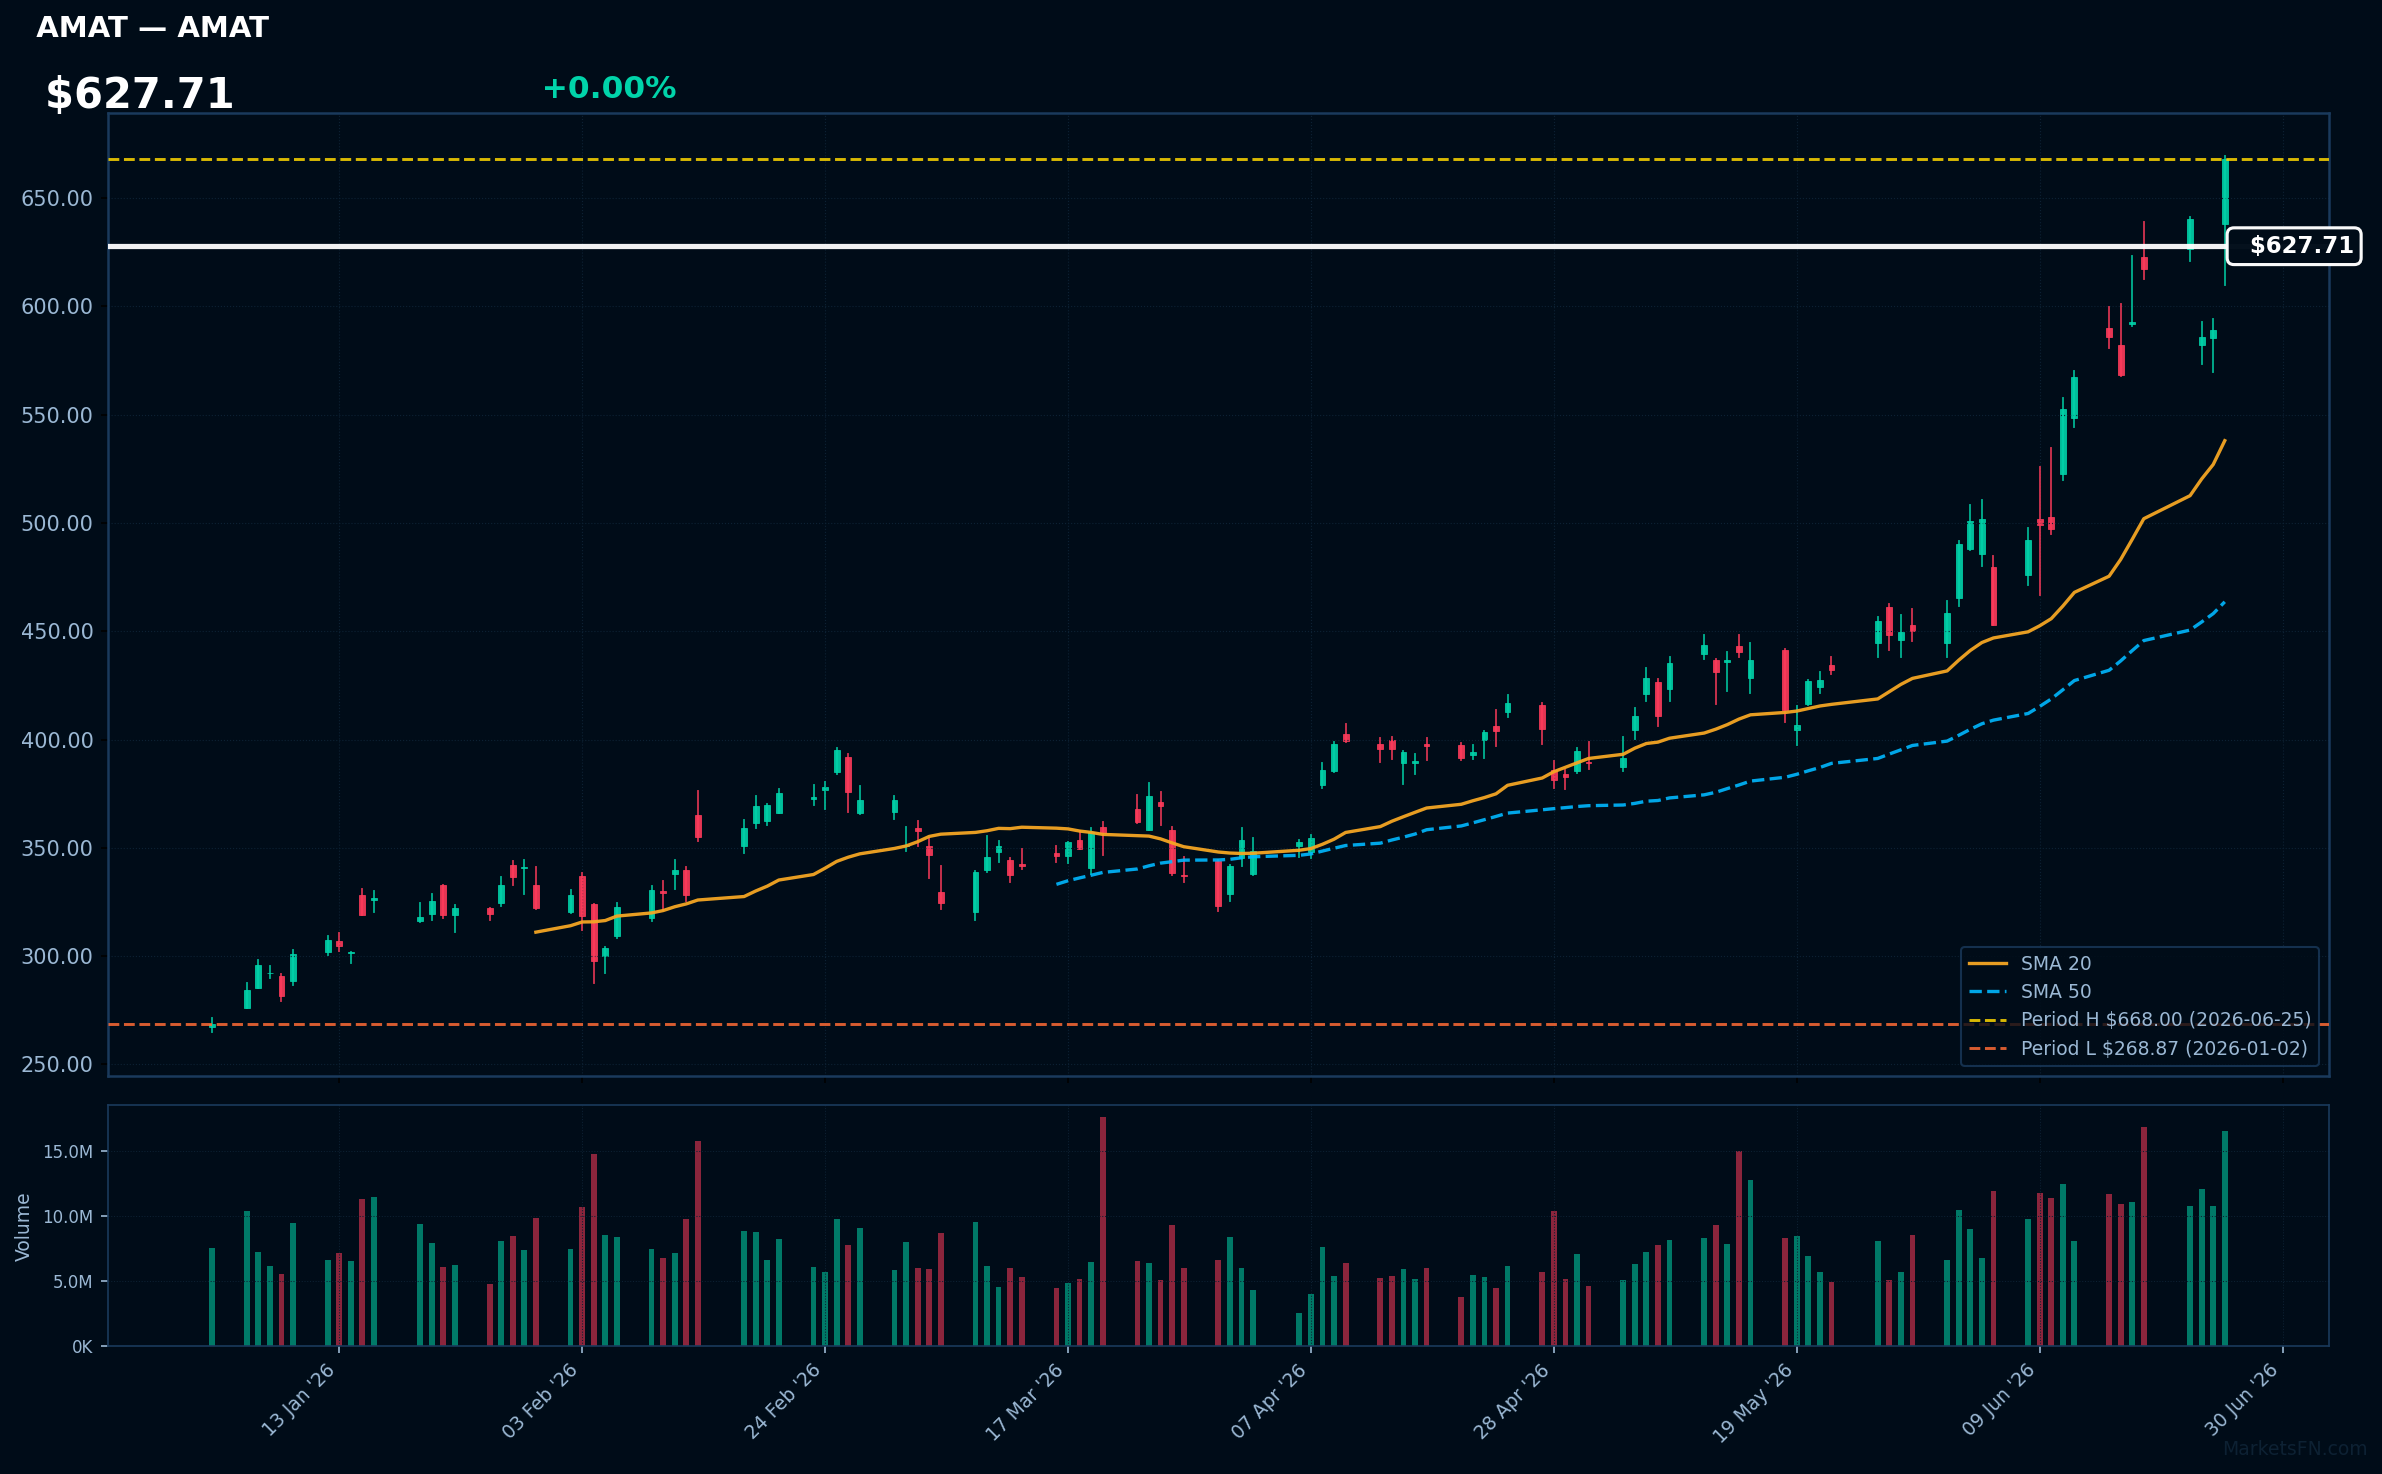
AMAT | Applied Materials Inc | Technology | Price Last: $668.00 | % Realized: +148.45% | RSI: 64.1 | % above MA200: +102.8% | Trend: Above MA20, MA50, MA200
Applied Materials Inc is a leading manufacturer of semiconductor fabrication equipment, providing critical technology for chip production. Investors should care because the company's innovations directly impact the advancement of the semiconductor industry, a key driver of technological progress.
The stock exhibits bullish technicals with RSI(14) at 64.1, indicating rising momentum. The MA alignment (price > MA20 > MA50 > MA200) confirms a sustained uptrend. With the stock 0.0% below its 2026 YTD high, it nears a potential breakout level.
Related headlines
- Why Did MU, AAL, AMAT Stocks Surge To 52-Week Highs?
- After A Large Run, Is Applied Materials Stock A Bet On AI's Future or Yesterday's News?
- Applied Materials Inc. stock outperforms competitors on strong trading day
- Applied Materials Introduces New Systems to Accelerate DRAM and Advanced Packaging for AI Chips
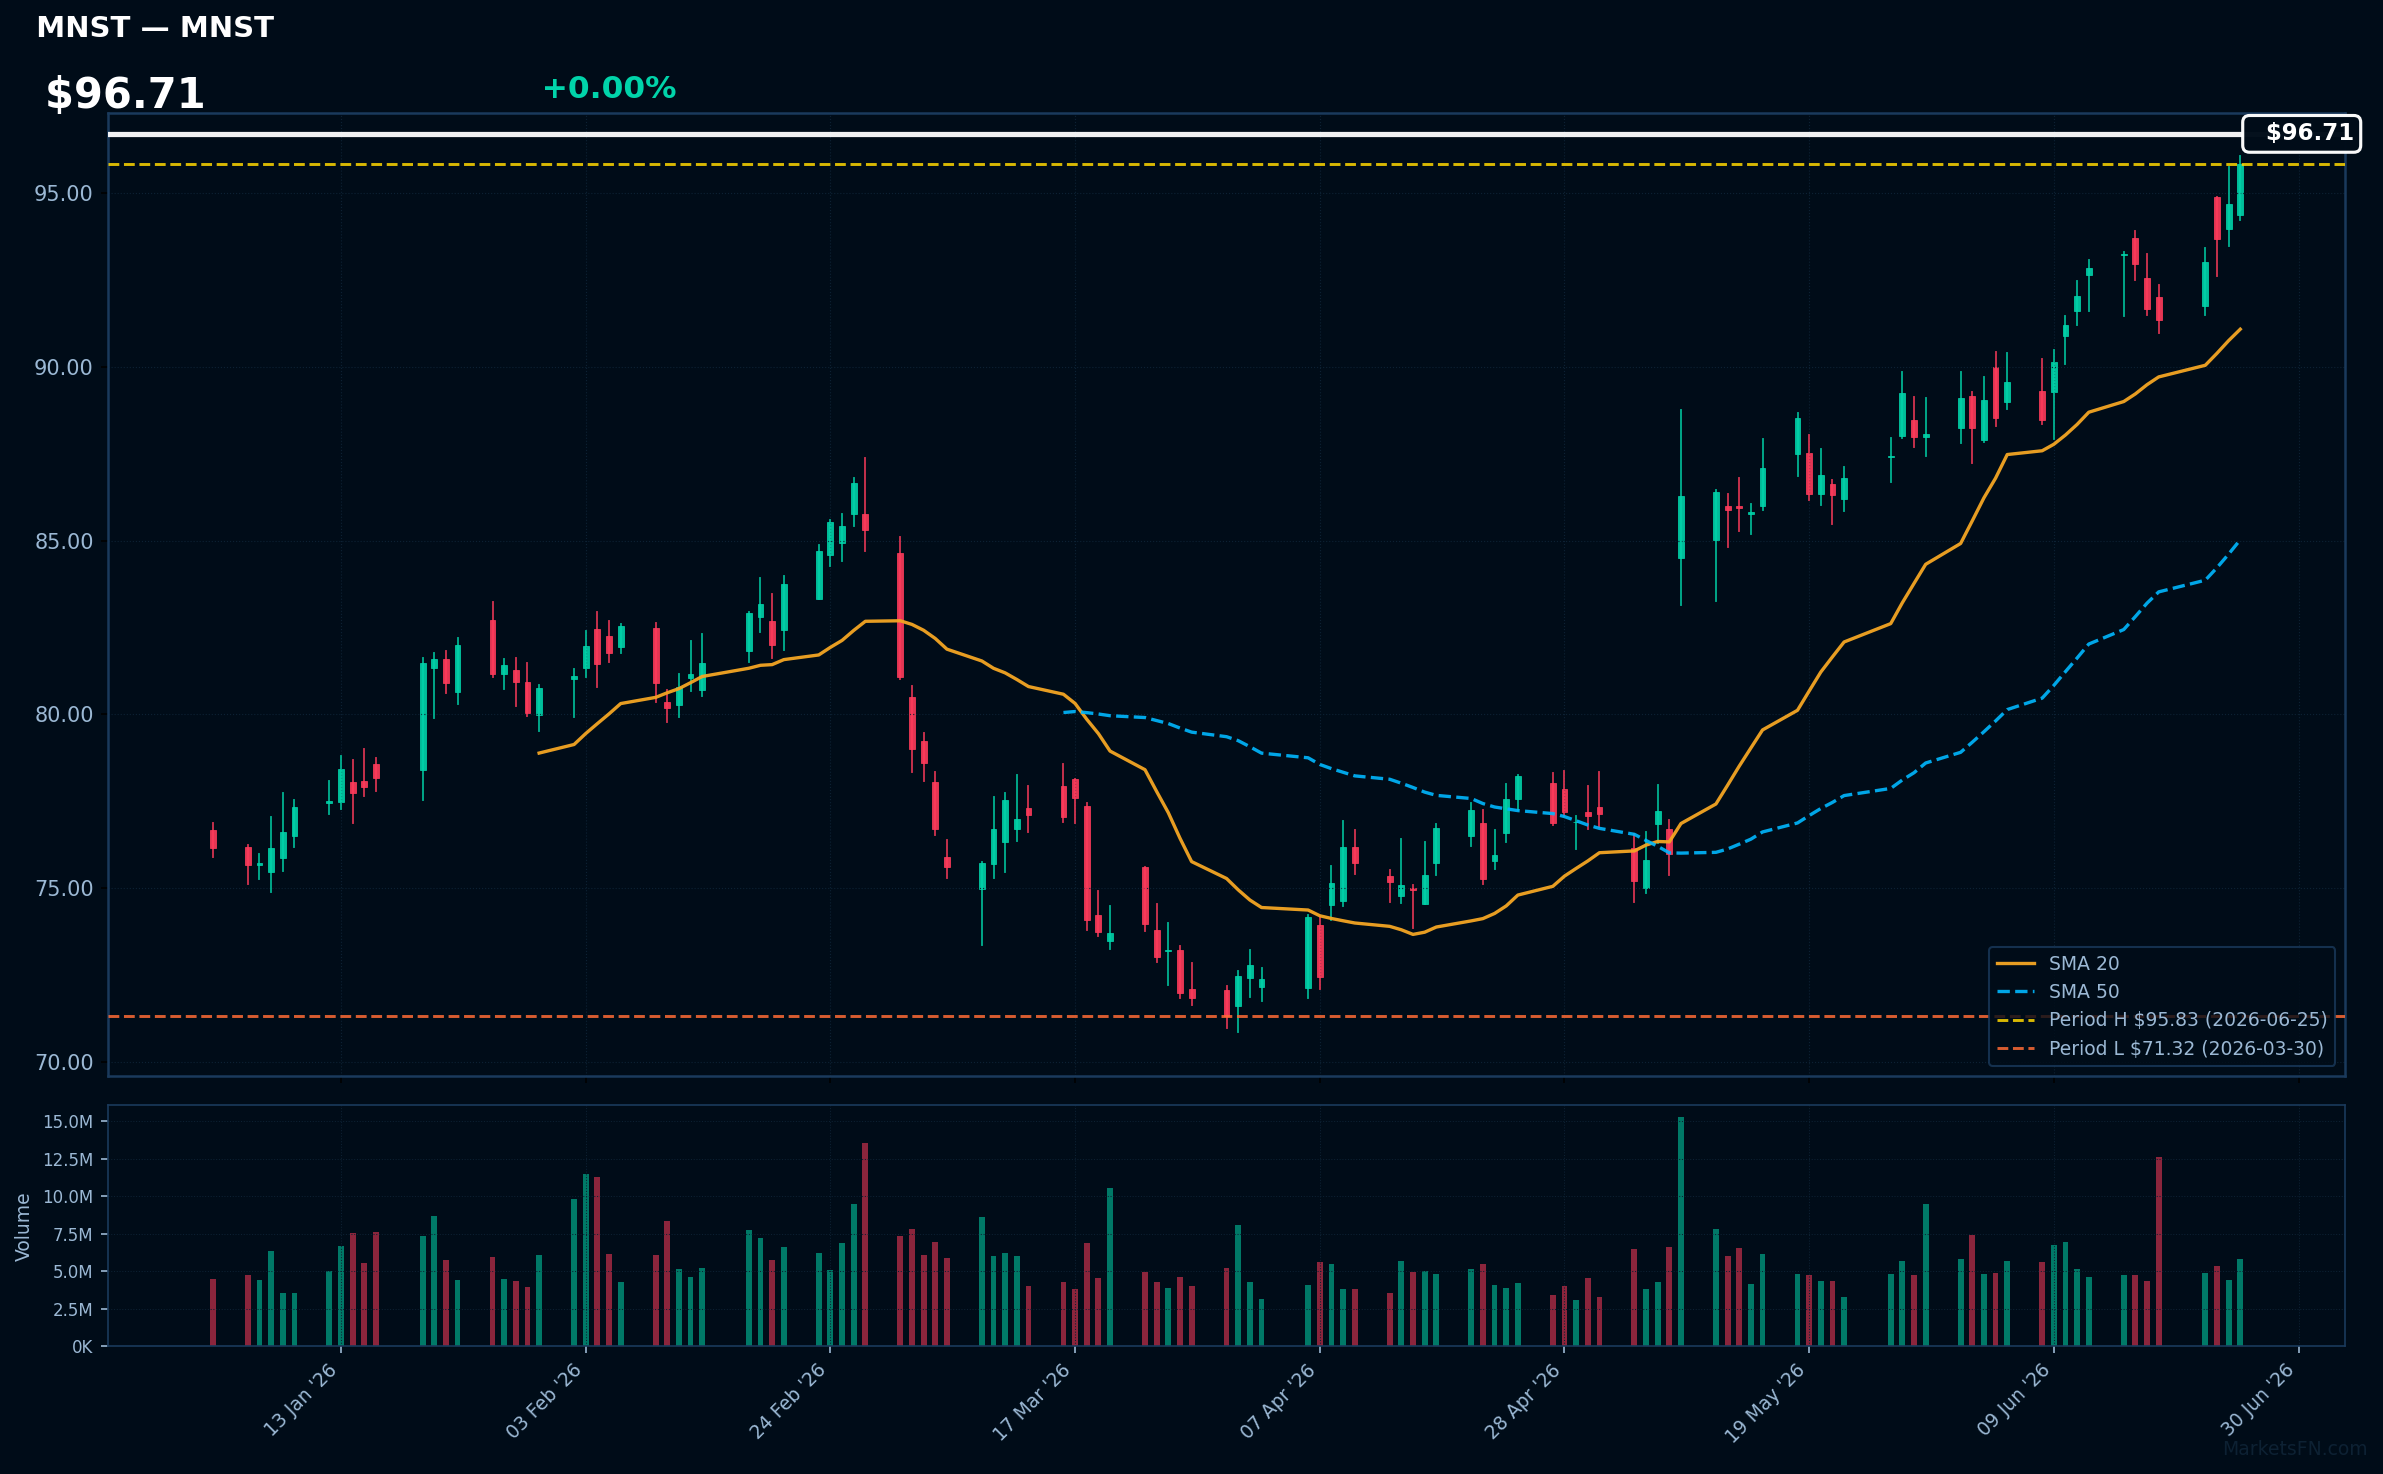
MNST | Monster Beverage Corp | Consumer Defensive | Price Last: $95.83 | % Realized: +25.83% | RSI: 75.3 | % above MA200: +24.6% | Trend: Above MA20, MA50, MA200
Monster Beverage Corp is a leading energy drink manufacturer with a portfolio of brands including Monster Energy. Investors should care due to its strong market presence and growth potential in the energy drink segment.
The stock shows bullish technicals with RSI(14) at 75.3, price > MA20 > MA50 > MA200, and is 0.0% below its 2026 YTD high, indicating strong momentum and potential for a breakout.
Related headlines
- Massive Gap-Up Propels This Monster To Record High. These Clues Point To More Gains Ahead.
- Monster Beverage Announces Participation in dbAccess Global Consumer Conference 2026
- Dow Jones Leader Amazon, AI Stock Quanta, Monster Beverage In Or Near Buy Zones
- See How Institutions Drive Monster Beverage Shares Higher
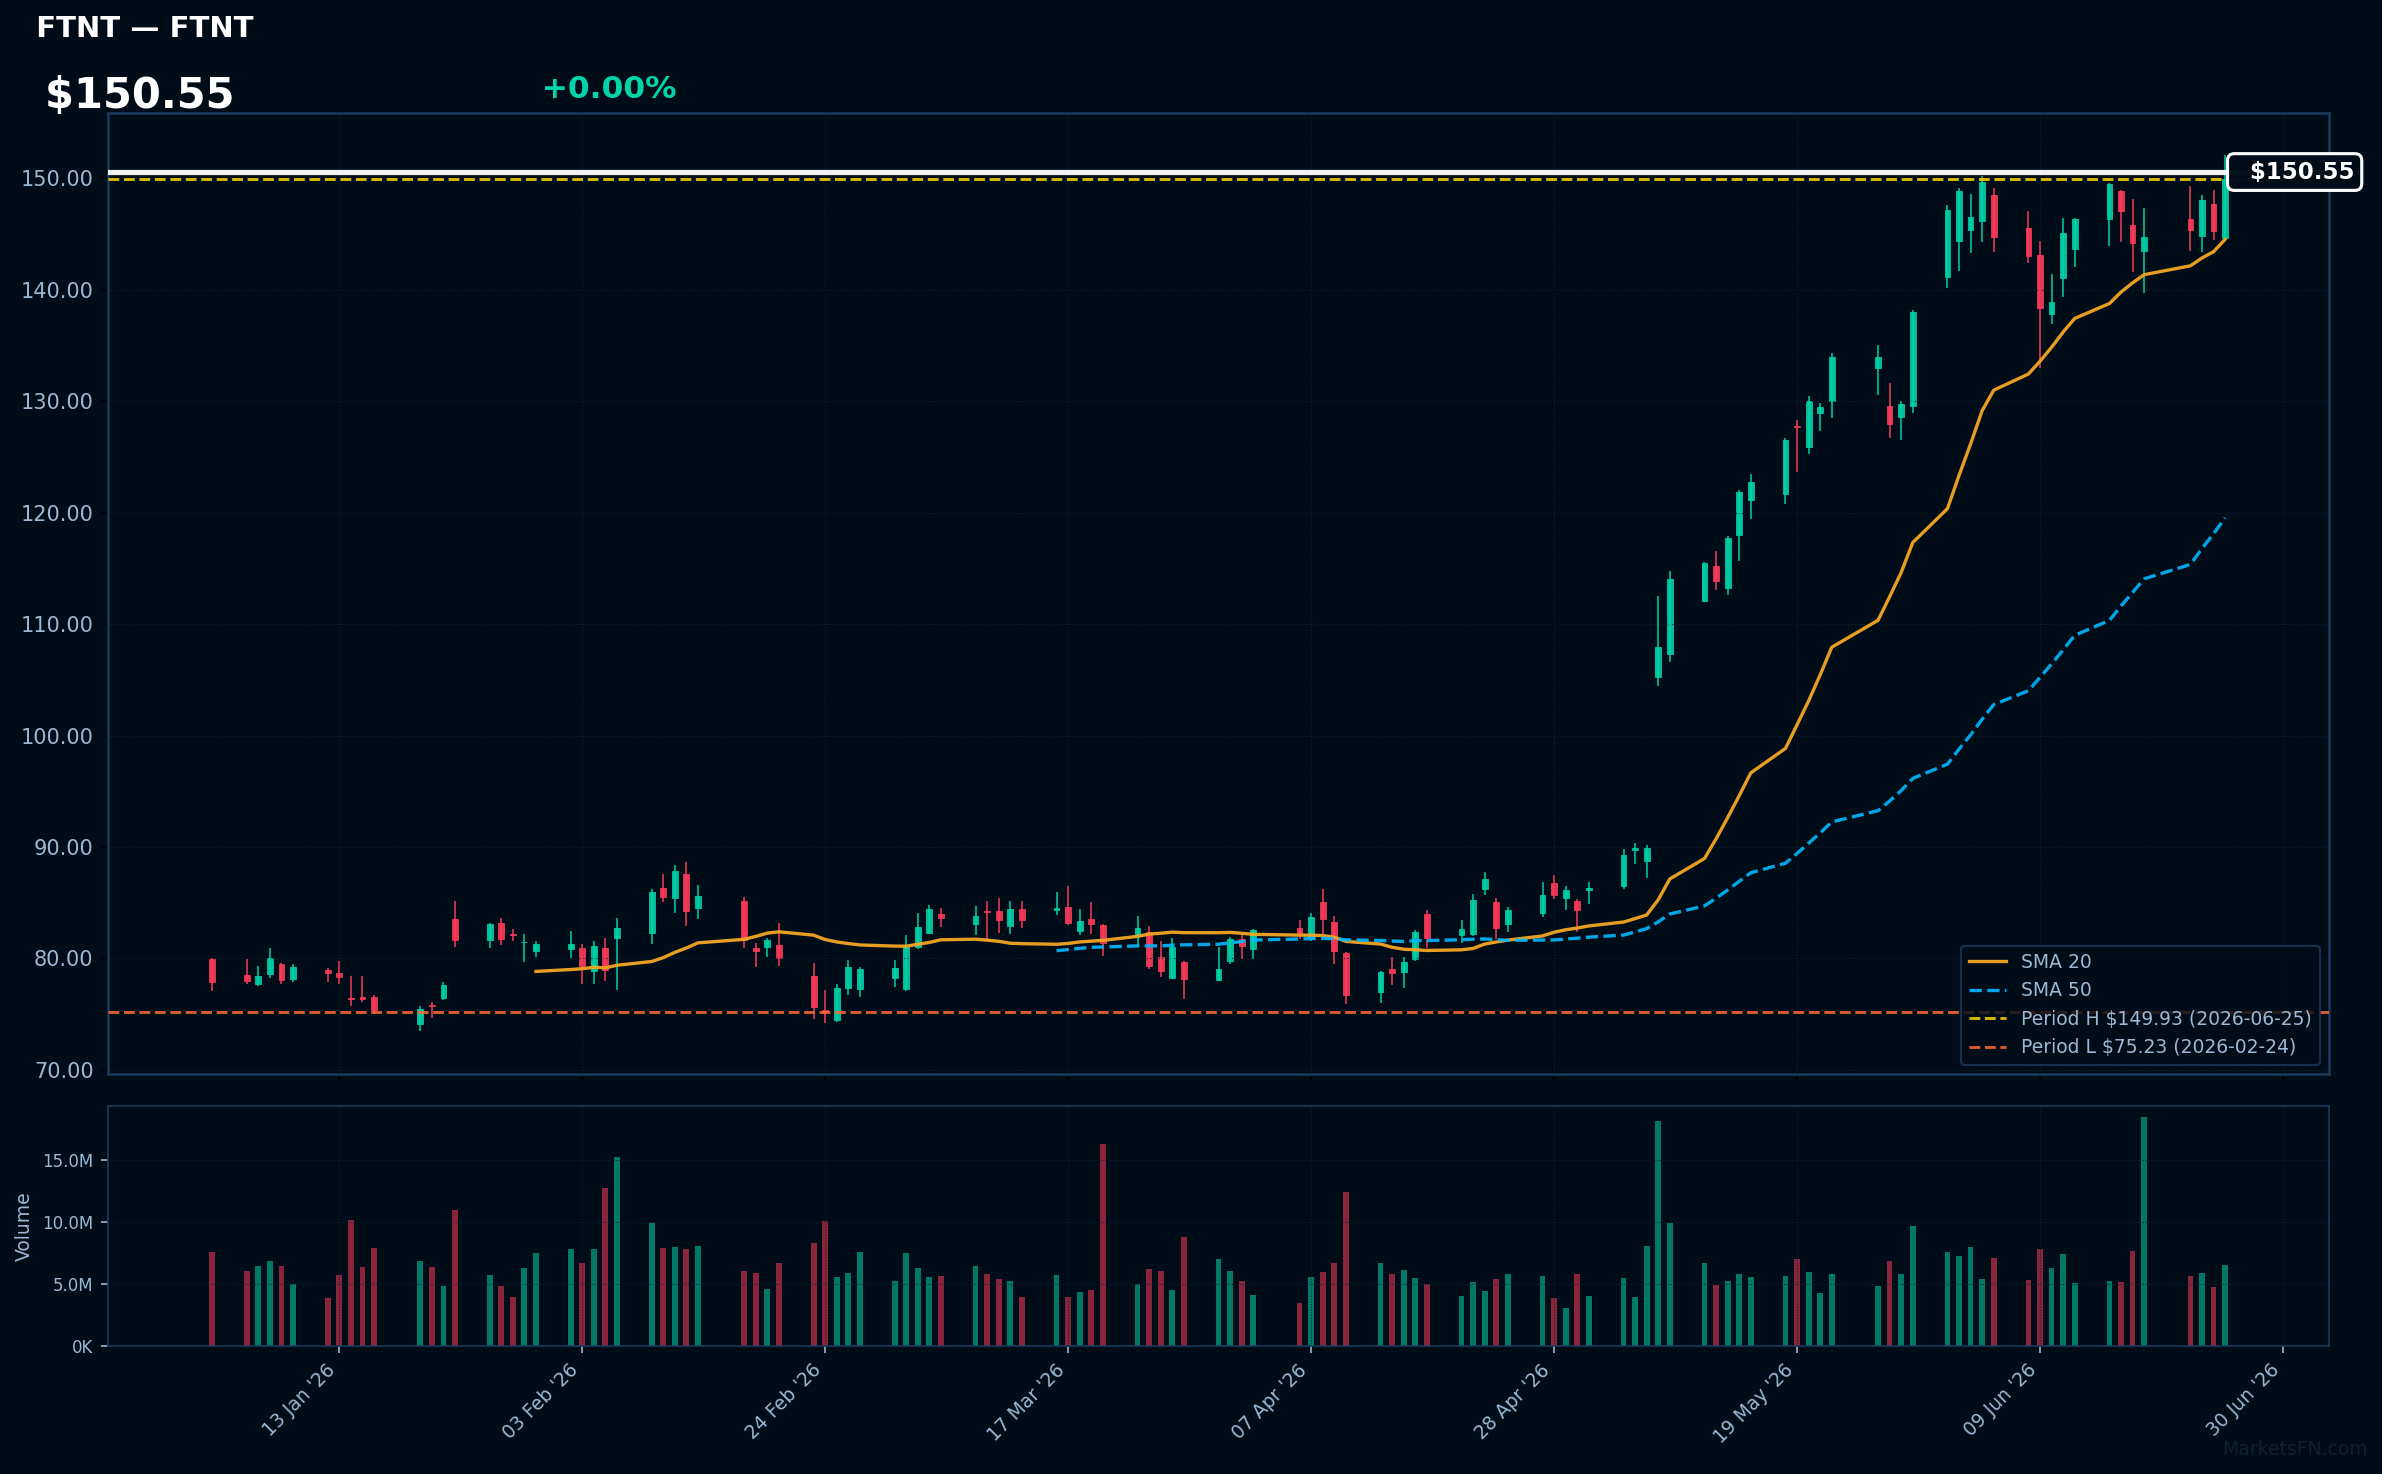
FTNT | Fortinet Inc | Technology | Price Last: $149.93 | % Realized: +92.51% | RSI: 66.9 | % above MA200: +63.6% | Trend: Above MA20, MA50, MA200
Fortinet Inc is a cybersecurity company that provides security solutions such as firewalls and intrusion detection/prevention systems; investors should care because its products protect networks from cyber threats, a growing concern for businesses and organizations.
Fortinet Inc is in a sustained uptrend with price > MA20 > MA50 > MA200, RSI(14) at 66.9, and is 0.0% below its 2026 YTD high, indicating strong momentum with no immediate signs of overbought conditions or reversal.
Related headlines
- Fortinet, IBD Stock Of The Day, Gets Network Firewall Boost From AI Data Centers
- Fortinet Appoints Public Sector Leader and Tech Executive Derek Kan to Its Board of Directors
- Fortinet Launches FortiSOC, a Unified SOC Platform Powered by Agentic AI
- Fortinet Inc. stock outperforms competitors on strong trading day
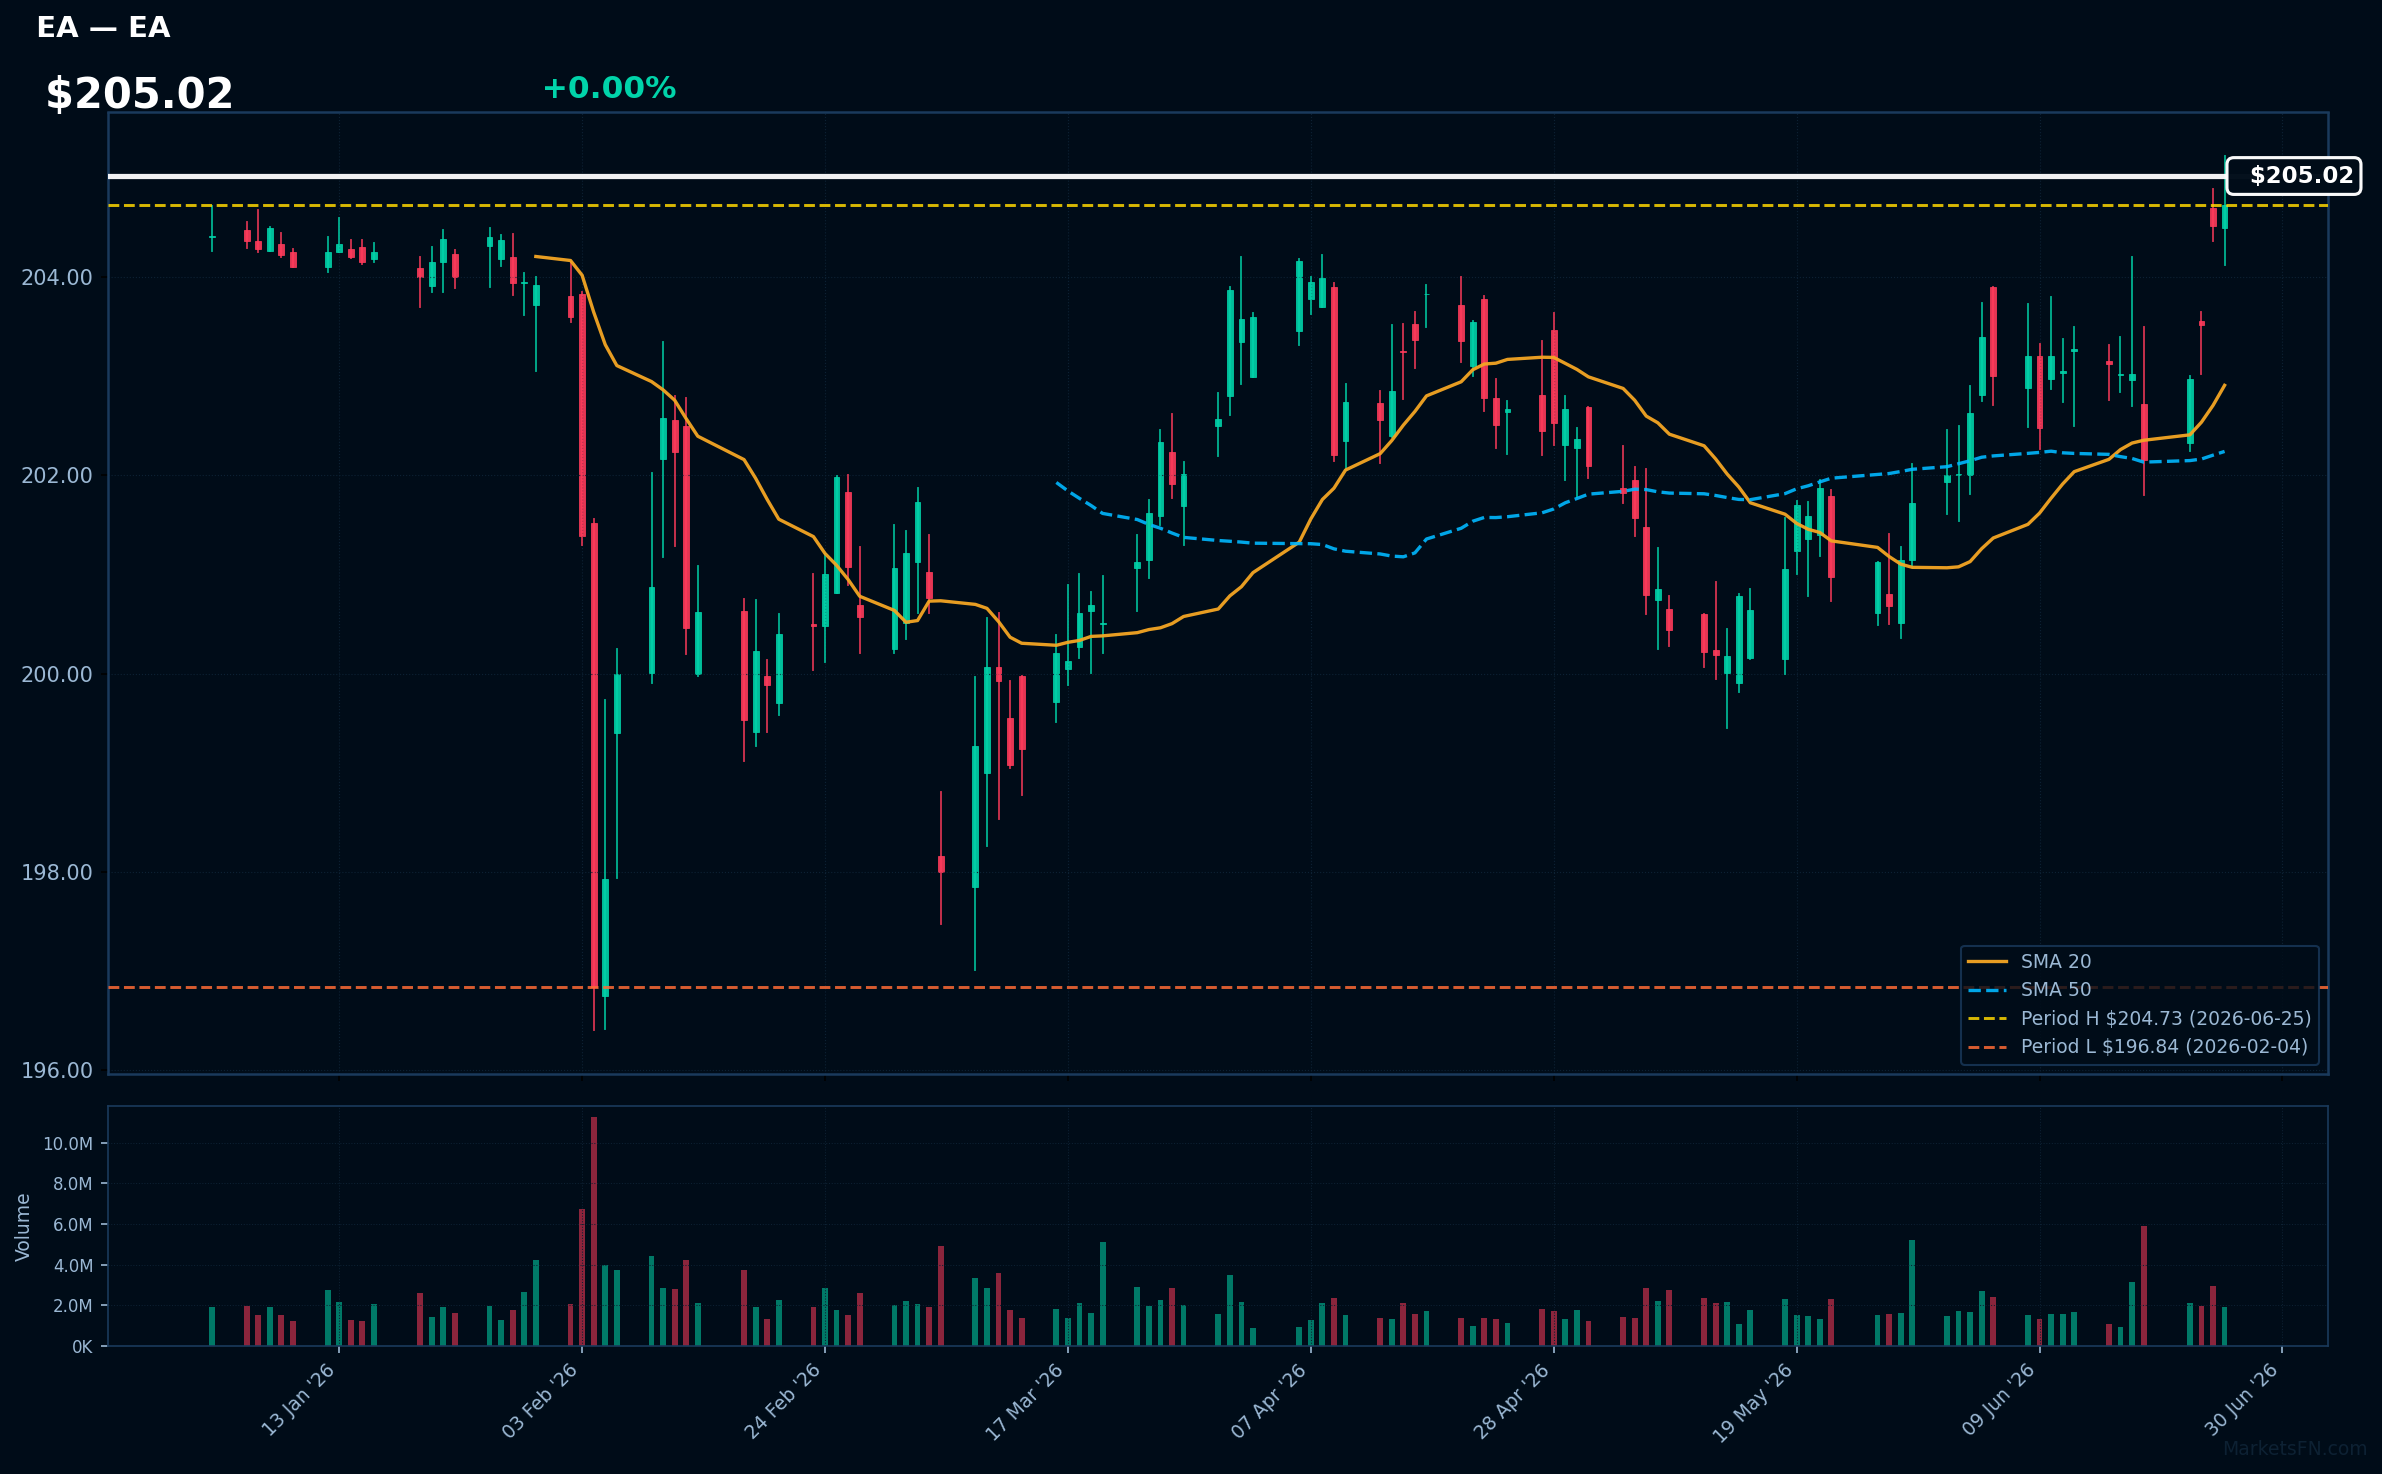
EA | Electronic Arts, Inc | Communication Services | Price Last: $204.73 | % Realized: +0.16% | RSI: 68.7 | % above MA200: +2.3% | Trend: Above MA20, MA50, MA200
Electronic Arts, Inc (EA) is a leading interactive entertainment software company that develops and publishes games such as FIFA, Madden NFL, and The Sims. Investors should care about its performance in the gaming market and its ability to innovate and release successful titles.
EA's current technical situation indicates momentum, with an RSI(14) of 68.7 and a bullish MA alignment (price > MA20 > MA50 > MA200). The stock is 0.0% below its 2026 YTD high, suggesting a potential breakout.
Related headlines
- EA SPORTS UFC 6 Launches Worldwide Today, Inviting Players Everywhere to Fight Their Fight
- Saudis seek EU approval for $55 billion EA deal, decision by July 22
- Oak-Eagle AcquireCo, Inc. Announces Extension of the Expiration Time and Settlement Date for the Previously Announced Tender Offers and Consent Solicitations for Any and All of Electronic Arts Inc.'s 1.850% Senior Notes Due 2031 and 2.950% Senior Notes Due 2051
- Electronic Arts Unveils New Advertising Platform for In-Game Brand Activations (EA)
📉 Nearest to 2026 Low
Sectors represented: Technology (3), Communication Services (1), Consumer Cyclical (1)
| Ticker | Company | Sector | Price Last | % Realized | 2026 YTD Low Date | RSI | % above MA200 | Trend |
|---|---|---|---|---|---|---|---|---|
| MSFT | Microsoft Corporation | Technology | $352.83 | -25.40% | 2026-06-25 | 33.6 | -21.2% | Below MA20, MA50, MA200 |
| NFLX | Netflix Inc | Communication Services | $70.90 | -22.08% | 2026-06-25 | 29.7 | -26.9% | Below MA20, MA50, MA200 |
| PLTR | Palantir Technologies Inc | Technology | $107.27 | -36.10% | 2026-06-25 | 31.0 | -32.5% | Below MA20, MA50, MA200 |
| INTU | Intuit Inc | Technology | $255.07 | -59.48% | 2026-06-25 | 35.5 | -50.3% | Below MA20, MA50, MA200 |
| PDD | PDD Holdings Inc ADR | Consumer Cyclical | $73.30 | -36.67% | 2026-06-25 | 23.9 | -33.0% | Below MA20, MA50, MA200 |
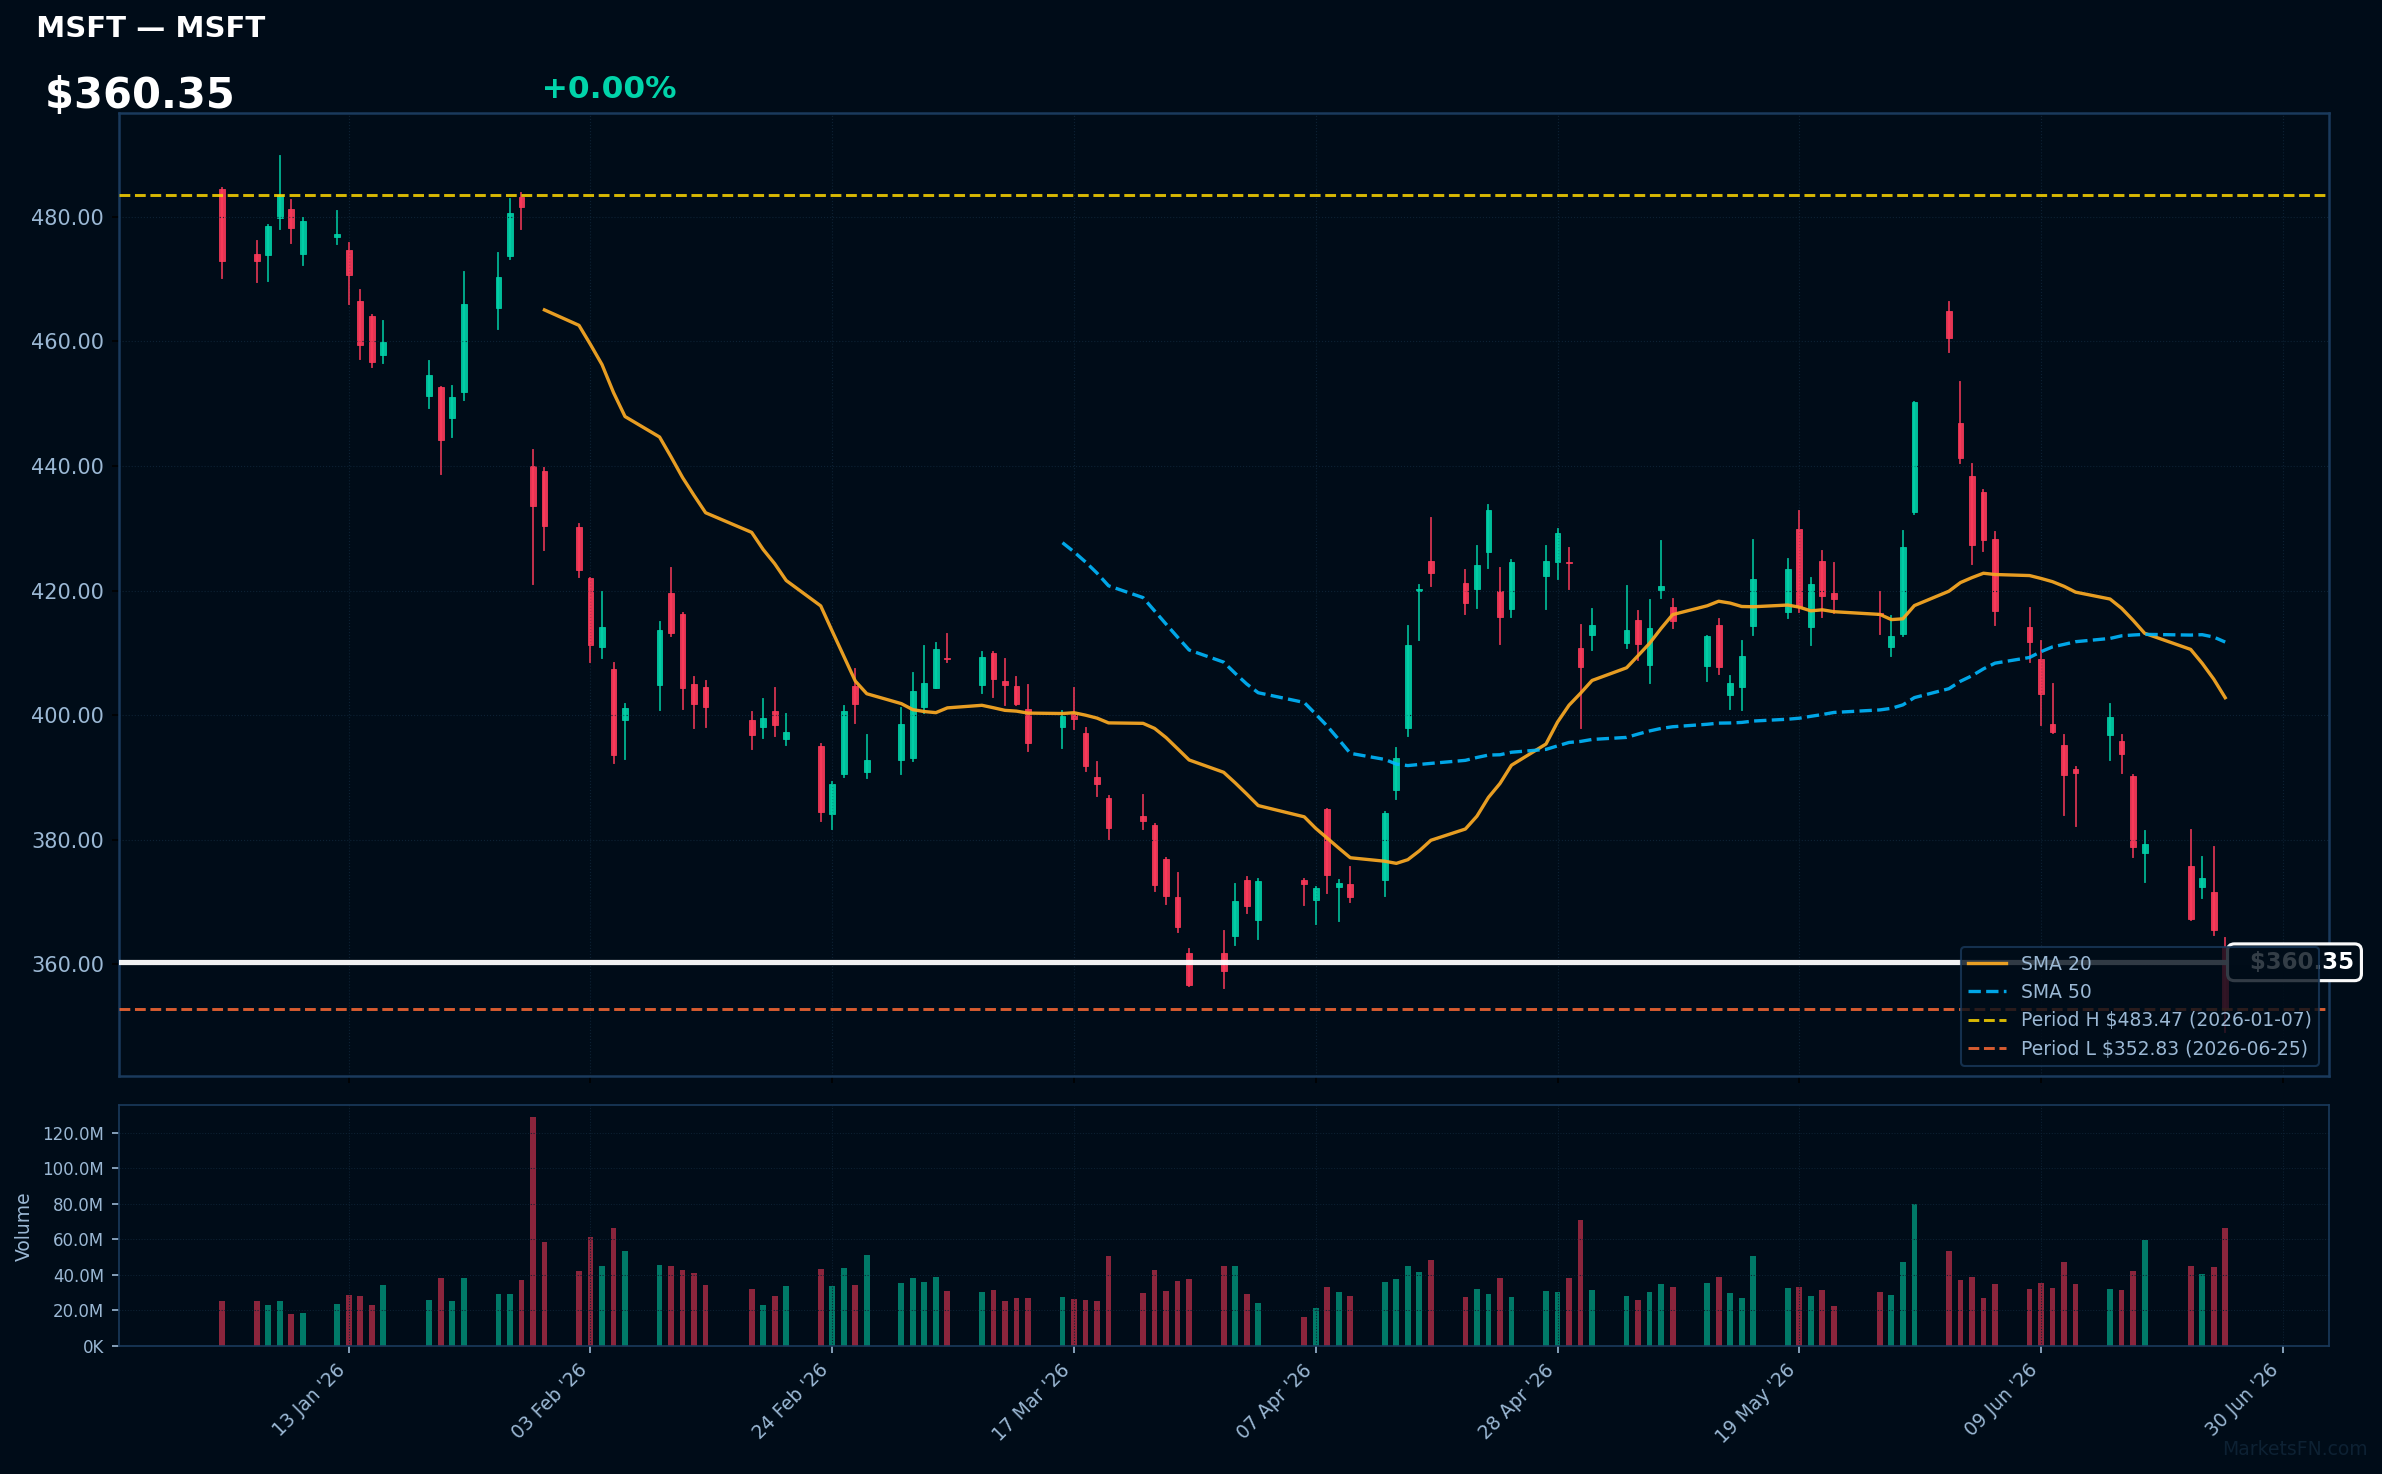
MSFT | Microsoft Corporation | Technology | Price Last: $352.83 | % Realized: -25.40% | RSI: 33.6 | % above MA200: -21.2% | Trend: Below MA20, MA50, MA200
Microsoft Corporation is a technology company that develops, licenses, and supports software, hardware, and services, including Windows, Office, Azure, and Xbox. Investors care about its dominance in productivity software and cloud computing, driving revenue growth and profitability.
Microsoft's current technical situation is bearish, with an RSI(14) of 33.6 indicating oversold conditions, and a sustained downtrend as price ($360.35) remains below MA20, MA50, and MA200. The stock is testing major support at its 2026 YTD low.
Related headlines
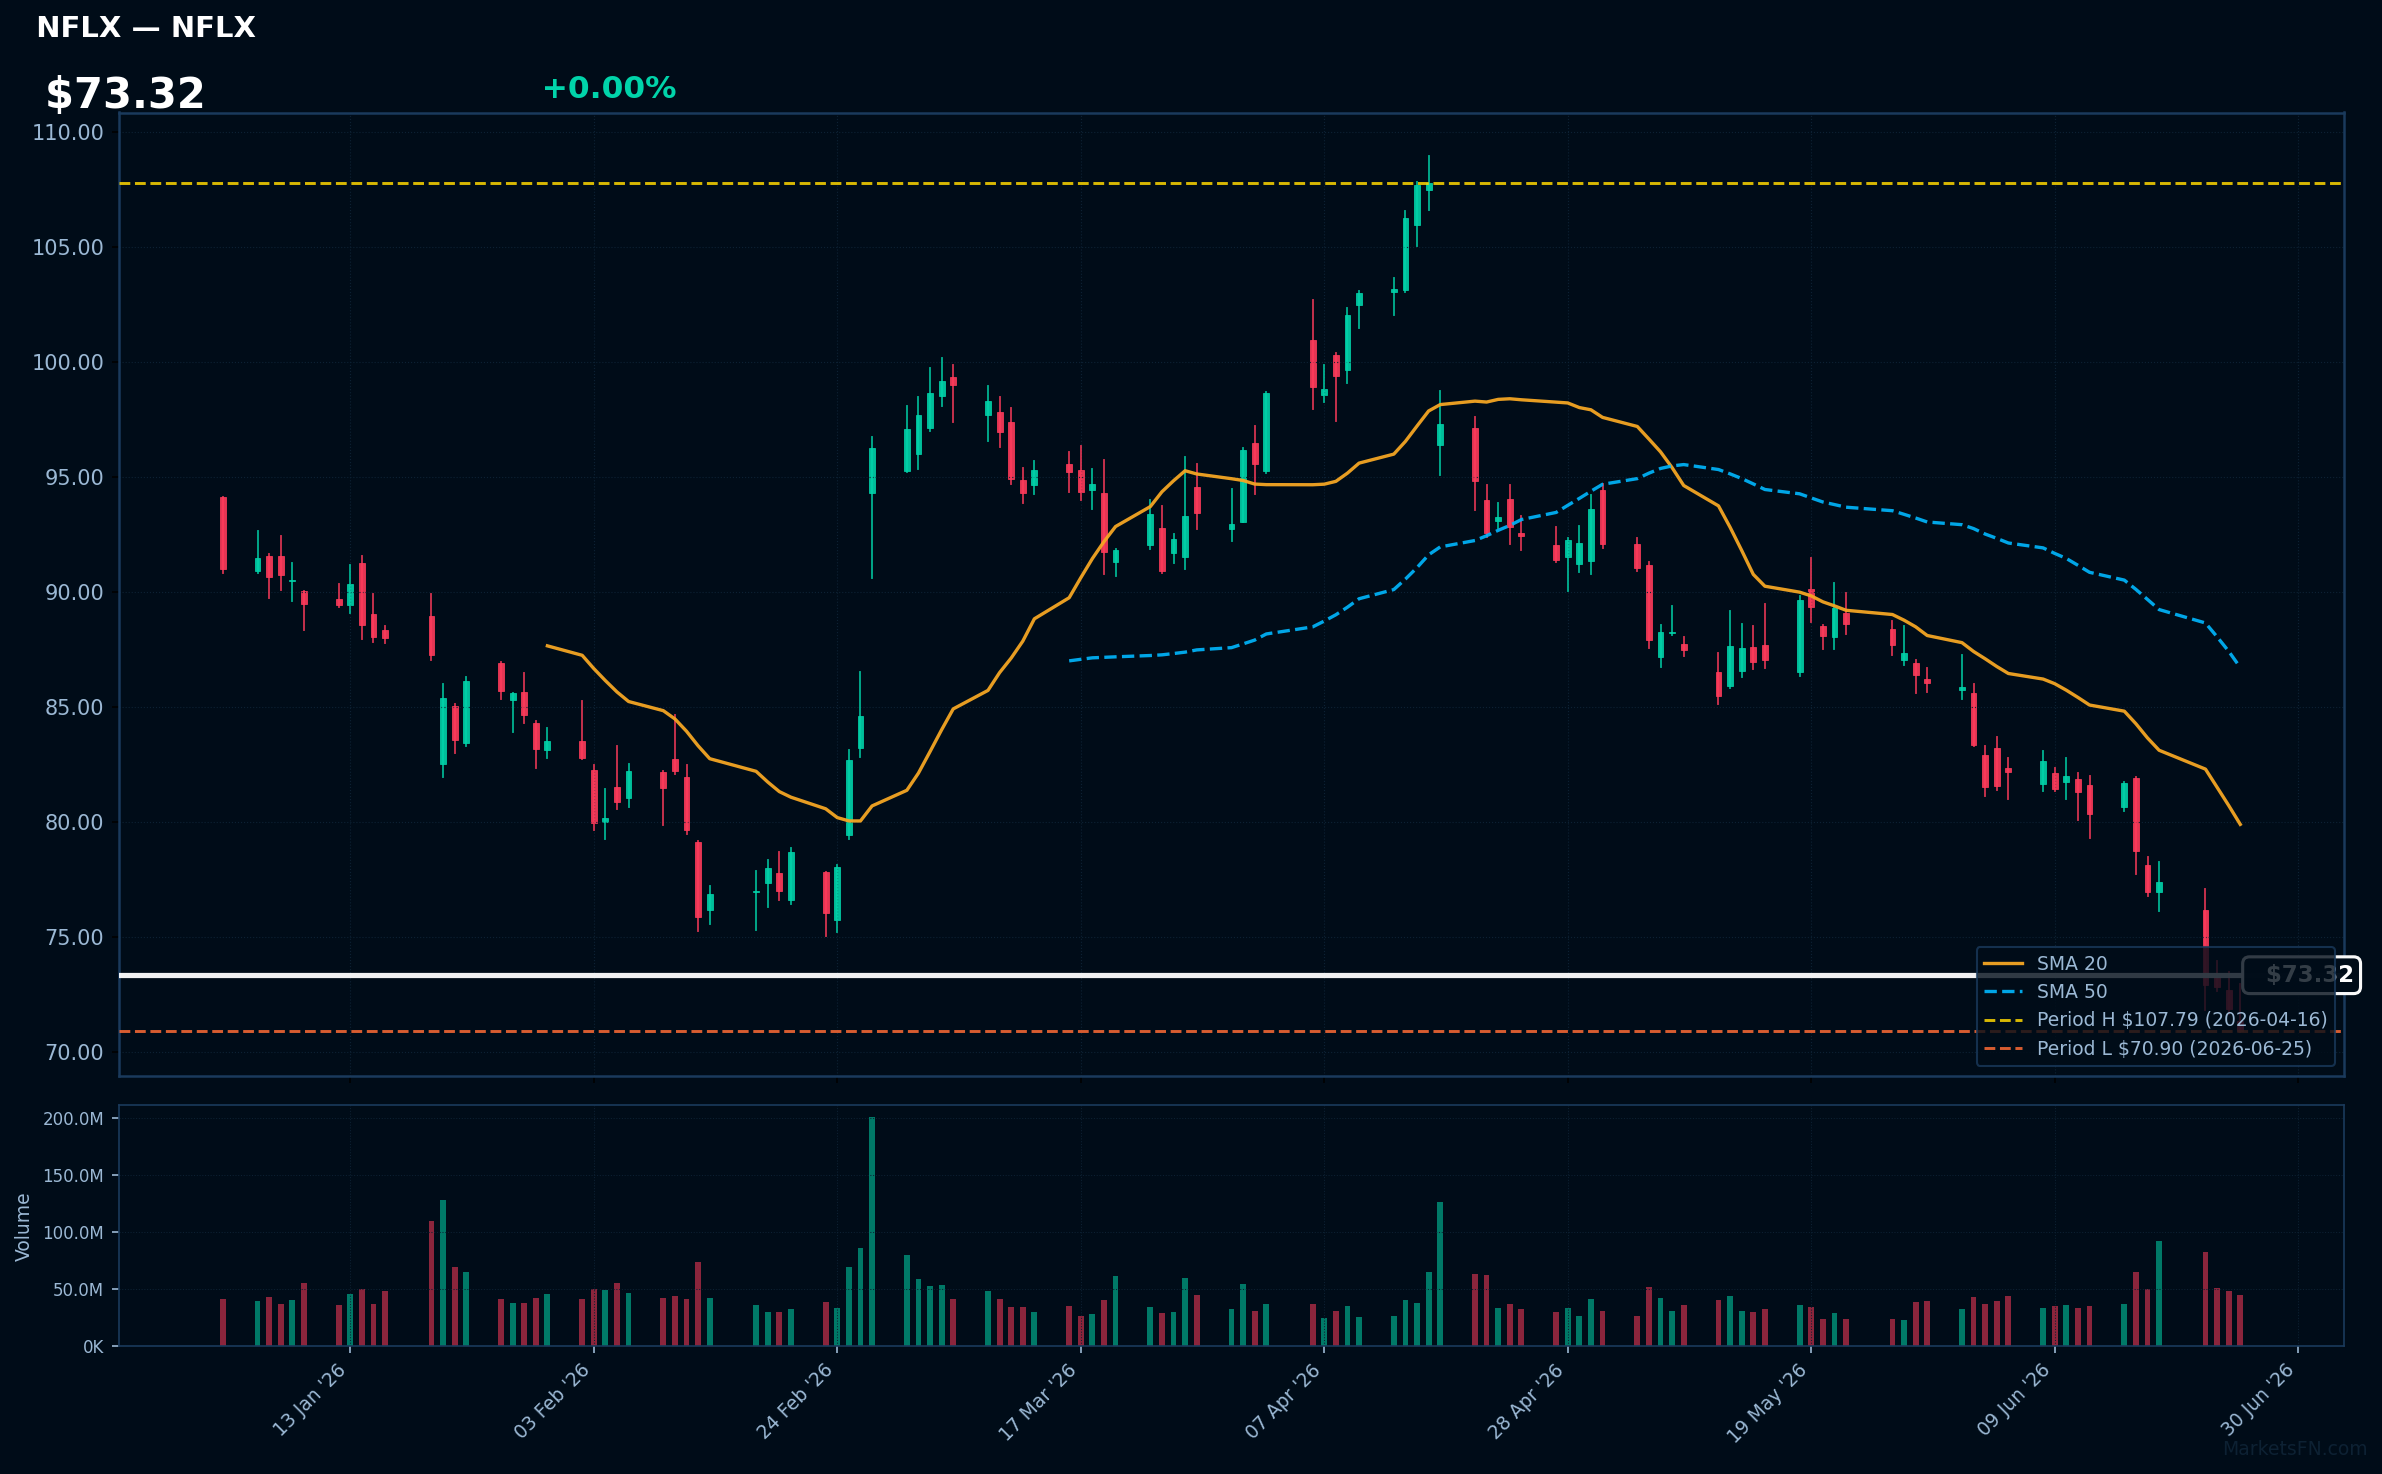
NFLX | Netflix Inc | Communication Services | Price Last: $70.90 | % Realized: -22.08% | RSI: 29.7 | % above MA200: -26.9% | Trend: Below MA20, MA50, MA200
Netflix Inc is a global streaming entertainment service offering a wide variety of TV series, documentaries, and feature films. Investors should care because its subscriber growth and content strategy drive revenue, influencing its stock performance.
NFLX is in a sustained downtrend with price ($73.32) below MA20, MA50, and MA200. The RSI(14) is 29.7, nearing oversold territory. It's testing major support at its 2026 YTD low, having fallen 22.1% YTD, indicating a potential warning sign.
Related headlines
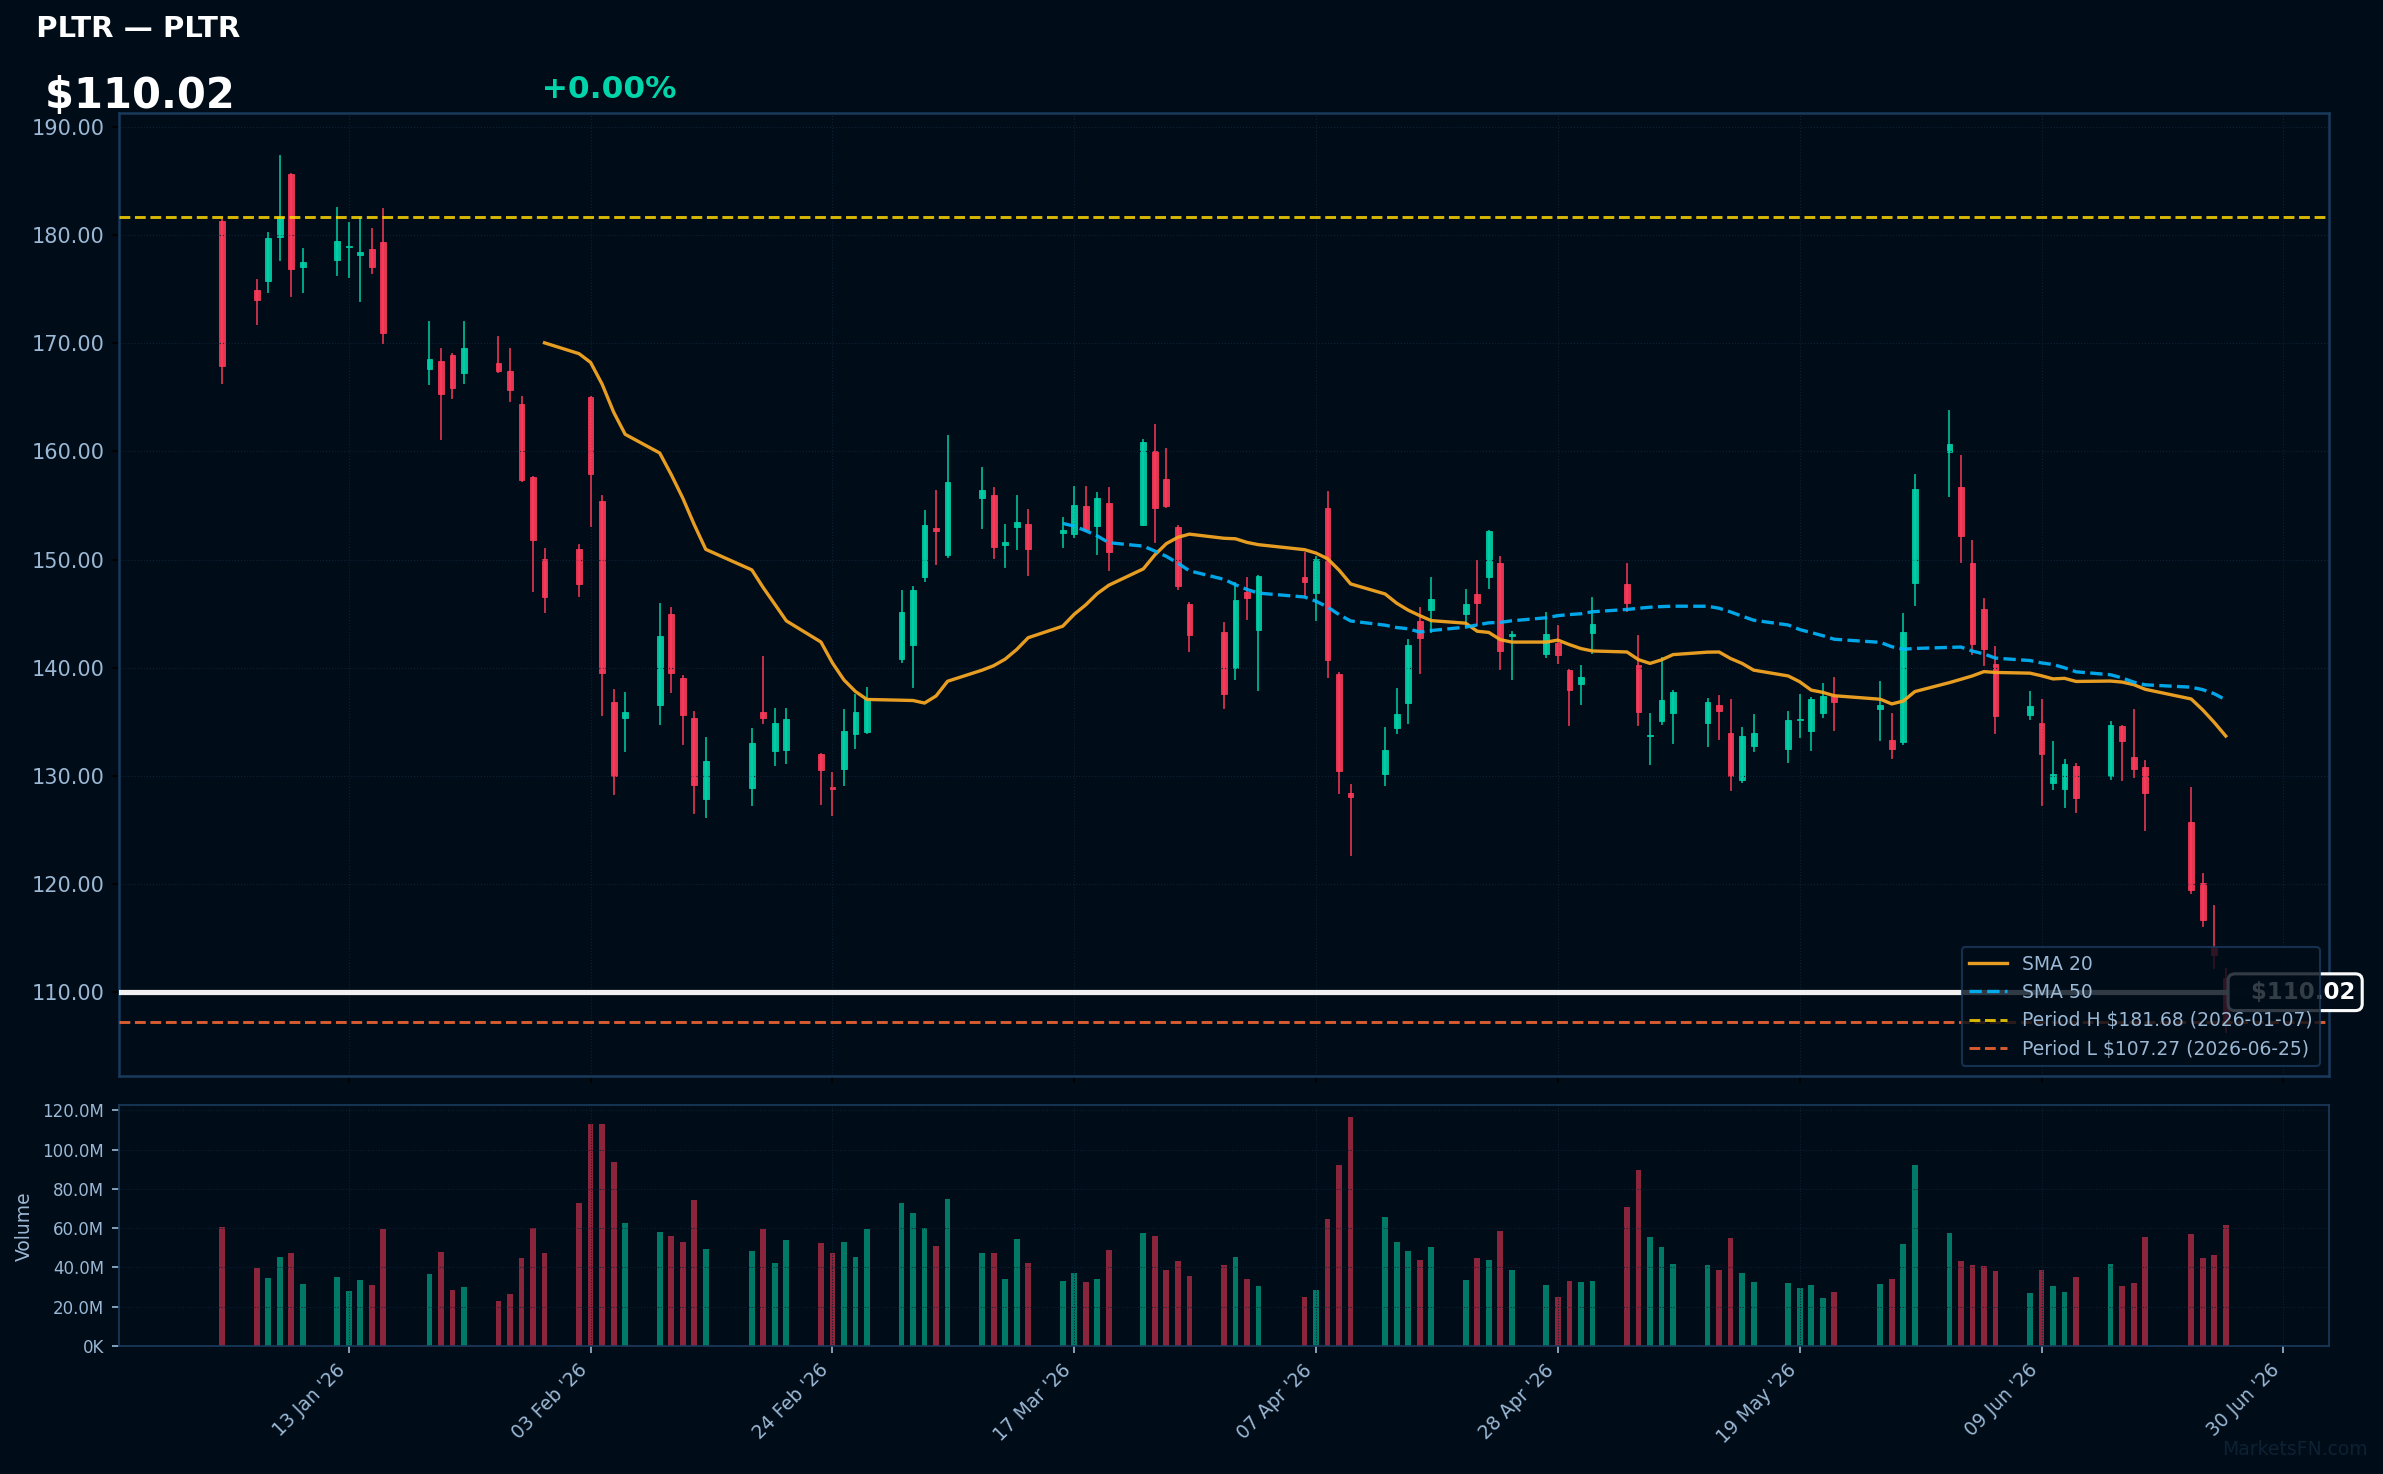
PLTR | Palantir Technologies Inc | Technology | Price Last: $107.27 | % Realized: -36.10% | RSI: 31.0 | % above MA200: -32.5% | Trend: Below MA20, MA50, MA200
Palantir Technologies Inc provides data integration and analytics software to governments and corporations, enabling data-driven decision-making; investors should care about its ability to capitalize on the growing demand for big data analytics and its government contracts.
PLTR's technical situation indicates a sustained downtrend with price ($110.02) below MA20, MA50, and MA200; RSI(14) at 31.0 suggests oversold conditions, and being 0.0% above its 2026 YTD low tests major support, potentially a warning sign.
Related headlines
- Palantir Stock Could Snap Its 7-Day Losing Streak. It's Been a Rough Month.
- Why Did MSFT, PLTR, MSTR Stocks Plunge To 52-Week Lows Today?
- Michael Burry Buys Long-Dated Microsoft Calls, Adds To JD And Adobe Trims Palantir Short
- Why Palantir's stock is having its worst month in years - even in the midst of an AI boom
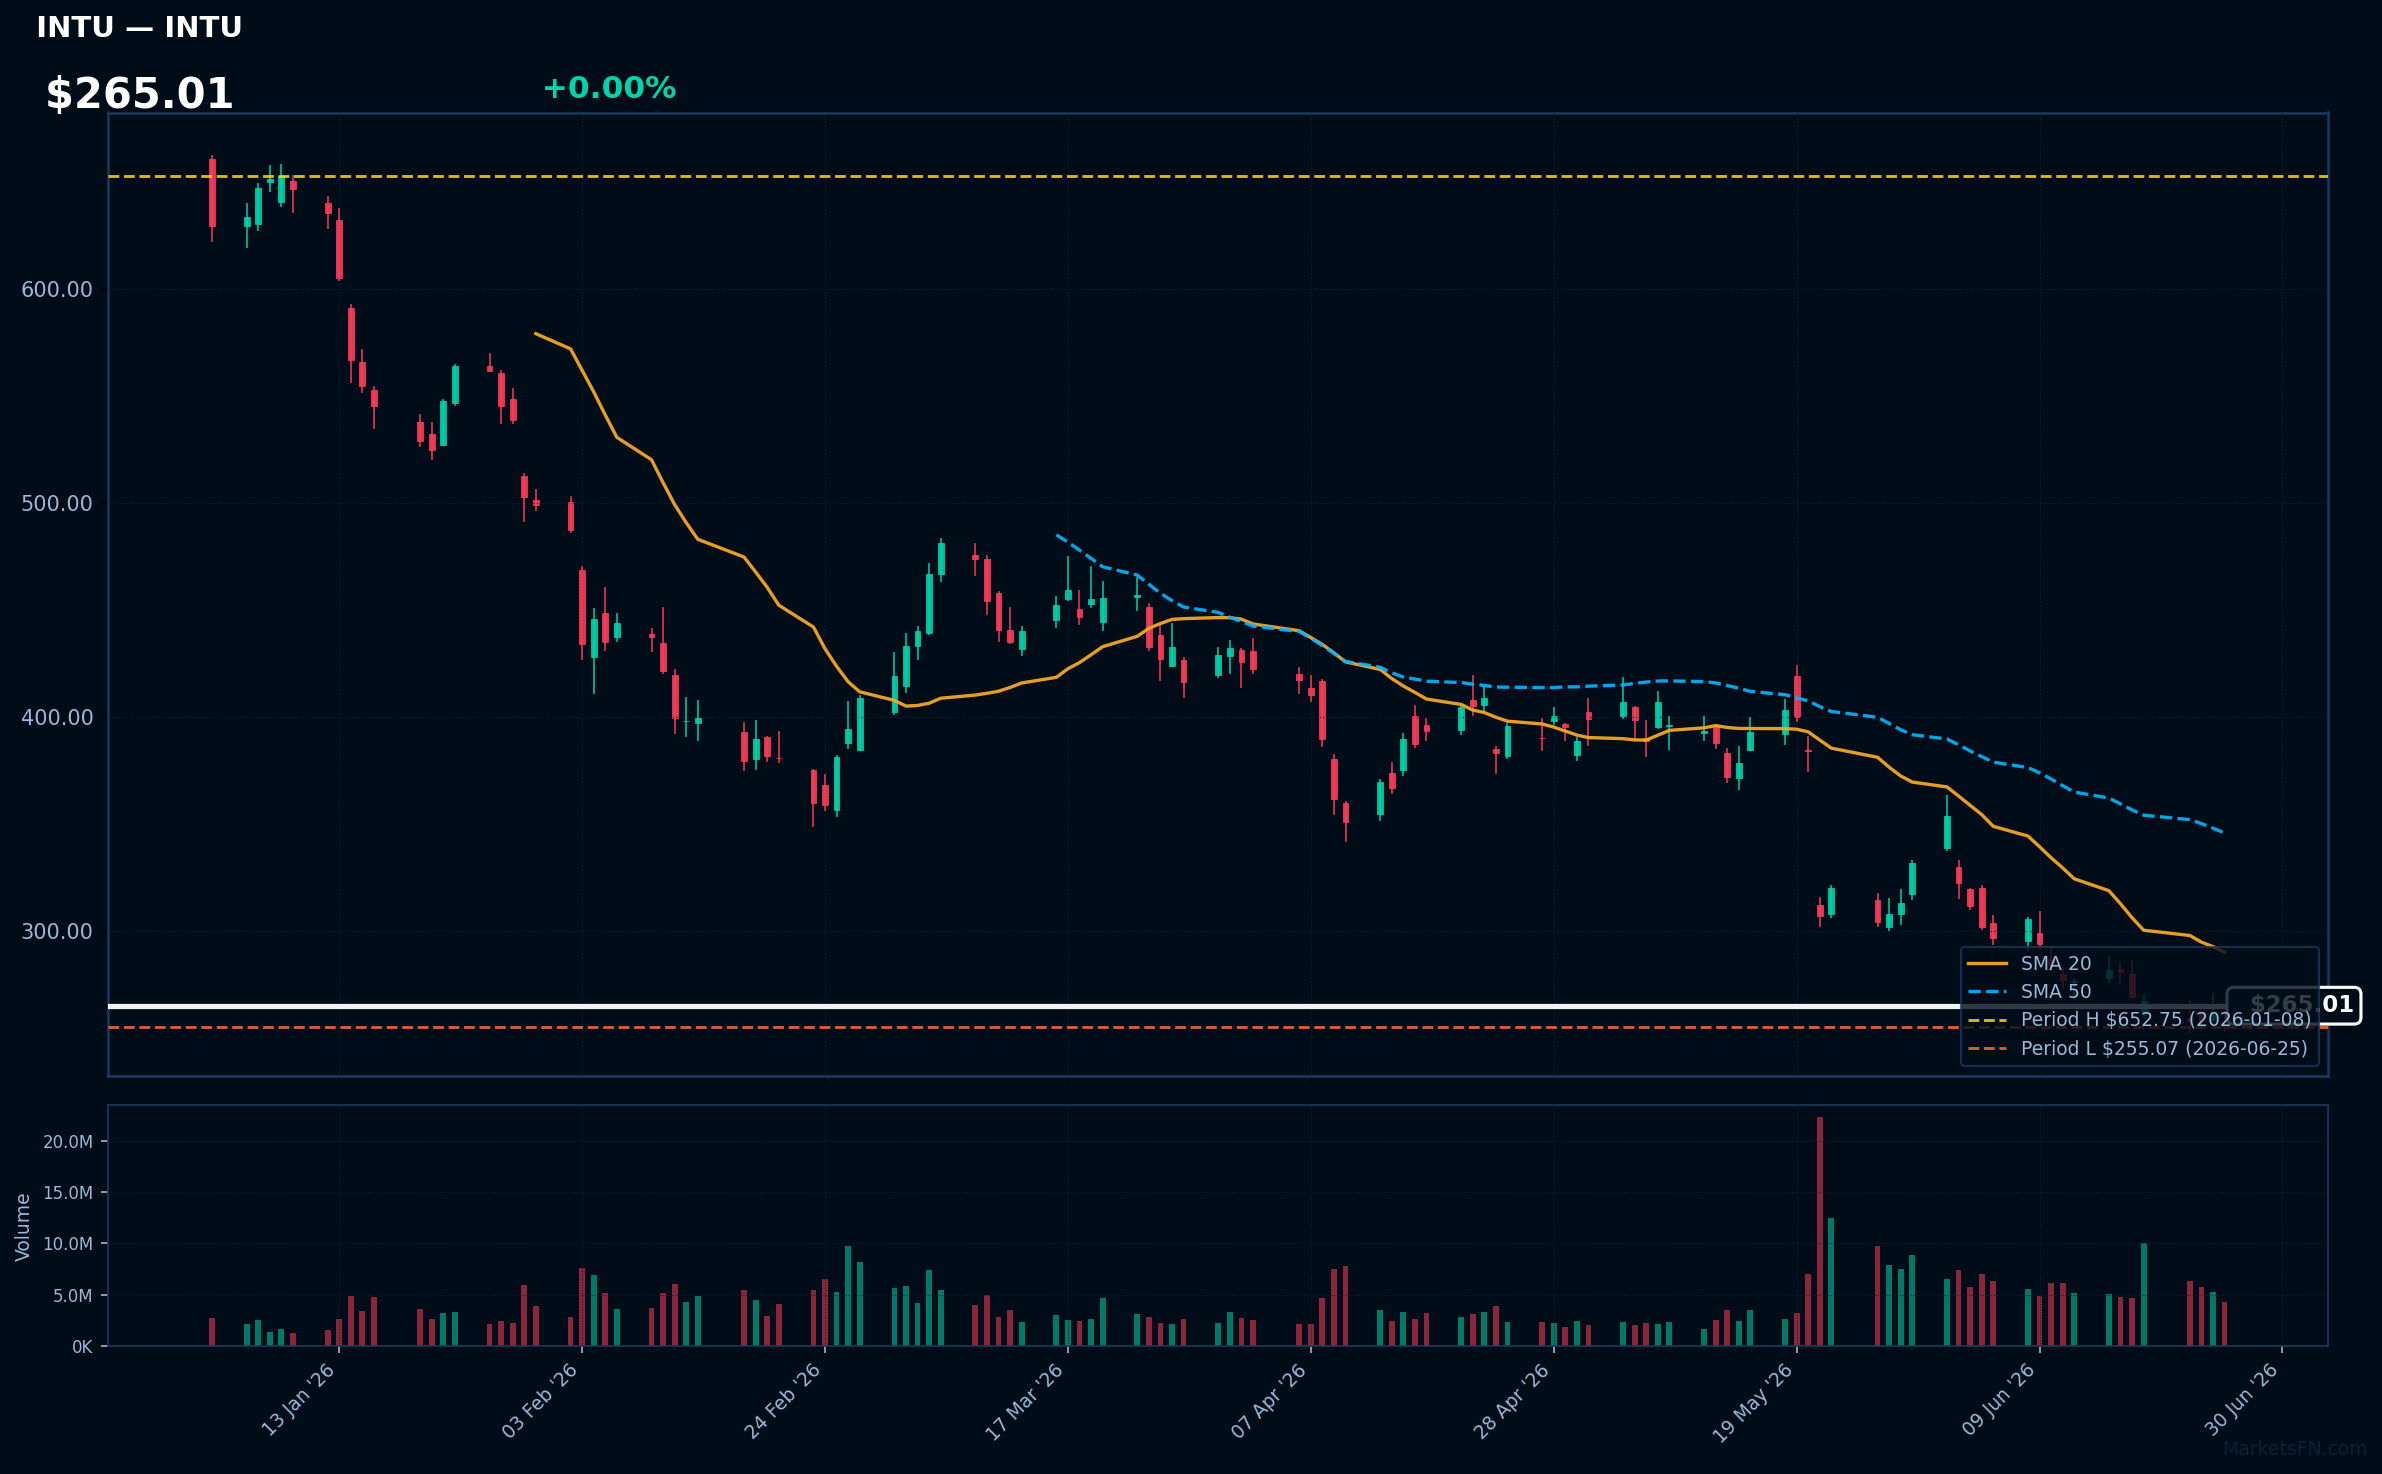
INTU | Intuit Inc | Technology | Price Last: $255.07 | % Realized: -59.48% | RSI: 35.5 | % above MA200: -50.3% | Trend: Below MA20, MA50, MA200
Intuit Inc (INTU) provides financial management solutions, including QuickBooks for small businesses and TurboTax for individual tax preparation, making it a key player in the financial software space with significant exposure to tax and accounting workflows.
INTU's technical situation is bearish, with an RSI(14) of 35.5 indicating oversold conditions, and a sustained downtrend as price ($265.01) remains below MA20, MA50, and MA200, with the stock testing major support at its 2026 YTD low.
Related headlines
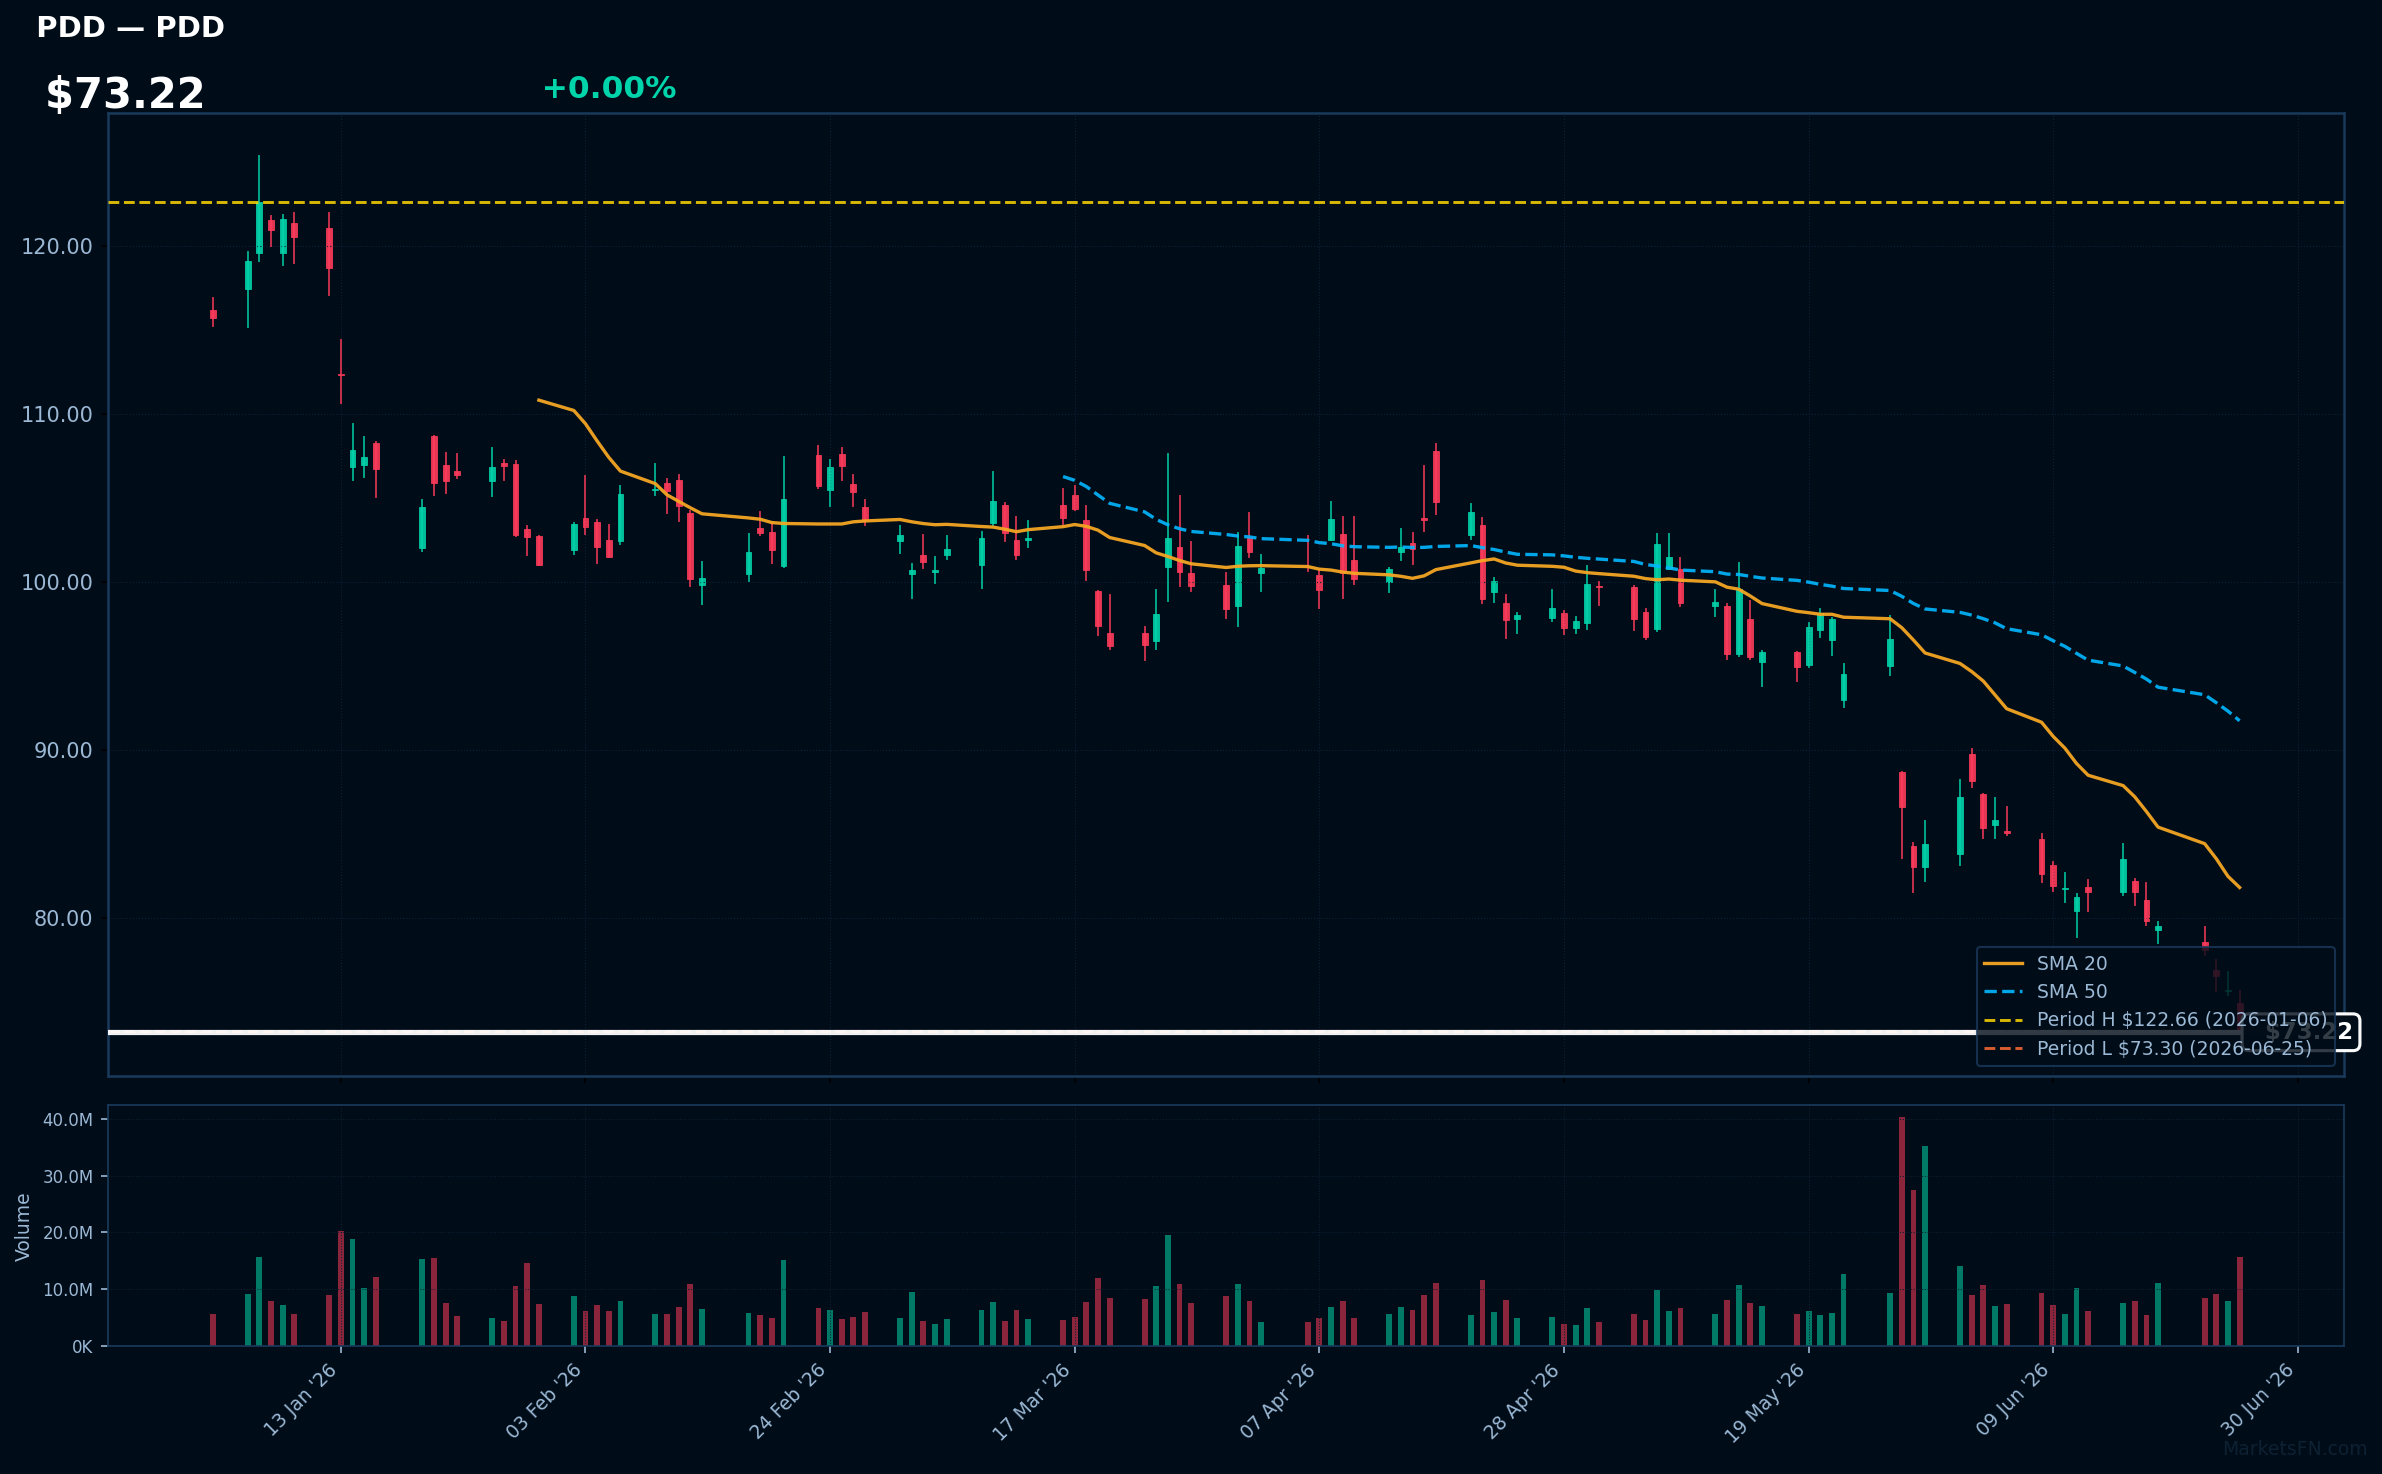
PDD | PDD Holdings Inc ADR | Consumer Cyclical | Price Last: $73.30 | % Realized: -36.67% | RSI: 23.9 | % above MA200: -33.0% | Trend: Below MA20, MA50, MA200
PDD Holdings Inc ADR operates as a platform that enables merchants and consumers to engage in cross-border e-commerce. Investors should care because its business model has disrupted traditional retail, with significant growth potential in emerging markets.
PDD is testing major support at its 2026 YTD low with an RSI(14) of 23.9, indicating oversold conditions. The bearish MA alignment (price < MA20 < MA50 < MA200) suggests a sustained downtrend, potentially warning of further downside; the stock has already declined 36.7% YTD.
Related headlines
- PDD Holding, Inc. Shareholders Are Encouraged to Reach Out to Johnson Fistel for More Information About Potentially Recovering Their Losses
- PDD Holdings Inc (PDD) Q1 2026 Earnings Call Highlights: Revenue Growth Amidst Profit Challenges
- PDD Holdings shares slide after revenue and profit miss
- PDD Stock Slides After Temu Parent's Revenue Misses Estimates
Market Commentary
The Nasdaq 100 tech stocks listed are currently trading near their 2026 year-to-date (YTD) extremes, with some at their highs and others at their lows. Stocks like MU, AMAT, and MNST are at their 2026 YTD highs, indicating strong performance, while MSFT, NFLX, and PLTR are at their 2026 YTD lows, suggesting a downturn.
The technology sector is influenced by various macro conditions and themes. The stocks near their 2026 YTD highs are largely from the semiconductor and gaming industries, potentially driven by demand for tech hardware and digital entertainment. Conversely, the stocks near their lows include major software and streaming companies, which may be affected by market saturation, competition, or economic uncertainty.
Investors and traders should monitor the factors driving these extremes, such as earnings reports, industry trends, and broader economic indicators. As the year progresses, shifts in these conditions could impact the trajectory of these stocks, potentially leading to new highs or lows. Keeping a close eye on these developments will be crucial for making informed investment decisions.
Methodology: All 101 Nasdaq 100 constituents screened. Close prices downloaded from 2026-01-01. Period high = highest close since Jan 1 2026; period low = lowest close since Jan 1 2026. Distance = (current price / period extreme − 1) × 100. Technical indicators computed on up to 1 year of daily OHLCV data.
Disclaimer: For informational purposes only. Not investment advice. Past performance is not indicative of future results.