S&P 500 52-Week Highs & Lows Radar: Lilly(Eli) & (LLY), Nike, (NKE) and more
· Stocks · MarketsFN Team
S&P 500 52-Week Highs & Lows Radar: Lilly(Eli) & (LLY), Nike, (NKE) and more
Screening all 503 S&P 500 constituents for stocks nearest to their 52-week high and their 52-week low. Data as of June 26, 2026. % Realized = 52-week total return.
Legend: RSI > 70 = overbought · RSI < 30 = oversold · Green % Realized = positive 52W return · Red = negative.
📈 Nearest to 52-Week High
Sectors represented: Healthcare (5)
| Ticker | Company | Sector | Price Last | % Realized | 52-Week High Date | RSI | % above MA200 | Trend |
|---|---|---|---|---|---|---|---|---|
| LLY | Lilly(Eli) & Co | Healthcare | $1191.87 | +49.90% | 2026-06-26 | 70.9 | +22.1% | Above MA20, MA50, MA200 |
| JNJ | Johnson & Johnson | Healthcare | $252.77 | +66.29% | 2026-06-26 | 70.7 | +16.3% | Above MA20, MA50, MA200 |
| ABBV | Abbvie Inc | Healthcare | $248.08 | +32.81% | 2026-06-26 | 74.3 | +12.1% | Above MA20, MA50, MA200 |
| UNH | Unitedhealth Group Inc | Healthcare | $423.08 | +39.81% | 2026-06-26 | 69.7 | +26.0% | Above MA20, MA50, MA200 |
| MRK | Merck & Co Inc | Healthcare | $127.92 | +62.27% | 2026-06-26 | 68.7 | +20.3% | Above MA20, MA50, MA200 |
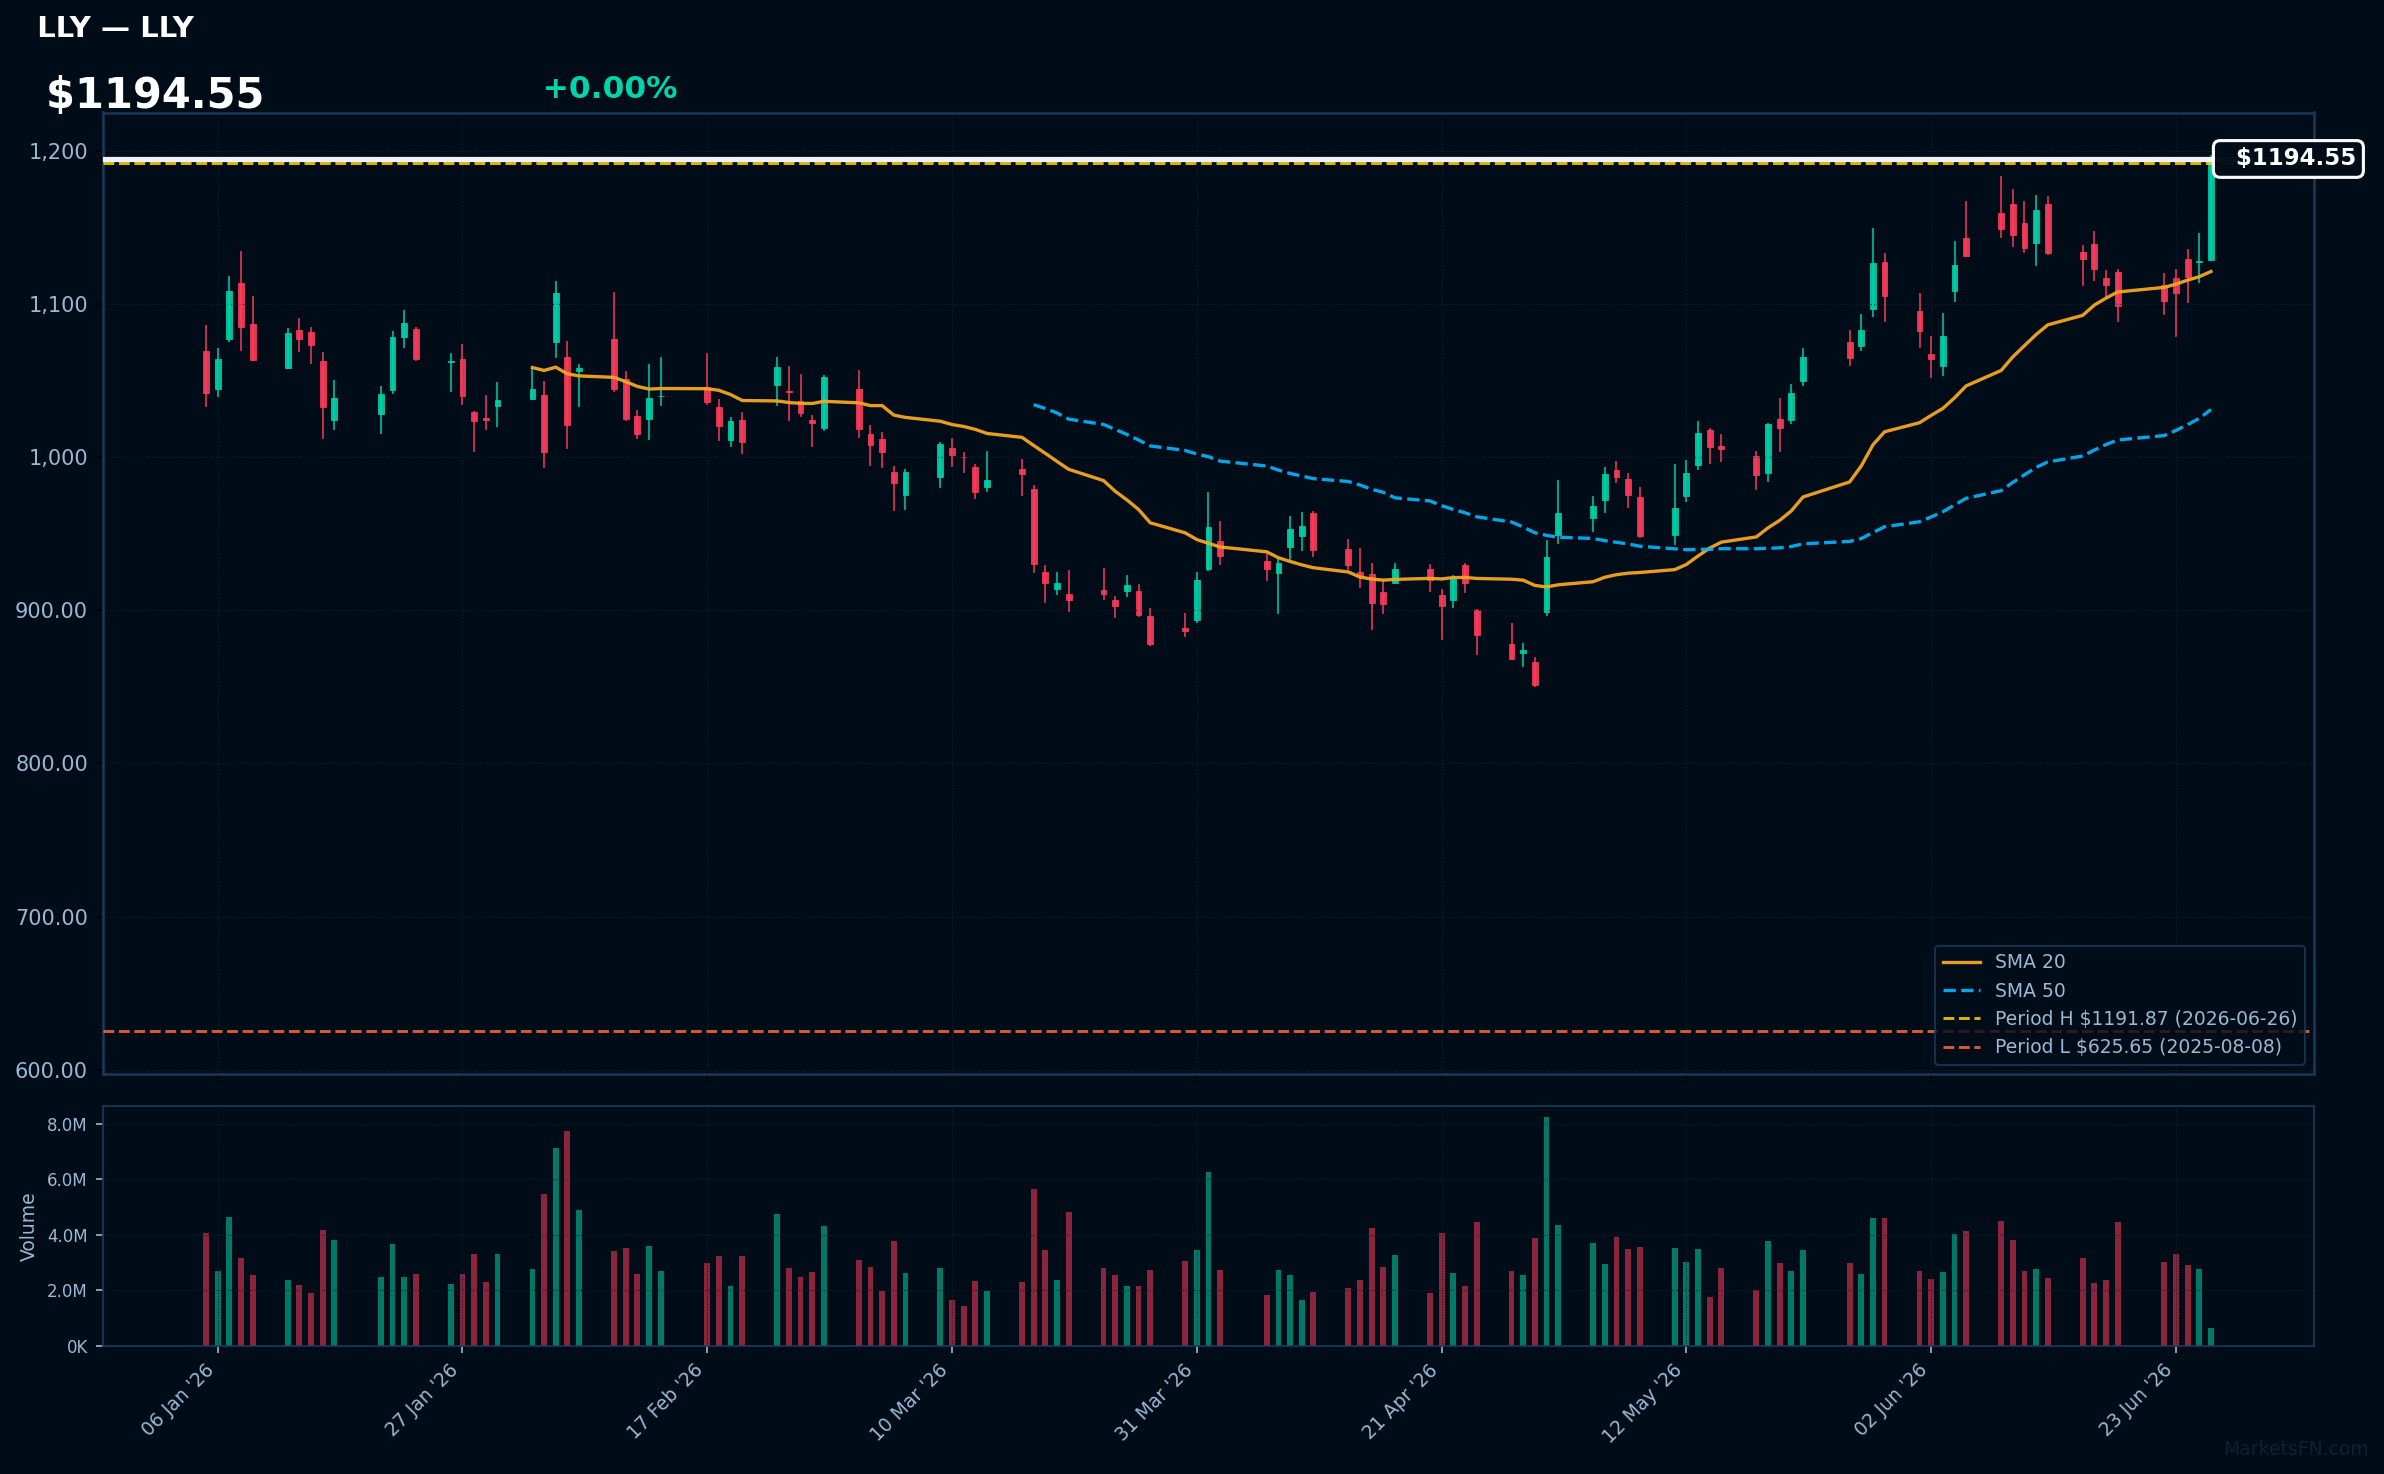
LLY | Lilly(Eli) & Co | Healthcare | Price Last: $1191.87 | % Realized: +49.90% | RSI: 70.9 | % above MA200: +22.1% | Trend: Above MA20, MA50, MA200
Eli Lilly is a pharmaceutical company developing and marketing medicines, with a focus on diabetes, oncology, and neuroscience treatments. Investors care about its pipeline, regulatory approvals, and sales growth of key products like tirzepatide and donanemab.
Lilly's technicals indicate strong momentum: RSI(14) is 70.9, nearing overbought territory, with a bullish MA alignment (price > MA20 > MA50 > MA200) and 0.0% below its 52-Week high, suggesting a potential breakout.
Related headlines
- Lilly's Jaypirca (pirtobrutinib) recommended by CHMP for approval in the European Union for adults with chronic lymphocytic leukemia (CLL) across all lines of therapy
- Lilly-backed Absci banks $100m to progress endometriosis, hair loss therapy
- Lilly launches "The Memory Radio Station" across Europe, inviting the public to visually reconstruct fading memories through GenAI
- Lilly's $780M Bet is Reshaping Surgical Infection Prevention, and PolyPid's Asset is Hiding in Plain Sight
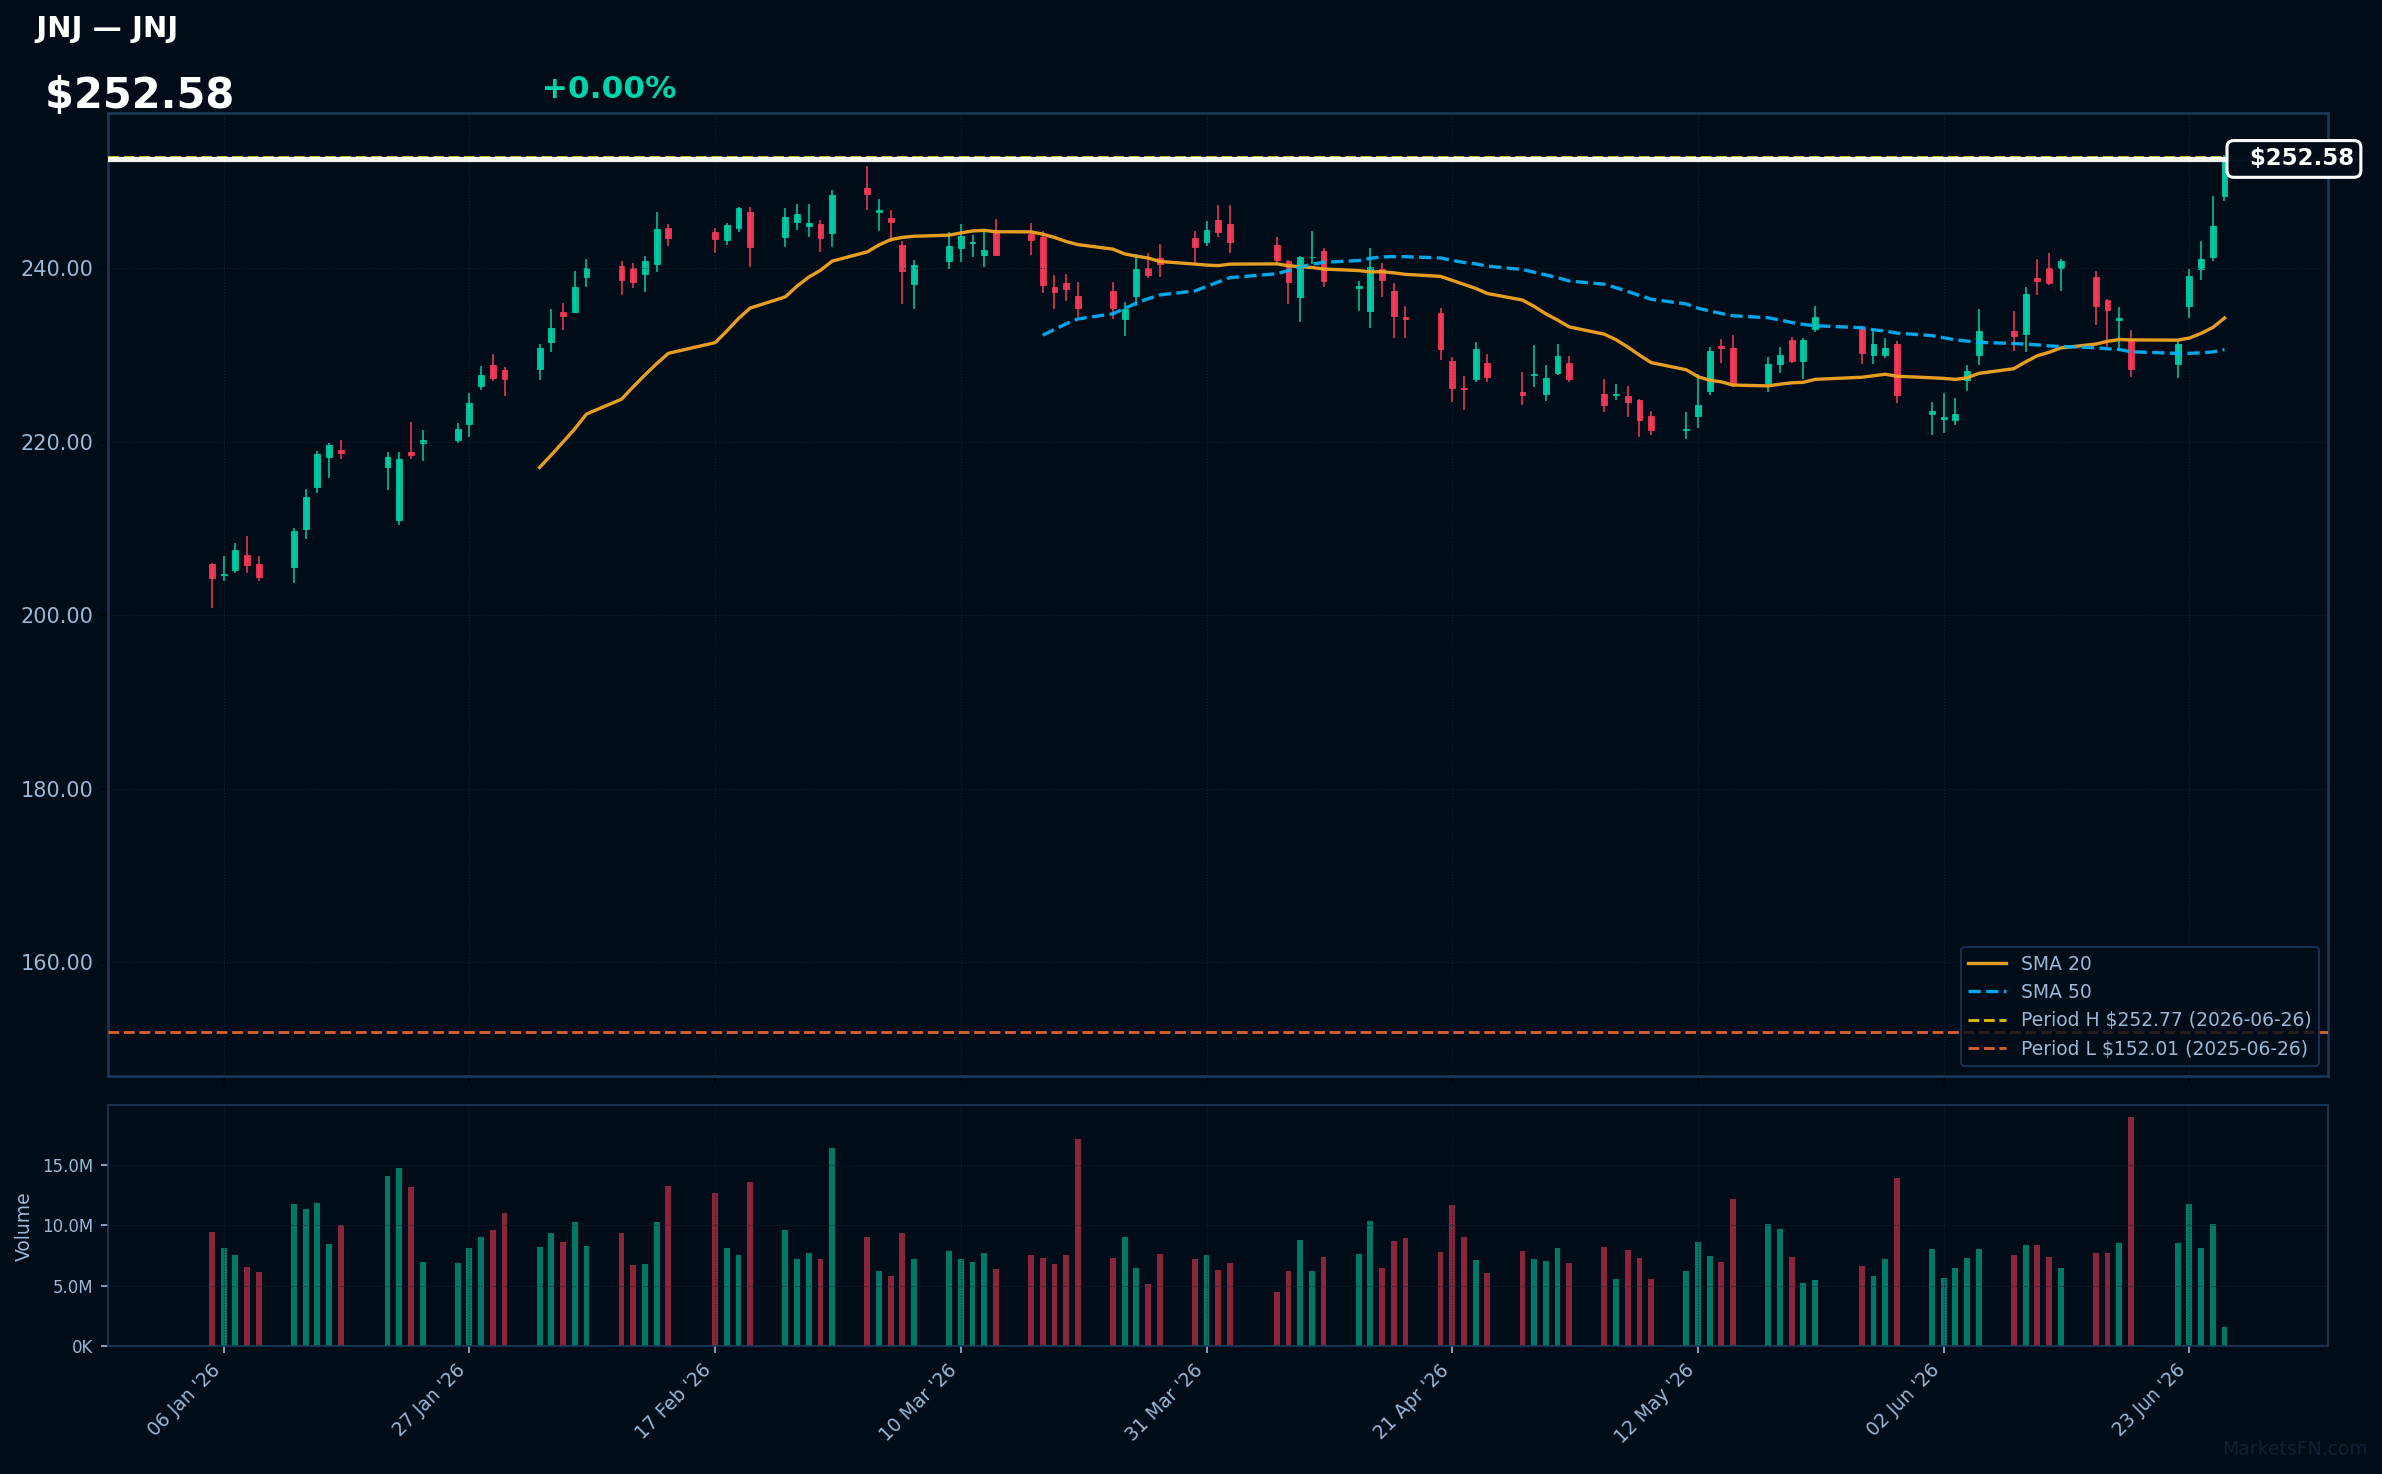
JNJ | Johnson & Johnson | Healthcare | Price Last: $252.77 | % Realized: +66.29% | RSI: 70.7 | % above MA200: +16.3% | Trend: Above MA20, MA50, MA200
Johnson & Johnson is a diversified healthcare company with a broad portfolio of pharmaceuticals, medical devices, and consumer products, including blockbuster medications like Stelara and Darzalex, making it a significant player in the healthcare sector.
JNJ's RSI is 70.7, indicating strong momentum as it is near its 52-Week high with a bullish MA alignment: price ($252.58) > MA20 > MA50 > MA200, suggesting a sustained uptrend with potential for further breakout.
Related headlines
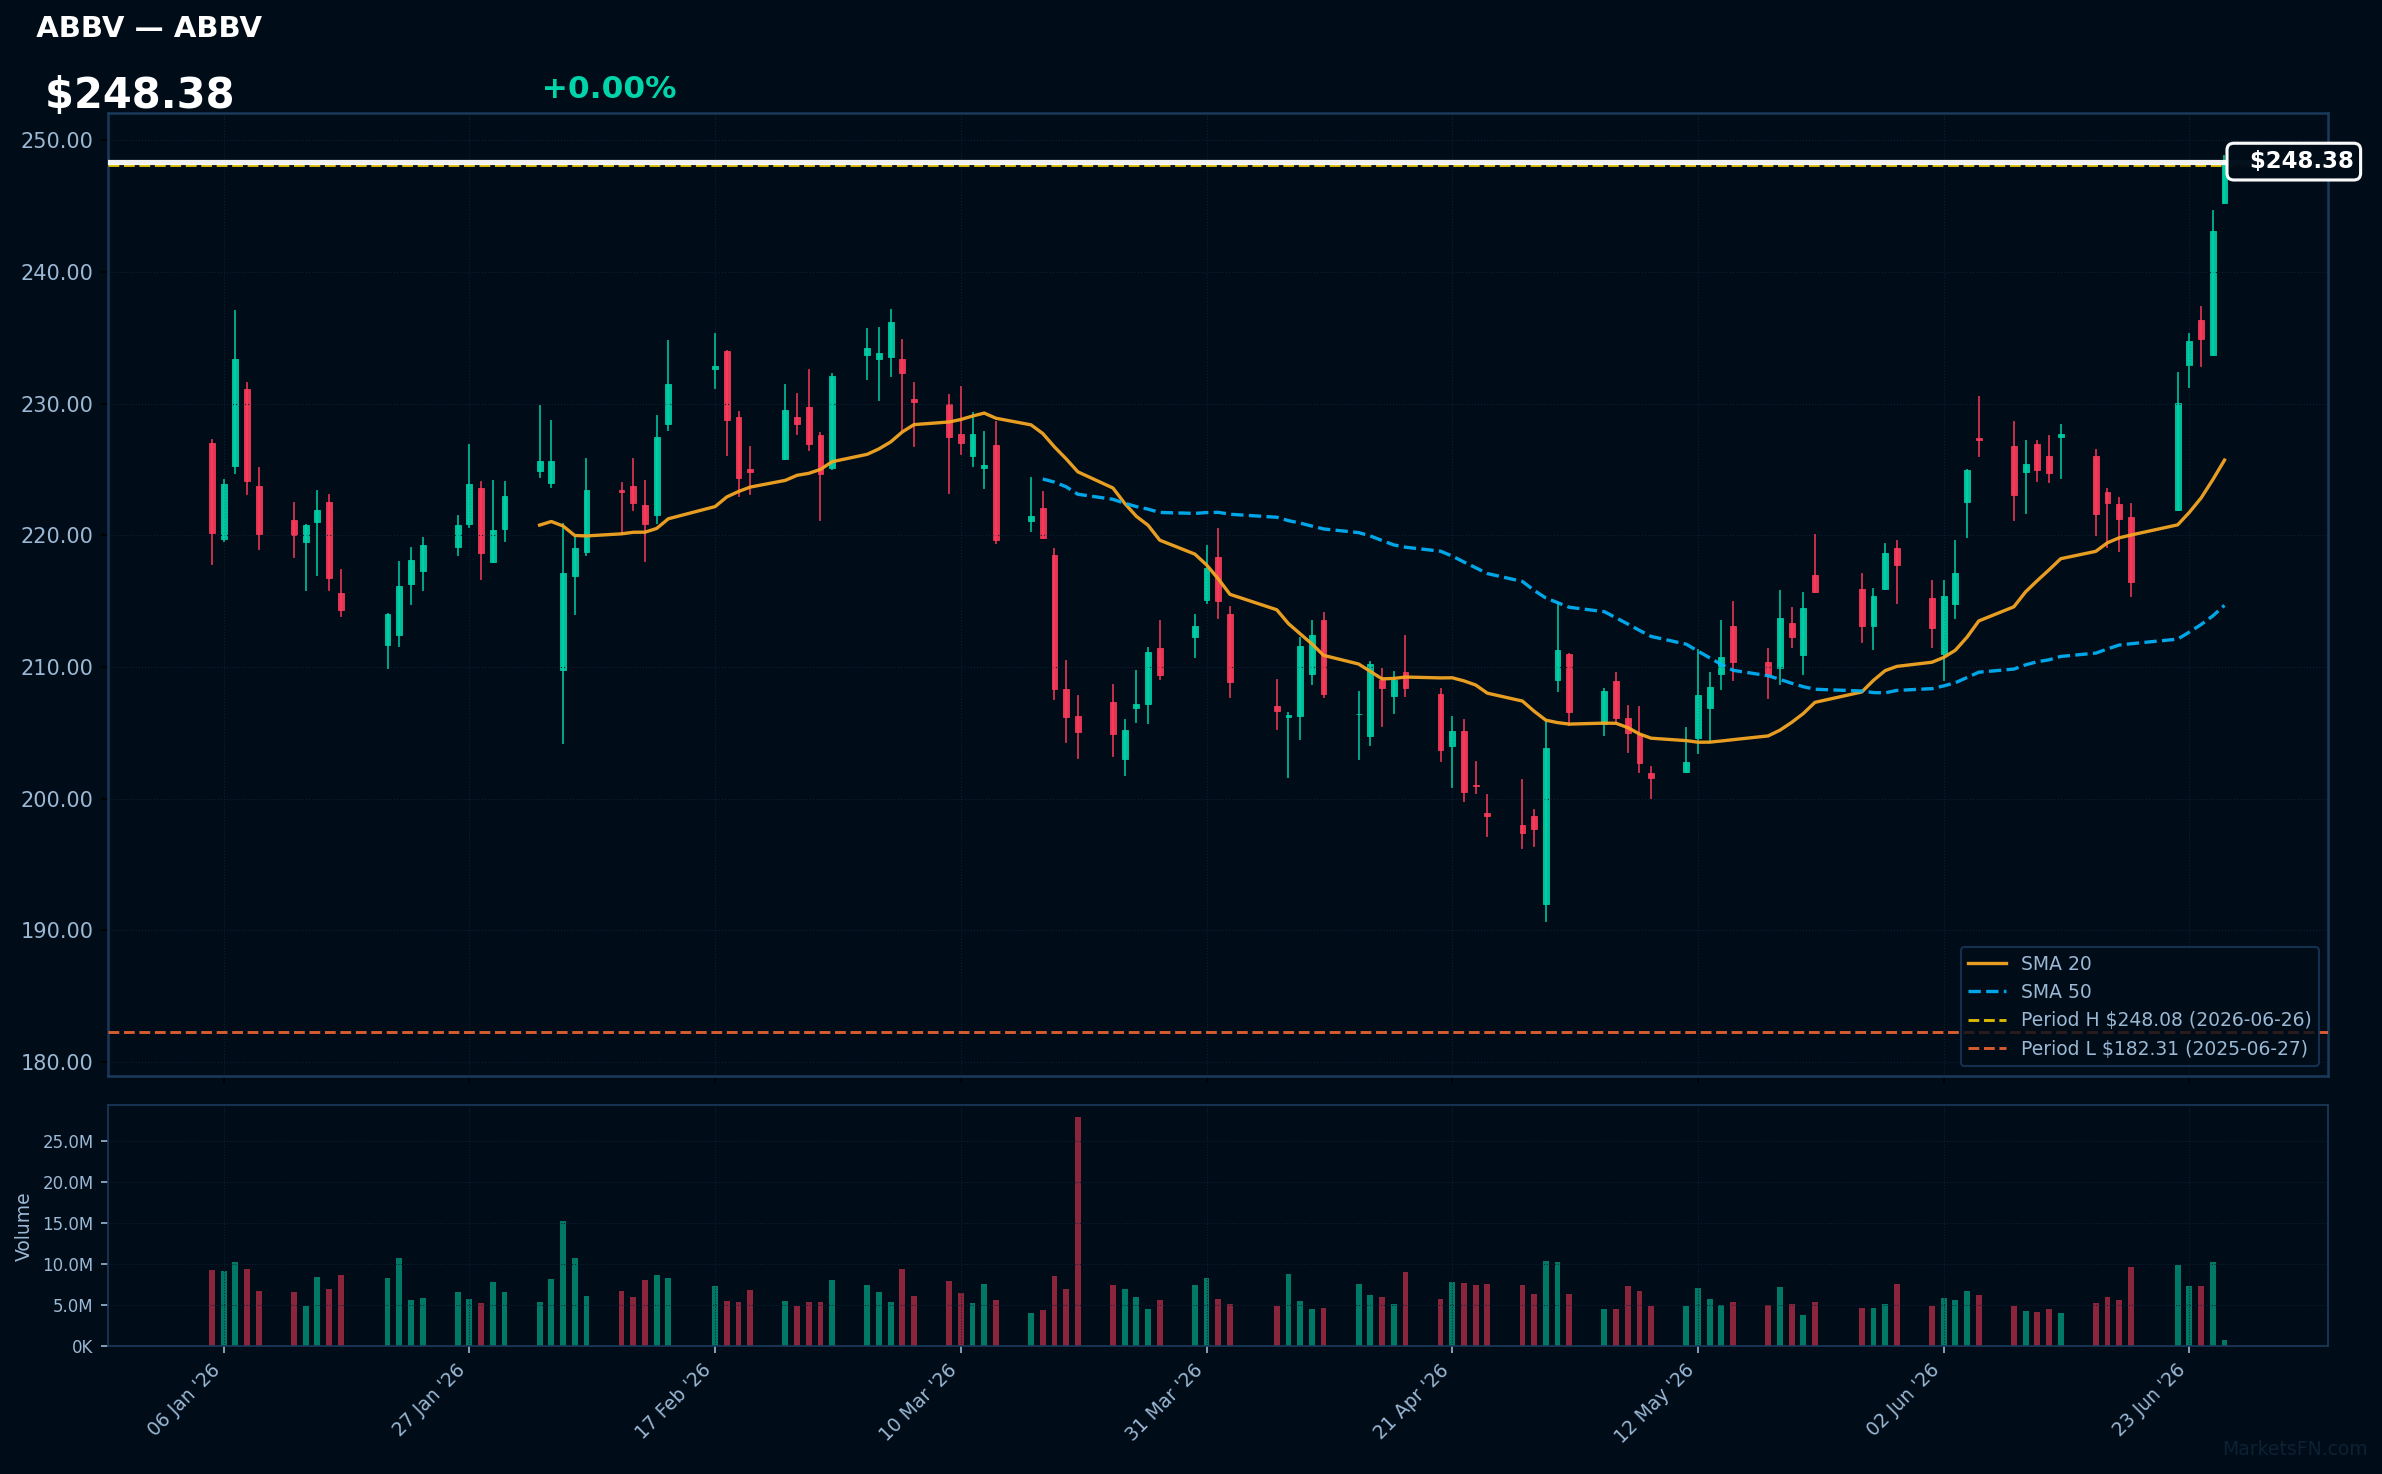
ABBV | Abbvie Inc | Healthcare | Price Last: $248.08 | % Realized: +32.81% | RSI: 74.3 | % above MA200: +12.1% | Trend: Above MA20, MA50, MA200
Abbvie Inc is a biopharmaceutical company that develops and markets therapies for chronic diseases like rheumatoid arthritis and hepatitis C. Investors care about its pipeline and sales of key products like Humira, a top-selling arthritis treatment.
Abbvie's RSI is 74.3, indicating strong momentum as it's above MA20, MA50, and MA200. The stock is at its 52-Week high, having returned 32.8% over the period, suggesting continued upward pressure.
Related headlines
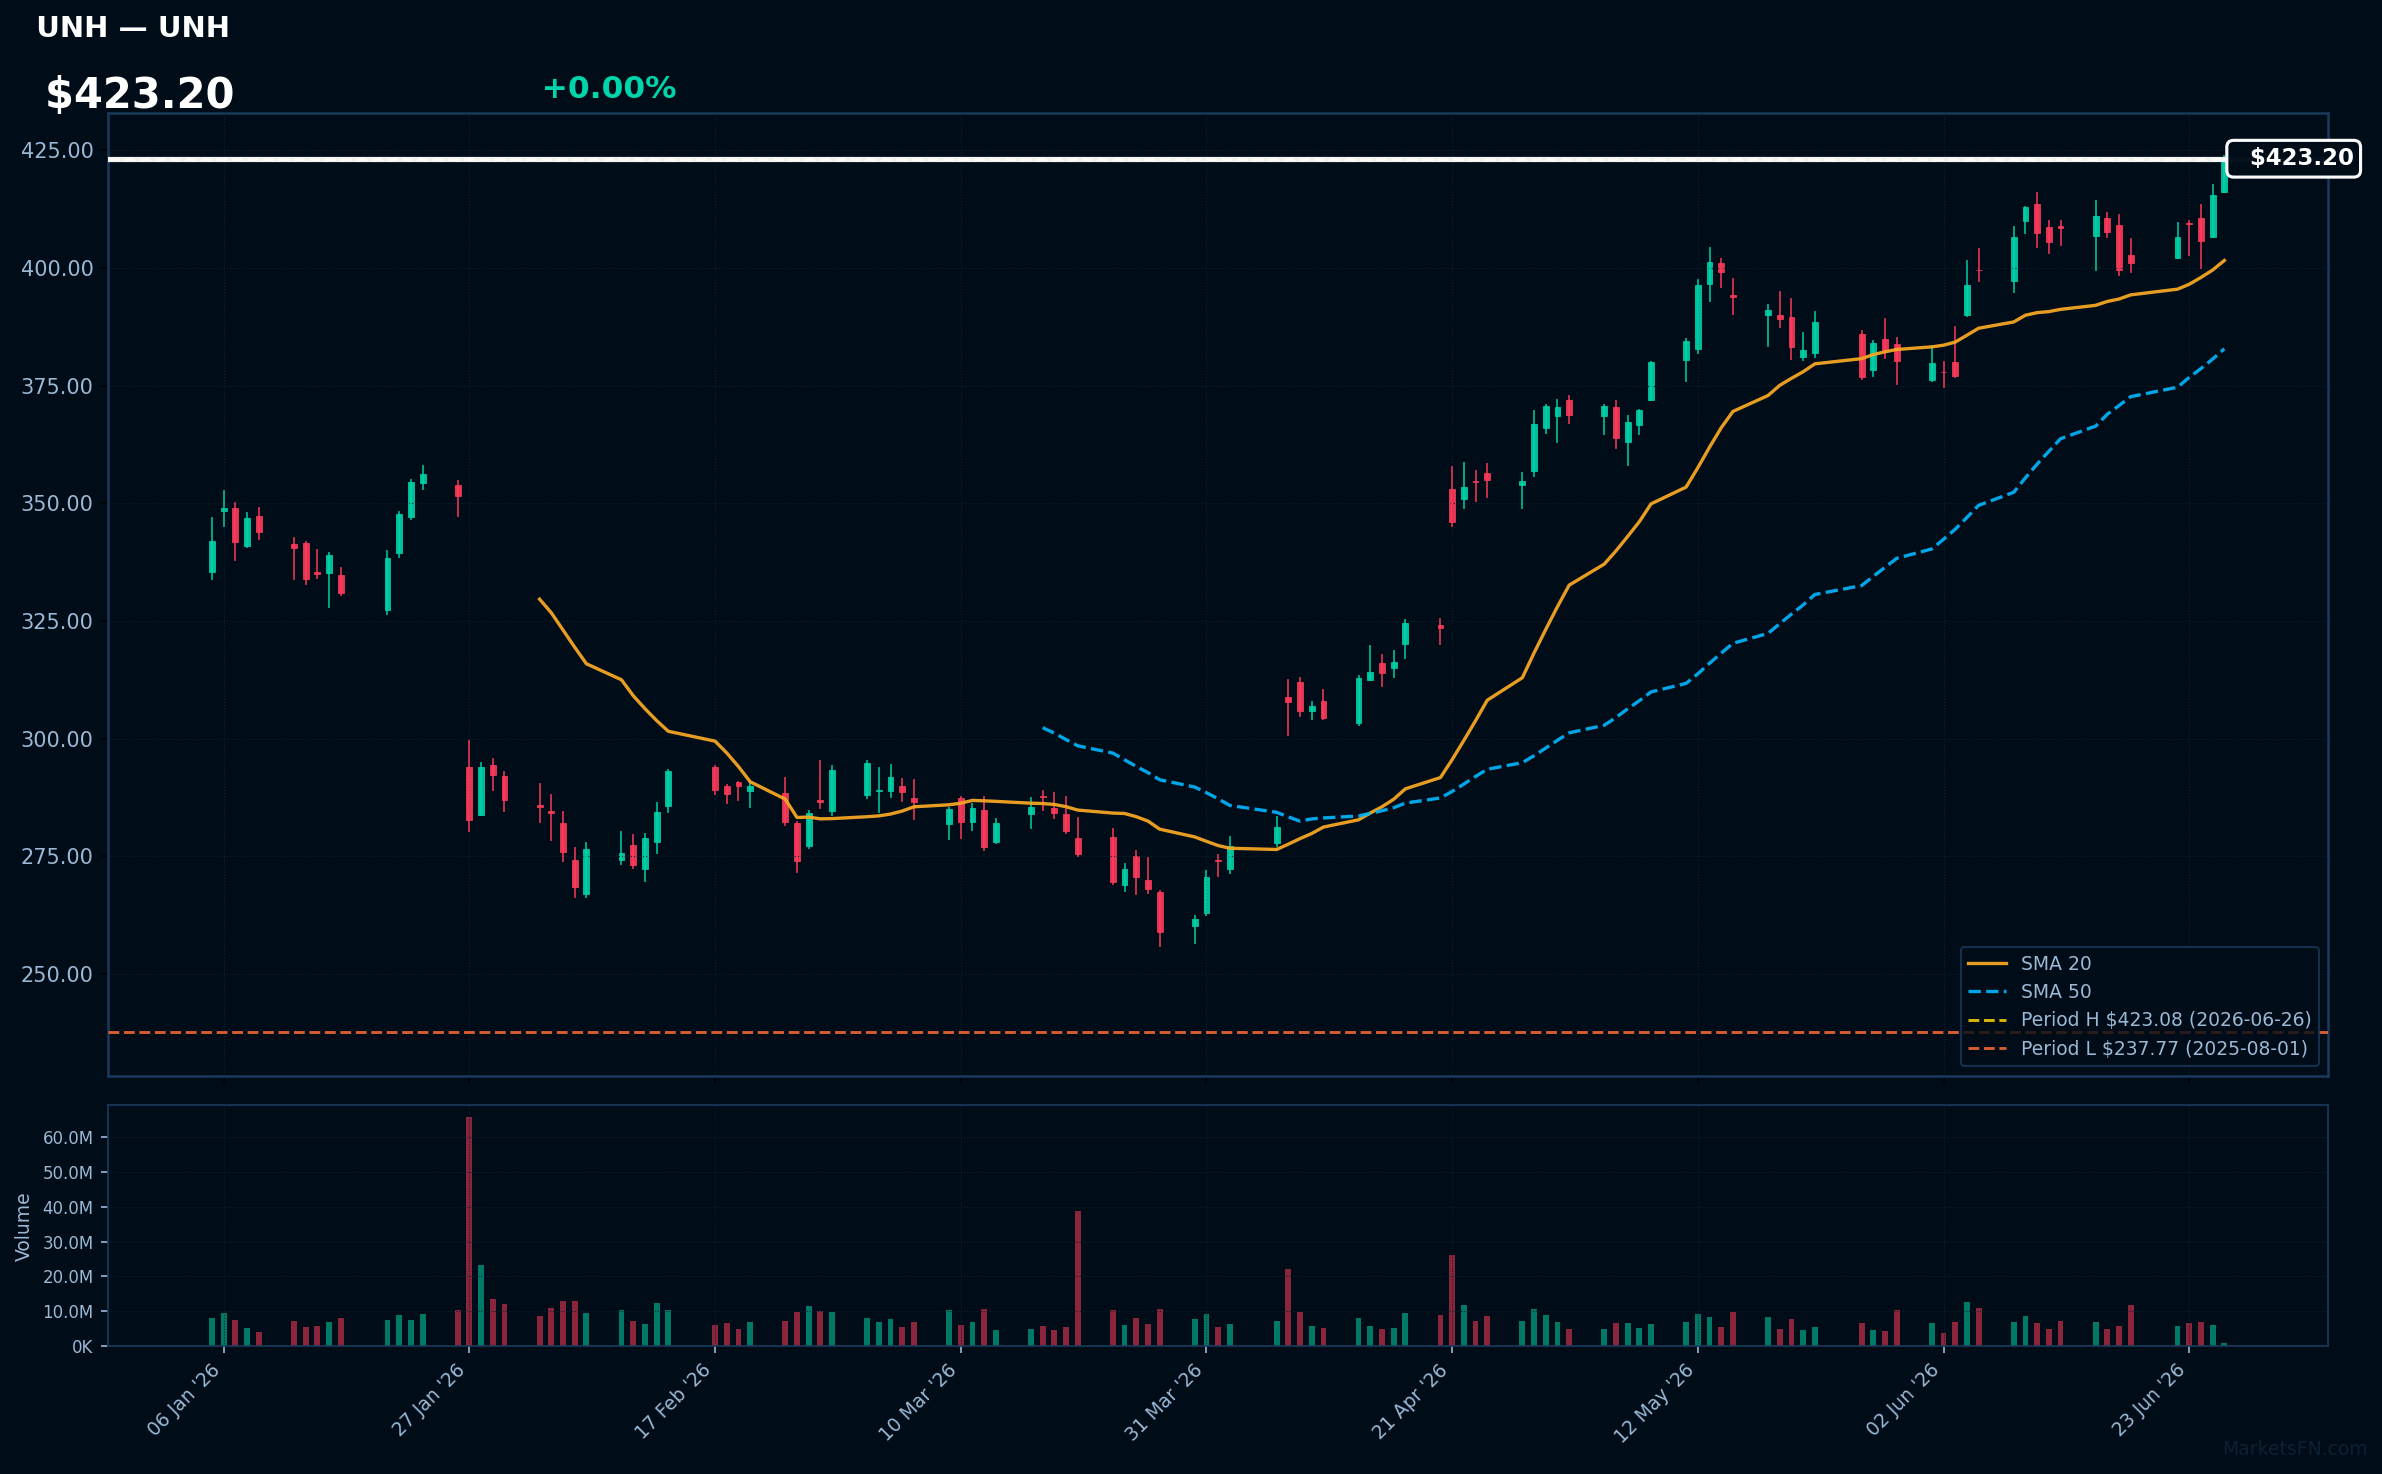
UNH | Unitedhealth Group Inc | Healthcare | Price Last: $423.08 | % Realized: +39.81% | RSI: 69.7 | % above MA200: +26.0% | Trend: Above MA20, MA50, MA200
Unitedhealth Group Inc operates health insurance and healthcare services businesses, with a diversified portfolio that likely appeals to investors seeking stable returns in the healthcare sector, driven by steady demand for health insurance and services.
Unitedhealth Group Inc is near a potential breakout at its 52-Week high, with an RSI(14) of 69.7 indicating strong momentum; its price > MA20 > MA50 > MA200 alignment confirms a sustained uptrend, suggesting ongoing bullishness.
Related headlines
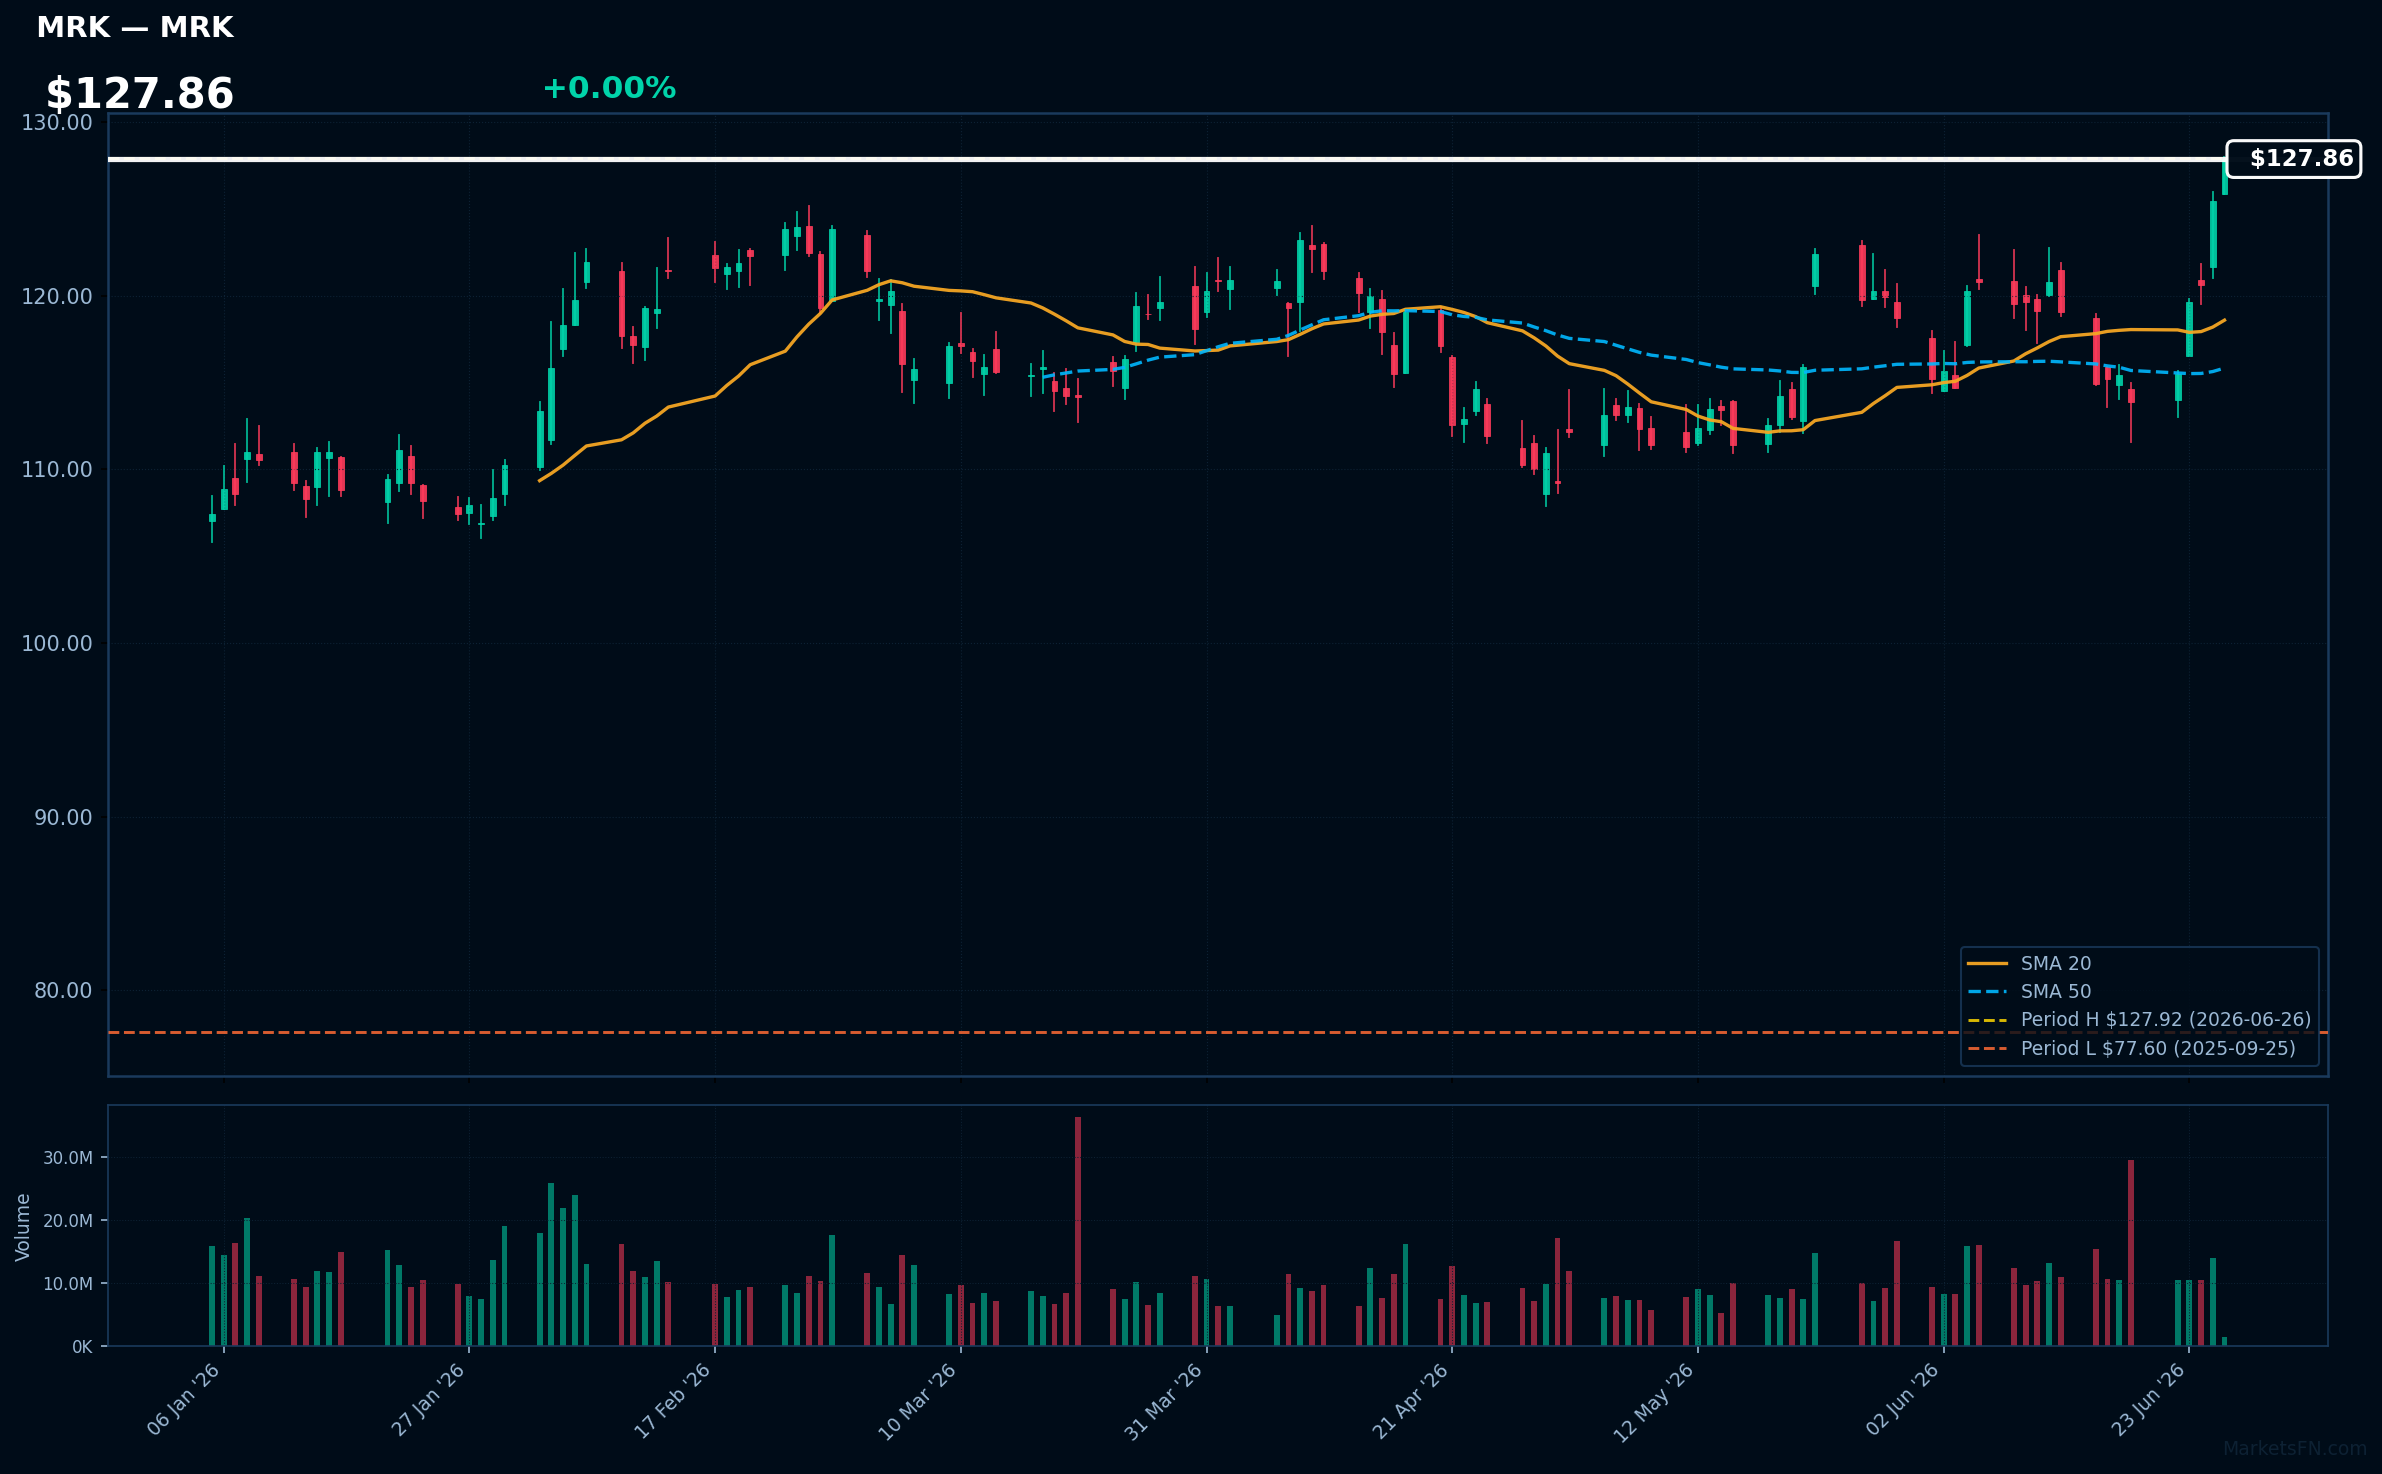
MRK | Merck & Co Inc | Healthcare | Price Last: $127.92 | % Realized: +62.27% | RSI: 68.7 | % above MA200: +20.3% | Trend: Above MA20, MA50, MA200
Merck & Co Inc is a pharmaceutical company that develops and markets medicines, vaccines, and animal health products. Investors should care about its pipeline of treatments for diseases like cancer and its key products such as Keytruda, a top-selling immunotherapy.
The stock shows a sustained uptrend with price ($127.86) above MA20 > MA50 > MA200, RSI(14) at 68.7, and is 0.0% below its 52-Week high, indicating strong momentum with no immediate signs of reversal, having returned 62.3% over the 52-Week period.
Related headlines
📉 Nearest to 52-Week Low
Sectors represented: Consumer Cyclical (2), Communication Services (2), Financial (1)
| Ticker | Company | Sector | Price Last | % Realized | 52-Week Low Date | RSI | % above MA200 | Trend |
|---|---|---|---|---|---|---|---|---|
| NKE | Nike, Inc | Consumer Cyclical | $40.74 | -34.86% | 2026-06-26 | 35.1 | -29.7% | Below MA20, MA50, MA200 |
| CME | CME Group Inc | Financial | $224.75 | -17.62% | 2026-06-26 | 23.3 | -20.0% | Below MA20, MA50, MA200 |
| FOX | Fox Corporation | Communication Services | $44.34 | -15.07% | 2026-06-26 | 24.9 | -22.4% | Below MA20, MA50, MA200 |
| FOXA | Fox Corporation | Communication Services | $48.81 | -13.88% | 2026-06-23 | 25.6 | -23.1% | Below MA20, MA50, MA200 |
| ROL | Rollins, Inc | Consumer Cyclical | $42.87 | -23.01% | 2026-06-25 | 23.4 | -24.3% | Below MA20, MA50, MA200 |
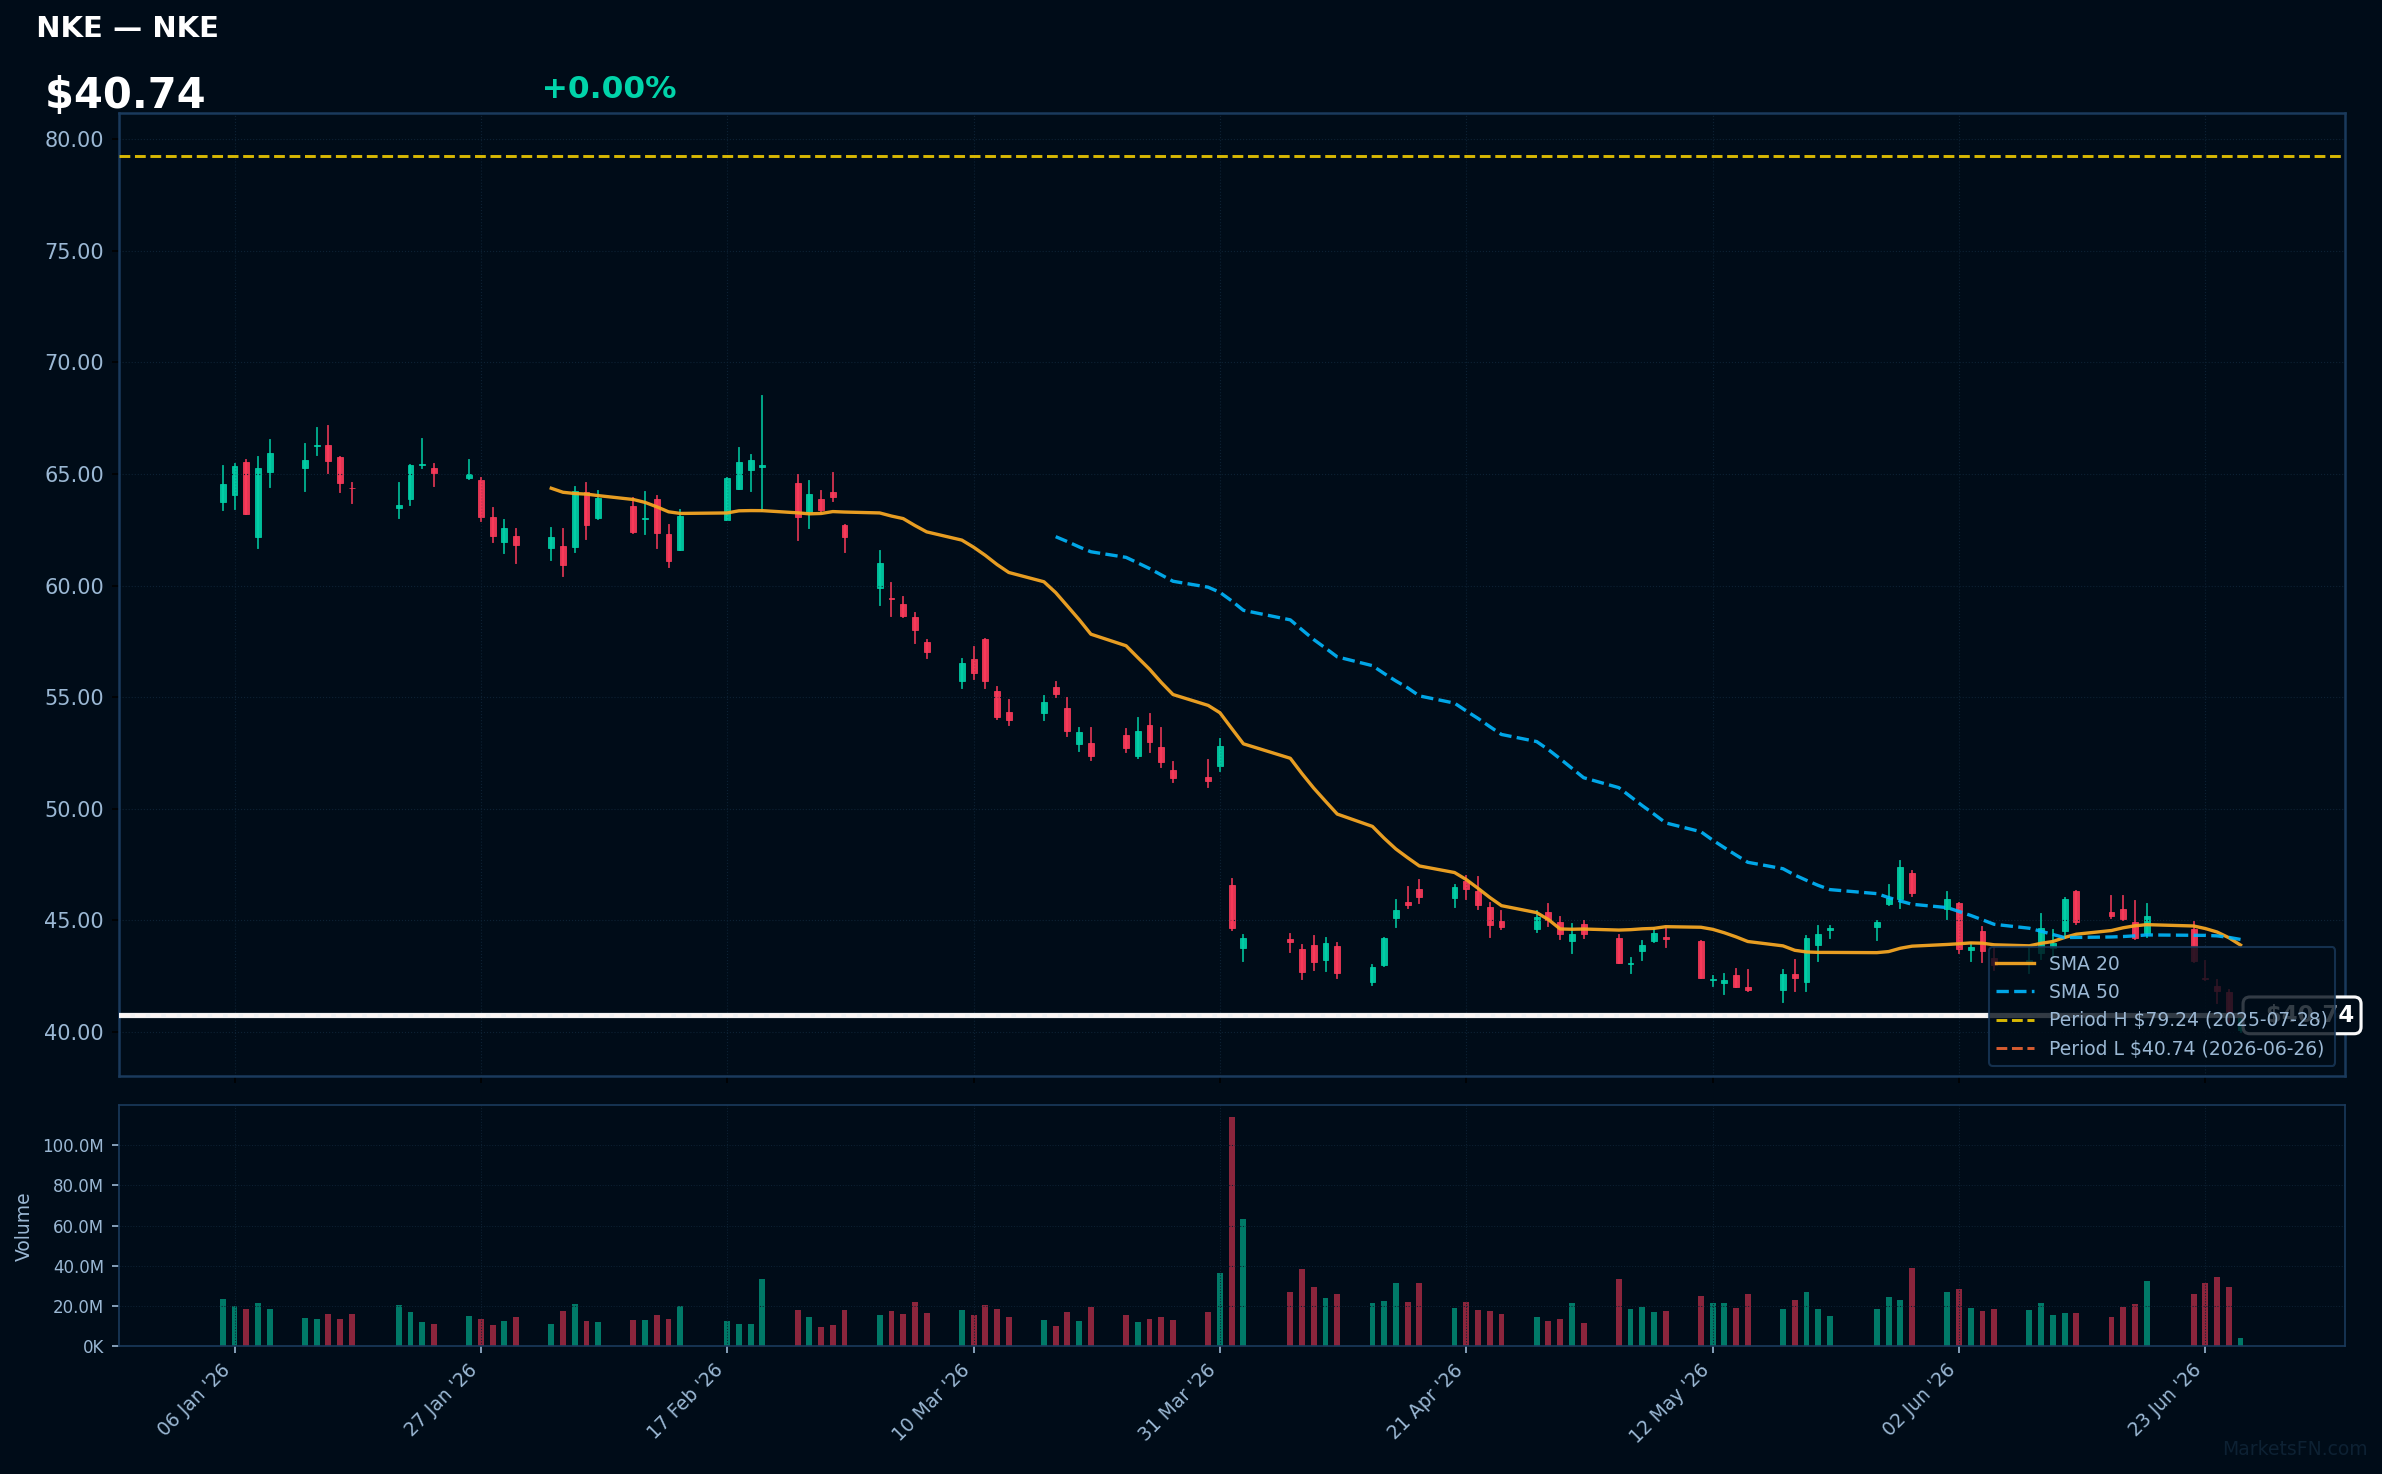
NKE | Nike, Inc | Consumer Cyclical | Price Last: $40.74 | % Realized: -34.86% | RSI: 35.1 | % above MA200: -29.7% | Trend: Below MA20, MA50, MA200
Nike, Inc designs and sells athletic footwear, apparel, and equipment. Investors should care about its brand strength, product innovation, and global distribution network, which drive revenue growth and profitability.
Nike's technicals indicate a sustained downtrend with price ($40.74) below MA20, MA50, and MA200. RSI(14) at 35.1 suggests nearing oversold territory. Testing major support at 52-Week low is a warning sign.
Related headlines
- Robinhood initiation, Nike downgrade among today's top calls on Wall Street
- NKE Stock Heads For Its Worst Week In Nearly Three Months Wall Street Sees Encouraging Signs But Not Enough To Remain Optimistic
- KeyBanc lowers Nike rating to Sector Weight on near-term uncertainty
- NKE Stock Slips On China Business Strategy Misstep And Surprise CFO Change Before Earnings
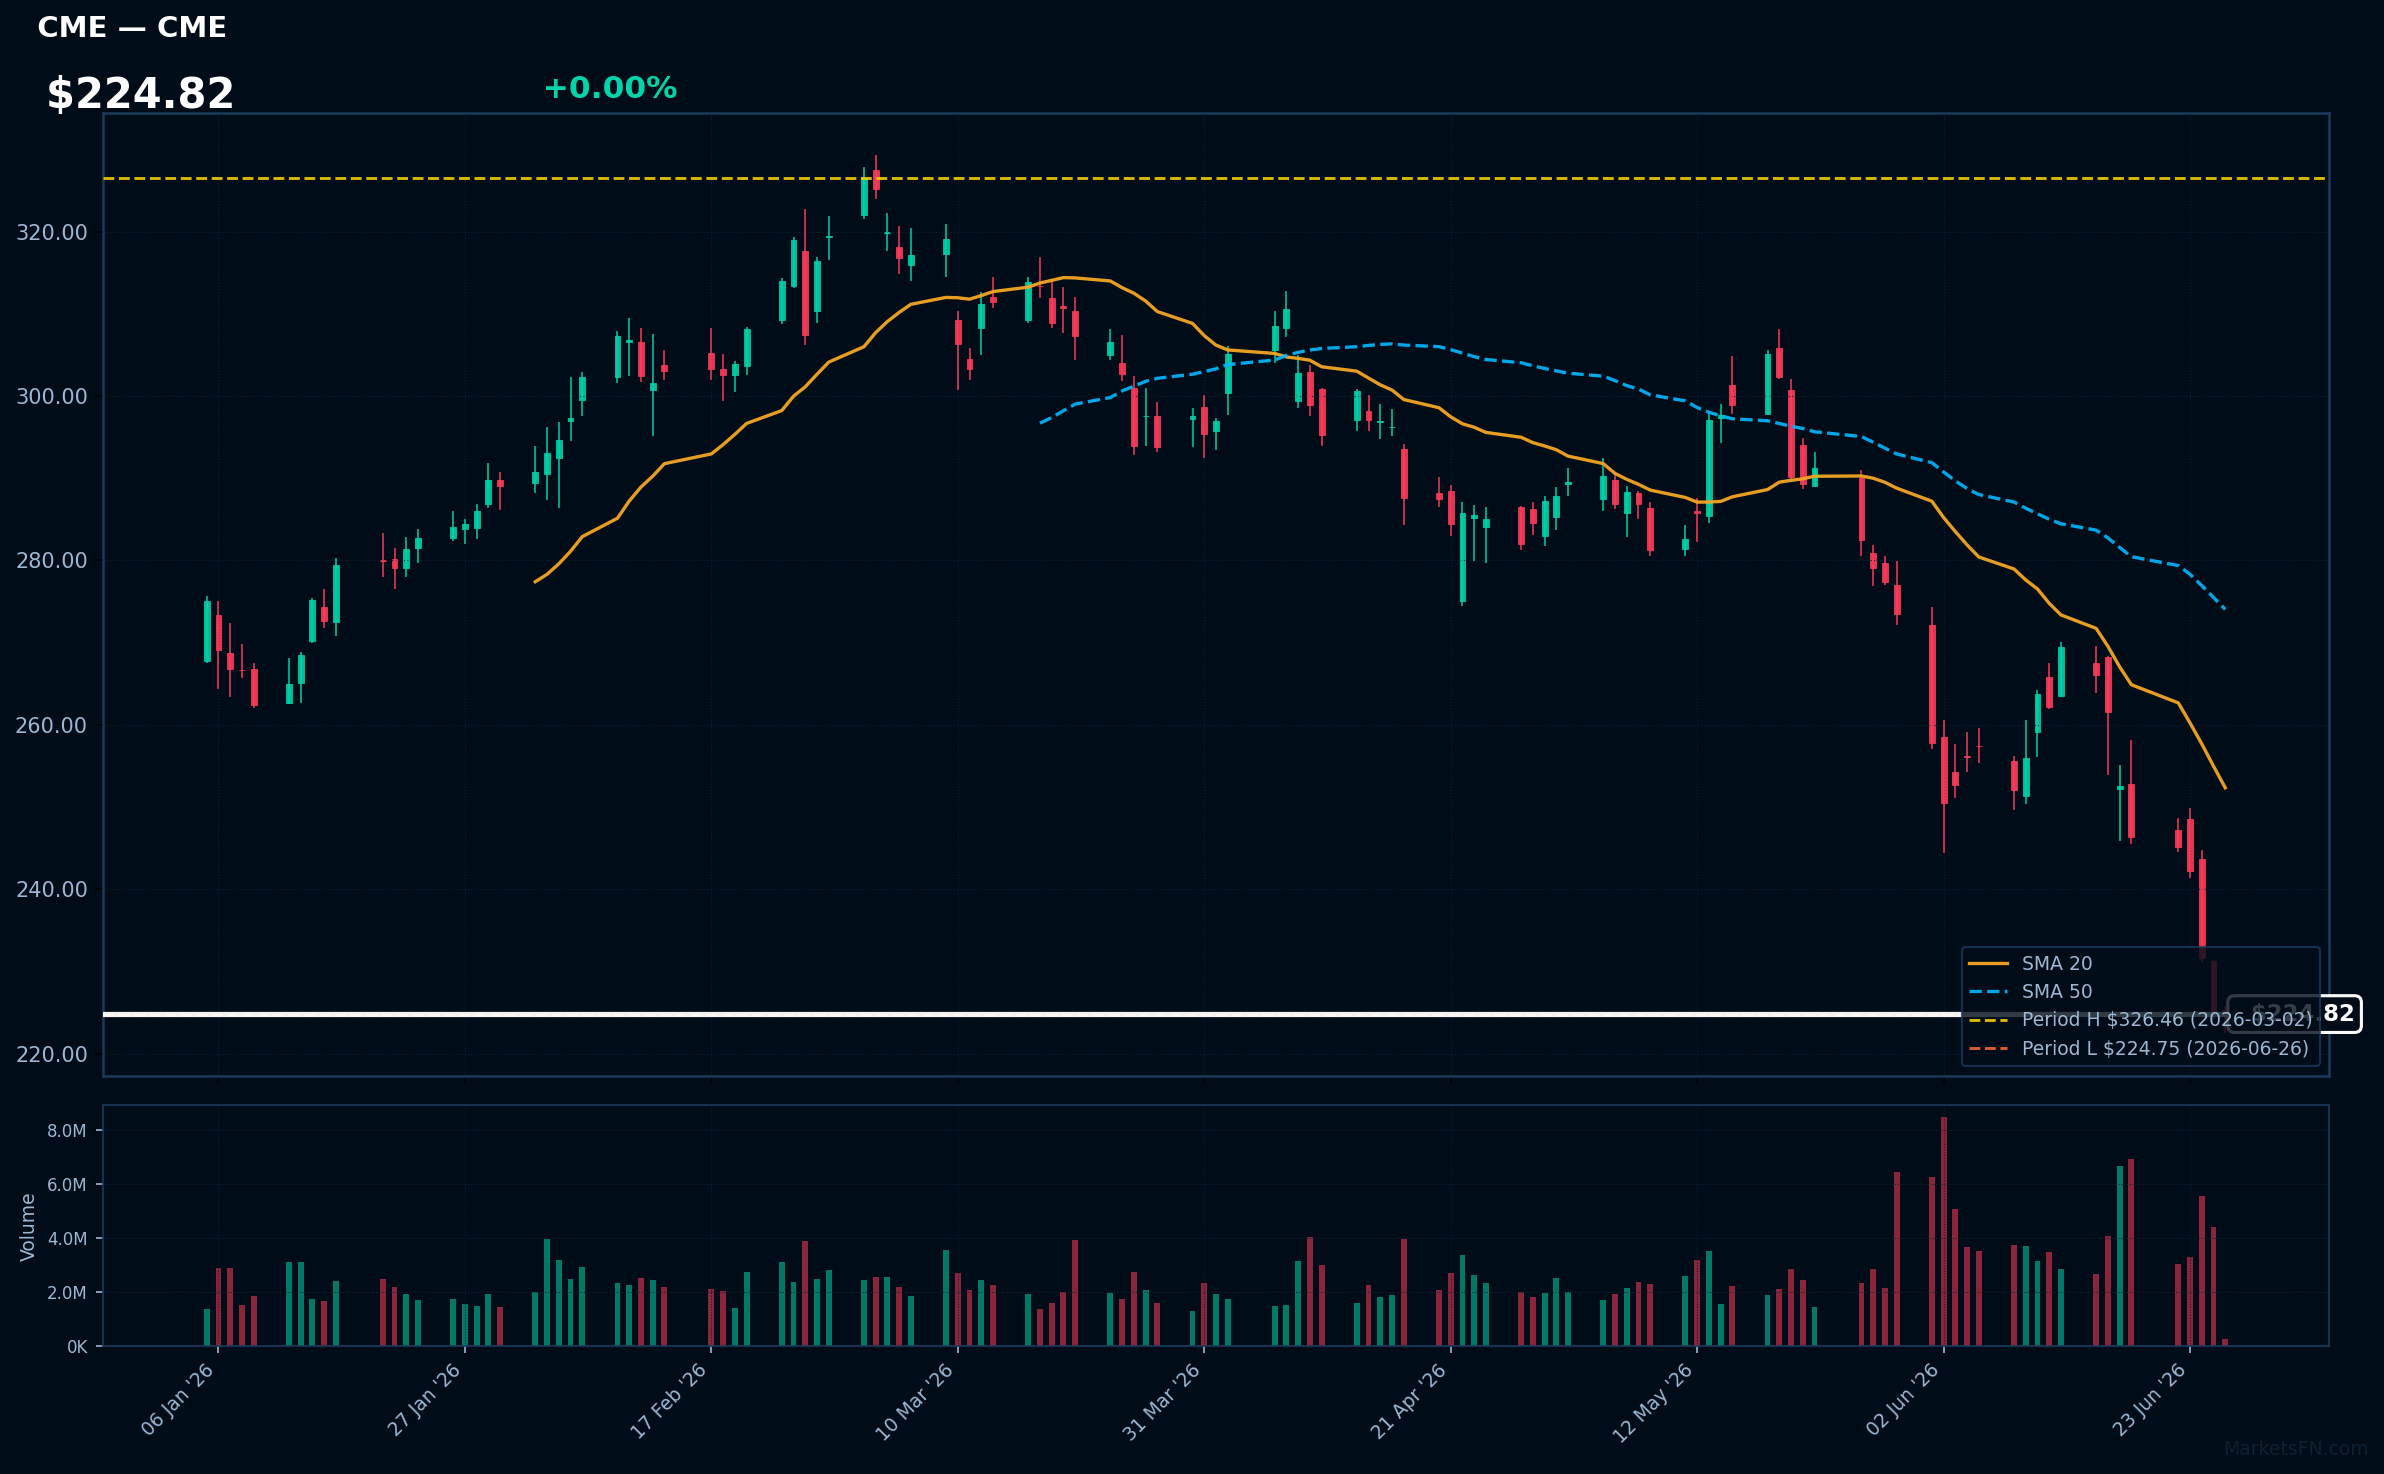
CME | CME Group Inc | Financial | Price Last: $224.75 | % Realized: -17.62% | RSI: 23.3 | % above MA200: -20.0% | Trend: Below MA20, MA50, MA200
CME Group Inc operates global derivatives markets, facilitating risk management and price discovery for commodities, interest rates, and equities through exchange-traded futures and options; investors care due to its critical role in global financial infrastructure and associated revenue streams.
CME is in a sustained downtrend with price ($224.82) below MA20, MA50, and MA200; RSI(14) at 23.3 indicates oversold conditions, and the stock is testing major support at its 52-Week low, a potential warning sign for further decline.
Related headlines
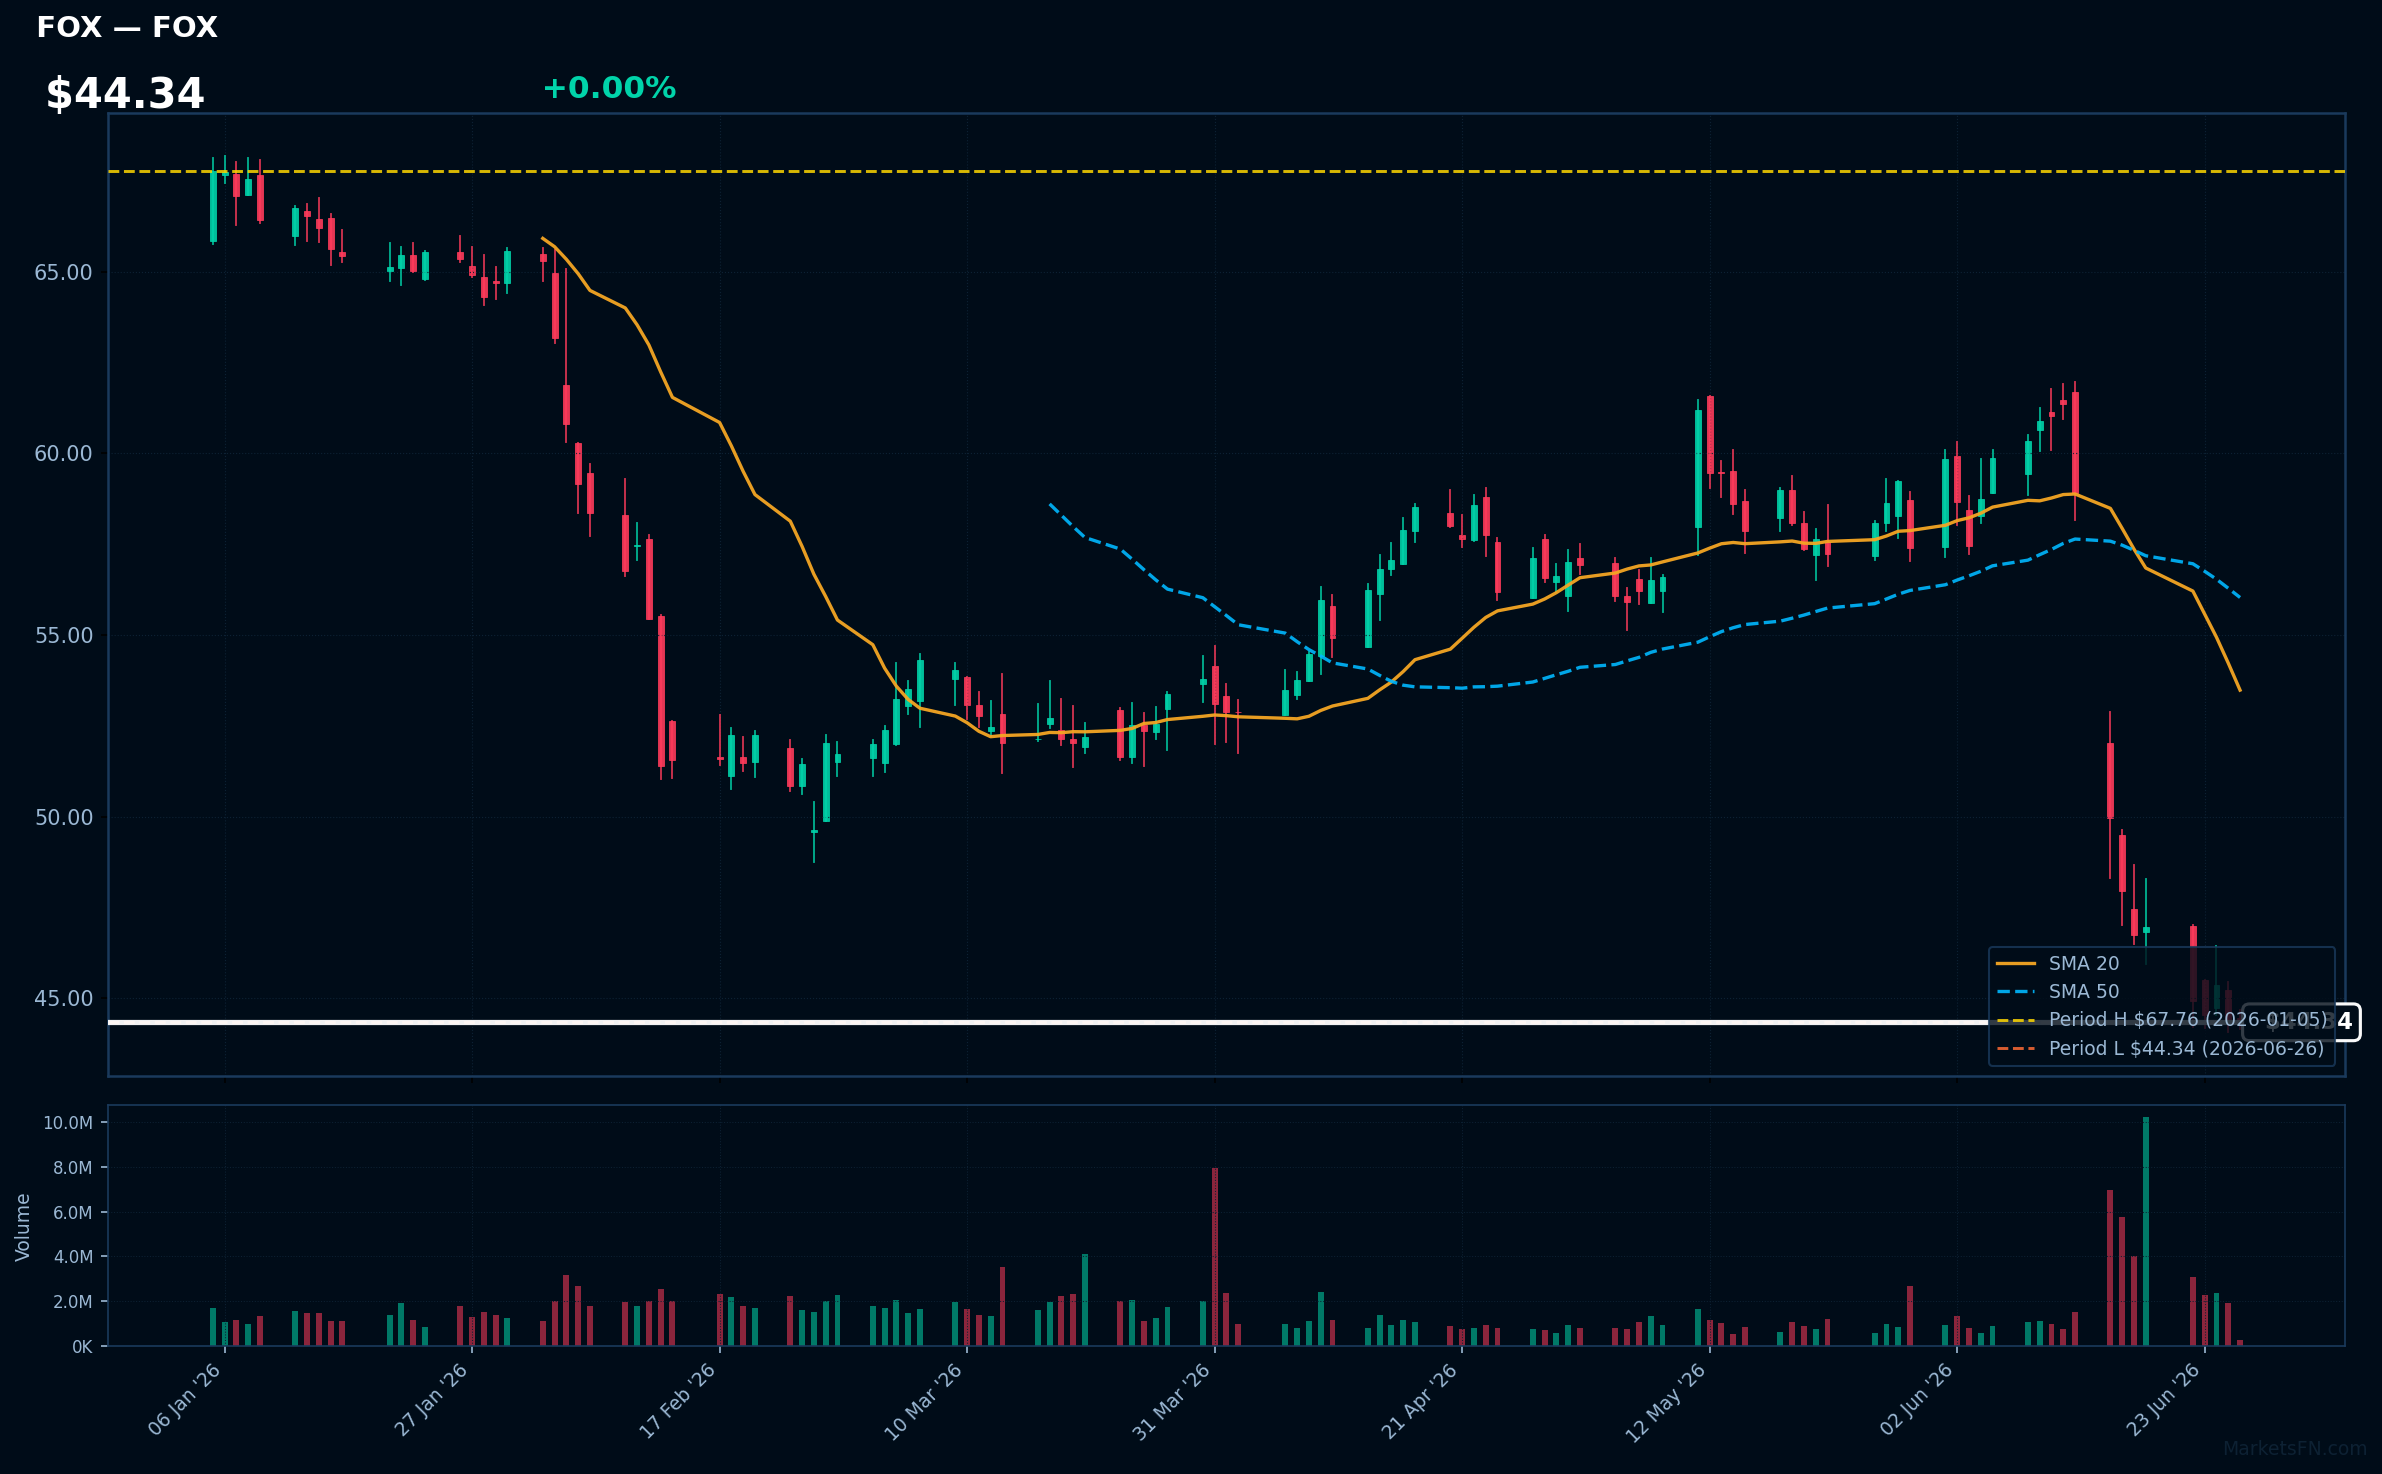
FOX | Fox Corporation | Communication Services | Price Last: $44.34 | % Realized: -15.07% | RSI: 24.9 | % above MA200: -22.4% | Trend: Below MA20, MA50, MA200
Fox Corporation is a media conglomerate with significant broadcasting and entertainment assets. Investors should care due to its influence on news dissemination and entertainment content creation, impacting advertising revenue and viewer engagement.
Fox Corporation's technicals indicate a sustained downtrend with price at $44.34, below all key MAs (MA20, MA50, MA200), and an RSI(14) of 24.9, near oversold territory, testing major support at its 52-Week low, a potential warning sign.
Related headlines
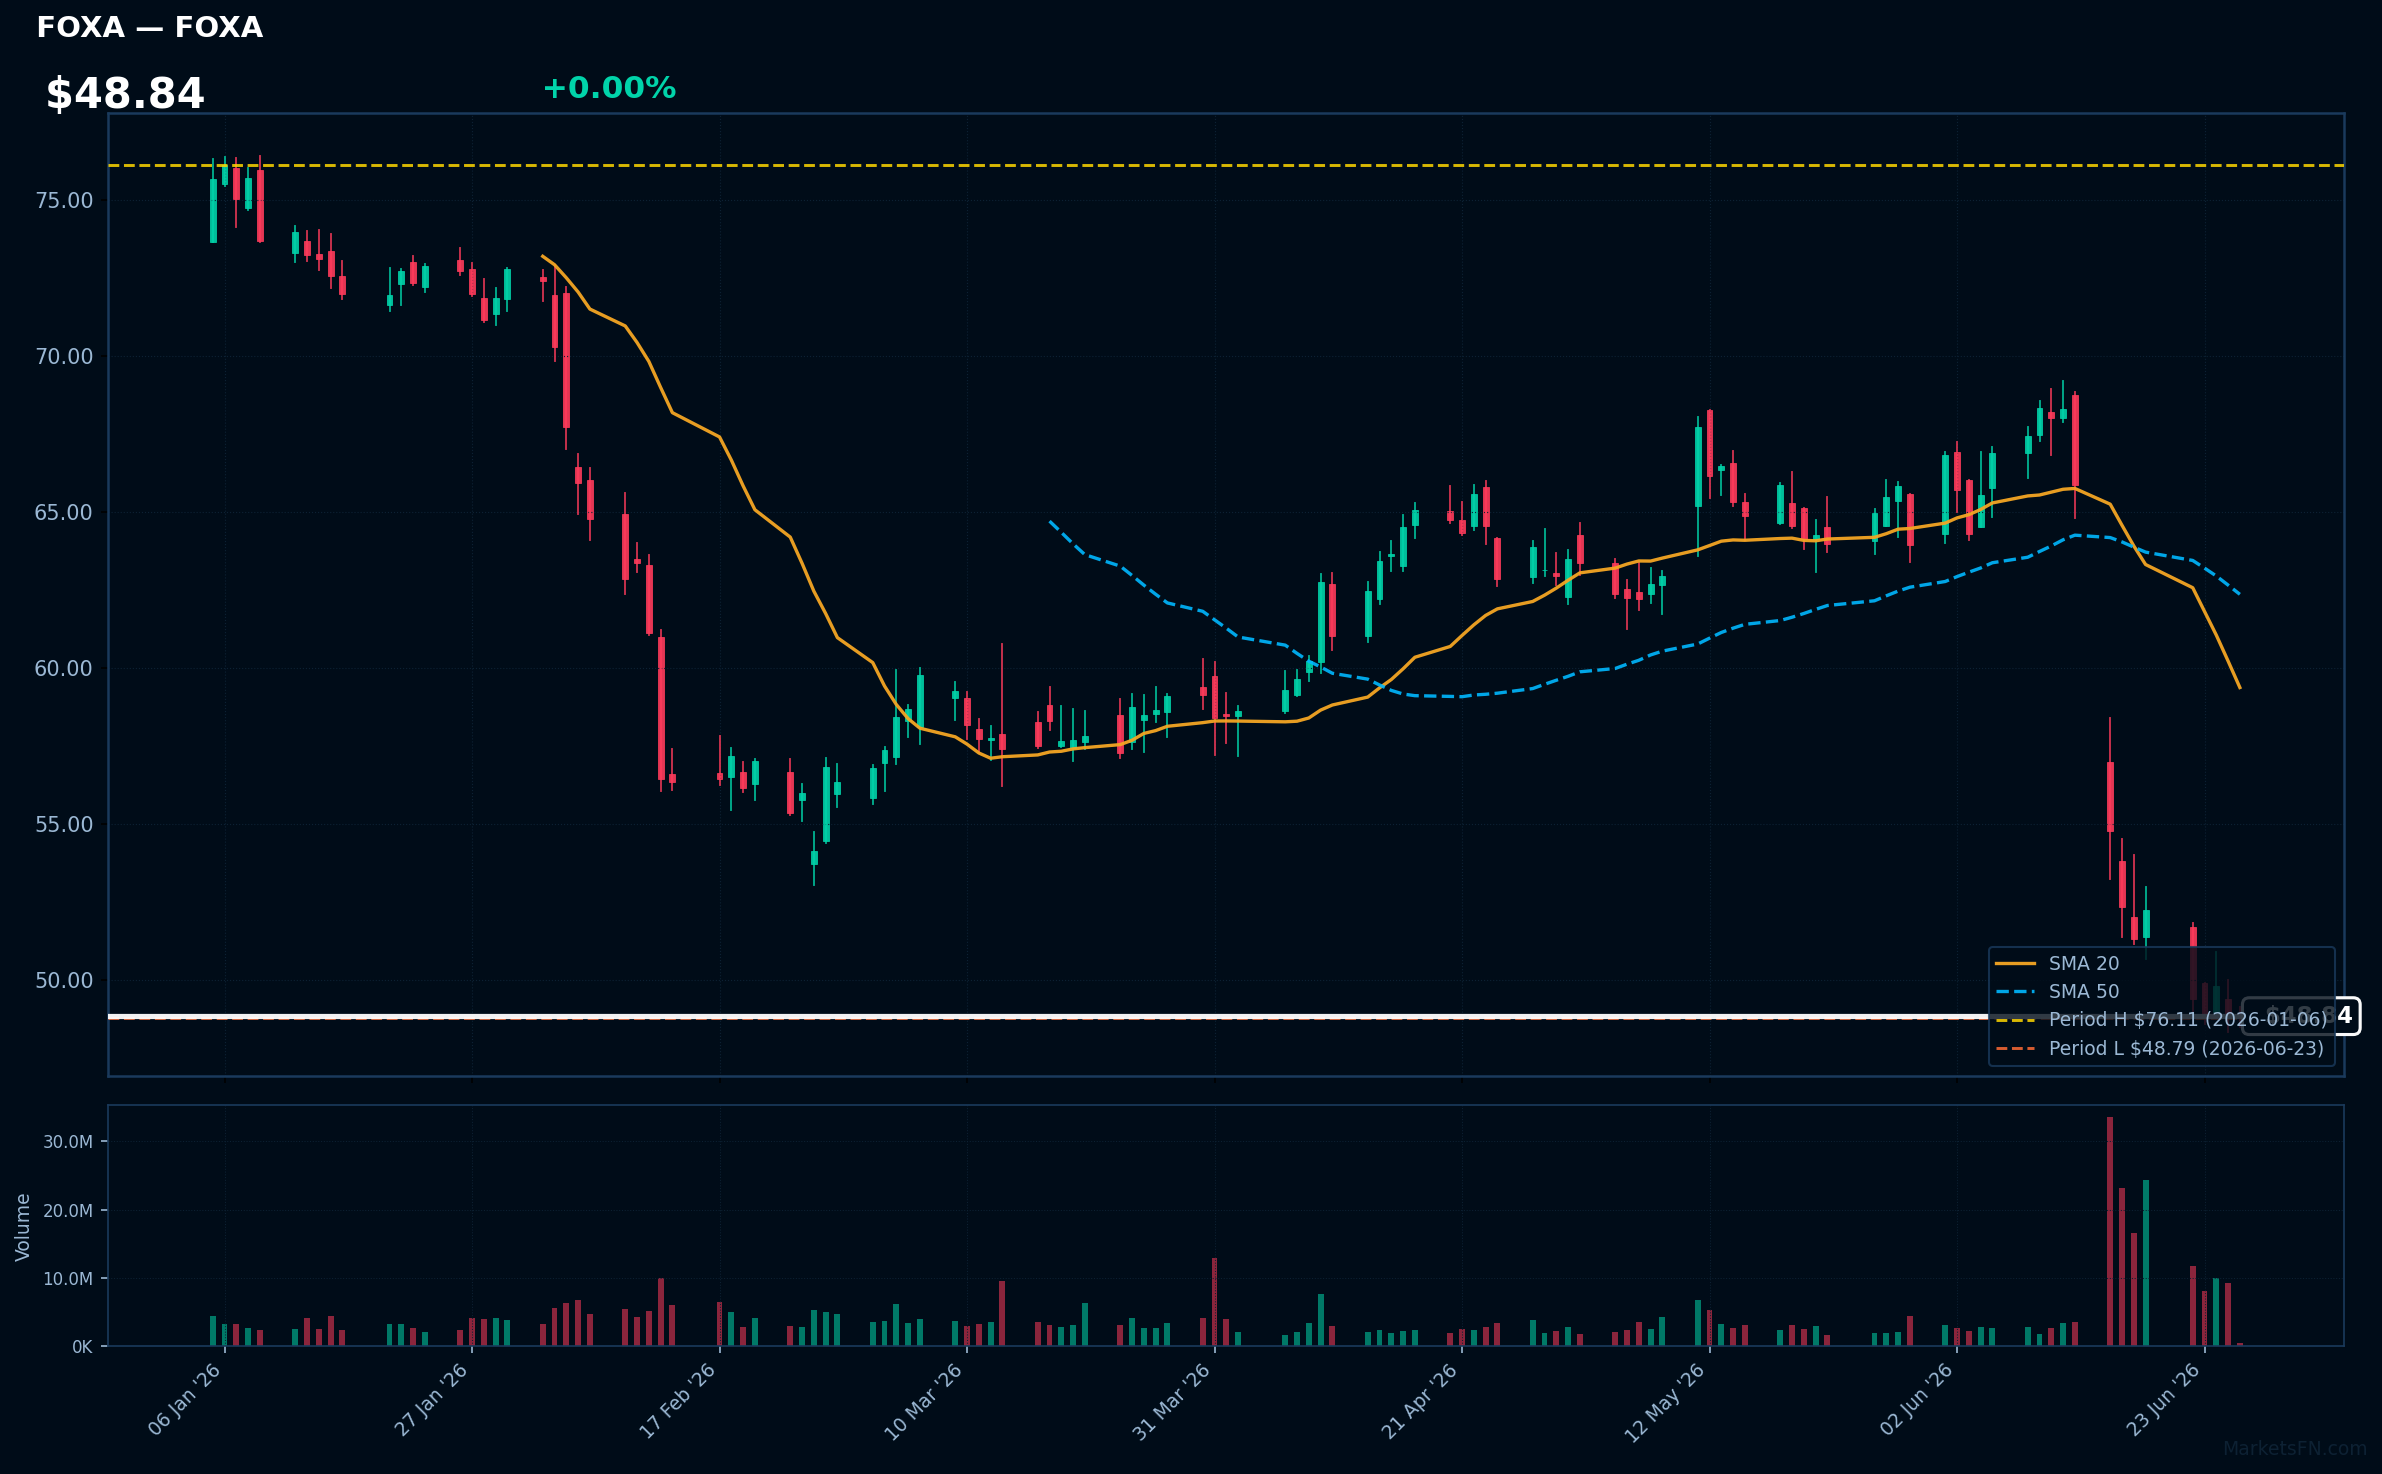
FOXA | Fox Corporation | Communication Services | Price Last: $48.81 | % Realized: -13.88% | RSI: 25.6 | % above MA200: -23.1% | Trend: Below MA20, MA50, MA200
Fox Corporation is a media conglomerate with a portfolio of news, sports, and entertainment assets, including Fox News, Fox Sports, and Fox Broadcasting Company, generating revenue primarily through advertising and affiliate fees, making it a significant player in the US media landscape.
Fox Corporation's current technical situation is bearish, with an RSI(14) of 25.6 indicating oversold conditions, and a bearish MA alignment (price < MA20 < MA50 < MA200), with the stock testing major support at its 52-Week low, a warning sign for investors.
Related headlines
- FOXA Stock Plunges To 52-Week Low: BofA Thinks It May Stay In Deal Limbo Even With A World Cup Catalyst
- Why Did CRM, INTU, FOXA Stocks Hit 52-Week Lows Last Week?
- Why Did CRM, FOXA, GLND Stocks Fall To 52-Week Lows On Tuesday?
- FOXA Stock Slides As Wall Street Weighs Risks And Rewards Of $22B Roku Deal: Retail Stays Bullish
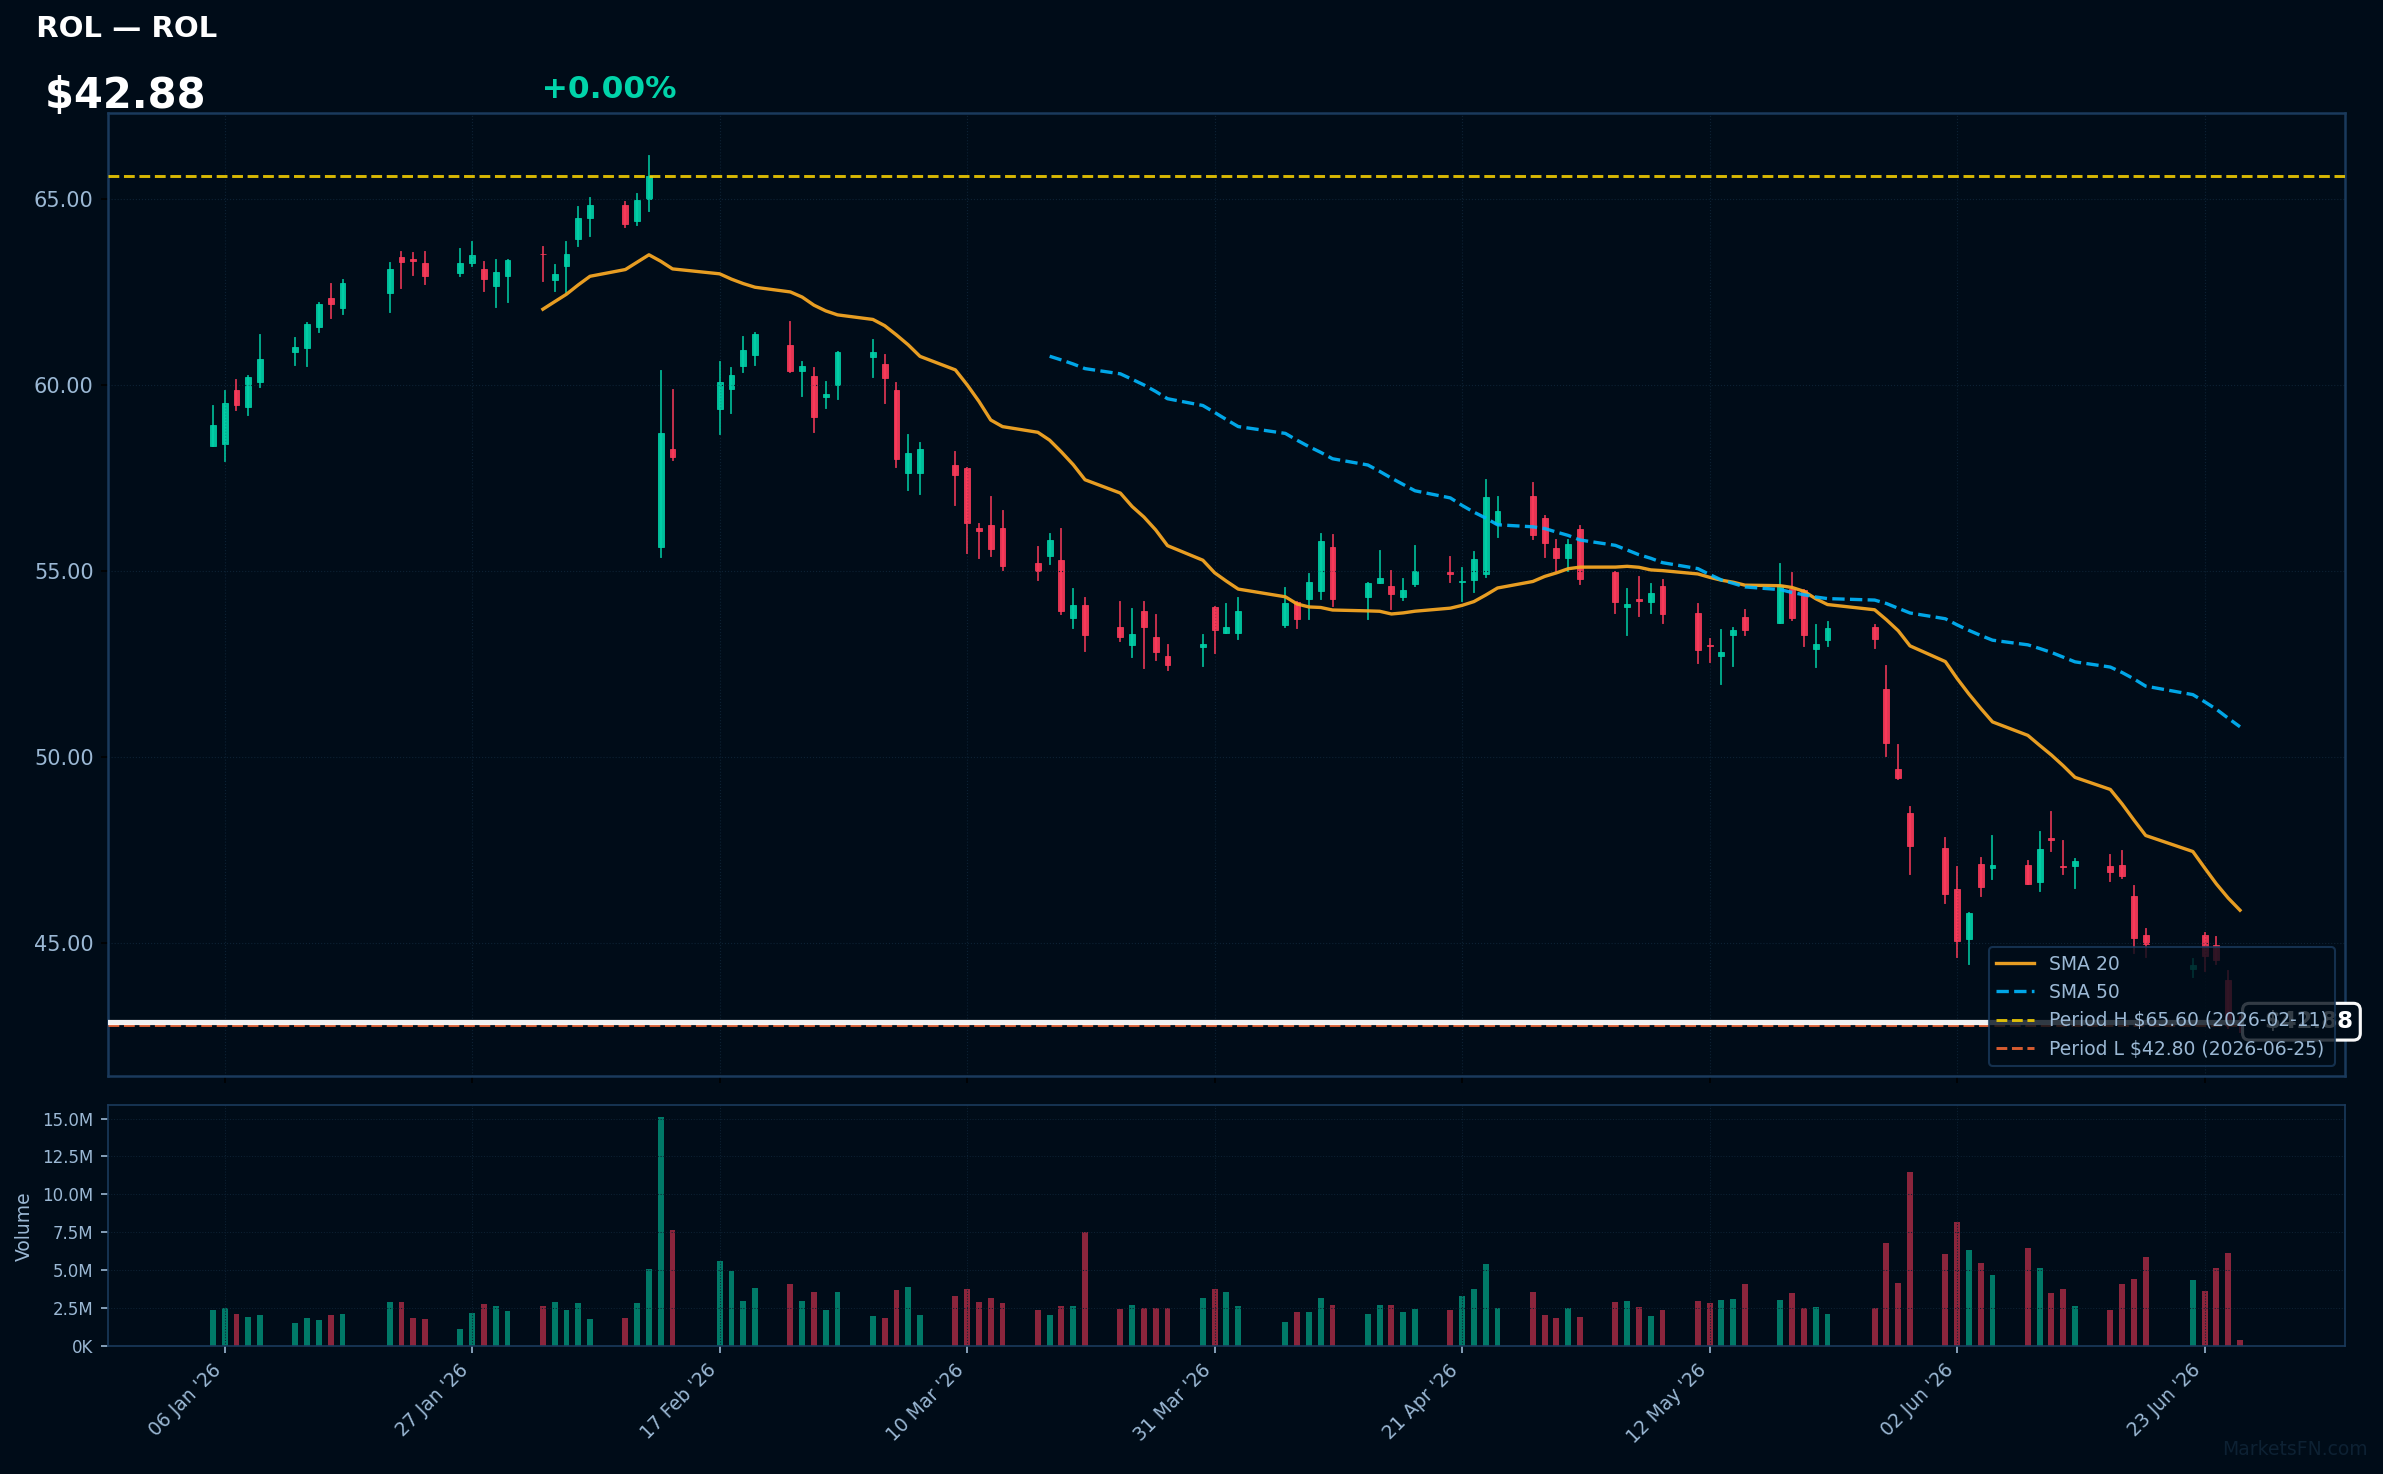
ROL | Rollins, Inc | Consumer Cyclical | Price Last: $42.87 | % Realized: -23.01% | RSI: 23.4 | % above MA200: -24.3% | Trend: Below MA20, MA50, MA200
Rollins, Inc provides pest control services through Orkin, Terminix, and other brands, generating revenue through recurring contracts and service calls. Investors should care about its steady cash flows and market share in a relatively stable industry.
Rollins, Inc is in a sustained downtrend with price ($42.88) below MA20, MA50, and MA200. The RSI(14) is 23.4, near oversold territory, and the stock is 0.2% above its 52-Week low, testing major support, indicating a potential warning sign.
Related headlines
Market Commentary
The S&P 500 stocks listed near 52-week extremes indicate a significant price movement, with some companies reaching new highs and others hitting lows. The stocks at 52-week highs, including LLY, JNJ, ABBV, UNH, and MRK, are primarily from the healthcare sector, suggesting strong performance in this industry. Conversely, stocks near 52-week lows, such as NKE, CME, FOX, FOXA, and ROL, represent diverse sectors, including consumer discretionary, financials, and services.
The concentration of healthcare stocks at 52-week highs may signal investor confidence in the sector, potentially driven by macro themes such as demographic trends, innovation, or regulatory developments. The presence of consumer discretionary and financial stocks near 52-week lows could indicate concerns about consumer spending or market volatility.
Key levels to watch include the current prices of these stocks relative to their 52-week extremes. Potential catalysts for further price movements may include earnings reports, industry trends, and broader market shifts. Investors should monitor these levels and be prepared to respond to changes in market sentiment or sector rotation.
Methodology: All 503 S&P 500 constituents screened. 52-week high = highest daily close over the past 252 trading days (approx. 1 year). 52-week low = lowest daily close over the same period. Distance = (current price / extreme − 1) × 100. Technical indicators computed on up to 1 year of daily OHLCV data.
Disclaimer: For informational purposes only. Not investment advice. Past performance is not indicative of future results.