Nasdaq 100 52-Week Highs & Lows Radar: Monster Beverage (MNST), PDD ADR (PDD) and more
· Stocks · MarketsFN Team
Nasdaq 100 52-Week Highs & Lows Radar: Monster Beverage (MNST), PDD ADR (PDD) and more
Screening all 101 Nasdaq 100 constituents for stocks nearest to their 52-week high and their 52-week low. Data as of June 26, 2026. % Realized = 52-week total return.
Legend: RSI > 70 = overbought · RSI < 30 = oversold · Green % Realized = positive 52W return · Red = negative.
📈 Nearest to 52-Week High
Sectors represented: Consumer Defensive (1), Utilities (1), Technology (1), Communication Services (1), Healthcare (1)
| Ticker | Company | Sector | Price Last | % Realized | 52-Week High Date | RSI | % above MA200 | Trend |
|---|---|---|---|---|---|---|---|---|
| MNST | Monster Beverage Corp | Consumer Defensive | $96.99 | +55.95% | 2026-06-26 | 75.8 | +26.1% | Above MA20, MA50, MA200 |
| AEP | American Electric Power Company Inc | Utilities | $138.07 | +34.89% | 2026-06-26 | 69.1 | +11.7% | Above MA20, MA50, MA200 |
| FTNT | Fortinet Inc | Technology | $150.89 | +45.28% | 2026-06-26 | 67.2 | +64.7% | Above MA20, MA50, MA200 |
| EA | Electronic Arts, Inc | Communication Services | $205.01 | +29.97% | 2026-06-26 | 68.7 | +2.4% | Above MA20, MA50, MA200 |
| BIIB | Biogen Inc | Healthcare | $212.67 | +67.56% | 2026-06-26 | 67.3 | +20.7% | Above MA20, MA50, MA200 |
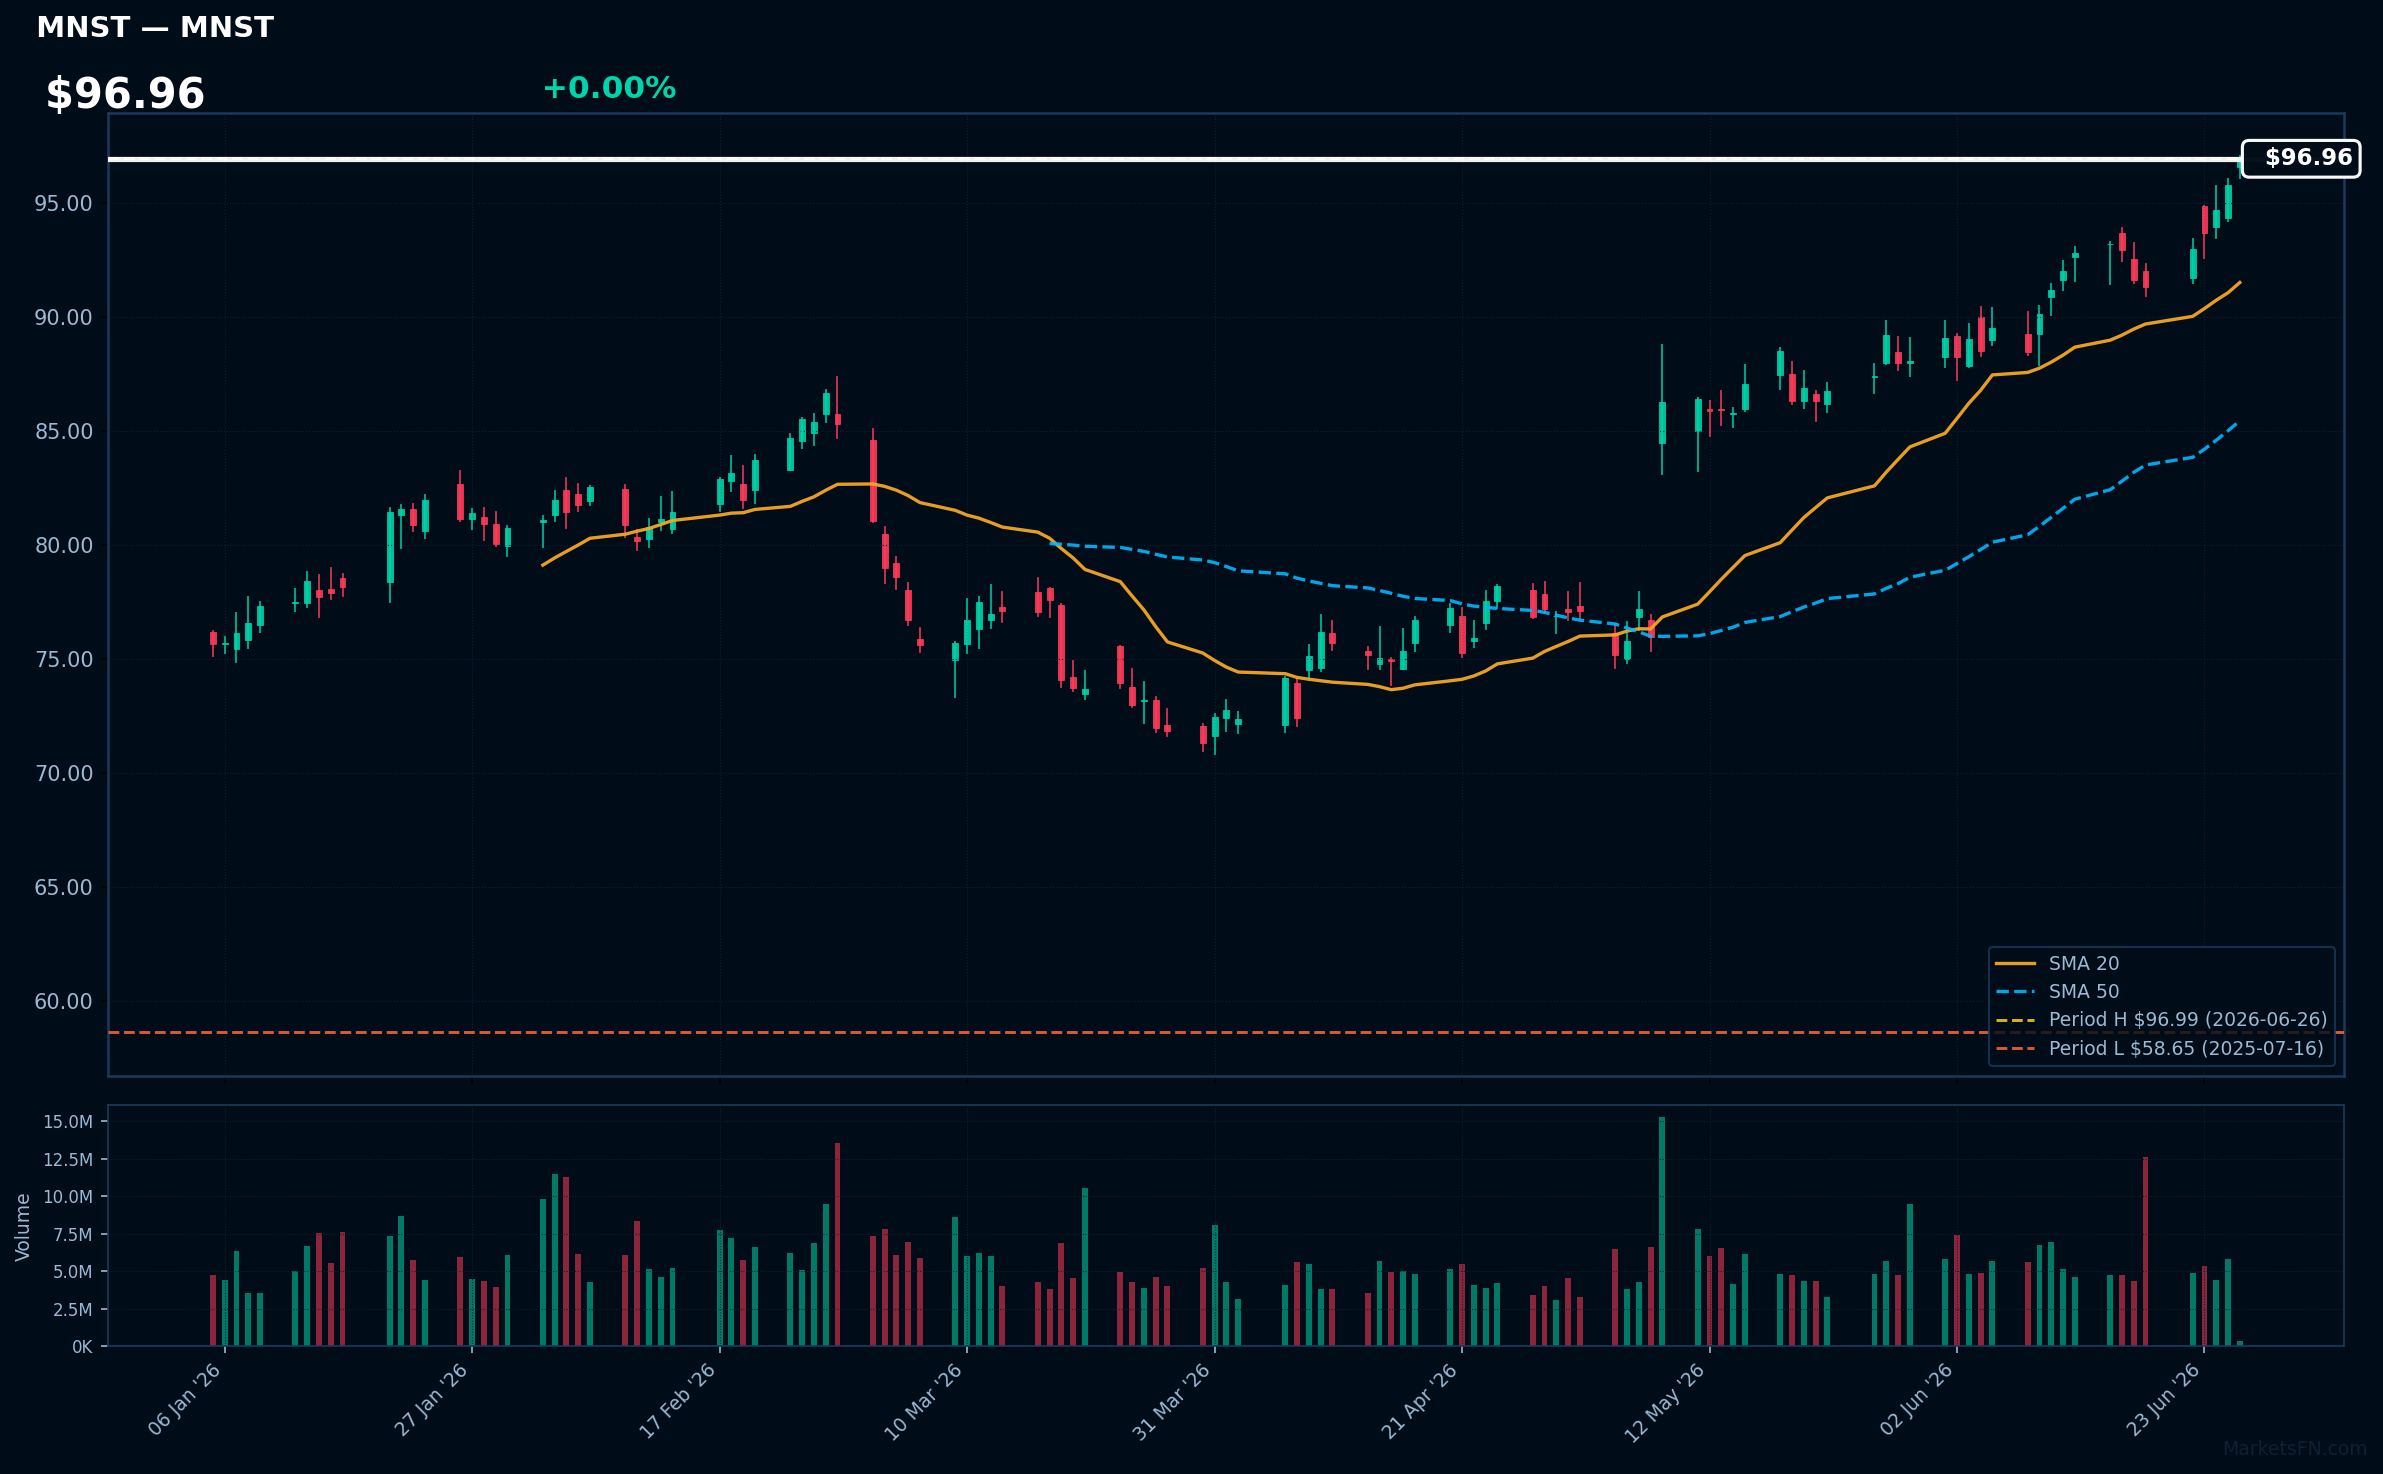
MNST | Monster Beverage Corp | Consumer Defensive | Price Last: $96.99 | % Realized: +55.95% | RSI: 75.8 | % above MA200: +26.1% | Trend: Above MA20, MA50, MA200
Monster Beverage Corp is a leading energy drink manufacturer with popular brands like Monster Energy. Investors should care due to its strong brand portfolio and growth potential in the energy drink market.
The stock shows bullish momentum with RSI(14) at 75.8, price > MA20 > MA50 > MA200, and is 0.0% below its 52-Week high, indicating a potential breakout. The 55.9% 52-Week return reinforces this uptrend.
Related headlines
- Massive Gap-Up Propels This Monster To Record High. These Clues Point To More Gains Ahead.
- Monster Beverage Announces Participation in dbAccess Global Consumer Conference 2026
- Dow Jones Leader Amazon, AI Stock Quanta, Monster Beverage In Or Near Buy Zones
- See How Institutions Drive Monster Beverage Shares Higher
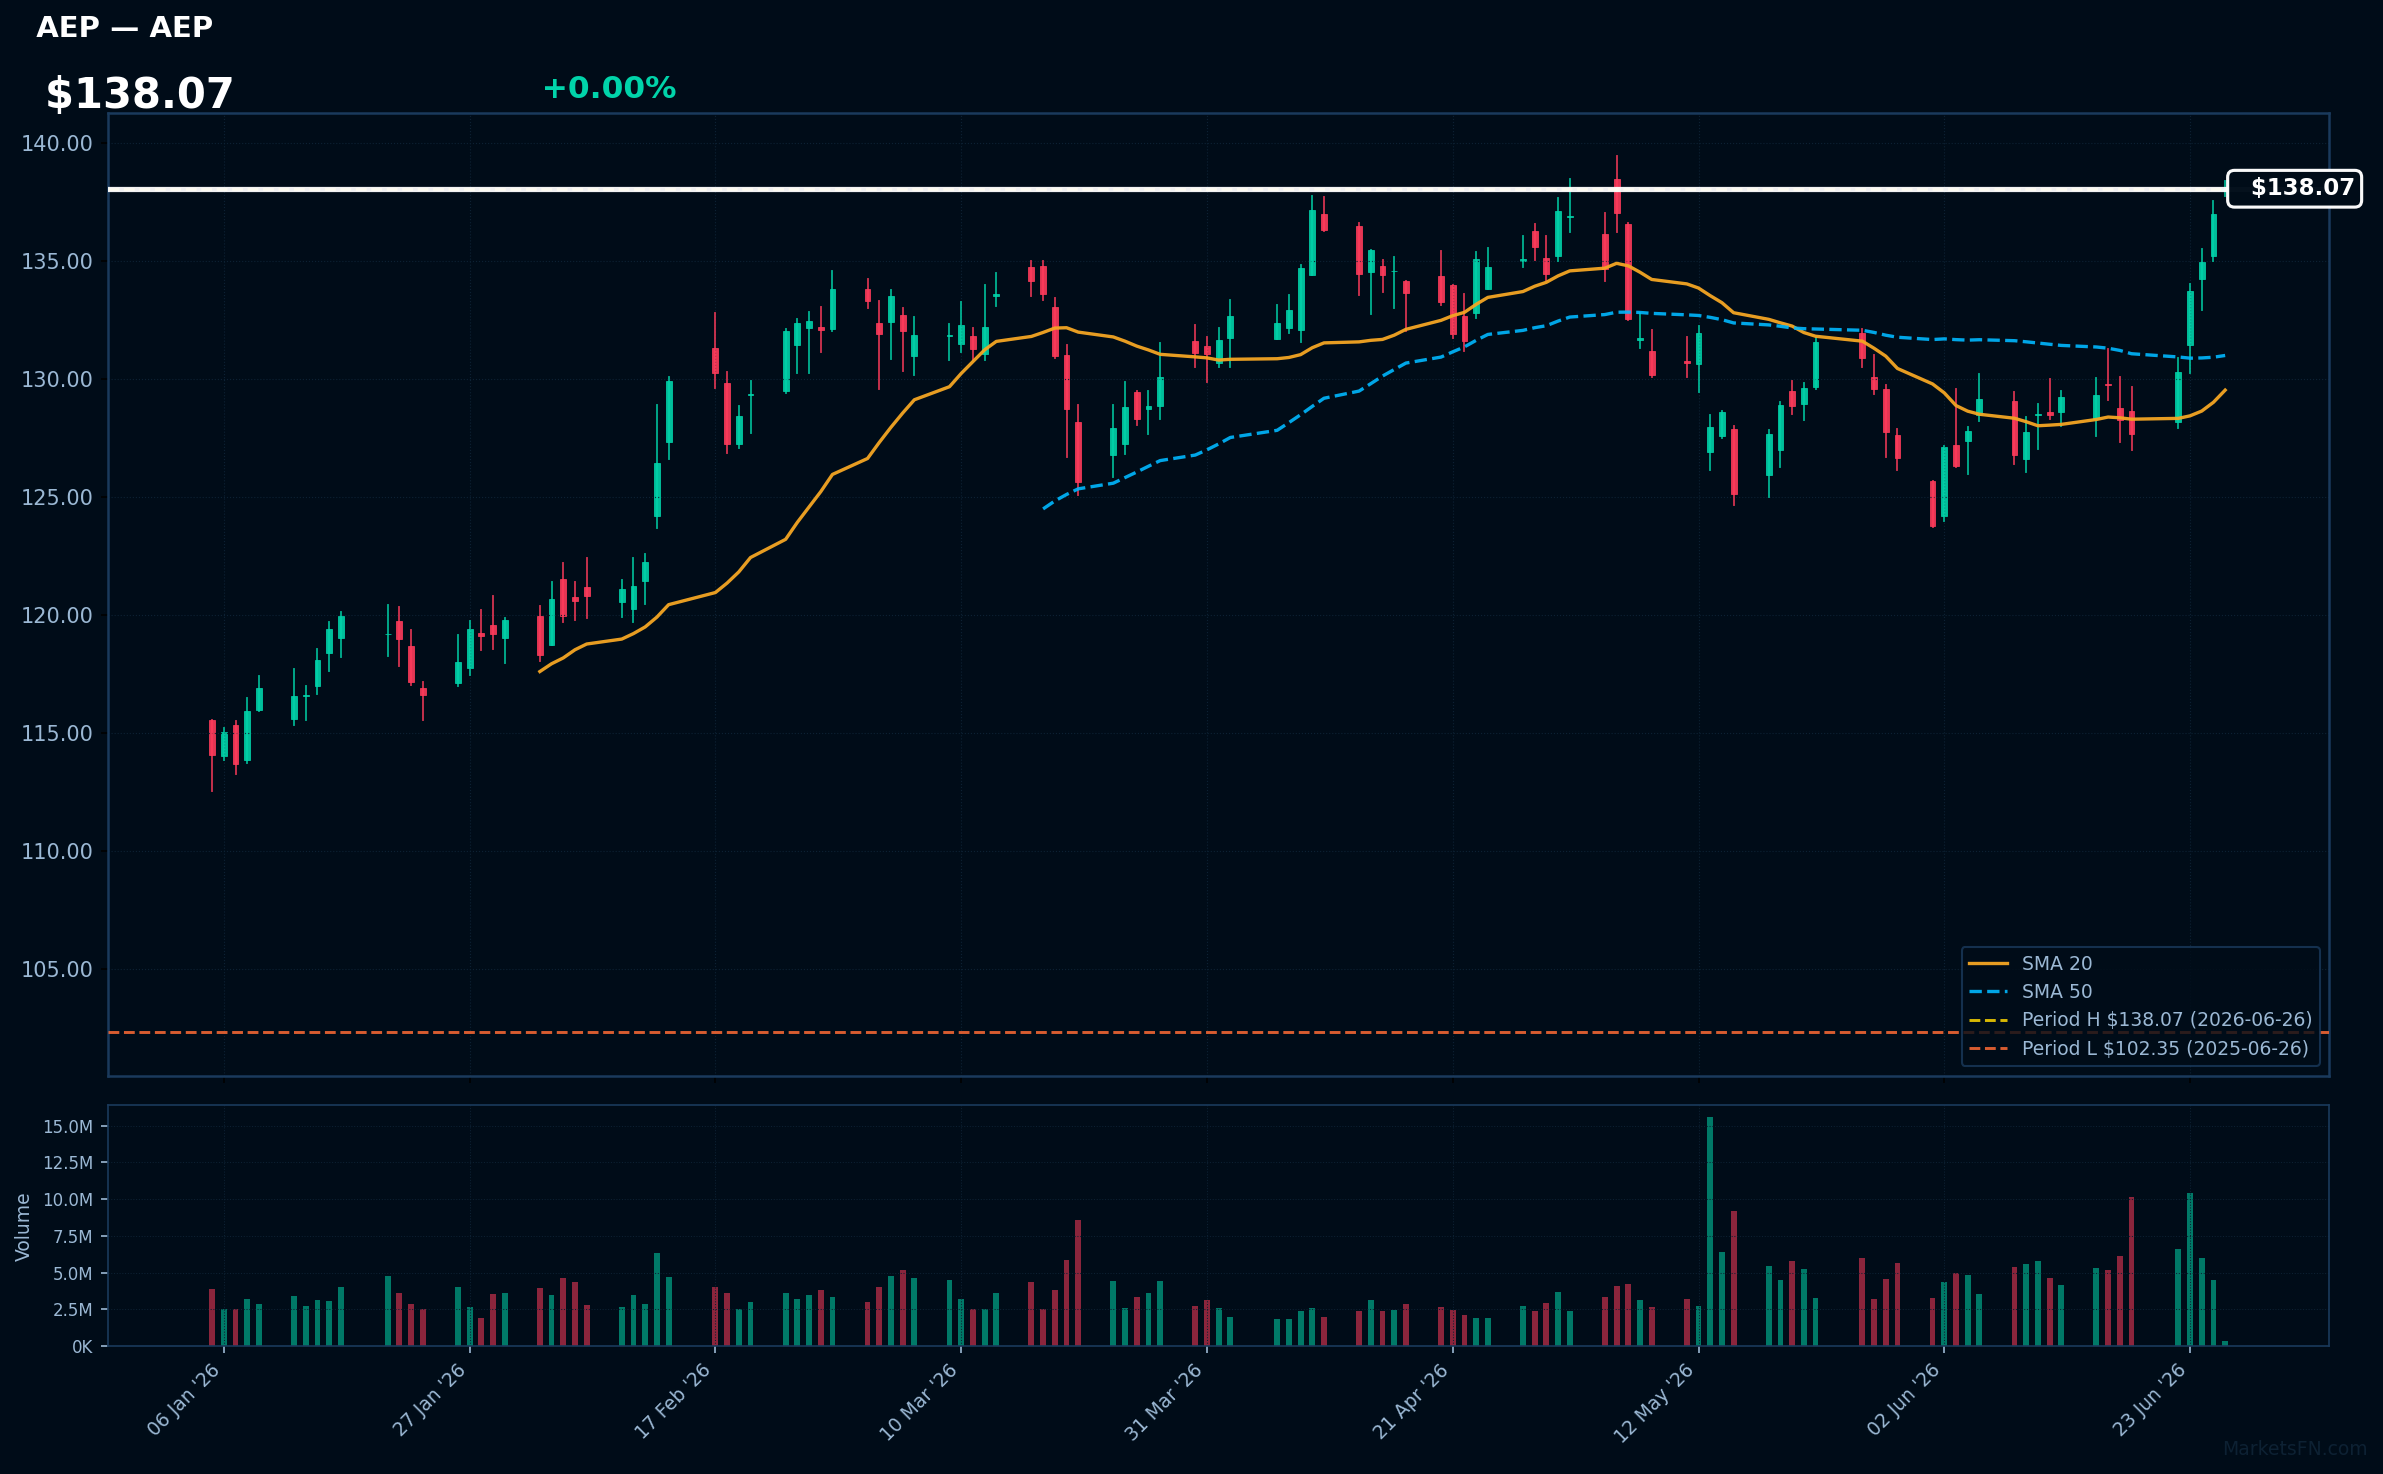
AEP | American Electric Power Company Inc | Utilities | Price Last: $138.07 | % Realized: +34.89% | RSI: 69.1 | % above MA200: +11.7% | Trend: Above MA20, MA50, MA200
American Electric Power Company Inc is a utility holding company that generates, transmits, and distributes electricity to approximately 5.5 million customers across 11 states, providing a stable source of income through regulated operations.
AEP's current technical situation indicates momentum, with an RSI(14) of 69.1 and price above MA20, MA50, and MA200, nearing a breakout at 0.0% below its 52-Week high, having delivered a 34.9% 52-Week return.
Related headlines
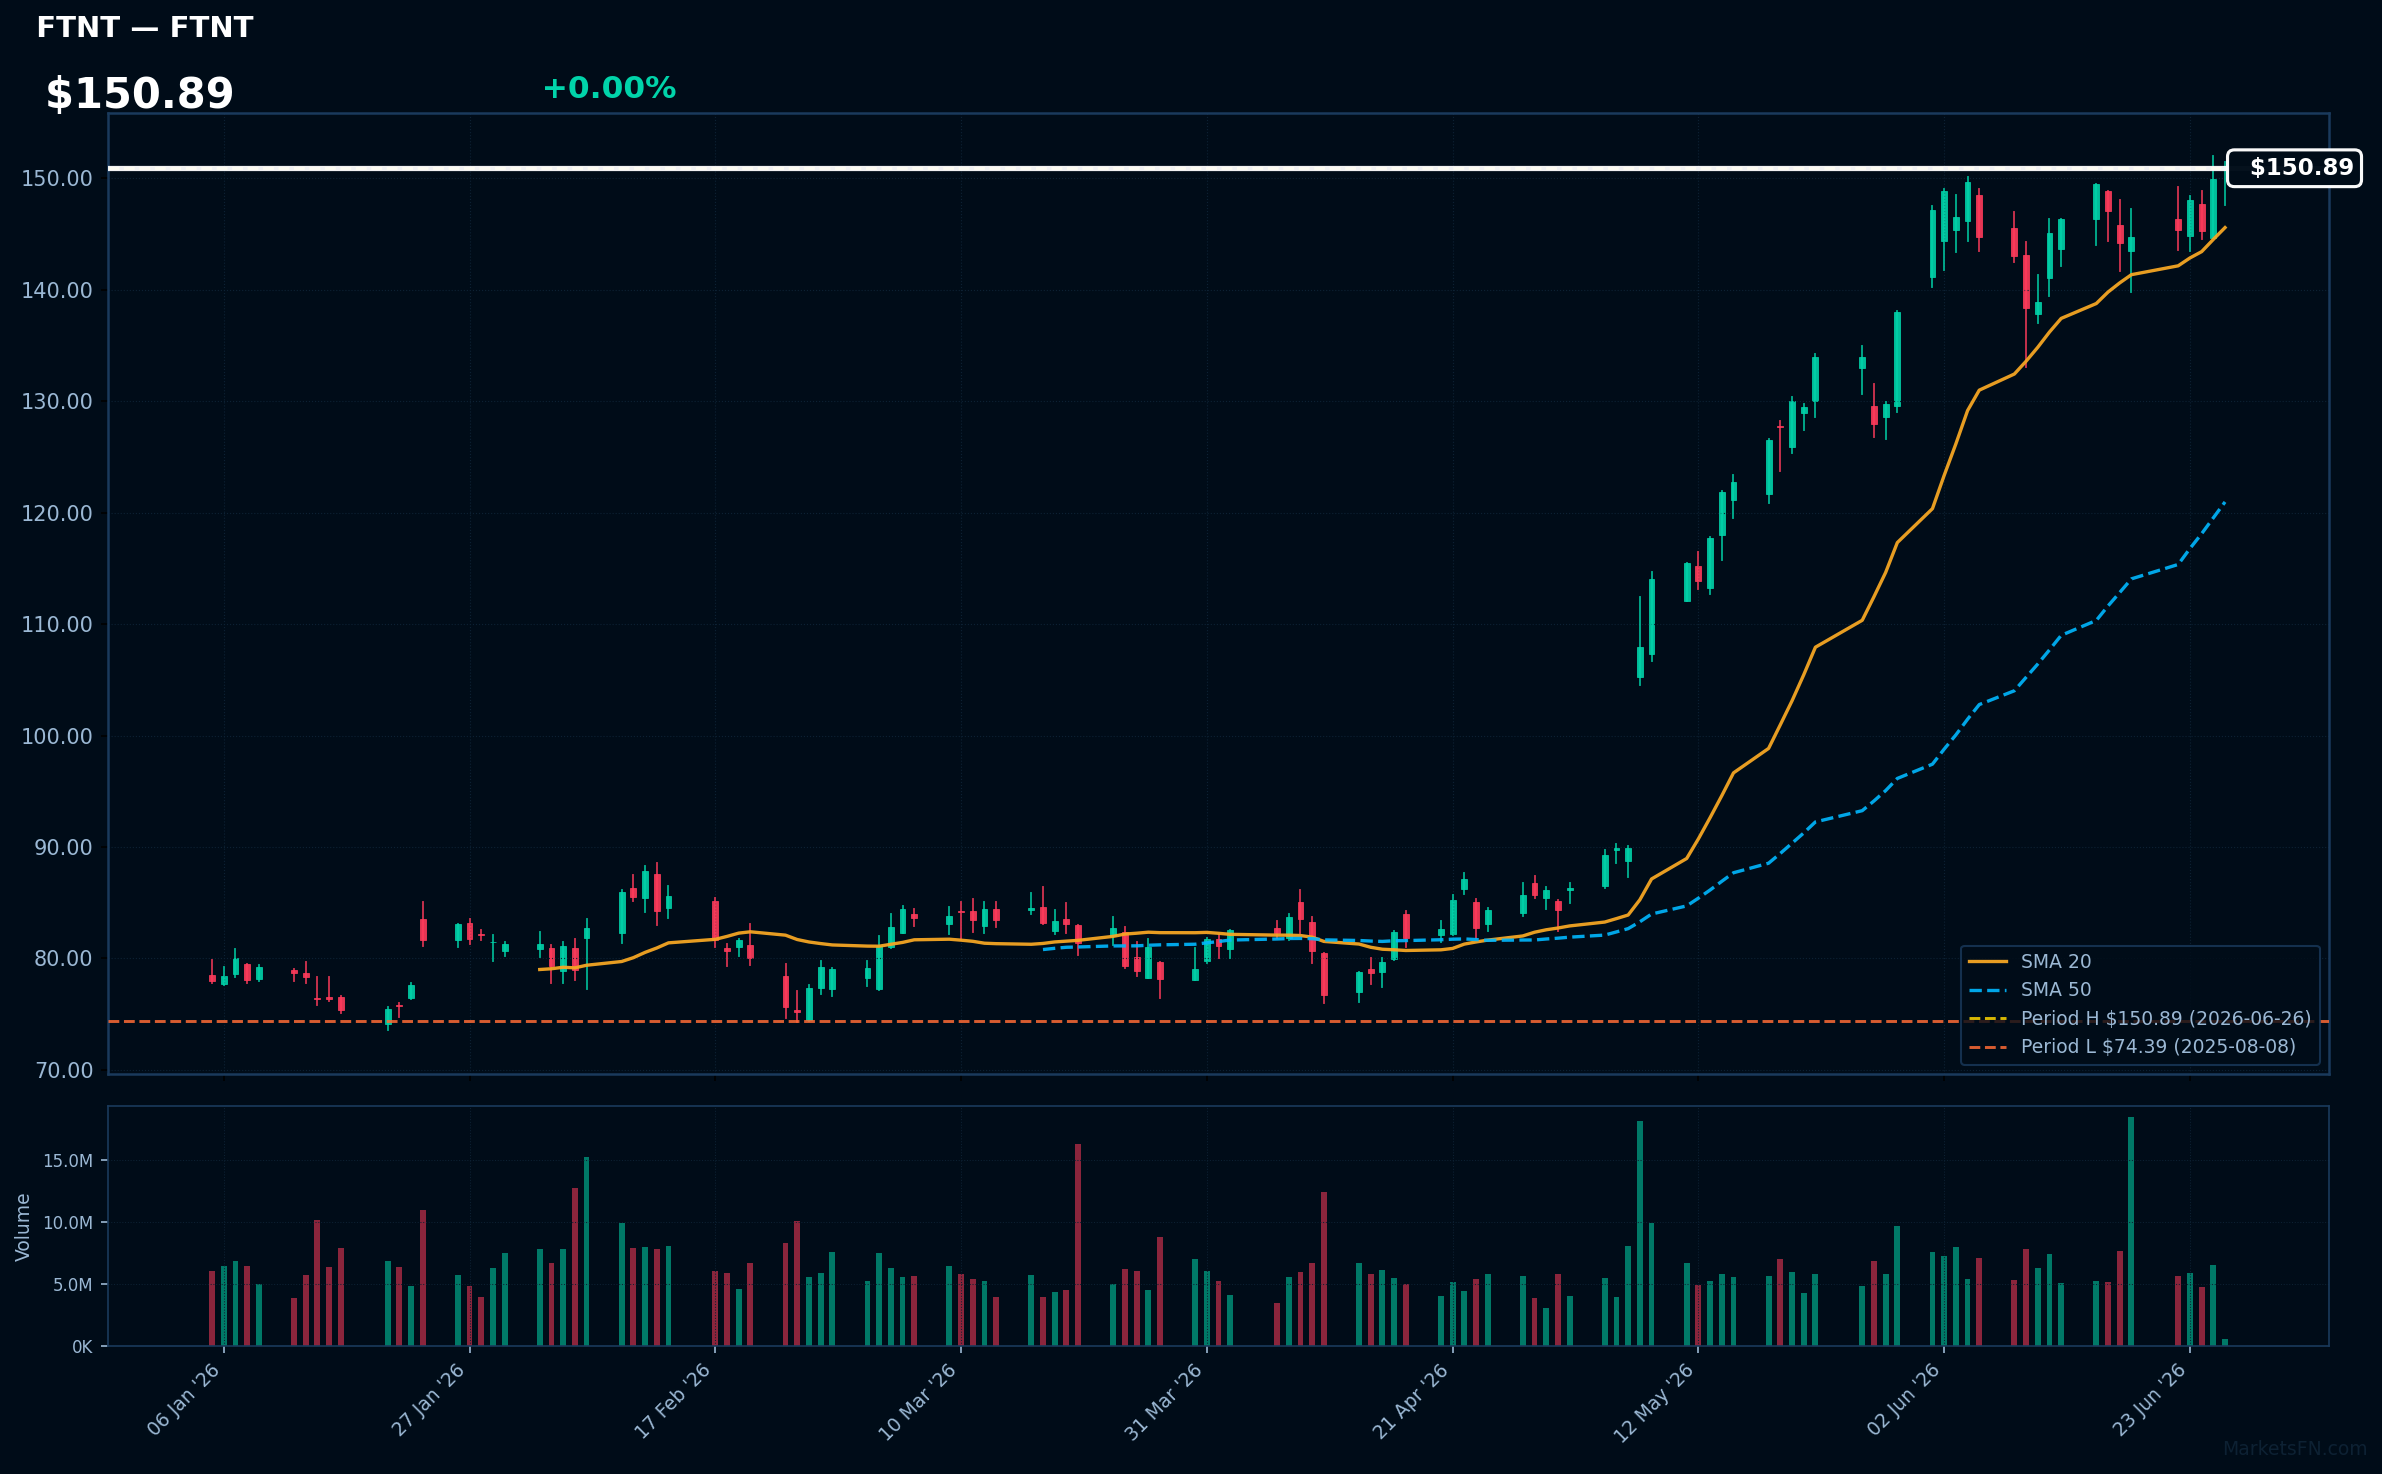
FTNT | Fortinet Inc | Technology | Price Last: $150.89 | % Realized: +45.28% | RSI: 67.2 | % above MA200: +64.7% | Trend: Above MA20, MA50, MA200
Fortinet Inc (FTNT) is a cybersecurity company providing network security solutions, including firewalls and threat intelligence services, to protect businesses from cyber threats. Investors should care as its solutions are critical in an increasingly threat-prone digital landscape.
Fortinet Inc's current technical situation indicates strong momentum, with RSI(14) at 67.2, price above MA20, MA50, and MA200, and a 52-Week return of 45.3%. The stock is 0.0% below its 52-Week high, nearing a potential breakout.
Related headlines
- Fortinet, IBD Stock Of The Day, Gets Network Firewall Boost From AI Data Centers
- Fortinet Appoints Public Sector Leader and Tech Executive Derek Kan to Its Board of Directors
- Fortinet Launches FortiSOC, a Unified SOC Platform Powered by Agentic AI
- Fortinet Inc. stock outperforms competitors on strong trading day
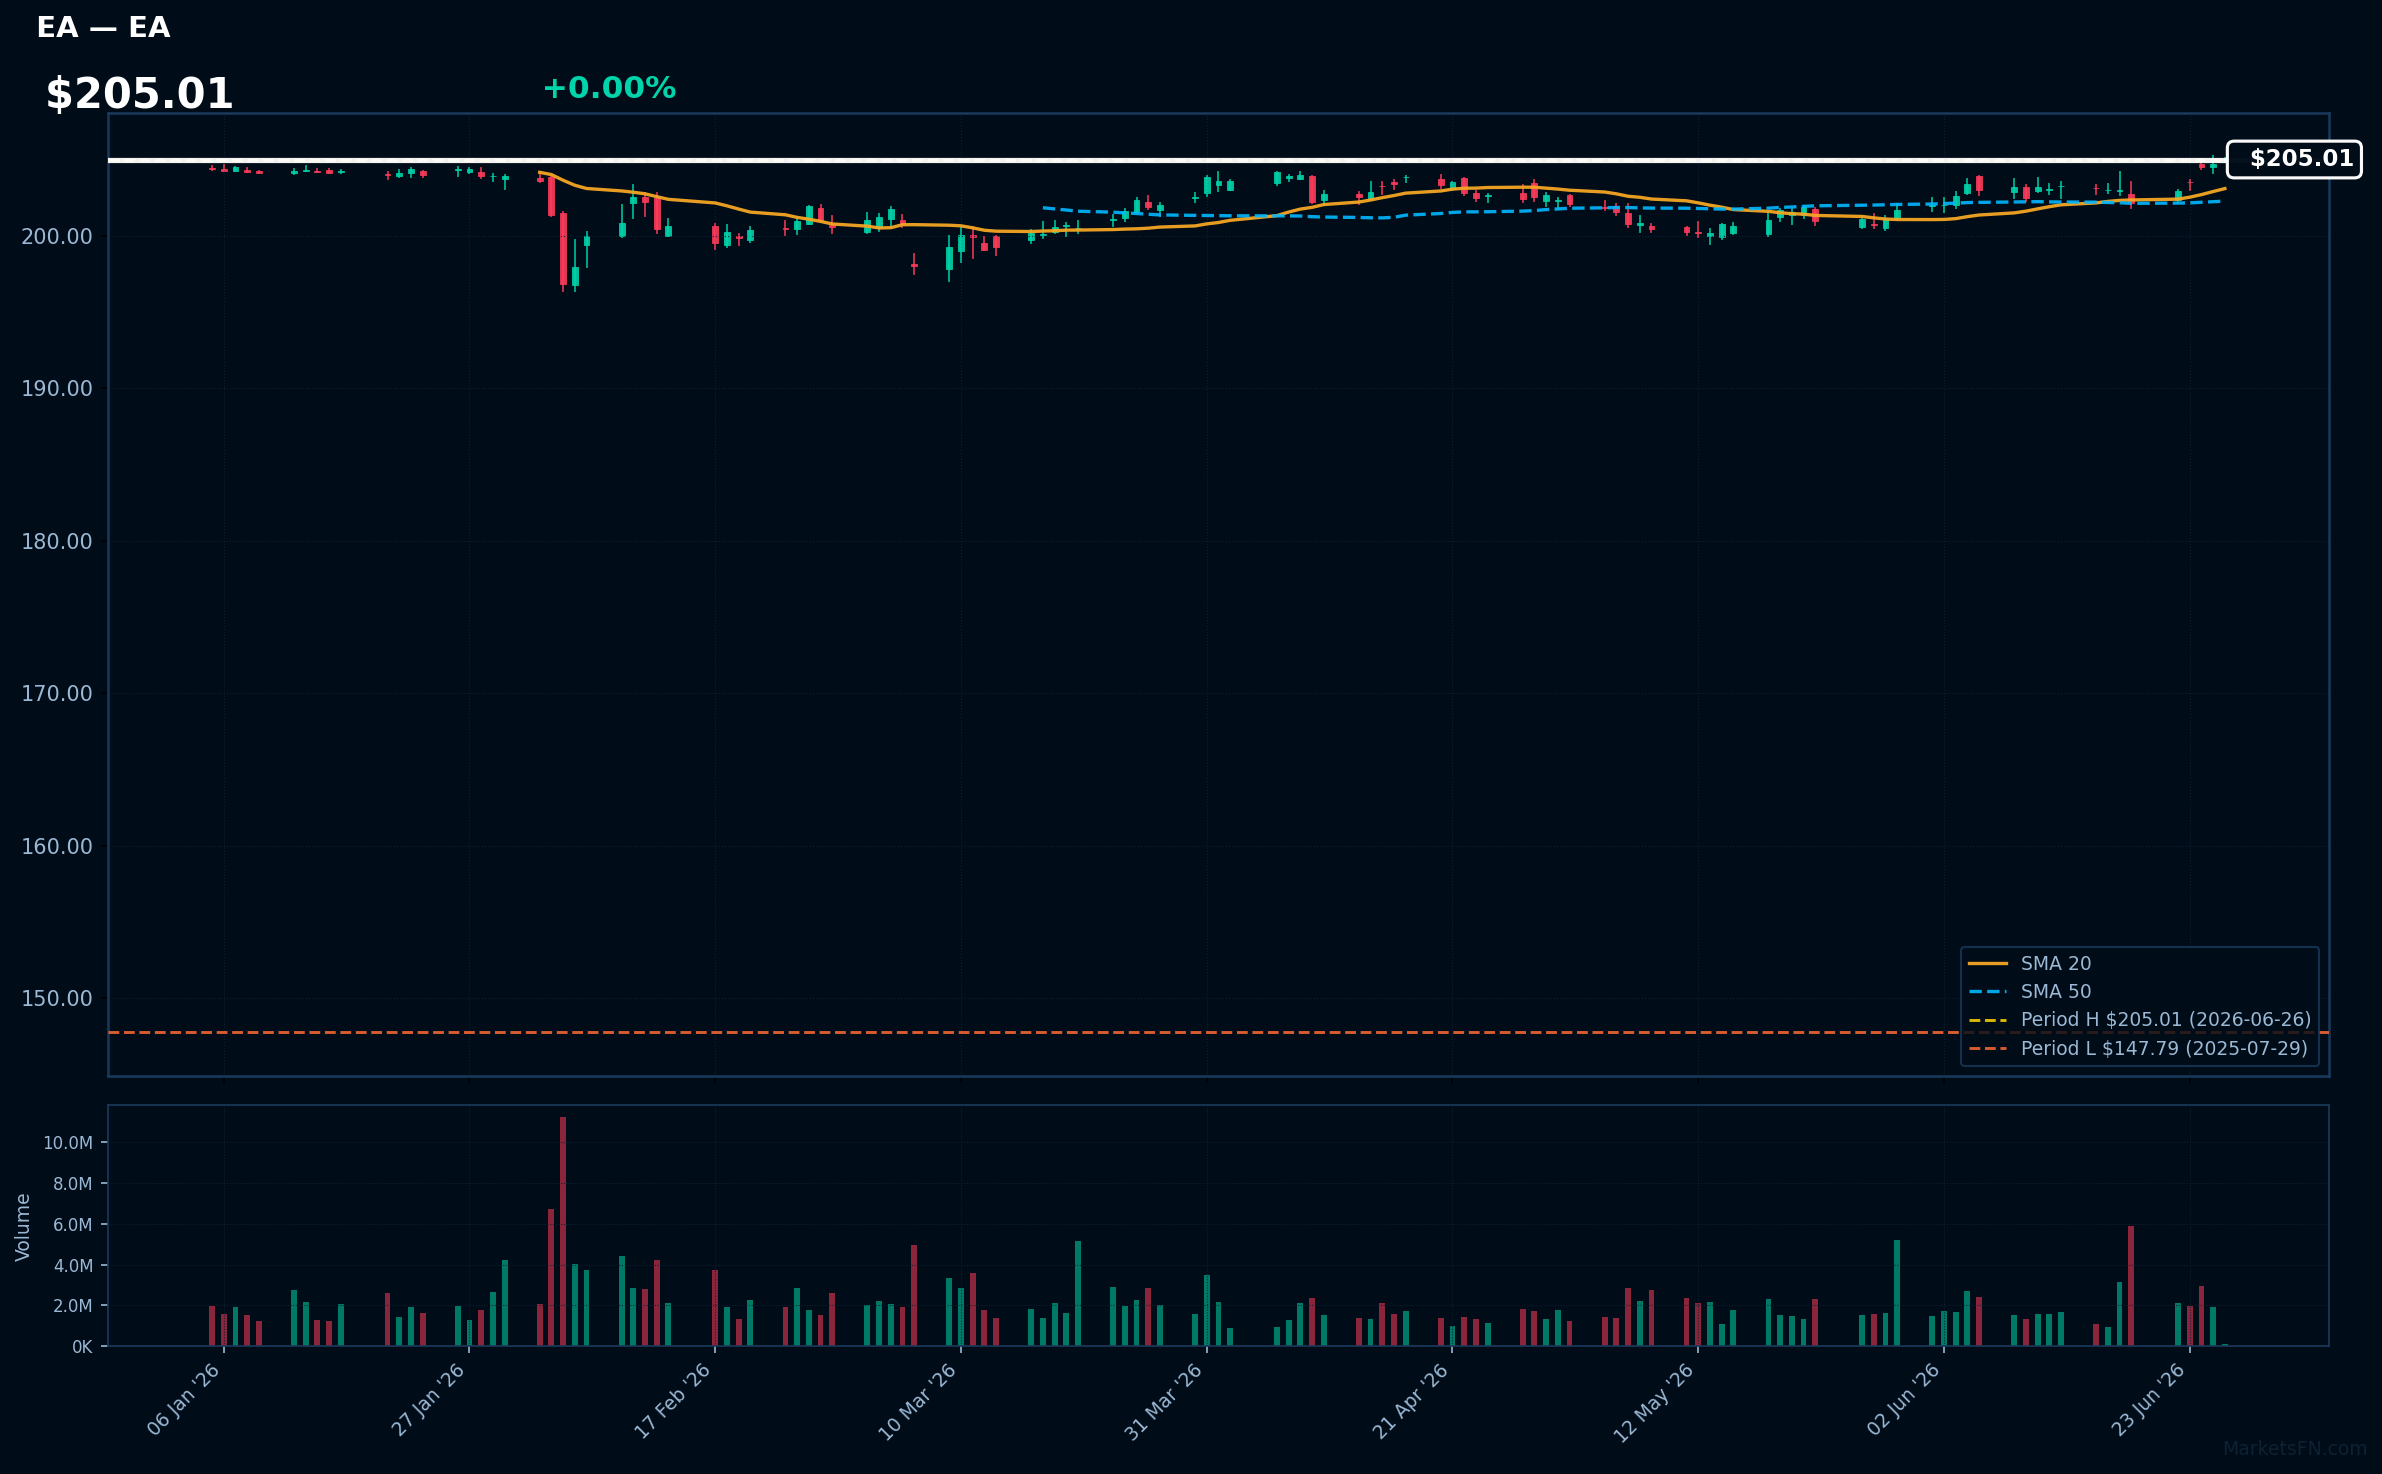
EA | Electronic Arts, Inc | Communication Services | Price Last: $205.01 | % Realized: +29.97% | RSI: 68.7 | % above MA200: +2.4% | Trend: Above MA20, MA50, MA200
Electronic Arts, Inc (EA) is a leading interactive entertainment software company that develops and publishes games such as FIFA, Madden NFL, and The Sims, generating revenue through game sales, subscriptions, and in-game purchases, making it a significant player in the gaming industry.
EA's current technical situation indicates strong momentum, with an RSI(14) of 68.7 and a bullish MA alignment (price > MA20 > MA50 > MA200), suggesting a sustained uptrend; it's also near a potential breakout level, 0.0% below its 52-Week high.
Related headlines
- EA SPORTS UFC 6 Launches Worldwide Today, Inviting Players Everywhere to Fight Their Fight
- Saudis seek EU approval for $55 billion EA deal, decision by July 22
- Oak-Eagle AcquireCo, Inc. Announces Extension of the Expiration Time and Settlement Date for the Previously Announced Tender Offers and Consent Solicitations for Any and All of Electronic Arts Inc.'s 1.850% Senior Notes Due 2031 and 2.950% Senior Notes Due 2051
- Electronic Arts Unveils New Advertising Platform for In-Game Brand Activations (EA)
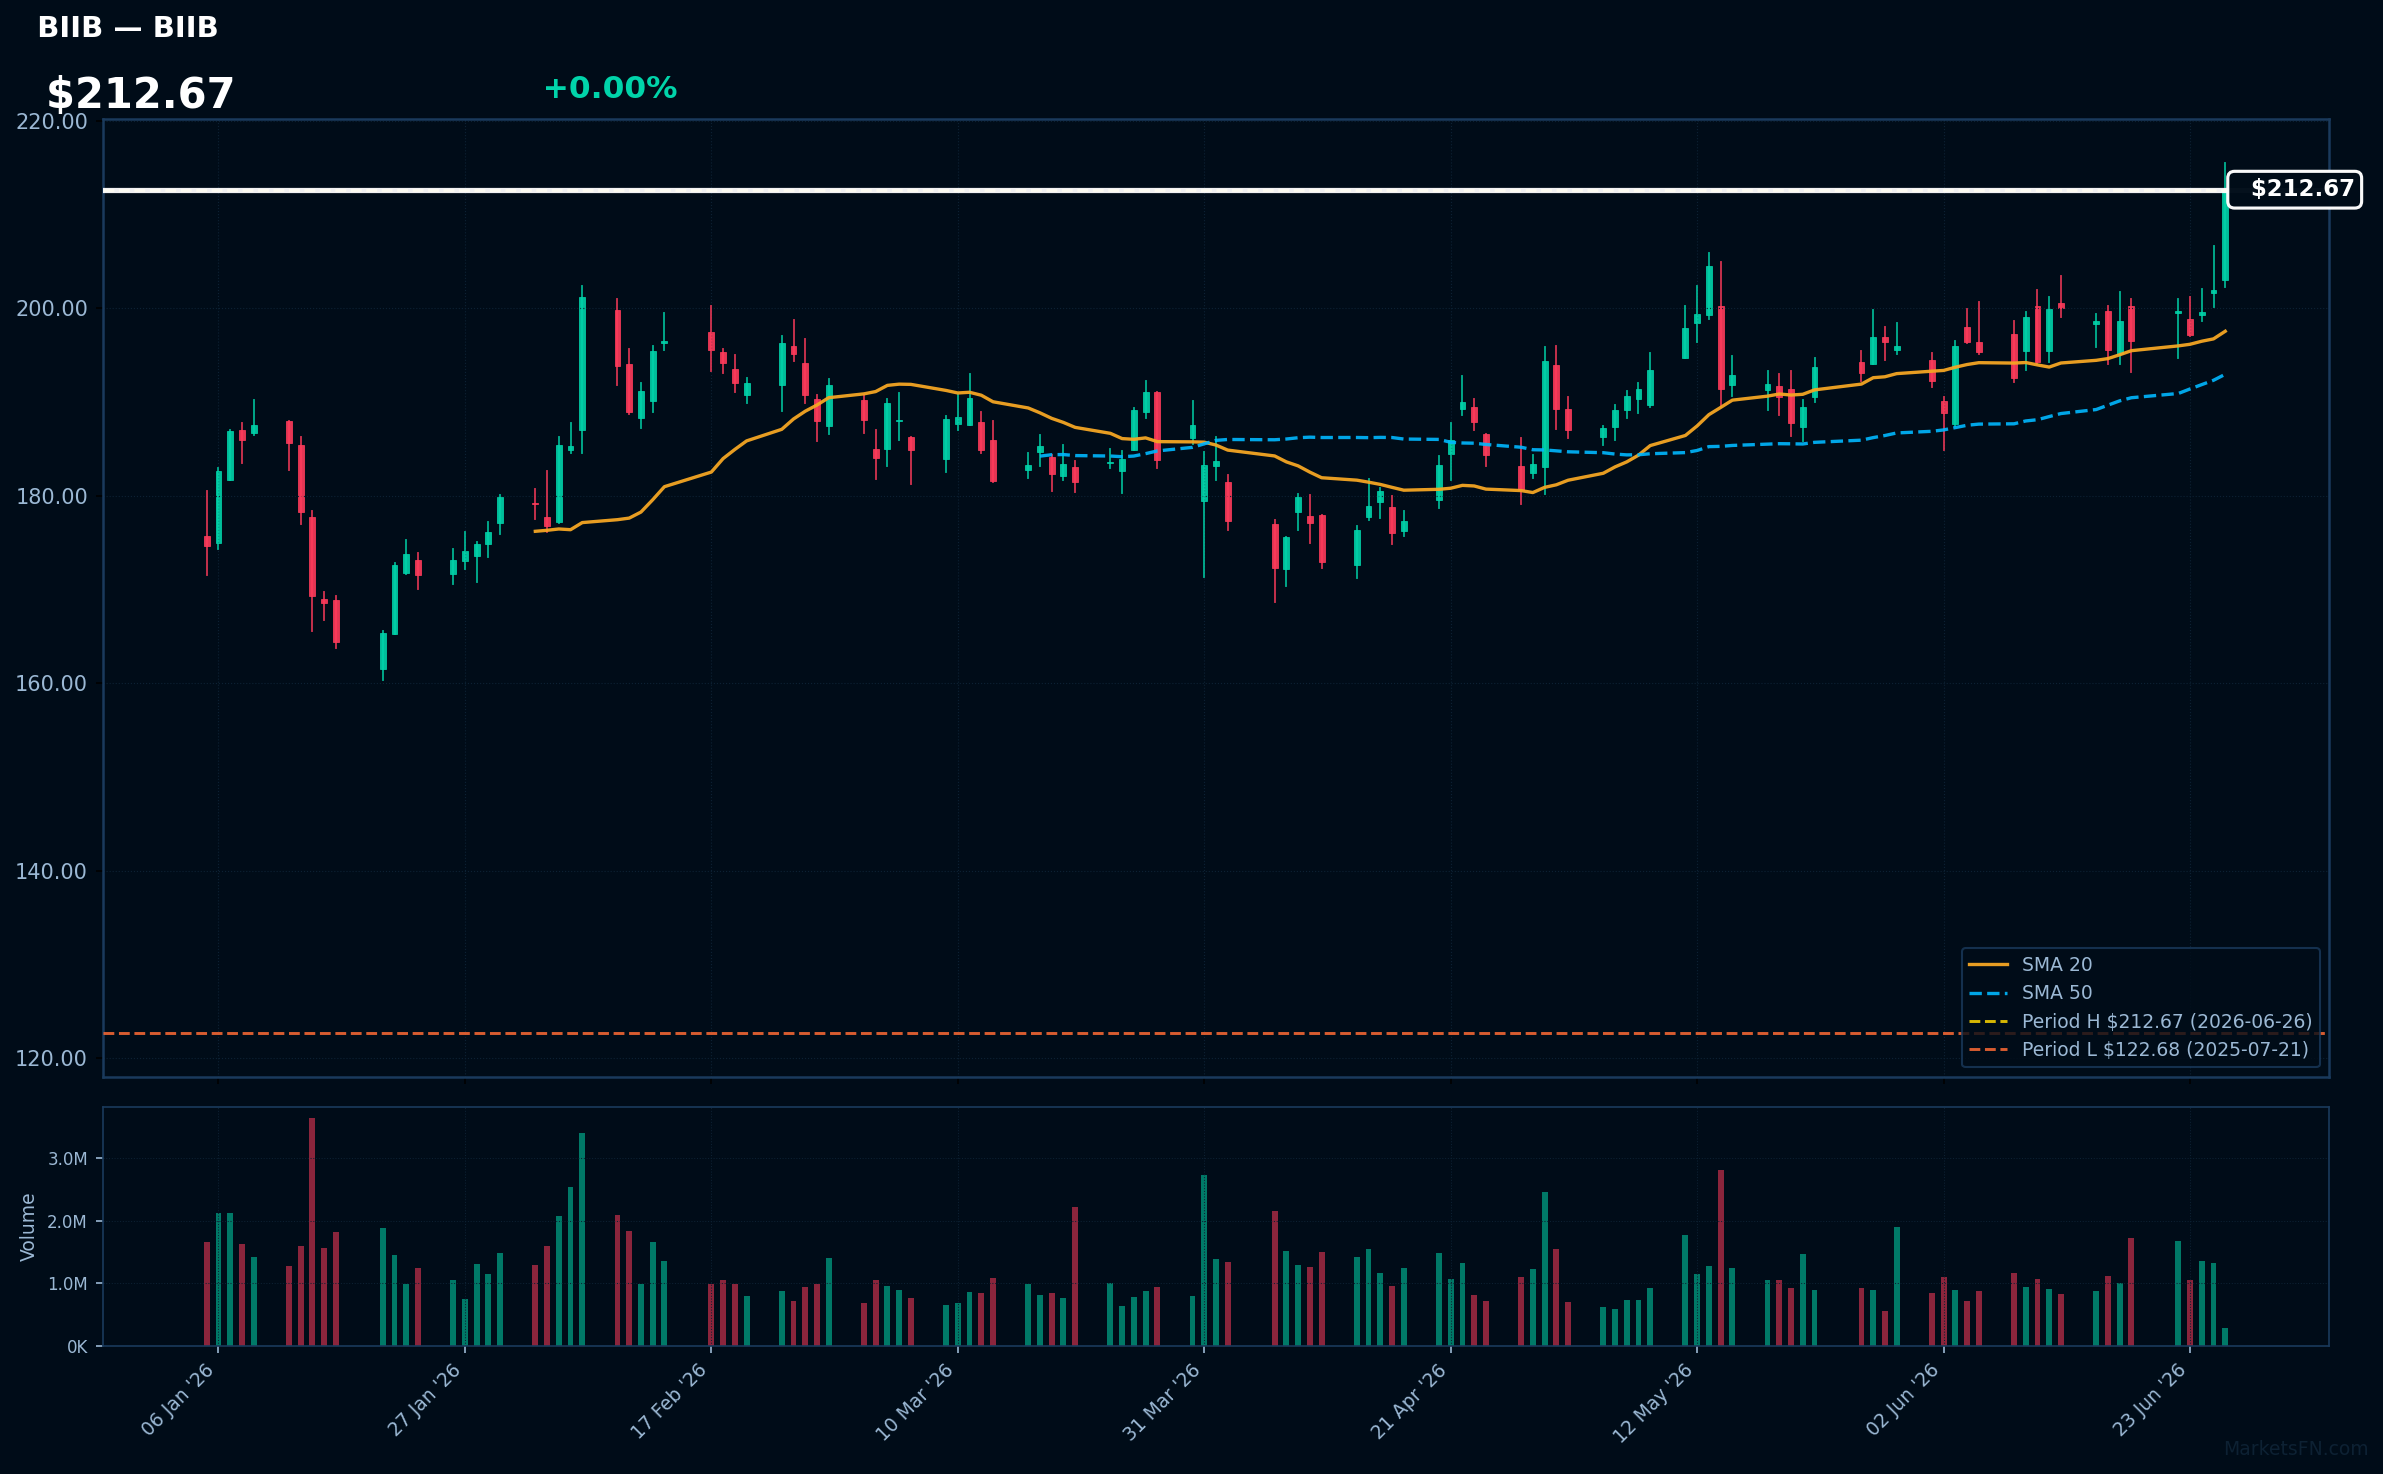
BIIB | Biogen Inc | Healthcare | Price Last: $212.67 | % Realized: +67.56% | RSI: 67.3 | % above MA200: +20.7% | Trend: Above MA20, MA50, MA200
Biogen Inc is a biotechnology company that develops treatments for neurological diseases, such as multiple sclerosis and Alzheimer's. Investors should care because its therapies address significant unmet medical needs, potentially driving revenue growth.
Biogen's technicals indicate sustained uptrend with price at $212.67, RSI(14) at 67.3, and MA alignment: price > MA20 > MA50 > MA200. The stock is near its 52-Week high, suggesting potential breakout momentum.
Related headlines
📉 Nearest to 52-Week Low
Sectors represented: Technology (2), Consumer Cyclical (1), Healthcare (1), Communication Services (1)
| Ticker | Company | Sector | Price Last | % Realized | 52-Week Low Date | RSI | % above MA200 | Trend |
|---|---|---|---|---|---|---|---|---|
| PDD | PDD Holdings Inc ADR | Consumer Cyclical | $73.97 | -30.05% | 2026-06-25 | 26.3 | -32.4% | Below MA20, MA50, MA200 |
| MSTR | Strategy Inc | Technology | $86.39 | -77.64% | 2026-06-25 | 25.4 | -53.5% | Below MA20, MA50, MA200 |
| ISRG | Intuitive Surgical Inc | Healthcare | $407.02 | -23.81% | 2026-06-25 | 43.1 | -16.8% | Below MA20, MA50, MA200 |
| CTSH | Cognizant Technology Solutions Corp | Technology | $39.91 | -48.56% | 2026-06-25 | 24.5 | -40.3% | Below MA20, MA50, MA200 |
| CMCSA | Comcast Corp | Communication Services | $22.82 | -30.85% | 2026-06-22 | 35.6 | -17.6% | Below MA20, MA50, MA200 |
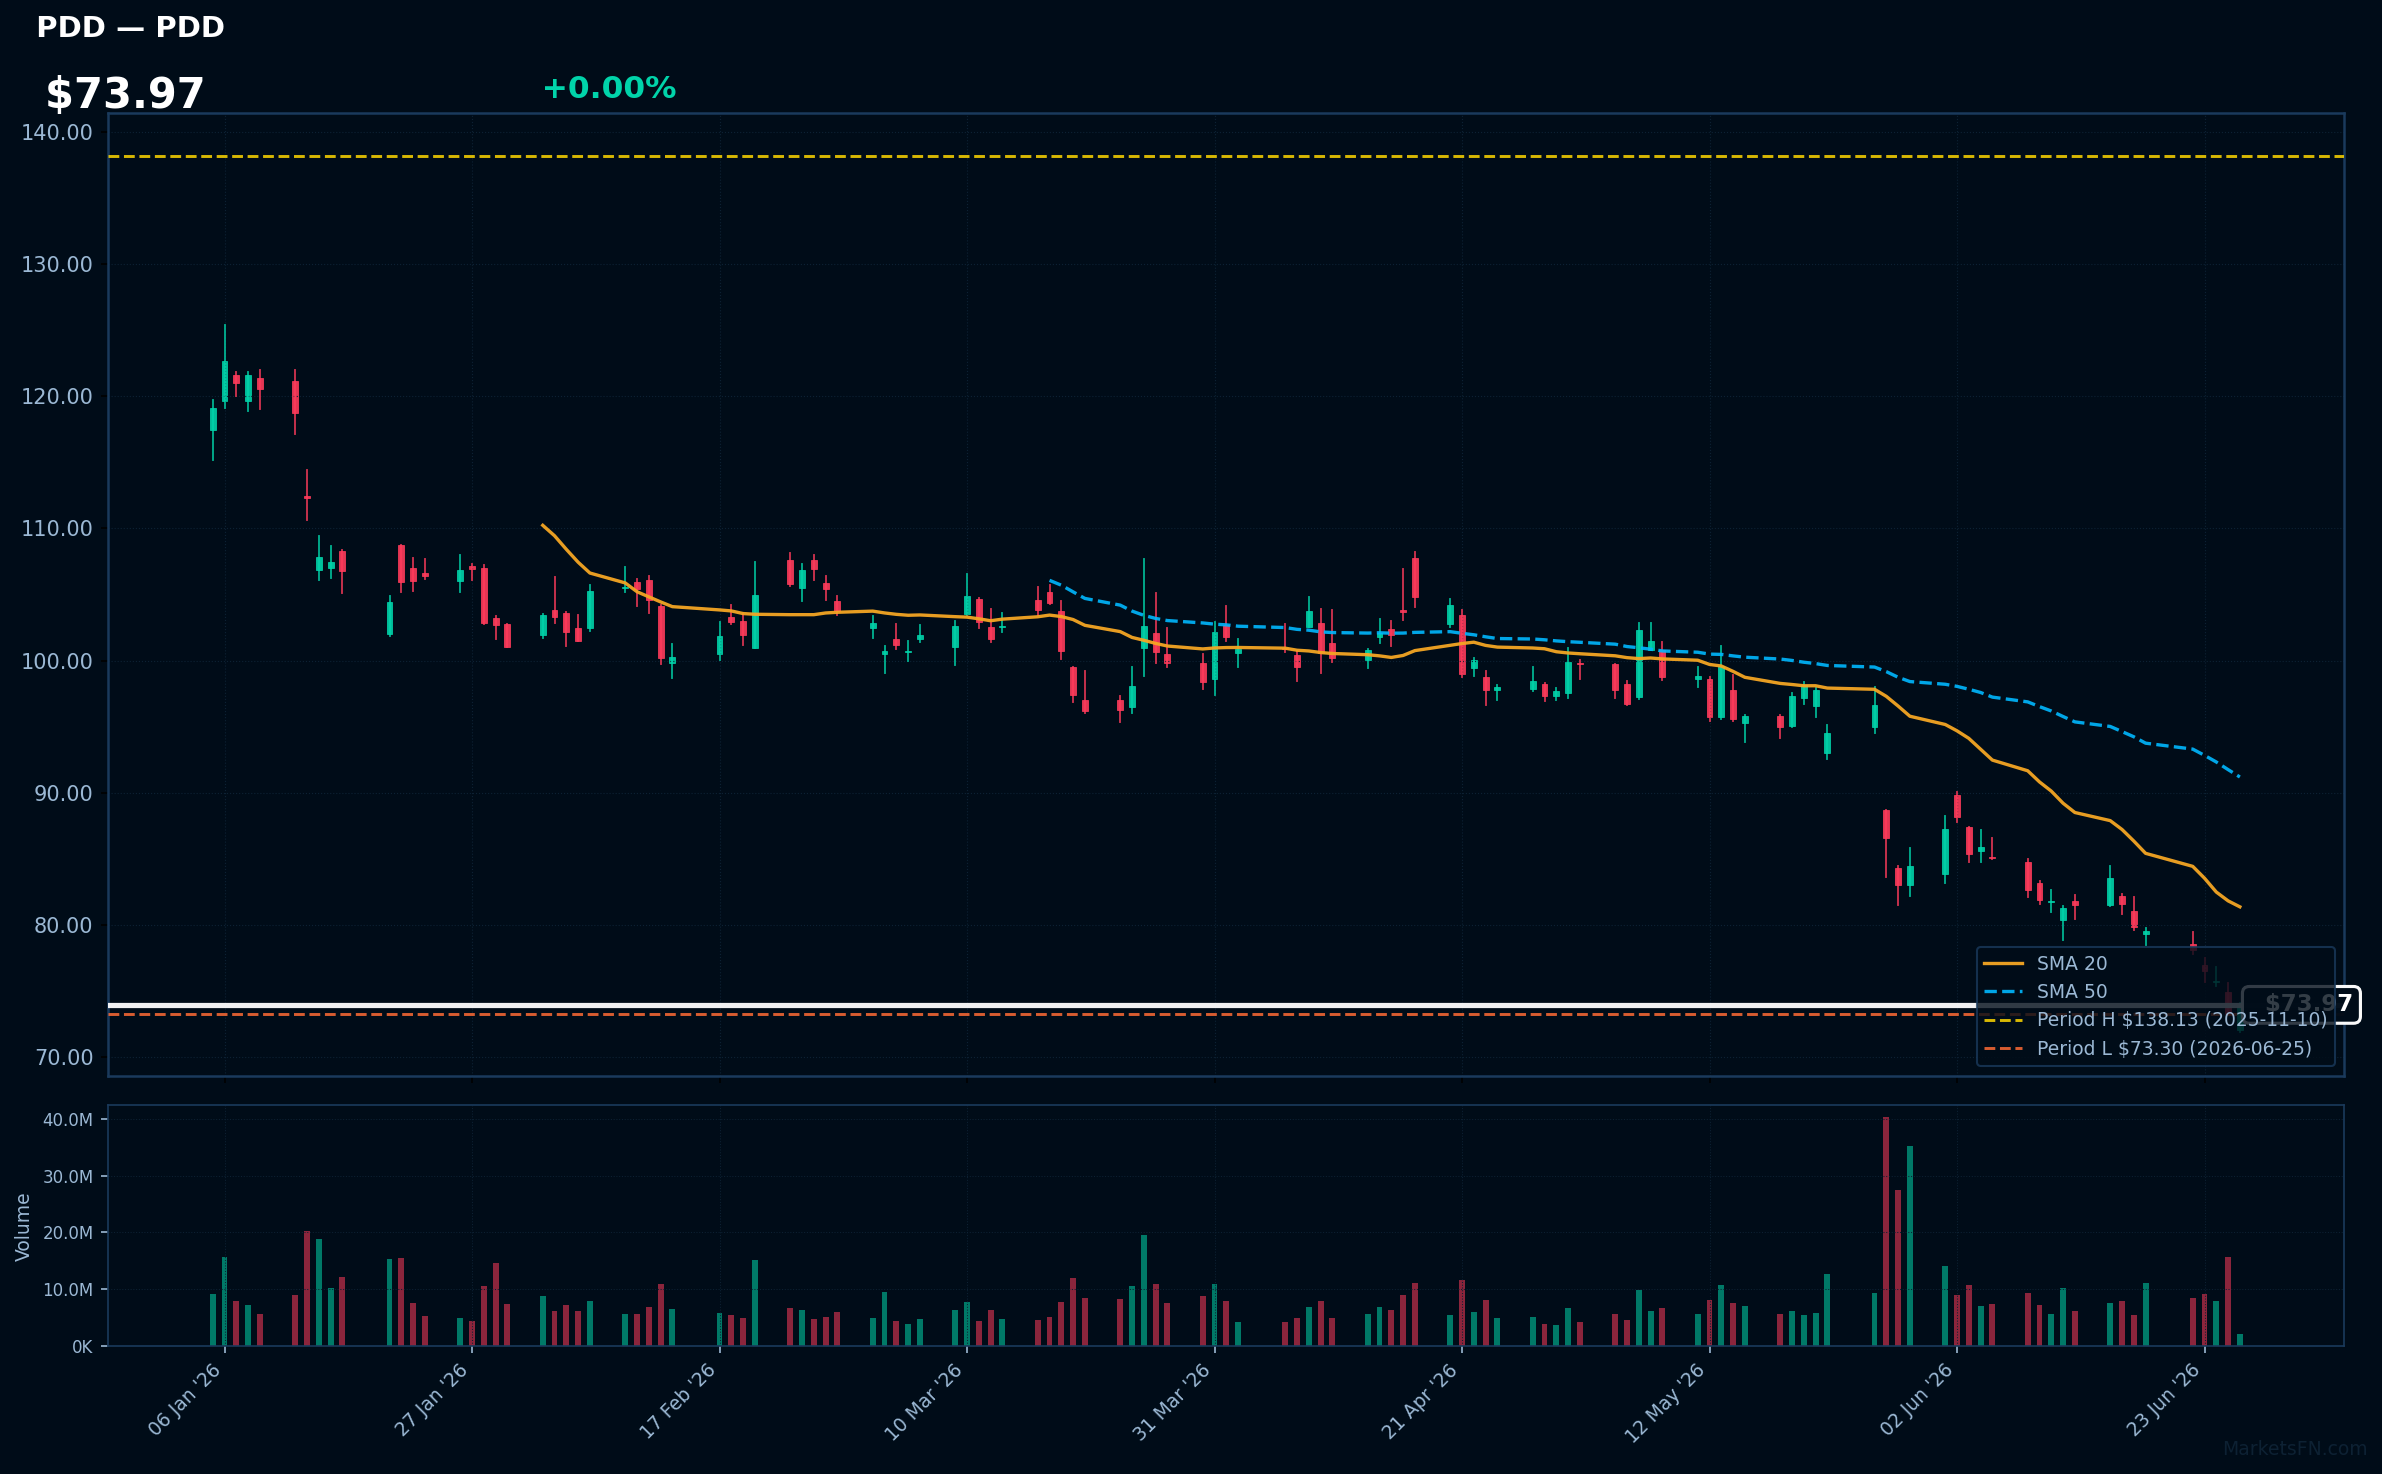
PDD | PDD Holdings Inc ADR | Consumer Cyclical | Price Last: $73.97 | % Realized: -30.05% | RSI: 26.3 | % above MA200: -32.4% | Trend: Below MA20, MA50, MA200
PDD Holdings Inc ADR operates e-commerce platforms, primarily through Temu and Pinduoduo, focusing on direct-from-factory sales and group buying. Investors care due to its rapid growth and disruption in the e-commerce space.
PDD is in a sustained downtrend with price ($73.97) < MA20 < MA50 < MA200. RSI(14) is 26.3, nearing oversold territory. The stock is 0.9% above its 52-Week low, testing major support, indicating a potential warning sign.
Related headlines
- PDD Holding, Inc. Shareholders Are Encouraged to Reach Out to Johnson Fistel for More Information About Potentially Recovering Their Losses
- PDD Holdings Inc (PDD) Q1 2026 Earnings Call Highlights: Revenue Growth Amidst Profit Challenges
- PDD Holdings shares slide after revenue and profit miss
- PDD Stock Slides After Temu Parent's Revenue Misses Estimates
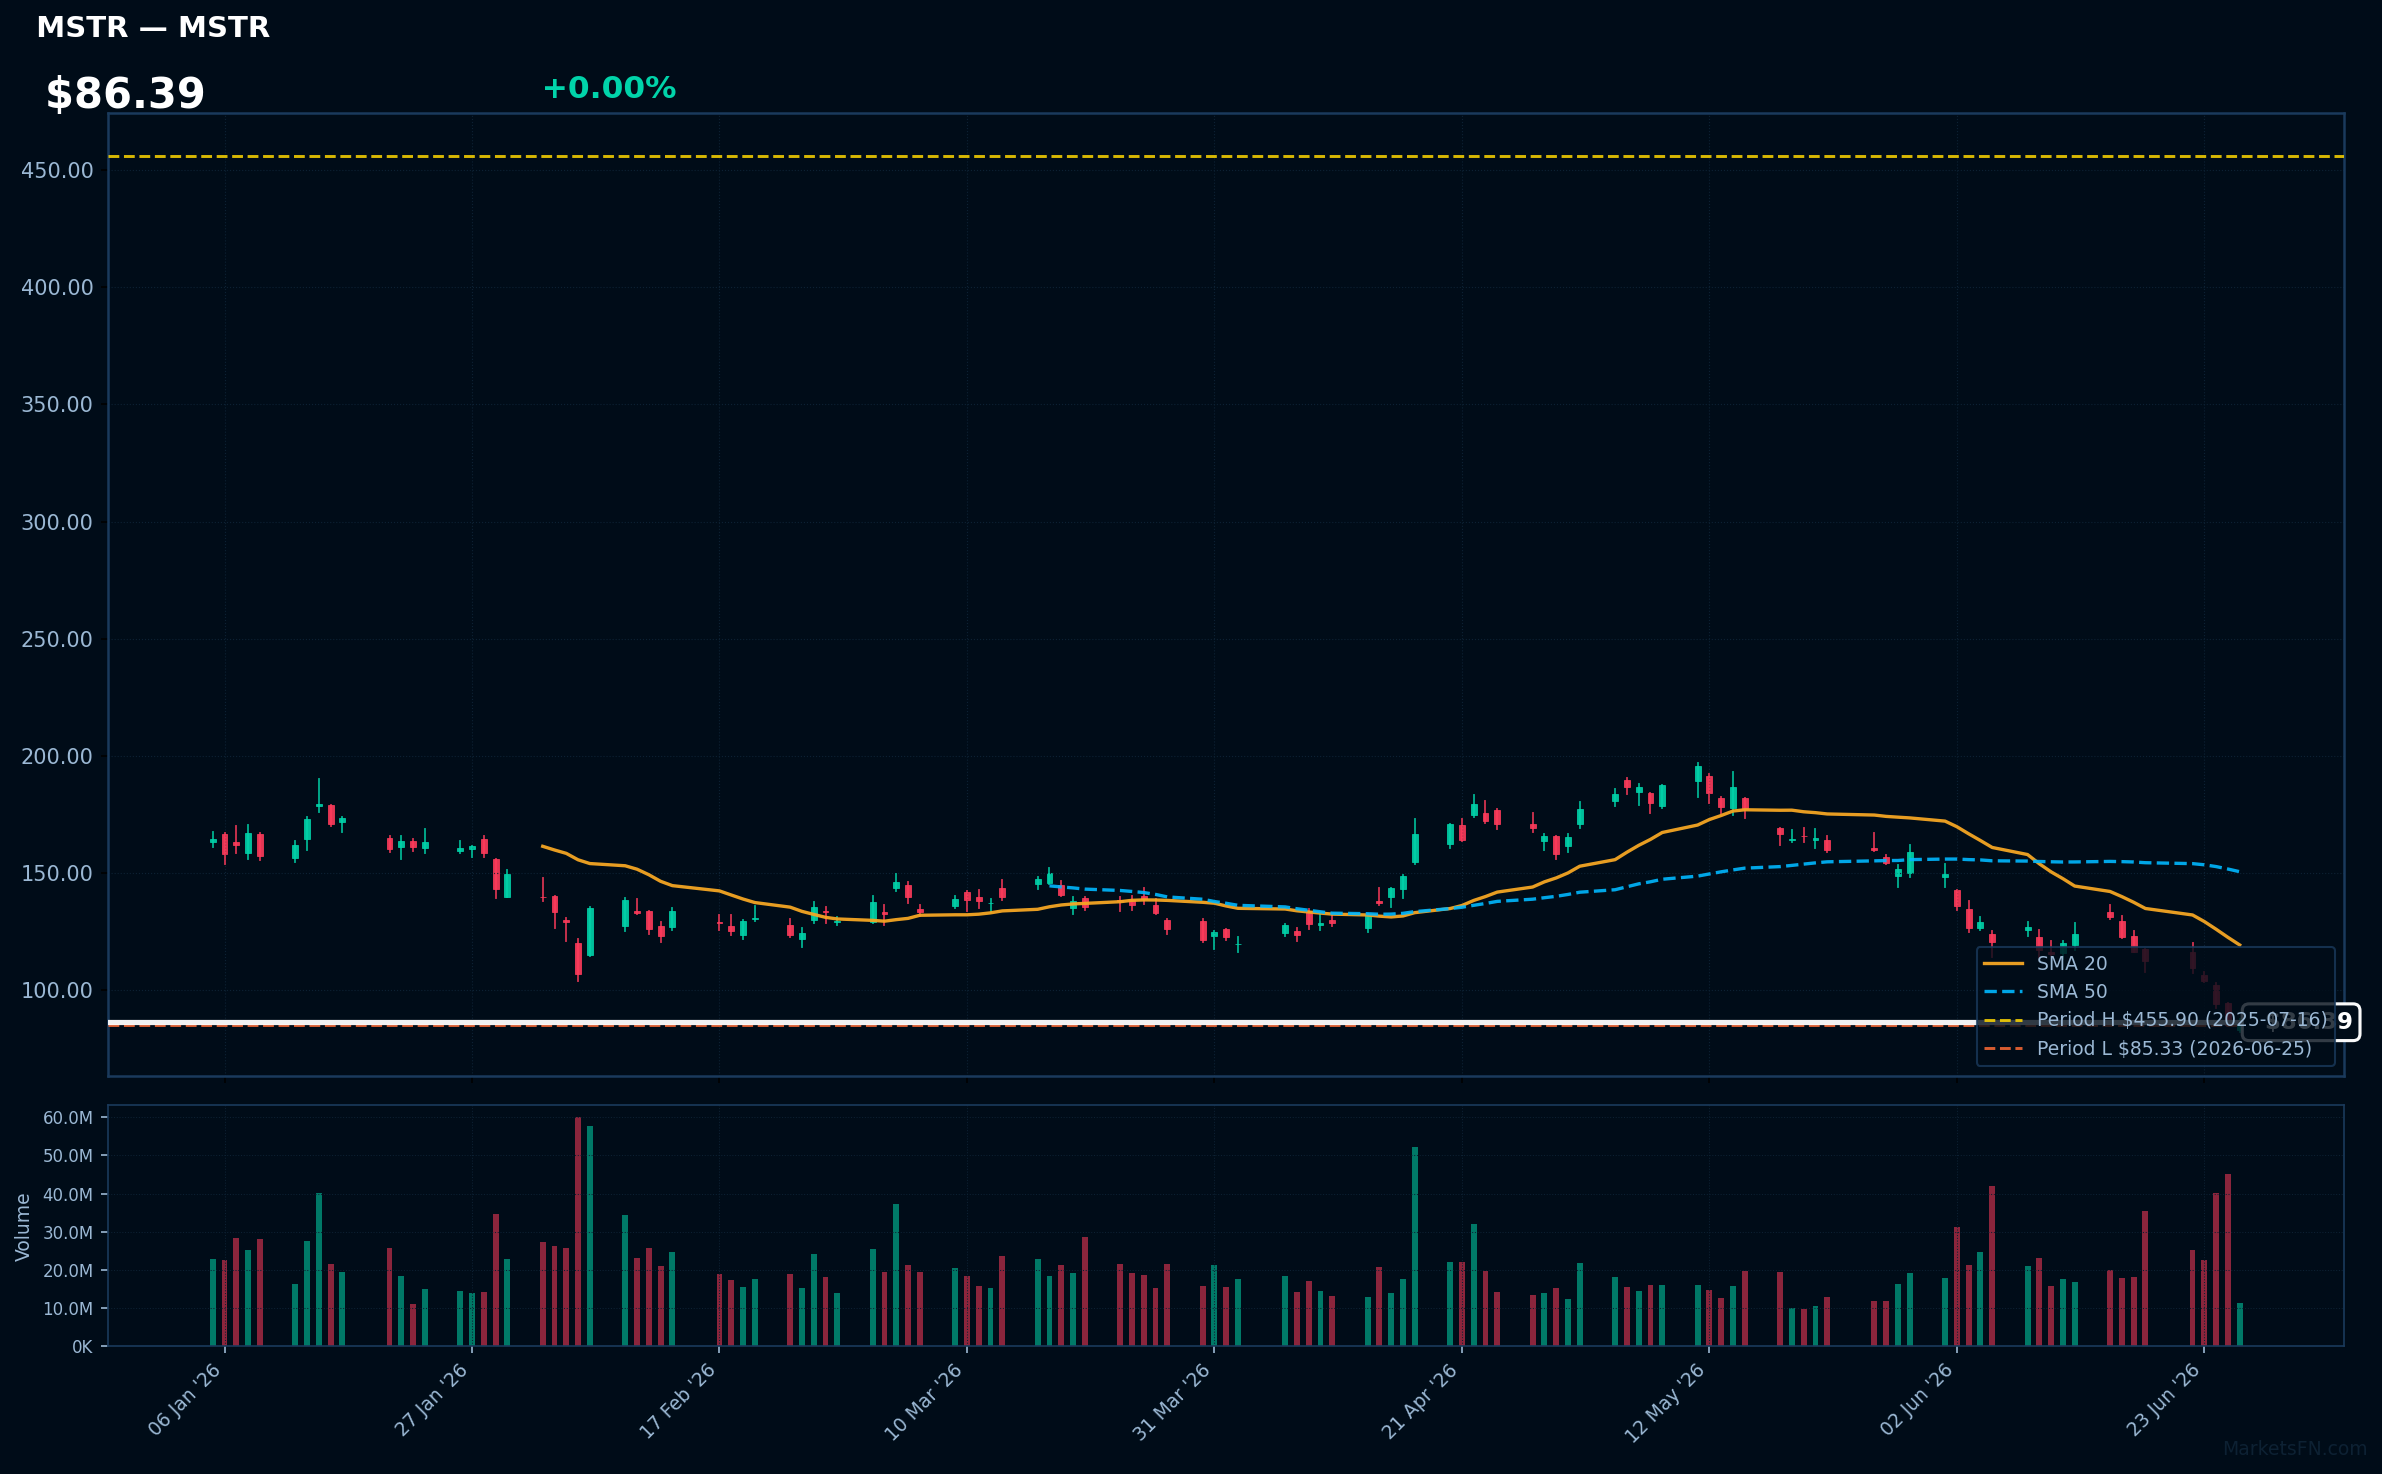
MSTR | Strategy Inc | Technology | Price Last: $86.39 | % Realized: -77.64% | RSI: 25.4 | % above MA200: -53.5% | Trend: Below MA20, MA50, MA200
Strategy Inc is a business that focuses on developing and implementing software and strategies related to bitcoin and other digital assets; investors should care because its performance is closely tied to the company's ability to navigate the volatile cryptocurrency market.
The stock is in a sustained downtrend with a bearish MA alignment: price ($86.39) < MA20 < MA50 < MA200, RSI(14) at 25.4 indicating oversold conditions, and is 1.2% above its 52-Week low, suggesting a potential support test.
Related headlines
- Strategy Stock Mired In Worst Losing Streak Since Late 2022 as Bitcoin Under $60,000
- Michael Saylor's Strategy faces no easy way out as bitcoin prices continue to drop
- MSTR Stock Drops Over 80% From Peak Peter Schiff Questions Strategys Bitcoin Play
- Why Did MSFT, PLTR, MSTR Stocks Plunge To 52-Week Lows Today?
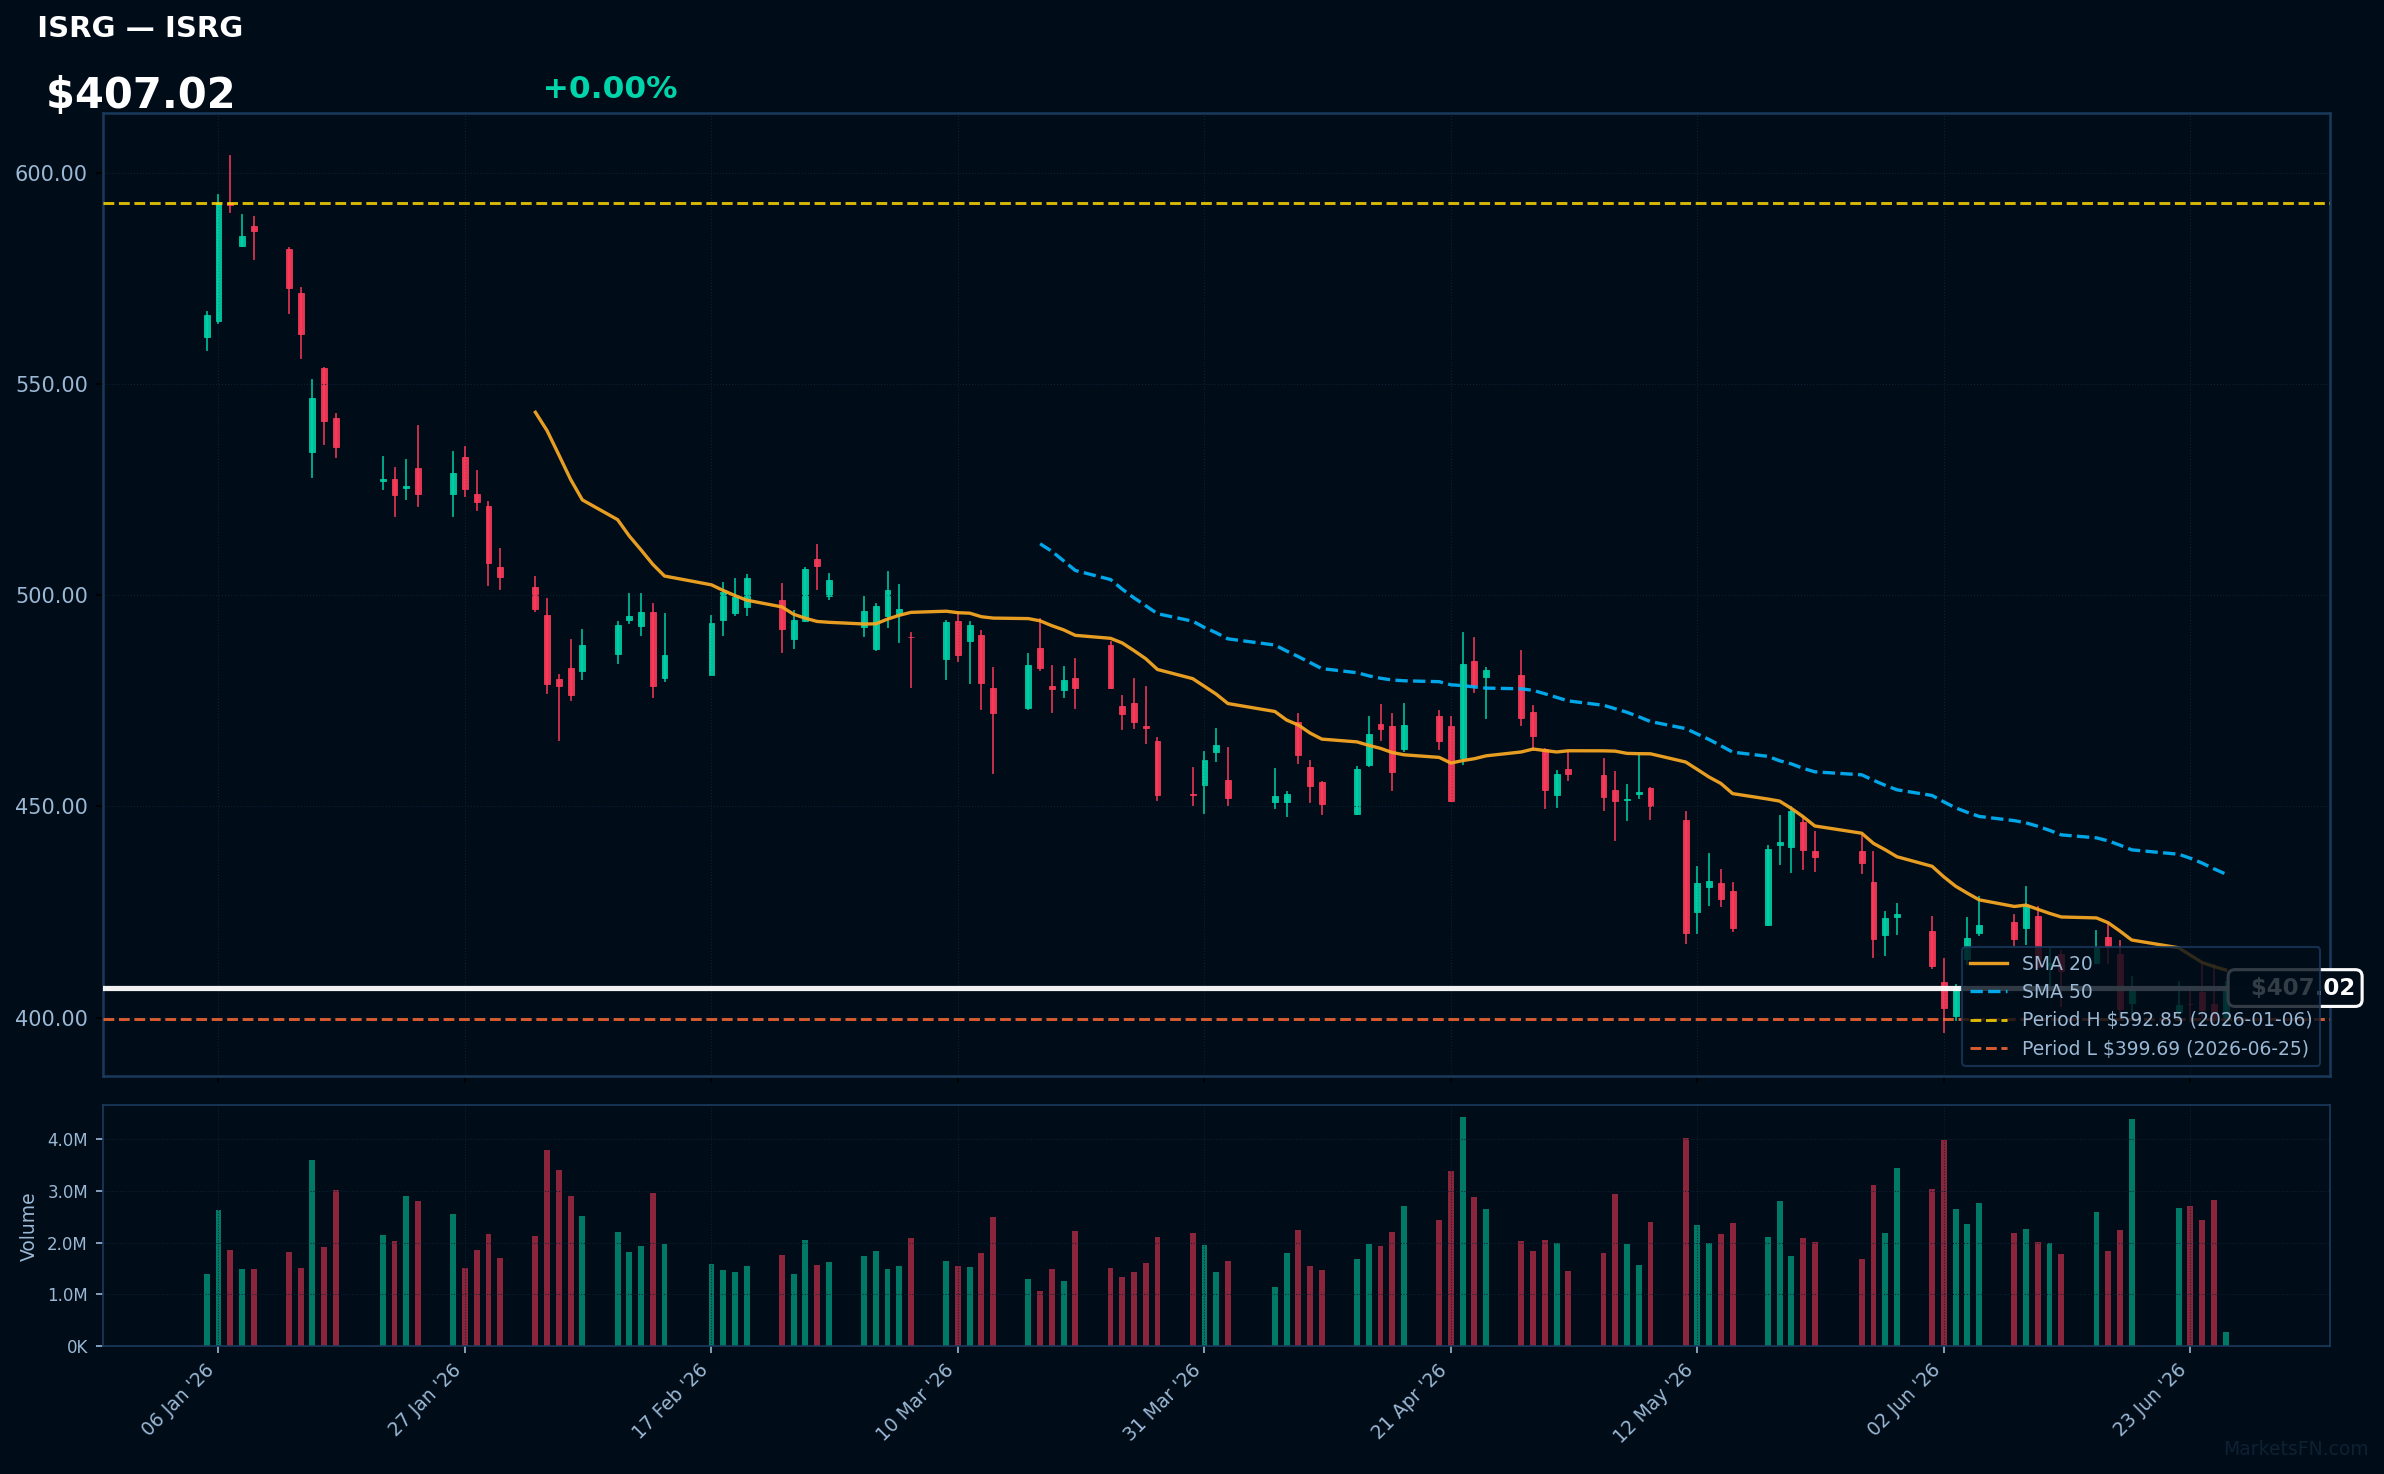
ISRG | Intuitive Surgical Inc | Healthcare | Price Last: $407.02 | % Realized: -23.81% | RSI: 43.1 | % above MA200: -16.8% | Trend: Below MA20, MA50, MA200
Intuitive Surgical Inc develops and markets robotic-assisted surgical systems, primarily the da Vinci Surgical System, enabling minimally invasive surgeries. Investors should care as its technology adoption drives growth and its market dominance impacts the surgical robotics industry.
ISRG's technical situation is bearish, with an RSI(14) of 43.1, price below all key MAs (MA20, MA50, MA200), and a 52-Week low proximity of 1.8%, indicating a sustained downtrend and testing major support, potentially a warning sign.
Related headlines
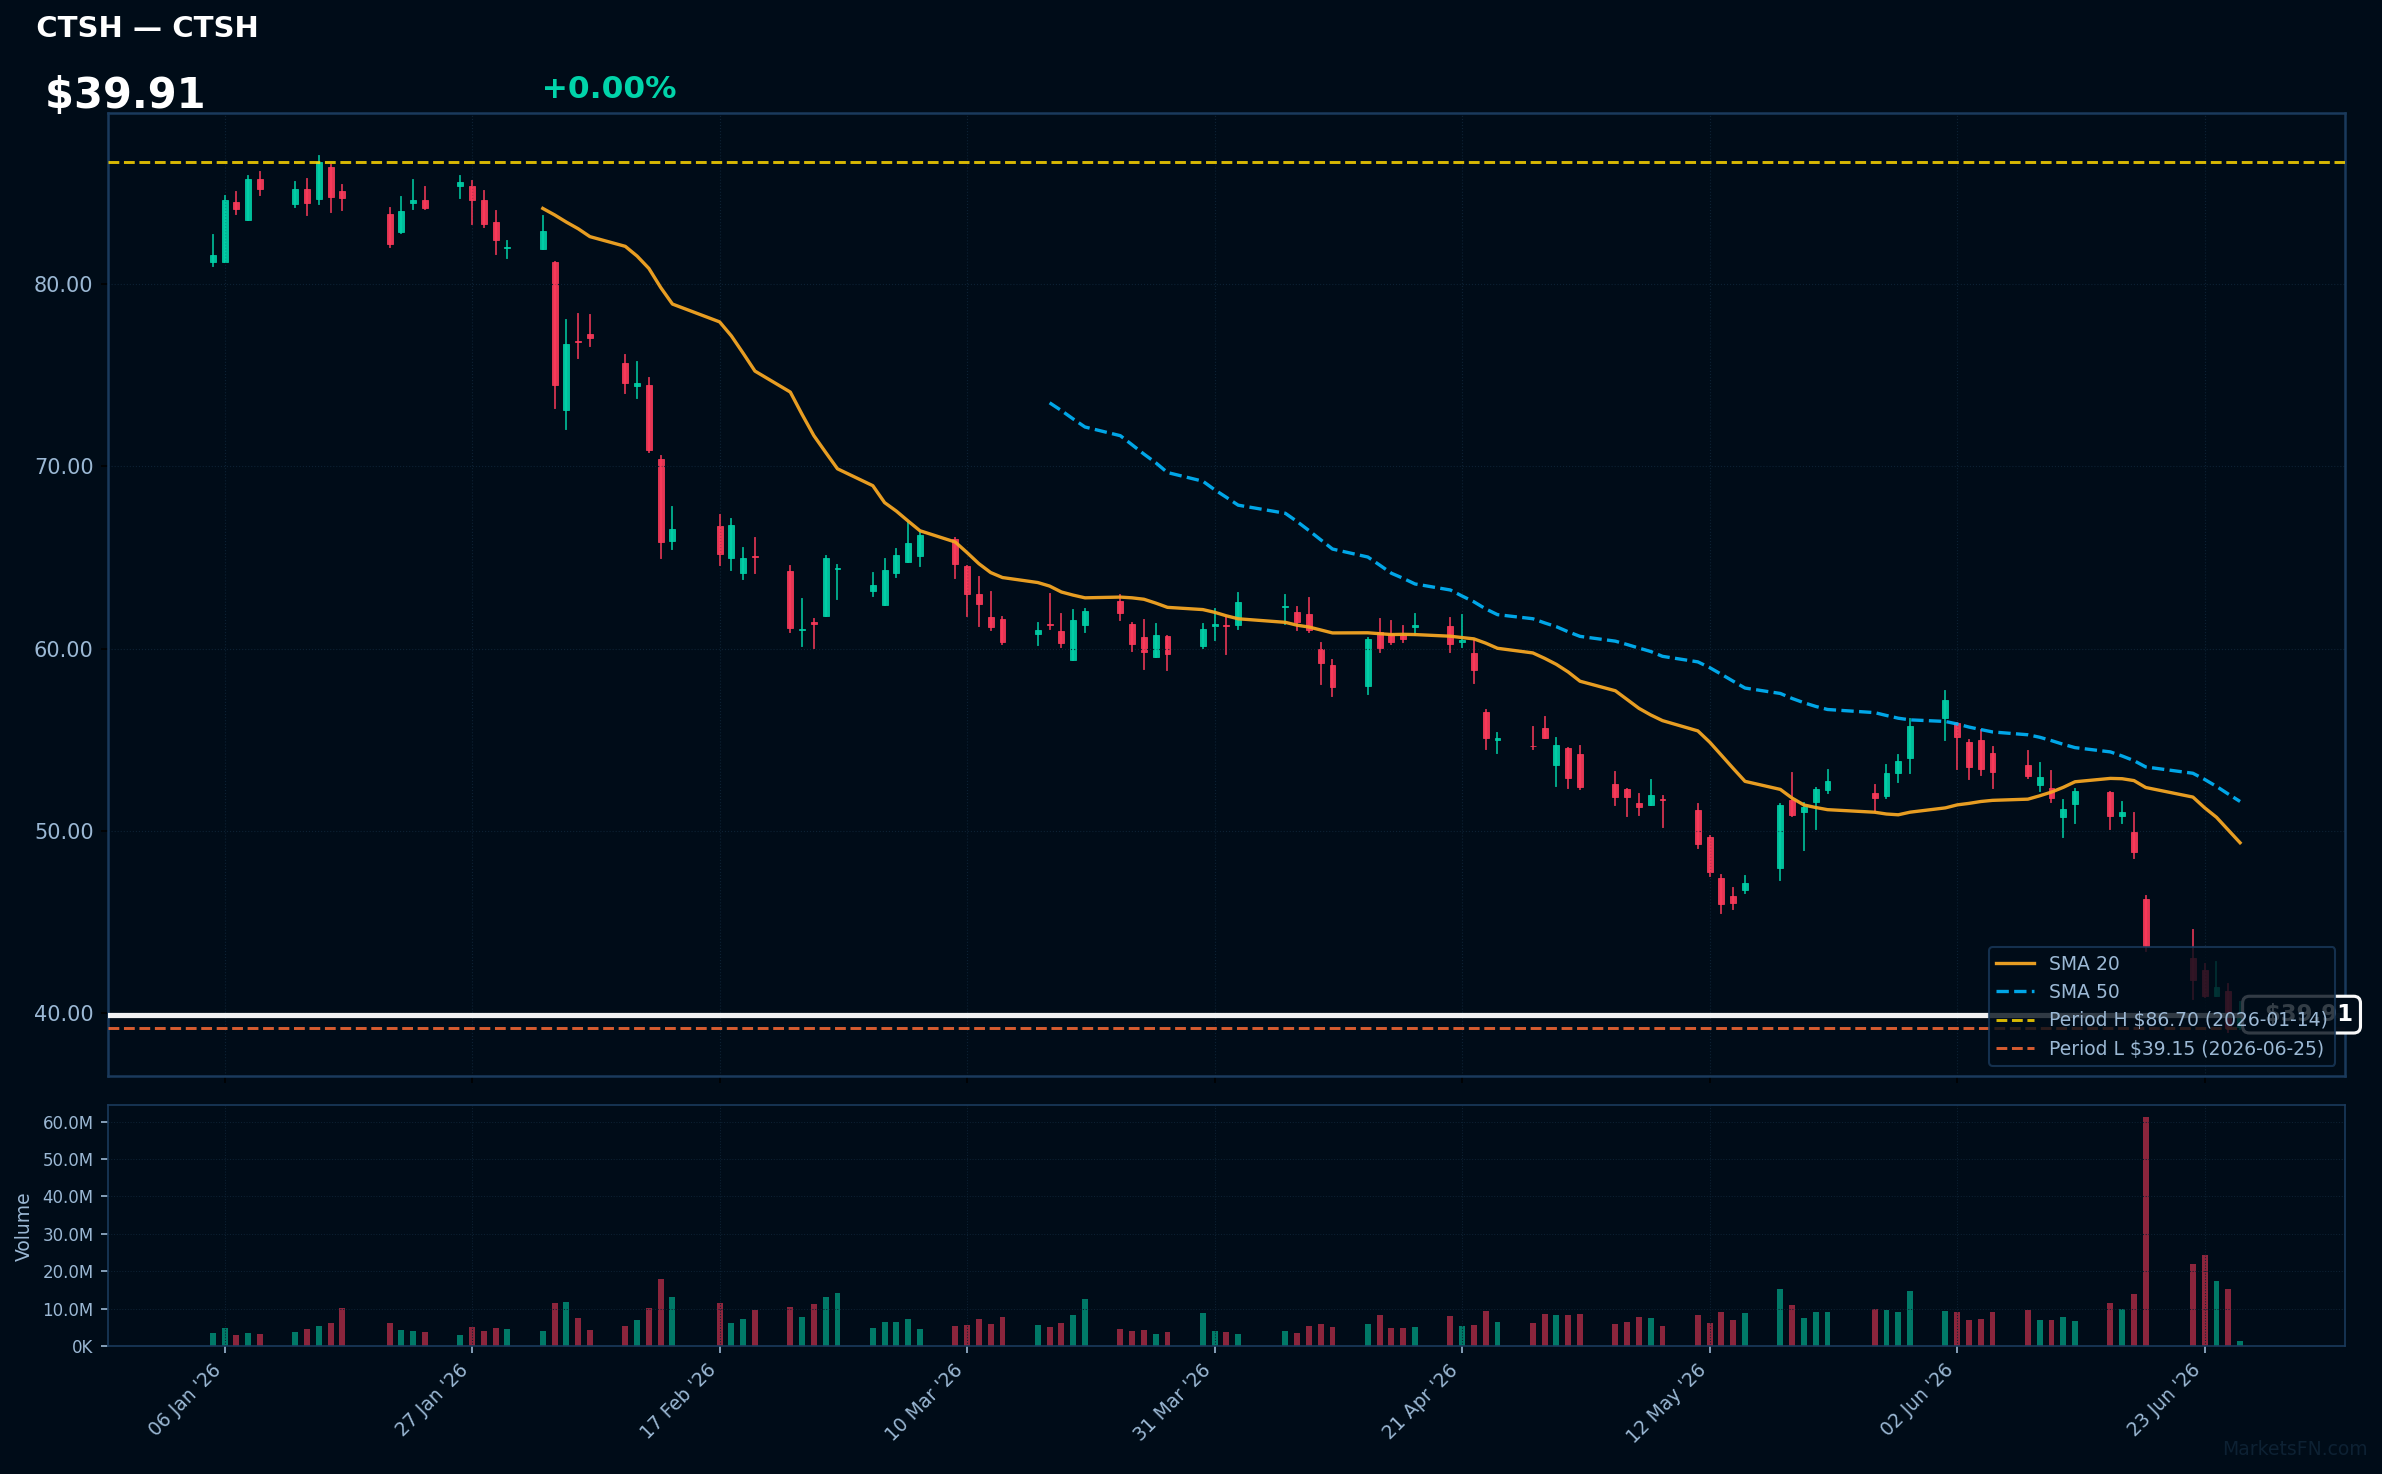
CTSH | Cognizant Technology Solutions Corp | Technology | Price Last: $39.91 | % Realized: -48.56% | RSI: 24.5 | % above MA200: -40.3% | Trend: Below MA20, MA50, MA200
Cognizant Technology Solutions Corp is an IT services company providing digital transformation, consulting, and technology services. Investors should care about its ability to adapt to changing tech landscapes and client needs, impacting revenue growth and profitability.
Cognizant's technical situation is bearish, with RSI(14) at 24.5, indicating oversold conditions. The MA alignment (price < MA20 < MA50 < MA200) confirms a sustained downtrend. The stock is 1.9% above its 52-Week low, testing major support, and has returned -48.6% over the 52-Week period.
Related headlines
- Cognizant Technology Solutions Corp. stock underperforms Thursday when compared to competitors
- Cognizant expands cross-platform agentic AI with new ServiceNow AI Agent interoperability
- Entry-Level Work Remains Essential: 94% of HR Leaders Expect AI to Create New Entry-Level Roles, Cognizant and Pearson Study Reveals
- Berenberg downgrades Cognizant as AI risks cloud IT services outlook
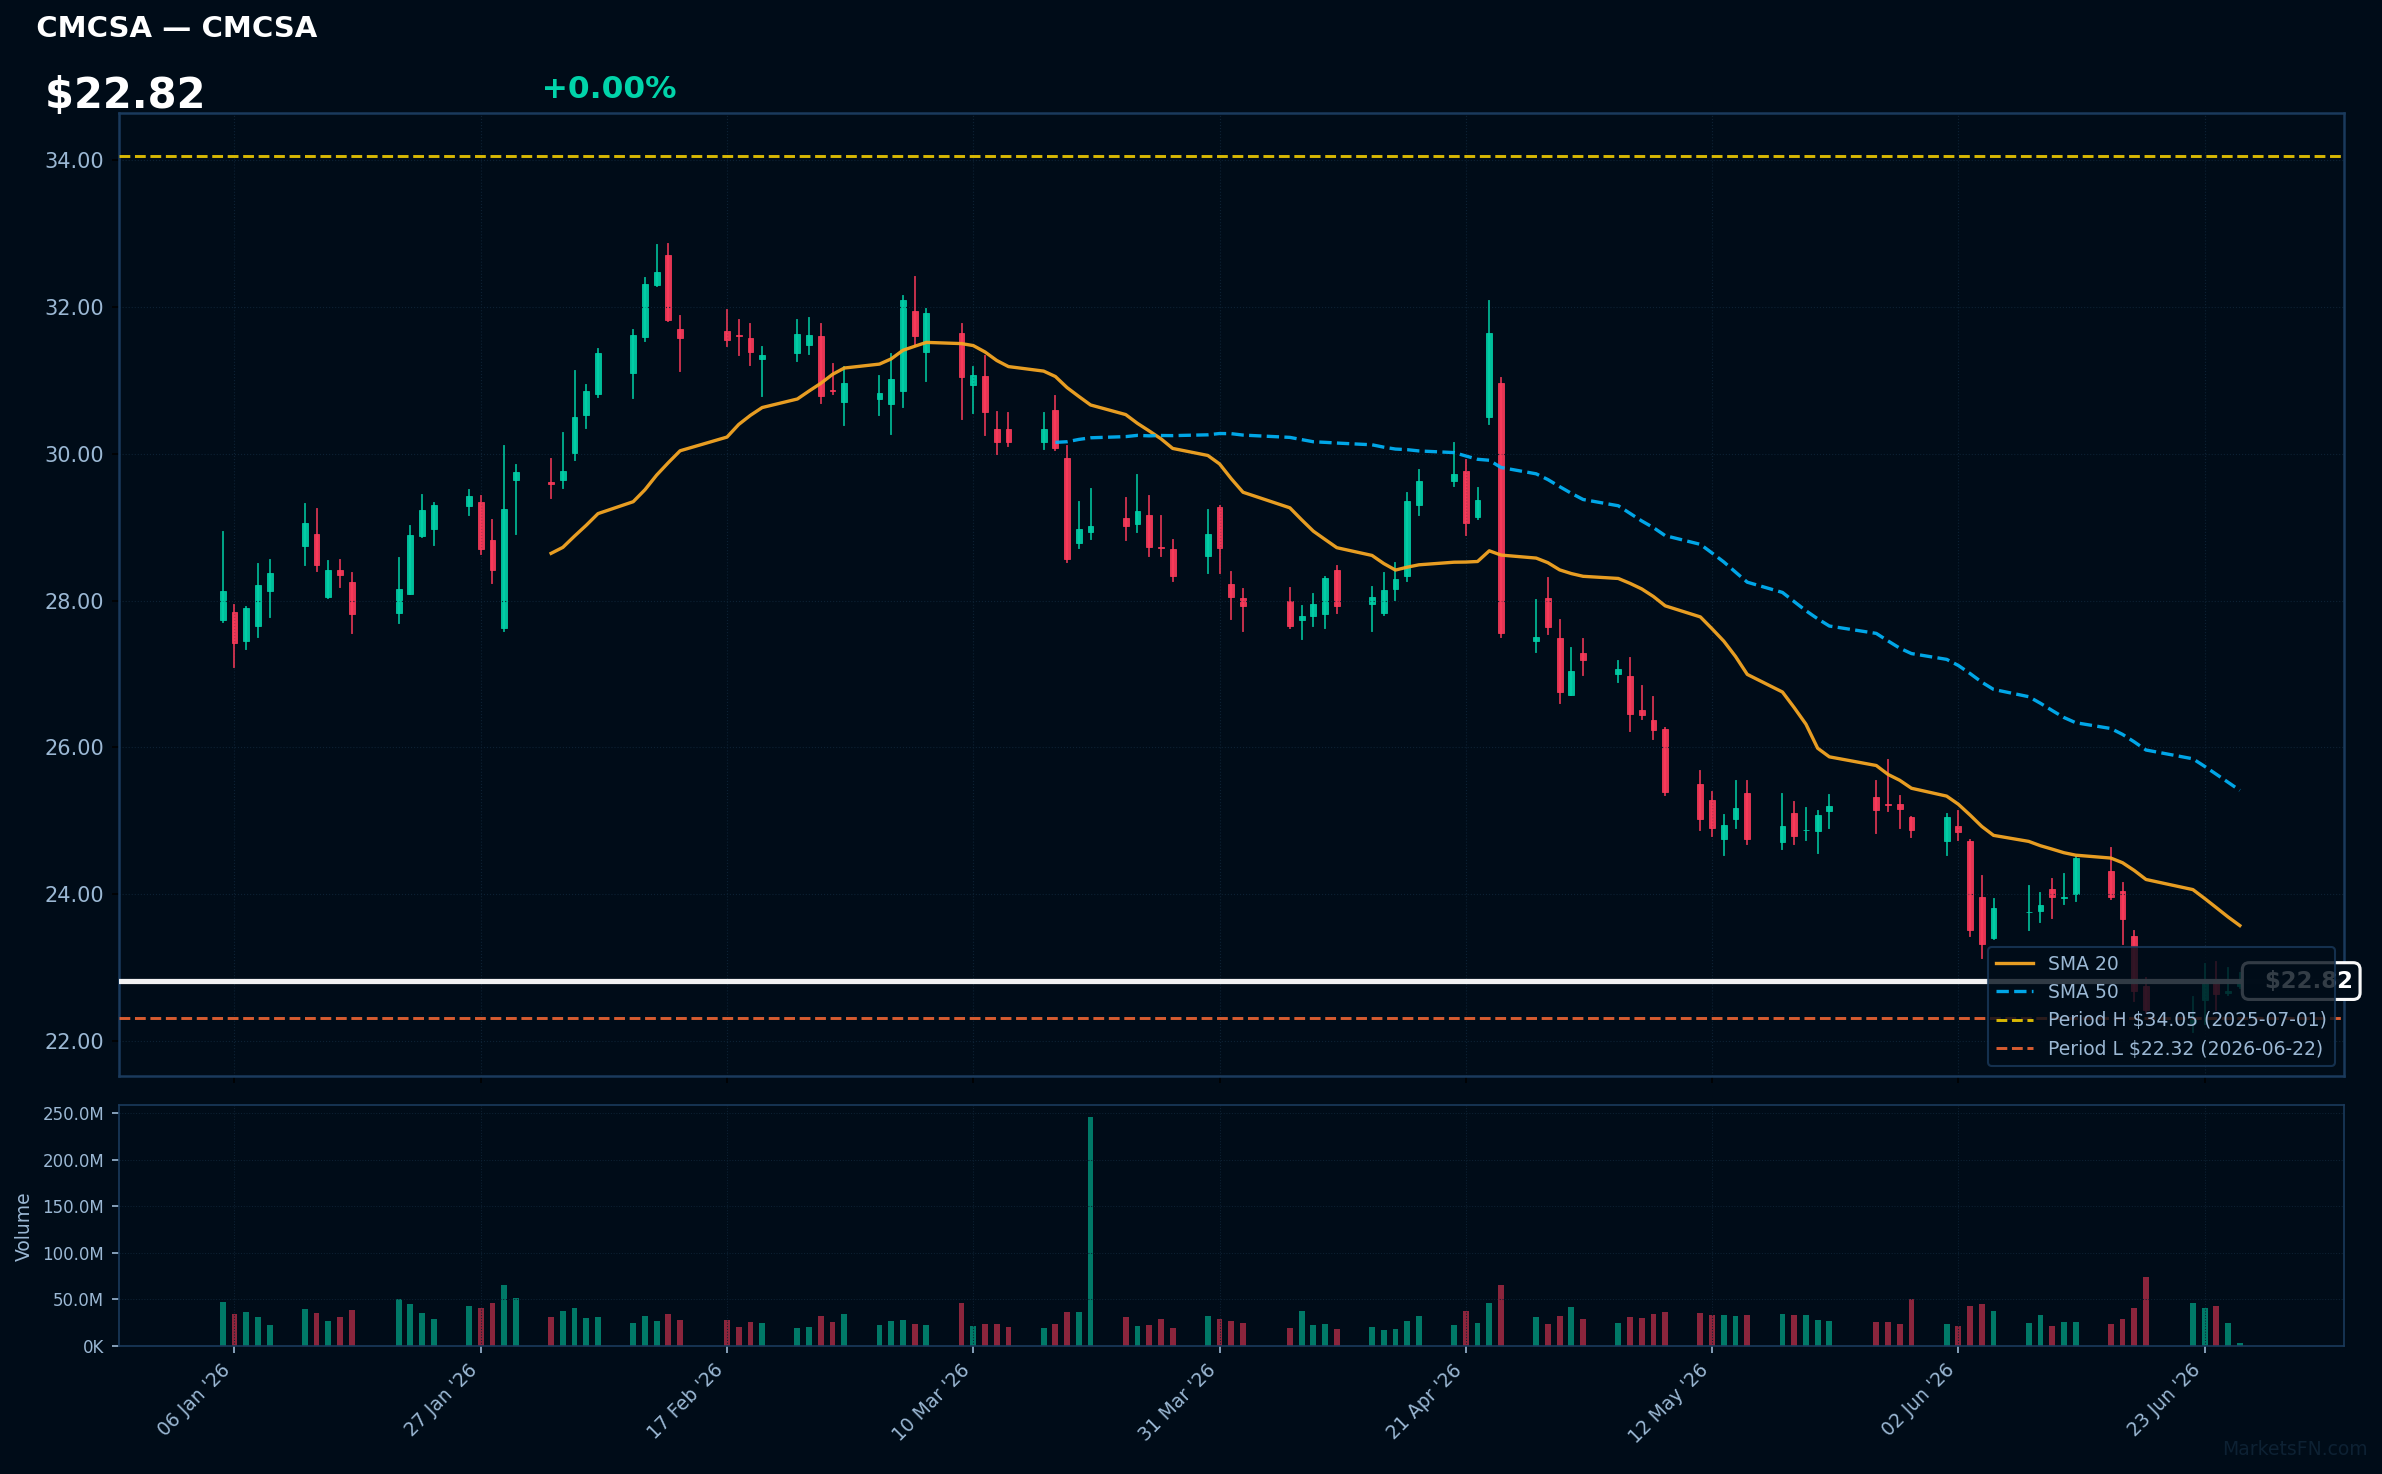
CMCSA | Comcast Corp | Communication Services | Price Last: $22.82 | % Realized: -30.85% | RSI: 35.6 | % above MA200: -17.6% | Trend: Below MA20, MA50, MA200
Comcast Corp is a media and telecommunications conglomerate providing cable television, internet, and phone services, as well as owning NBCUniversal, a major media company with film, television, and theme park assets, making it a significant player in both consumer connectivity and content creation.
Comcast Corp's current technical situation is bearish, with an RSI(14) of 35.6 indicating oversold conditions, price below all key MAs (MA20, MA50, MA200) in a sustained downtrend, and trading just 2.2% above its 52-Week low, suggesting a warning sign.
Related headlines
Market Commentary
The Nasdaq 100 stocks listed are currently near 52-week extremes, with some at all-time highs and others near their lowest levels over the past year. Stocks like MNST, AEP, FTNT, EA, and BIIB are at their 52-week highs, while PDD, MSTR, ISRG, CTSH, and CMCSA are near their 52-week lows. This indicates a significant divergence in performance within the Nasdaq 100.
The technology sector is being driven by various macro themes, with strong performers likely benefiting from trends such as gaming (EA), cybersecurity (FTNT), and biotech (BIIB). Conversely, stocks near their 52-week lows may be impacted by concerns around competition (PDD), market volatility (MSTR), or regulatory pressures (CMCSA).
Key levels to watch include the current 52-week extremes, as a breakout or breakdown could signal further momentum. For stocks at 52-week highs, a failure to sustain these levels could indicate a reversal, while stocks near 52-week lows may be poised for a rebound if they can gain traction above their current levels. Catalysts such as earnings reports and industry trends will be crucial in determining the direction of these stocks.
Methodology: All 101 Nasdaq 100 constituents screened. 52-week high = highest daily close over the past 252 trading days (approx. 1 year). 52-week low = lowest daily close over the same period. Distance = (current price / extreme − 1) × 100. Technical indicators computed on up to 1 year of daily OHLCV data.
Disclaimer: For informational purposes only. Not investment advice. Past performance is not indicative of future results.