Nasdaq 100 52-Week Highs & Lows Radar: ASML Holding NV (ASML), Palantir (PLTR) and more
· Stocks · MarketsFN Team
Nasdaq 100 52-Week Highs & Lows Radar: ASML Holding NV (ASML), Palantir (PLTR) and more
Screening all 101 Nasdaq 100 constituents for stocks nearest to their 52-week high and their 52-week low. Data as of June 18, 2026. % Realized = 52-week total return.
Legend: RSI > 70 = overbought · RSI < 30 = oversold · Green % Realized = positive 52W return · Red = negative.
📈 Nearest to 52-Week High
Sectors represented: Technology (5)
| Ticker | Company | Sector | Price Last | % Realized | 52-Week High Date | RSI | % above MA200 | Trend |
|---|---|---|---|---|---|---|---|---|
| ASML | ASML Holding NV | Technology | $1912.78 | +151.14% | 2026-06-18 | 65.0 | +50.9% | Above MA20, MA50, MA200 |
| ARM | Arm Holdings plc. ADR | Technology | $439.56 | +200.97% | 2026-06-18 | 69.1 | +161.9% | Above MA20, MA50, MA200 |
| MU | Micron Technology Inc | Technology | $1107.98 | +809.52% | 2026-06-18 | 65.2 | +176.6% | Above MA20, MA50, MA200 |
| AMAT | Applied Materials Inc | Technology | $635.40 | +267.62% | 2026-06-18 | 77.7 | +99.9% | Above MA20, MA50, MA200 |
| LRCX | Lam Research Corp | Technology | $398.77 | +332.32% | 2026-06-18 | 70.3 | +89.8% | Above MA20, MA50, MA200 |
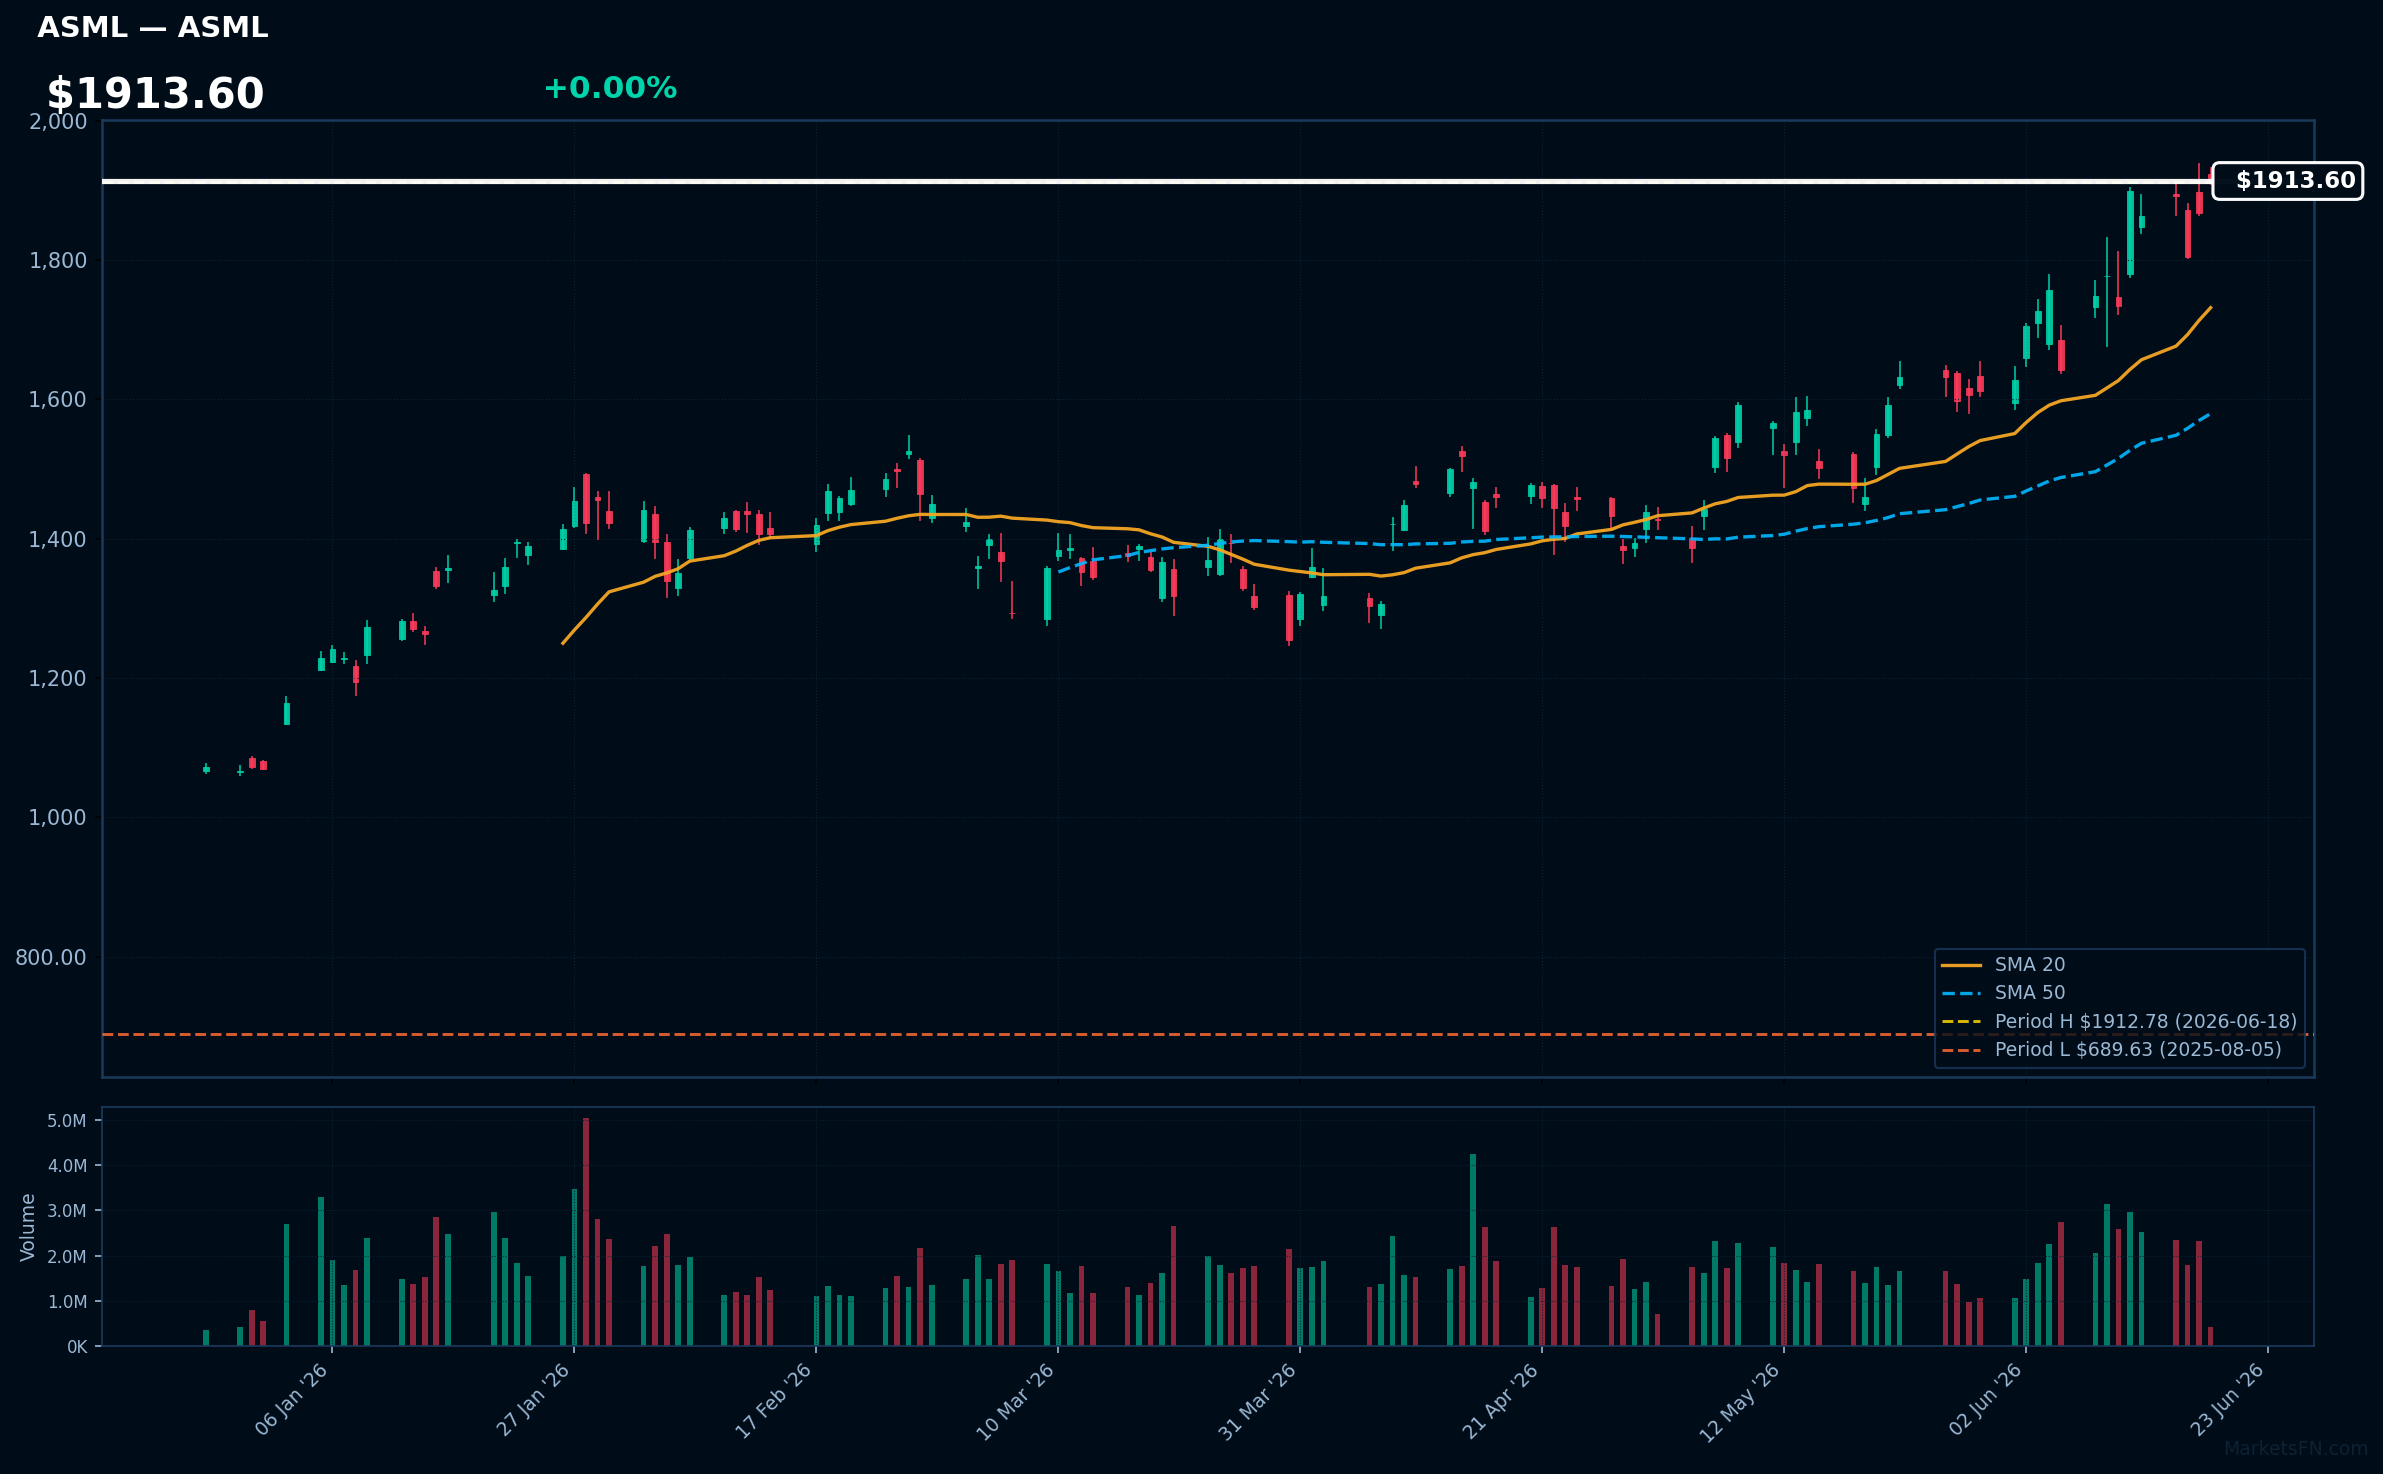
ASML | ASML Holding NV | Technology | Price Last: $1912.78 | % Realized: +151.14% | RSI: 65.0 | % above MA200: +50.9% | Trend: Above MA20, MA50, MA200
ASML Holding NV is a leading manufacturer of lithography systems used in semiconductor production. Investors should care because its technology is crucial for producing cutting-edge chips, driving growth in AI, 5G, and other emerging technologies.
ASML's current technical situation indicates strong momentum, with RSI(14) at 65.0 and a bullish MA alignment (price > MA20 > MA50 > MA200). The stock is 0.0% below its 52-Week high, nearing a potential breakout.
Related headlines
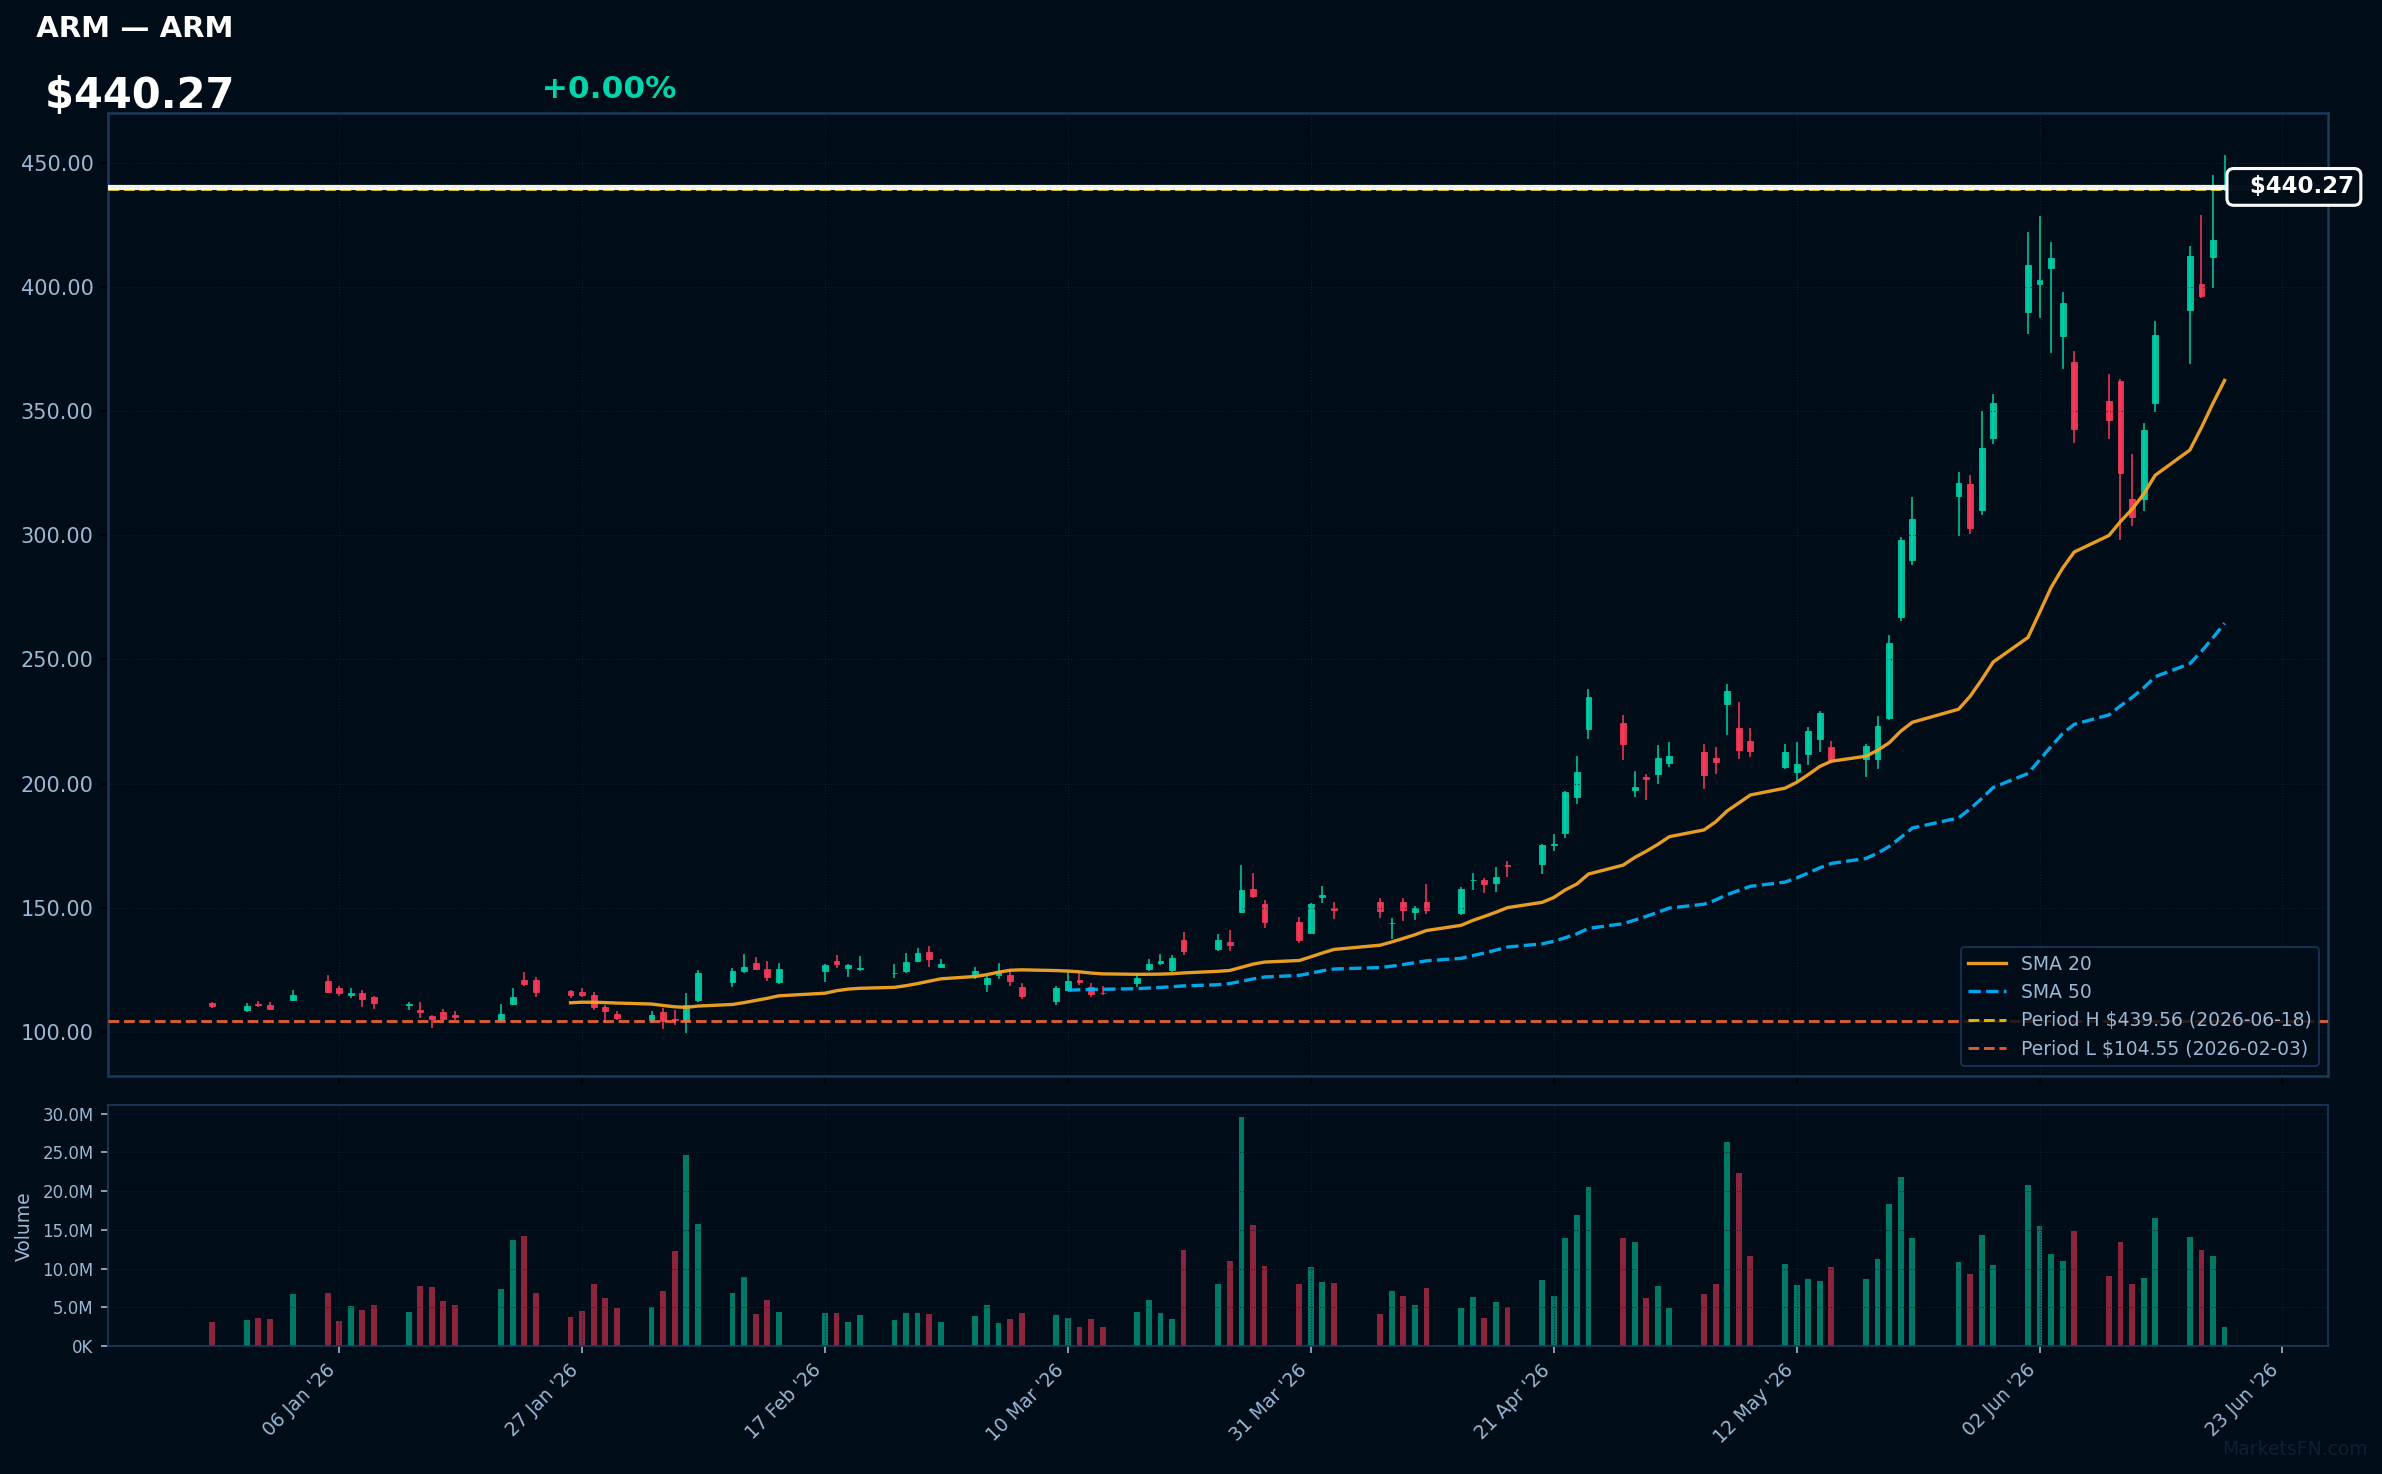
ARM | Arm Holdings plc. ADR | Technology | Price Last: $439.56 | % Realized: +200.97% | RSI: 69.1 | % above MA200: +161.9% | Trend: Above MA20, MA50, MA200
Arm Holdings plc designs and licenses semiconductor intellectual property, enabling companies to manufacture chips for various applications. Investors should care as its technology is ubiquitous in mobile, automotive, and IoT devices, driving growth in emerging markets.
The stock exhibits bullish MA alignment with price > MA20 > MA50 > MA200, RSI(14) at 69.1, nearing overbought territory. With a 201.0% 52-Week return and 0.0% below its 52-Week high, this indicates strong momentum, potentially setting up for a breakout.
Related headlines
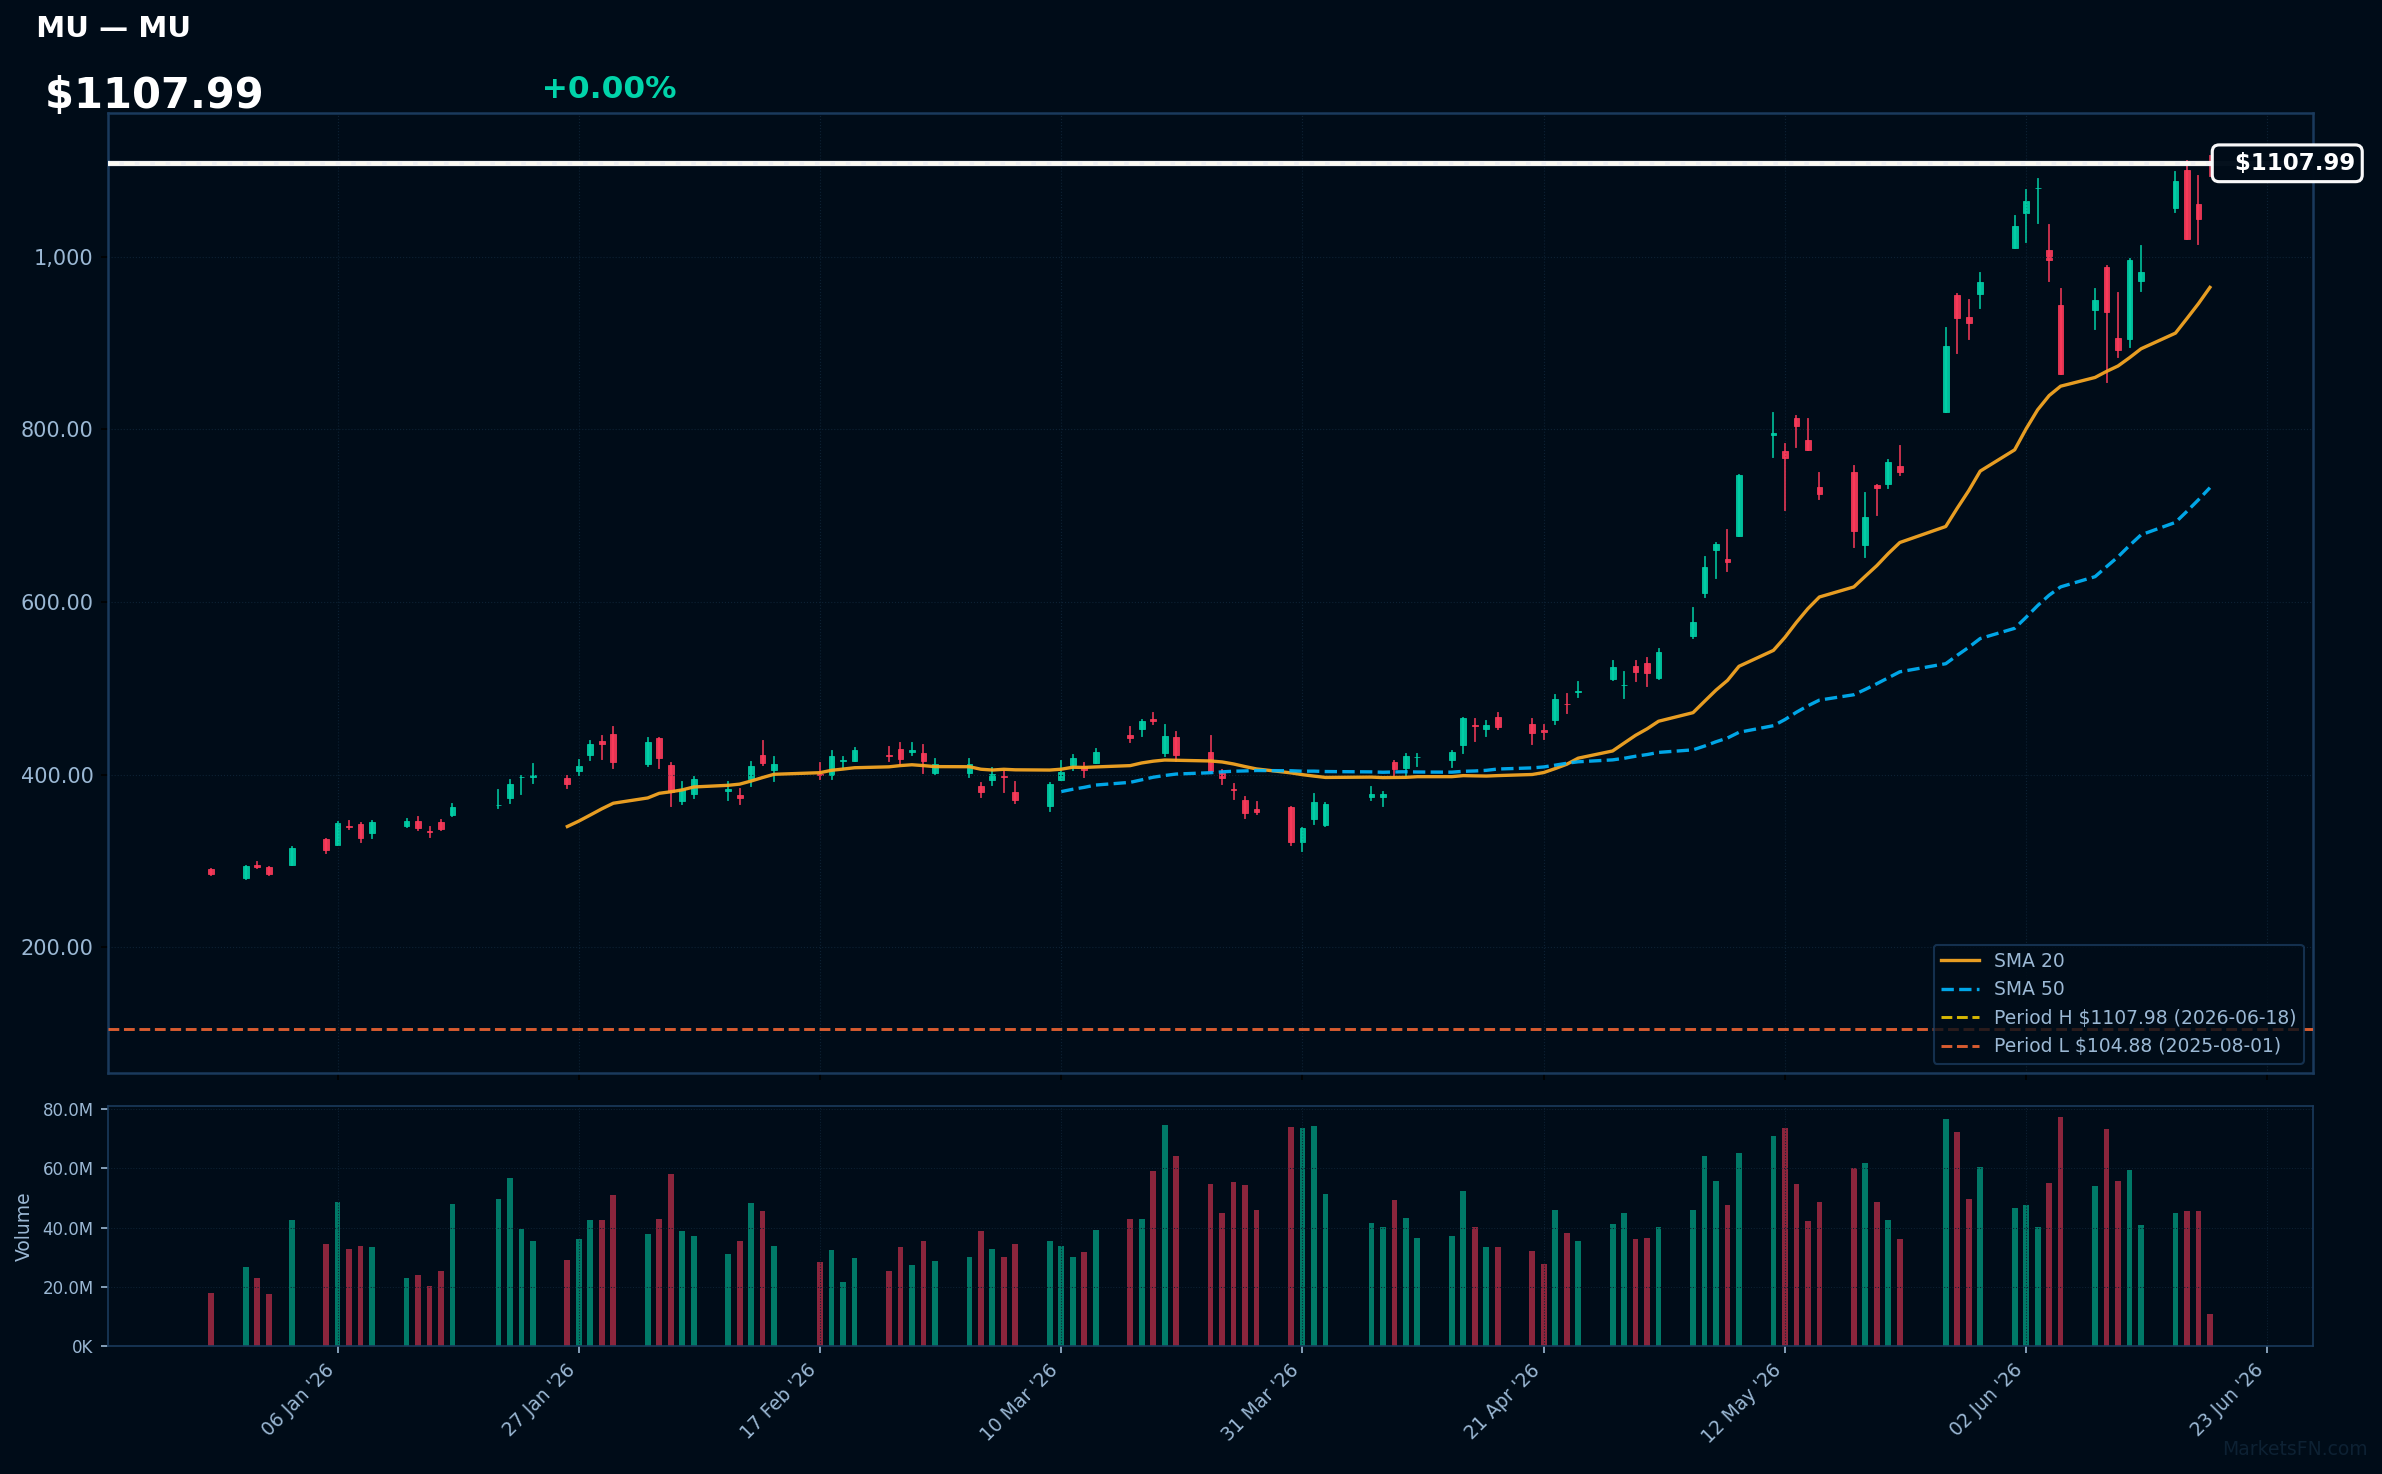
MU | Micron Technology Inc | Technology | Price Last: $1107.98 | % Realized: +809.52% | RSI: 65.2 | % above MA200: +176.6% | Trend: Above MA20, MA50, MA200
Micron Technology Inc designs and manufactures memory and storage products, including DRAM and NAND flash memory, used in various applications such as data centers, PCs, and mobile devices, making it a key player in the semiconductor industry.
Micron Technology Inc is in a sustained uptrend with price > MA20 > MA50 > MA200, RSI(14) at 65.2, and is 0.0% below its 52-Week high, indicating strong momentum with no immediate signs of reversal, supported by its bullish MA alignment.
Related headlines
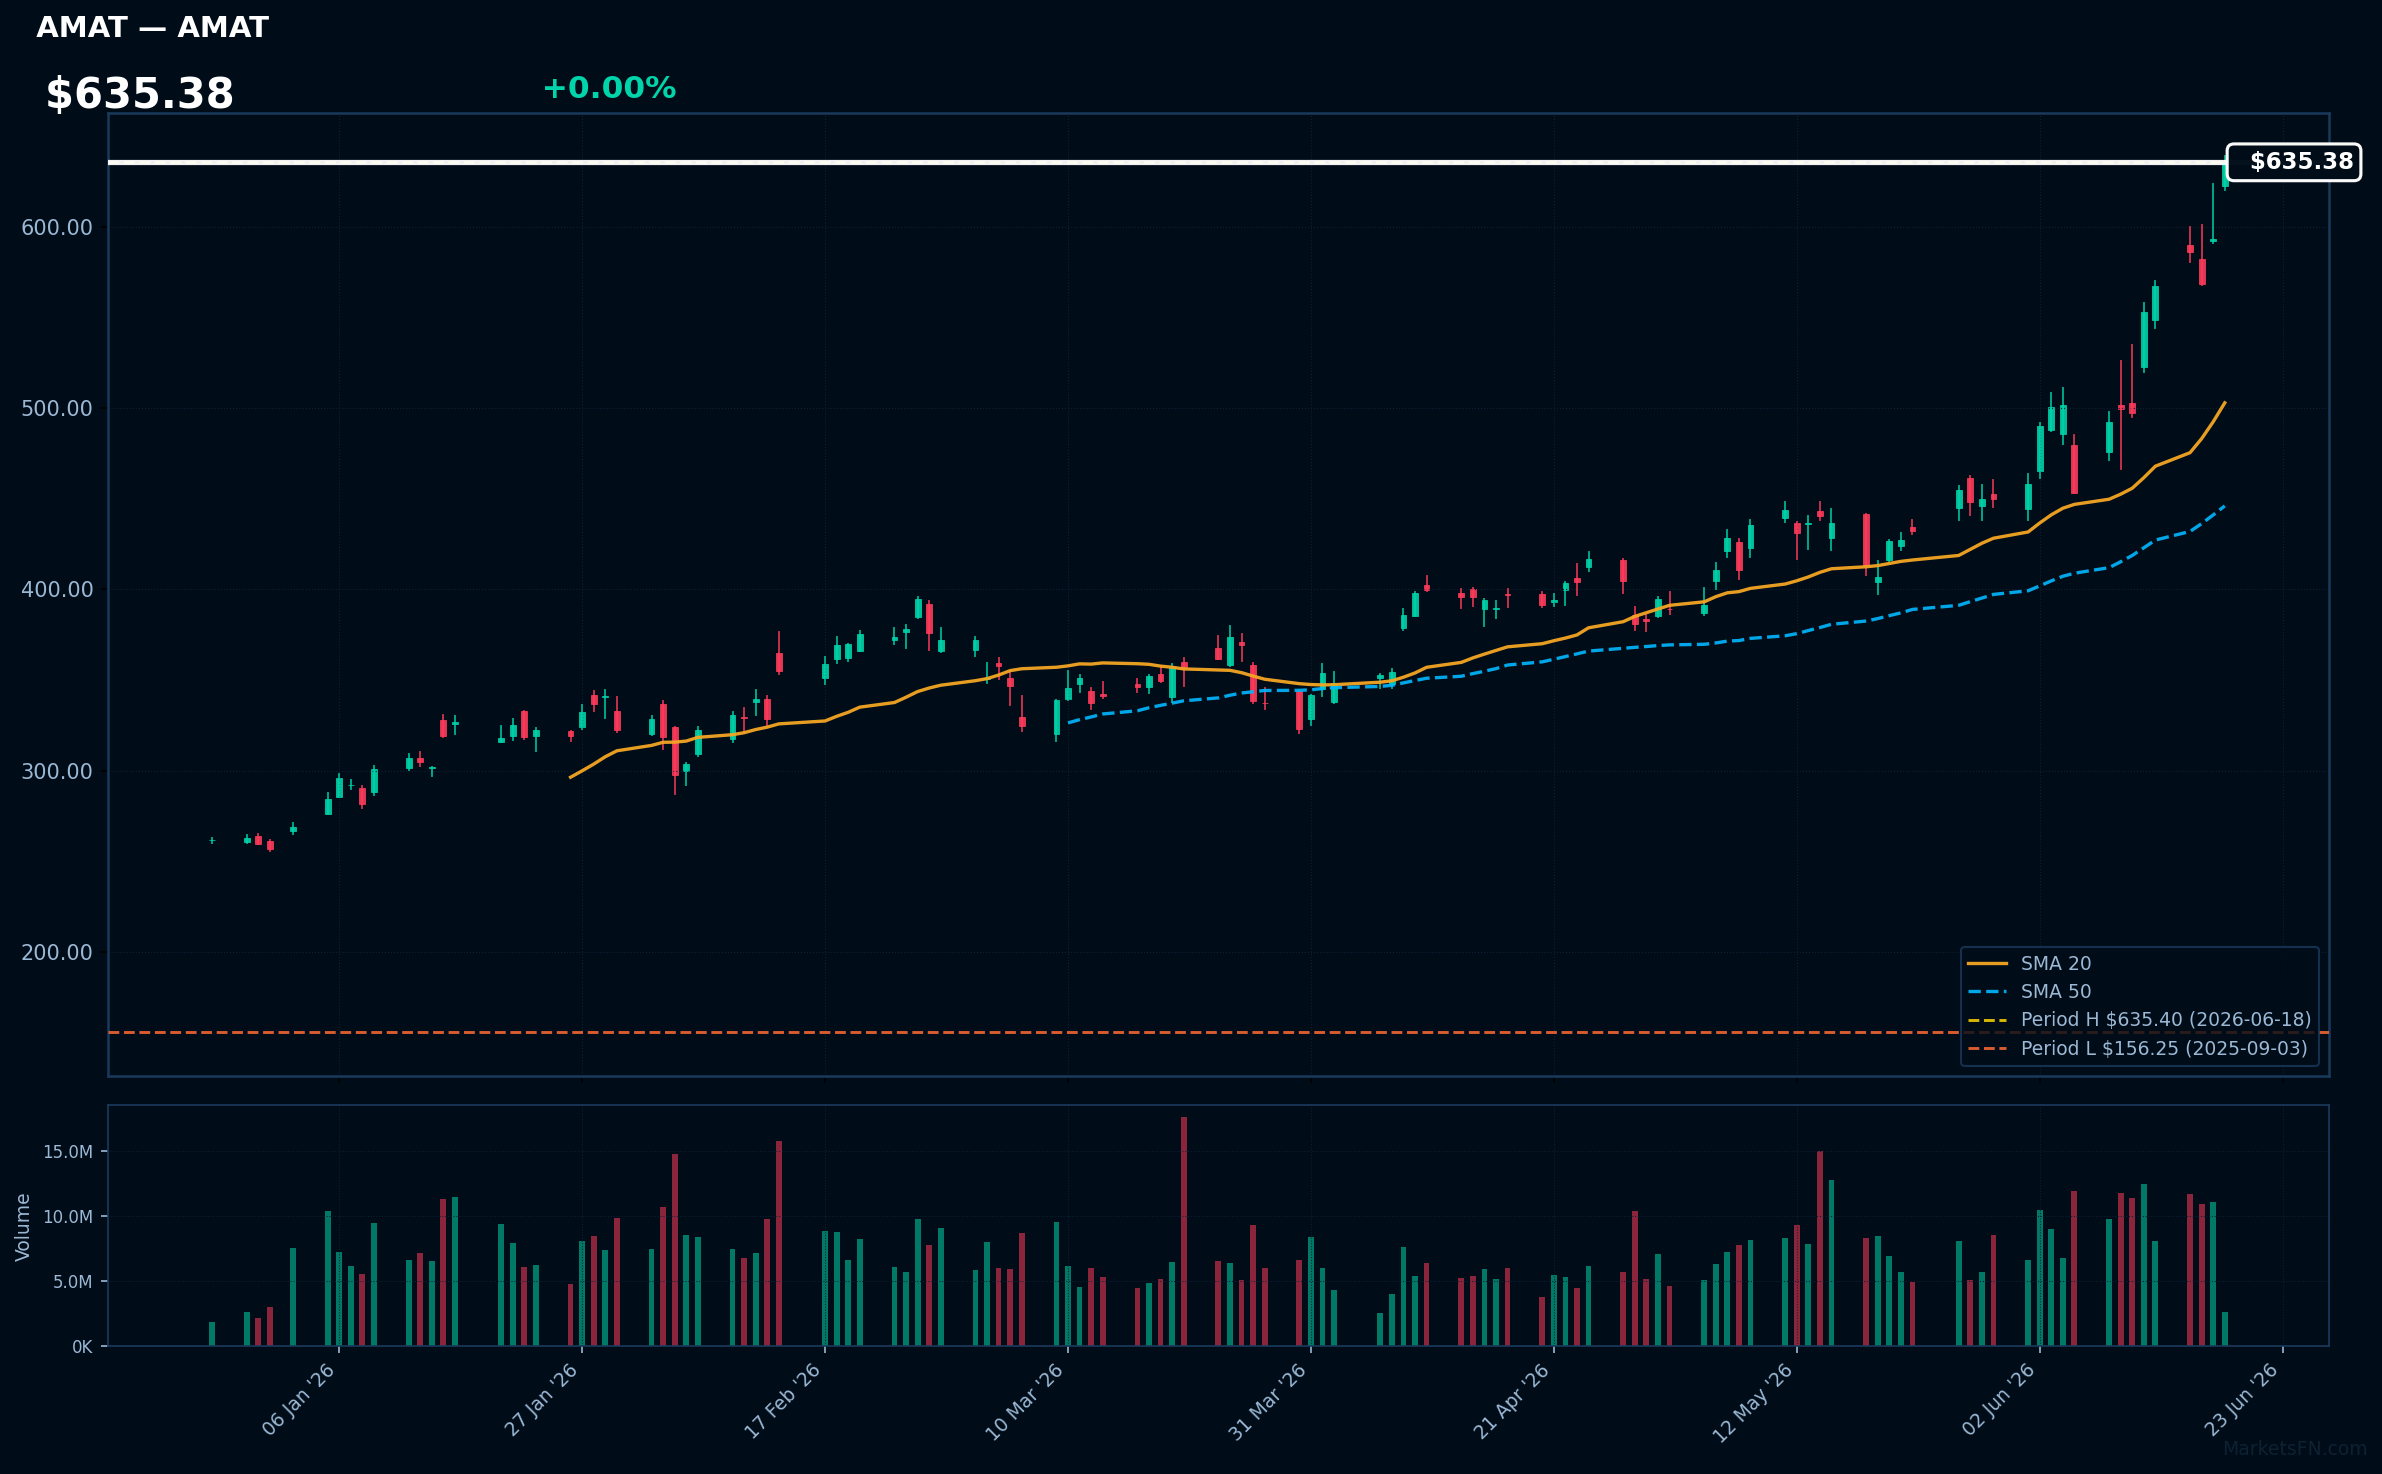
AMAT | Applied Materials Inc | Technology | Price Last: $635.40 | % Realized: +267.62% | RSI: 77.7 | % above MA200: +99.9% | Trend: Above MA20, MA50, MA200
Applied Materials Inc is a leading manufacturer of semiconductor fabrication equipment, providing critical technology for chip production. Investors should care because the company's innovations drive advancements in computing, AI, and renewable energy, positioning it for growth in high-demand markets.
The stock exhibits strong bullish momentum with an RSI(14) of 77.7, indicating overbought conditions. The MA alignment is bullish as price ($635.38) > MA20 > MA50 > MA200, suggesting a sustained uptrend. The stock is 0.0% below its 52-Week high, nearing a potential breakout.
Related headlines
- Applied Materials, ASML, Lam Hit Record Highs, Lead Chip Gear Stocks Rally
- Applied Materials shares jump on launch of integrated AR smart glasses system
- Applied Materials Stock Is One Of the S&P 500 Leaders Today. It's AI.
- Applied Materials Unveils SENZ, a Fully Integrated Visual System for Next-Gen Smart Glasses
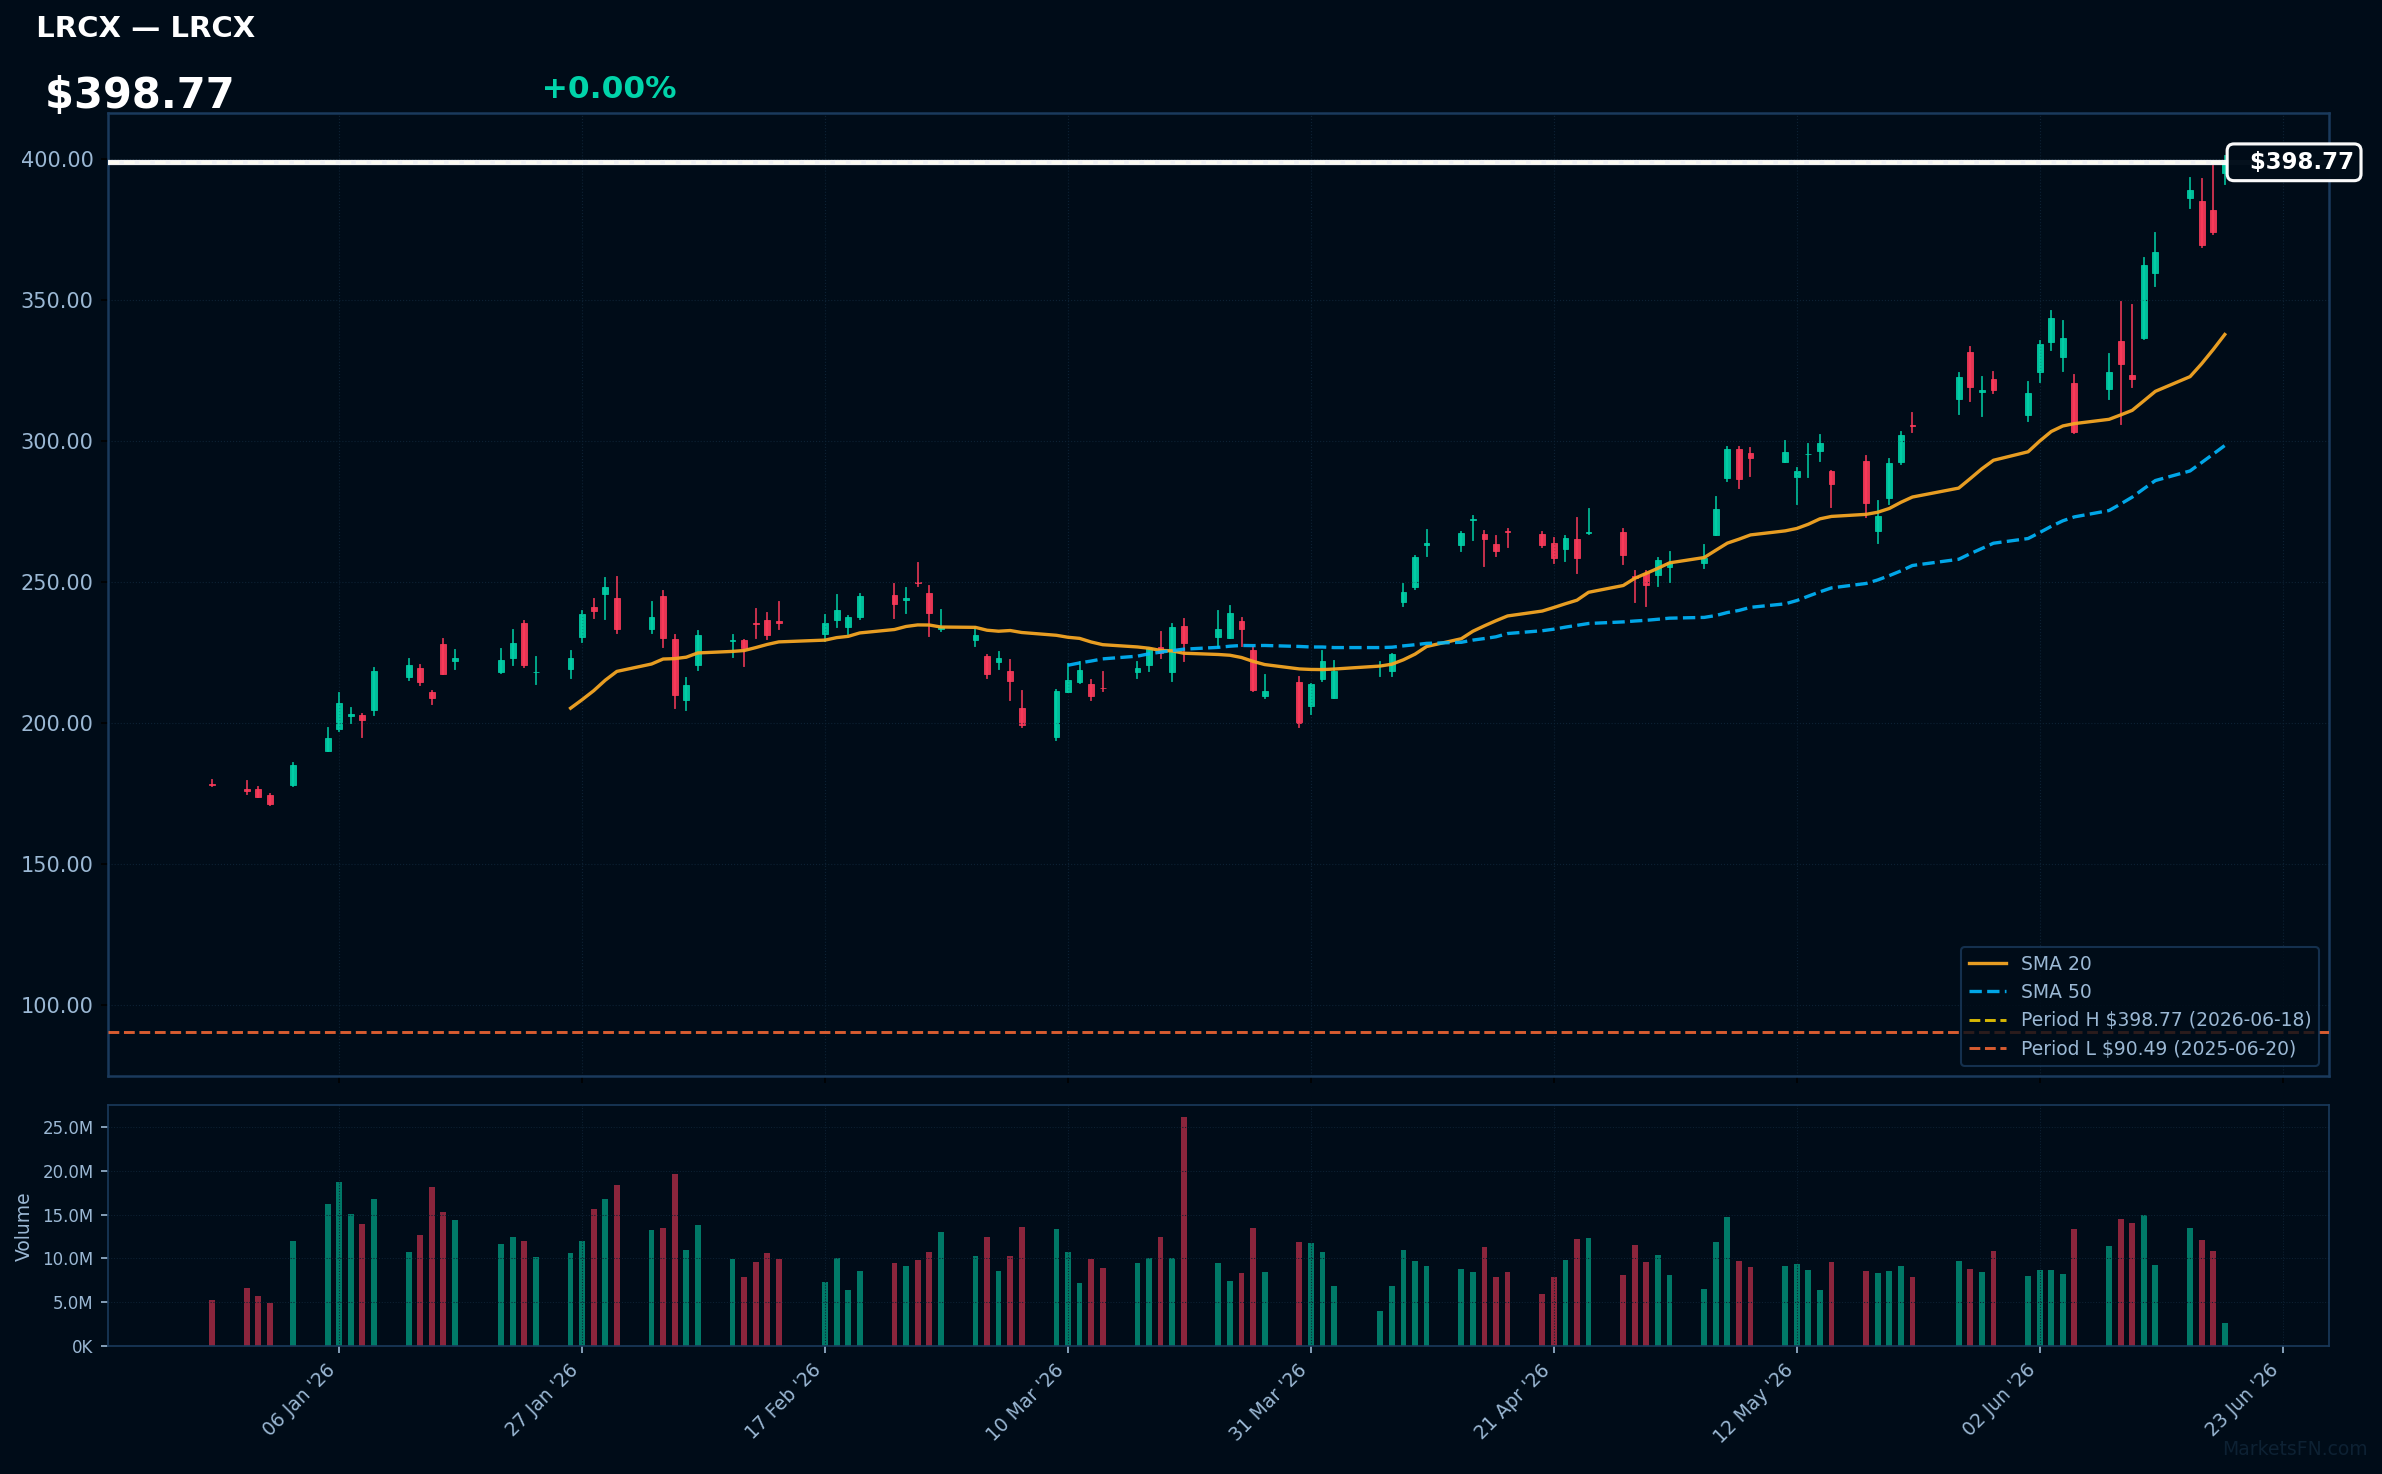
LRCX | Lam Research Corp | Technology | Price Last: $398.77 | % Realized: +332.32% | RSI: 70.3 | % above MA200: +89.8% | Trend: Above MA20, MA50, MA200
Lam Research Corp is a leading supplier of wafer fabrication equipment and services to the semiconductor industry. Investors should care because its products are crucial for chip manufacturing, making its performance closely tied to the semiconductor cycle and industry trends.
Lam Research Corp is in a sustained uptrend with price > MA20 > MA50 > MA200, RSI(14) at 70.3, indicating strong momentum. The stock is 0.0% below its 52-Week high, near a potential breakout level, with a 332.3% 52-Week return, suggesting continued upward pressure.
Related headlines
📉 Nearest to 52-Week Low
Sectors represented: Technology (3), Consumer Cyclical (1), Communication Services (1)
| Ticker | Company | Sector | Price Last | % Realized | 52-Week Low Date | RSI | % above MA200 | Trend |
|---|---|---|---|---|---|---|---|---|
| PLTR | Palantir Technologies Inc | Technology | $125.51 | -10.32% | 2026-06-18 | 38.9 | -21.5% | Below MA20, MA50, MA200 |
| INTU | Intuit Inc | Technology | $264.08 | -65.02% | 2026-06-18 | 30.7 | -49.5% | Below MA20, MA50, MA200 |
| PDD | PDD Holdings Inc ADR | Consumer Cyclical | $79.23 | -22.51% | 2026-06-18 | 31.6 | -28.4% | Below MA20, MA50, MA200 |
| ADBE | Adobe Inc | Technology | $193.18 | -48.90% | 2026-06-18 | 27.2 | -34.6% | Below MA20, MA50, MA200 |
| CMCSA | Comcast Corp | Communication Services | $22.65 | -29.46% | 2026-06-18 | 28.6 | -18.8% | Below MA20, MA50, MA200 |
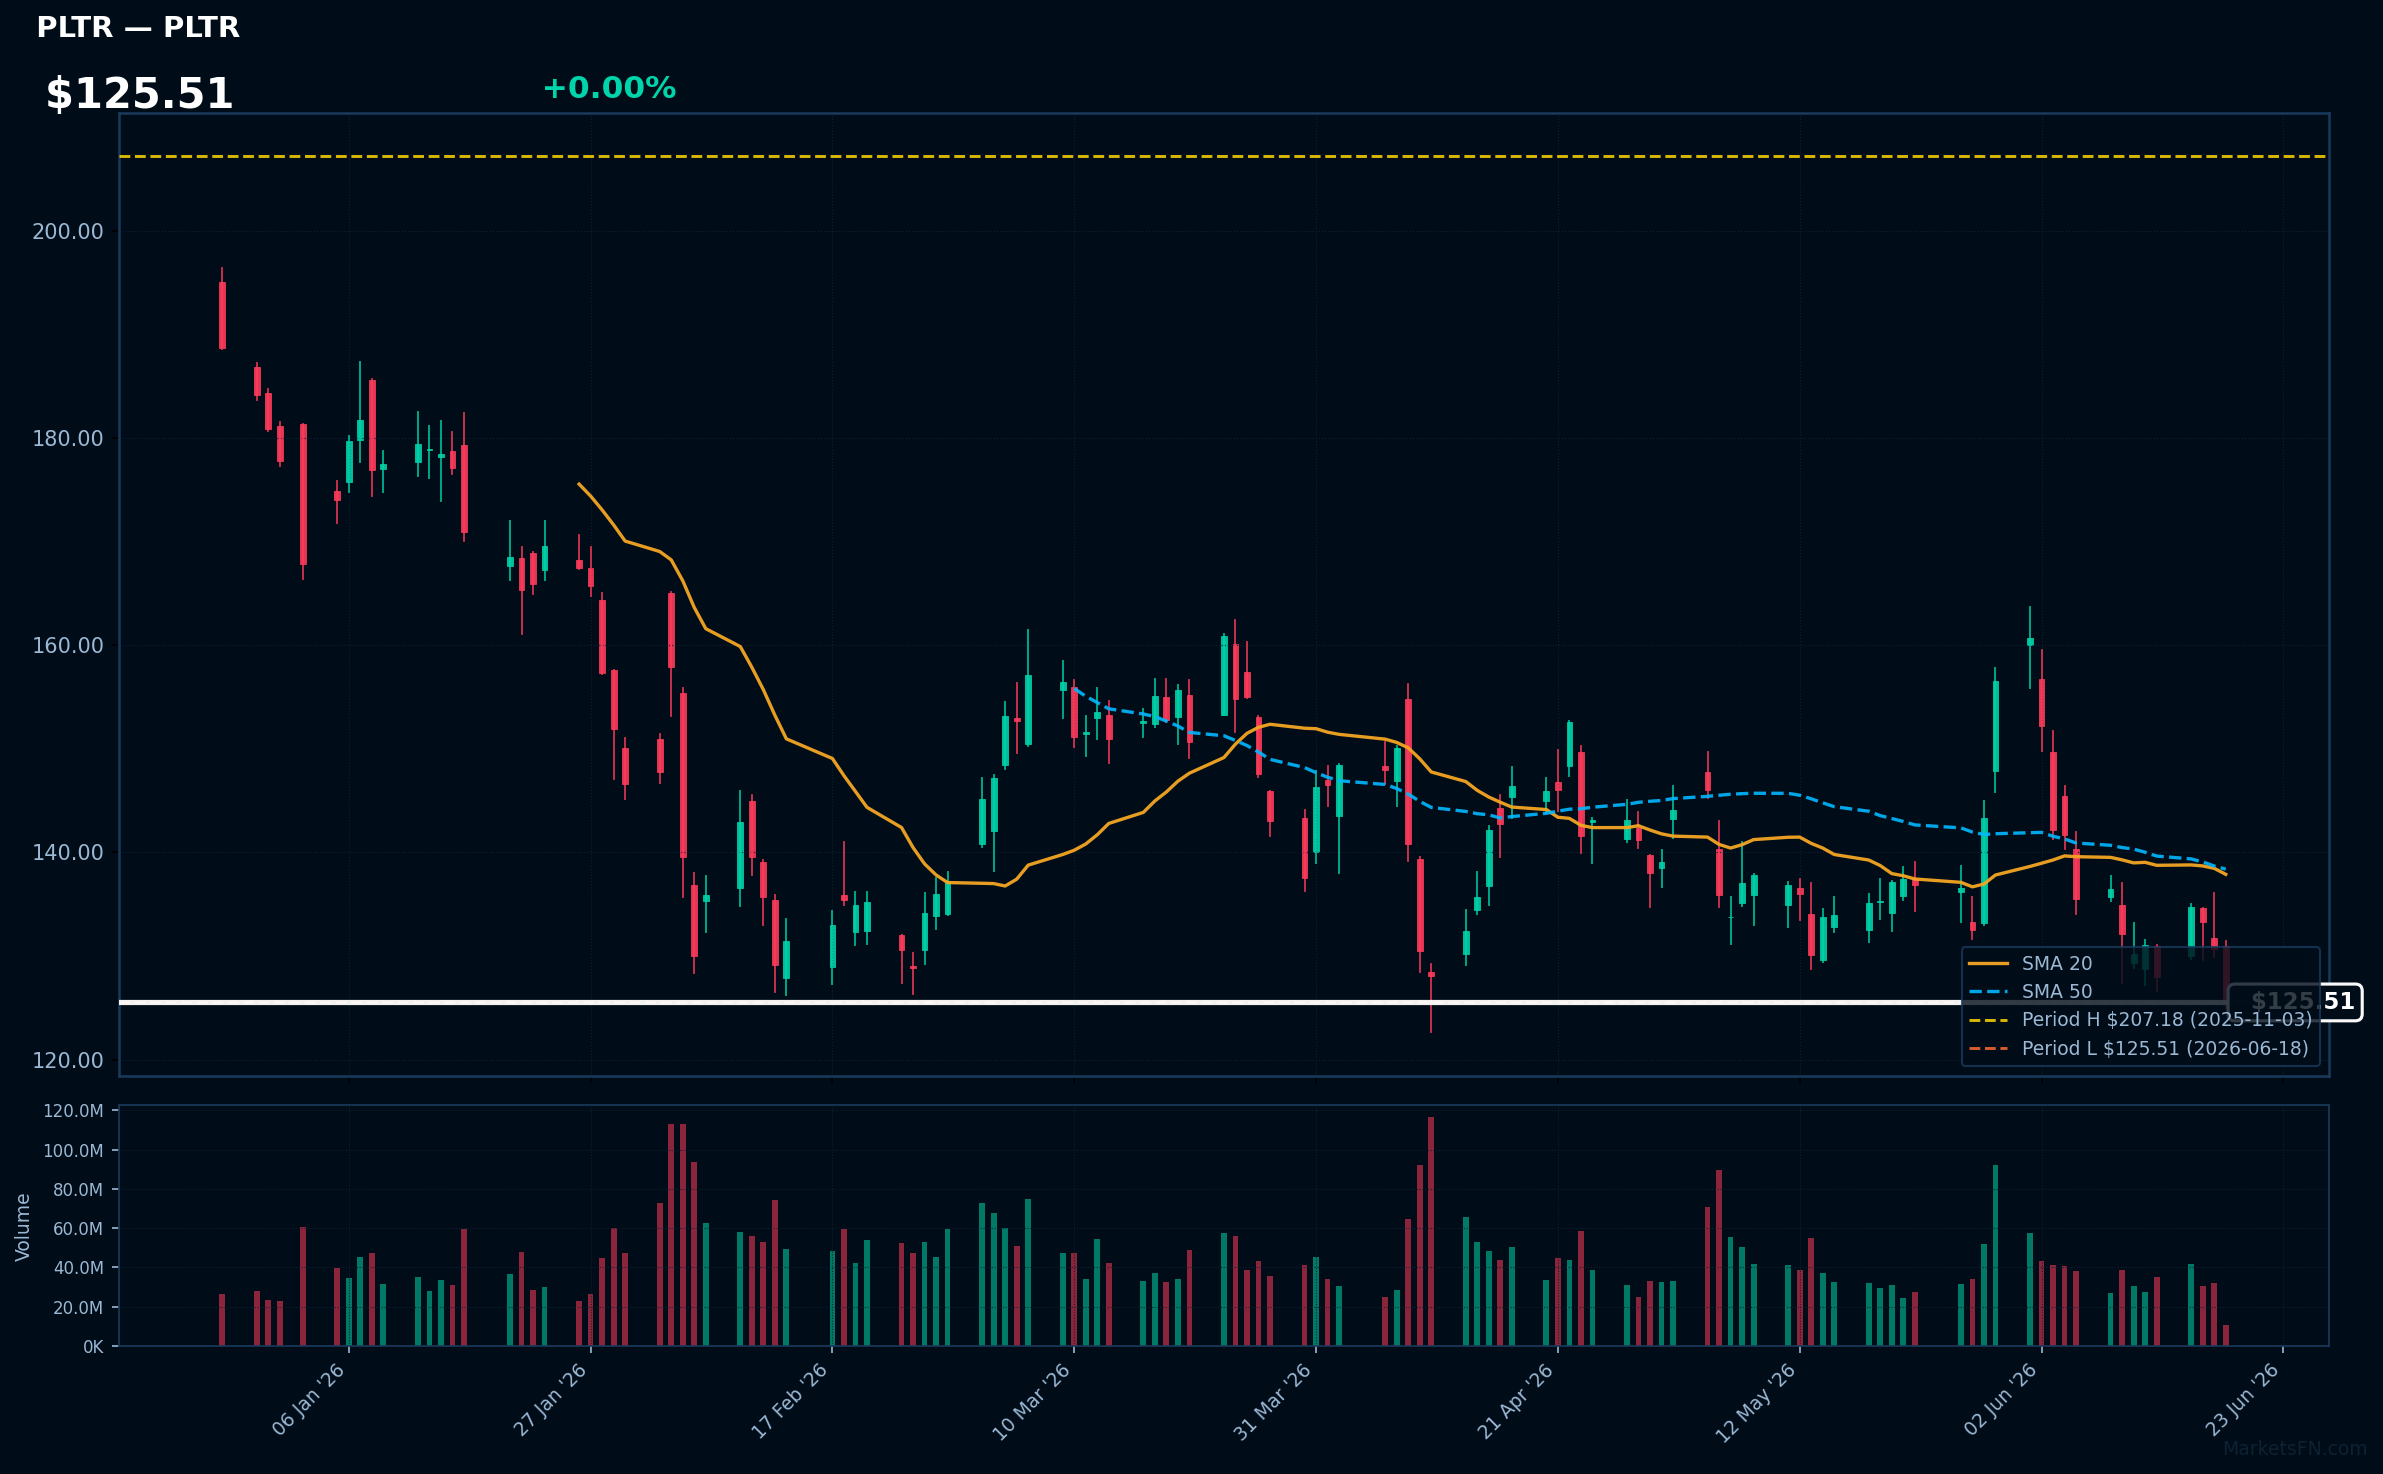
PLTR | Palantir Technologies Inc | Technology | Price Last: $125.51 | % Realized: -10.32% | RSI: 38.9 | % above MA200: -21.5% | Trend: Below MA20, MA50, MA200
Palantir Technologies Inc provides data integration and analytics software to government agencies and commercial organizations, enabling them to make data-driven decisions. Investors should care because its software is used in critical areas like defense, healthcare, and finance.
PLTR's technical situation is bearish, with an RSI(14) of 38.9 indicating oversold conditions, and a bearish MA alignment (price < MA20 < MA50 < MA200). The stock is testing major support at its 52-Week low, having returned -10.3% over the 52-Week period.
Related headlines
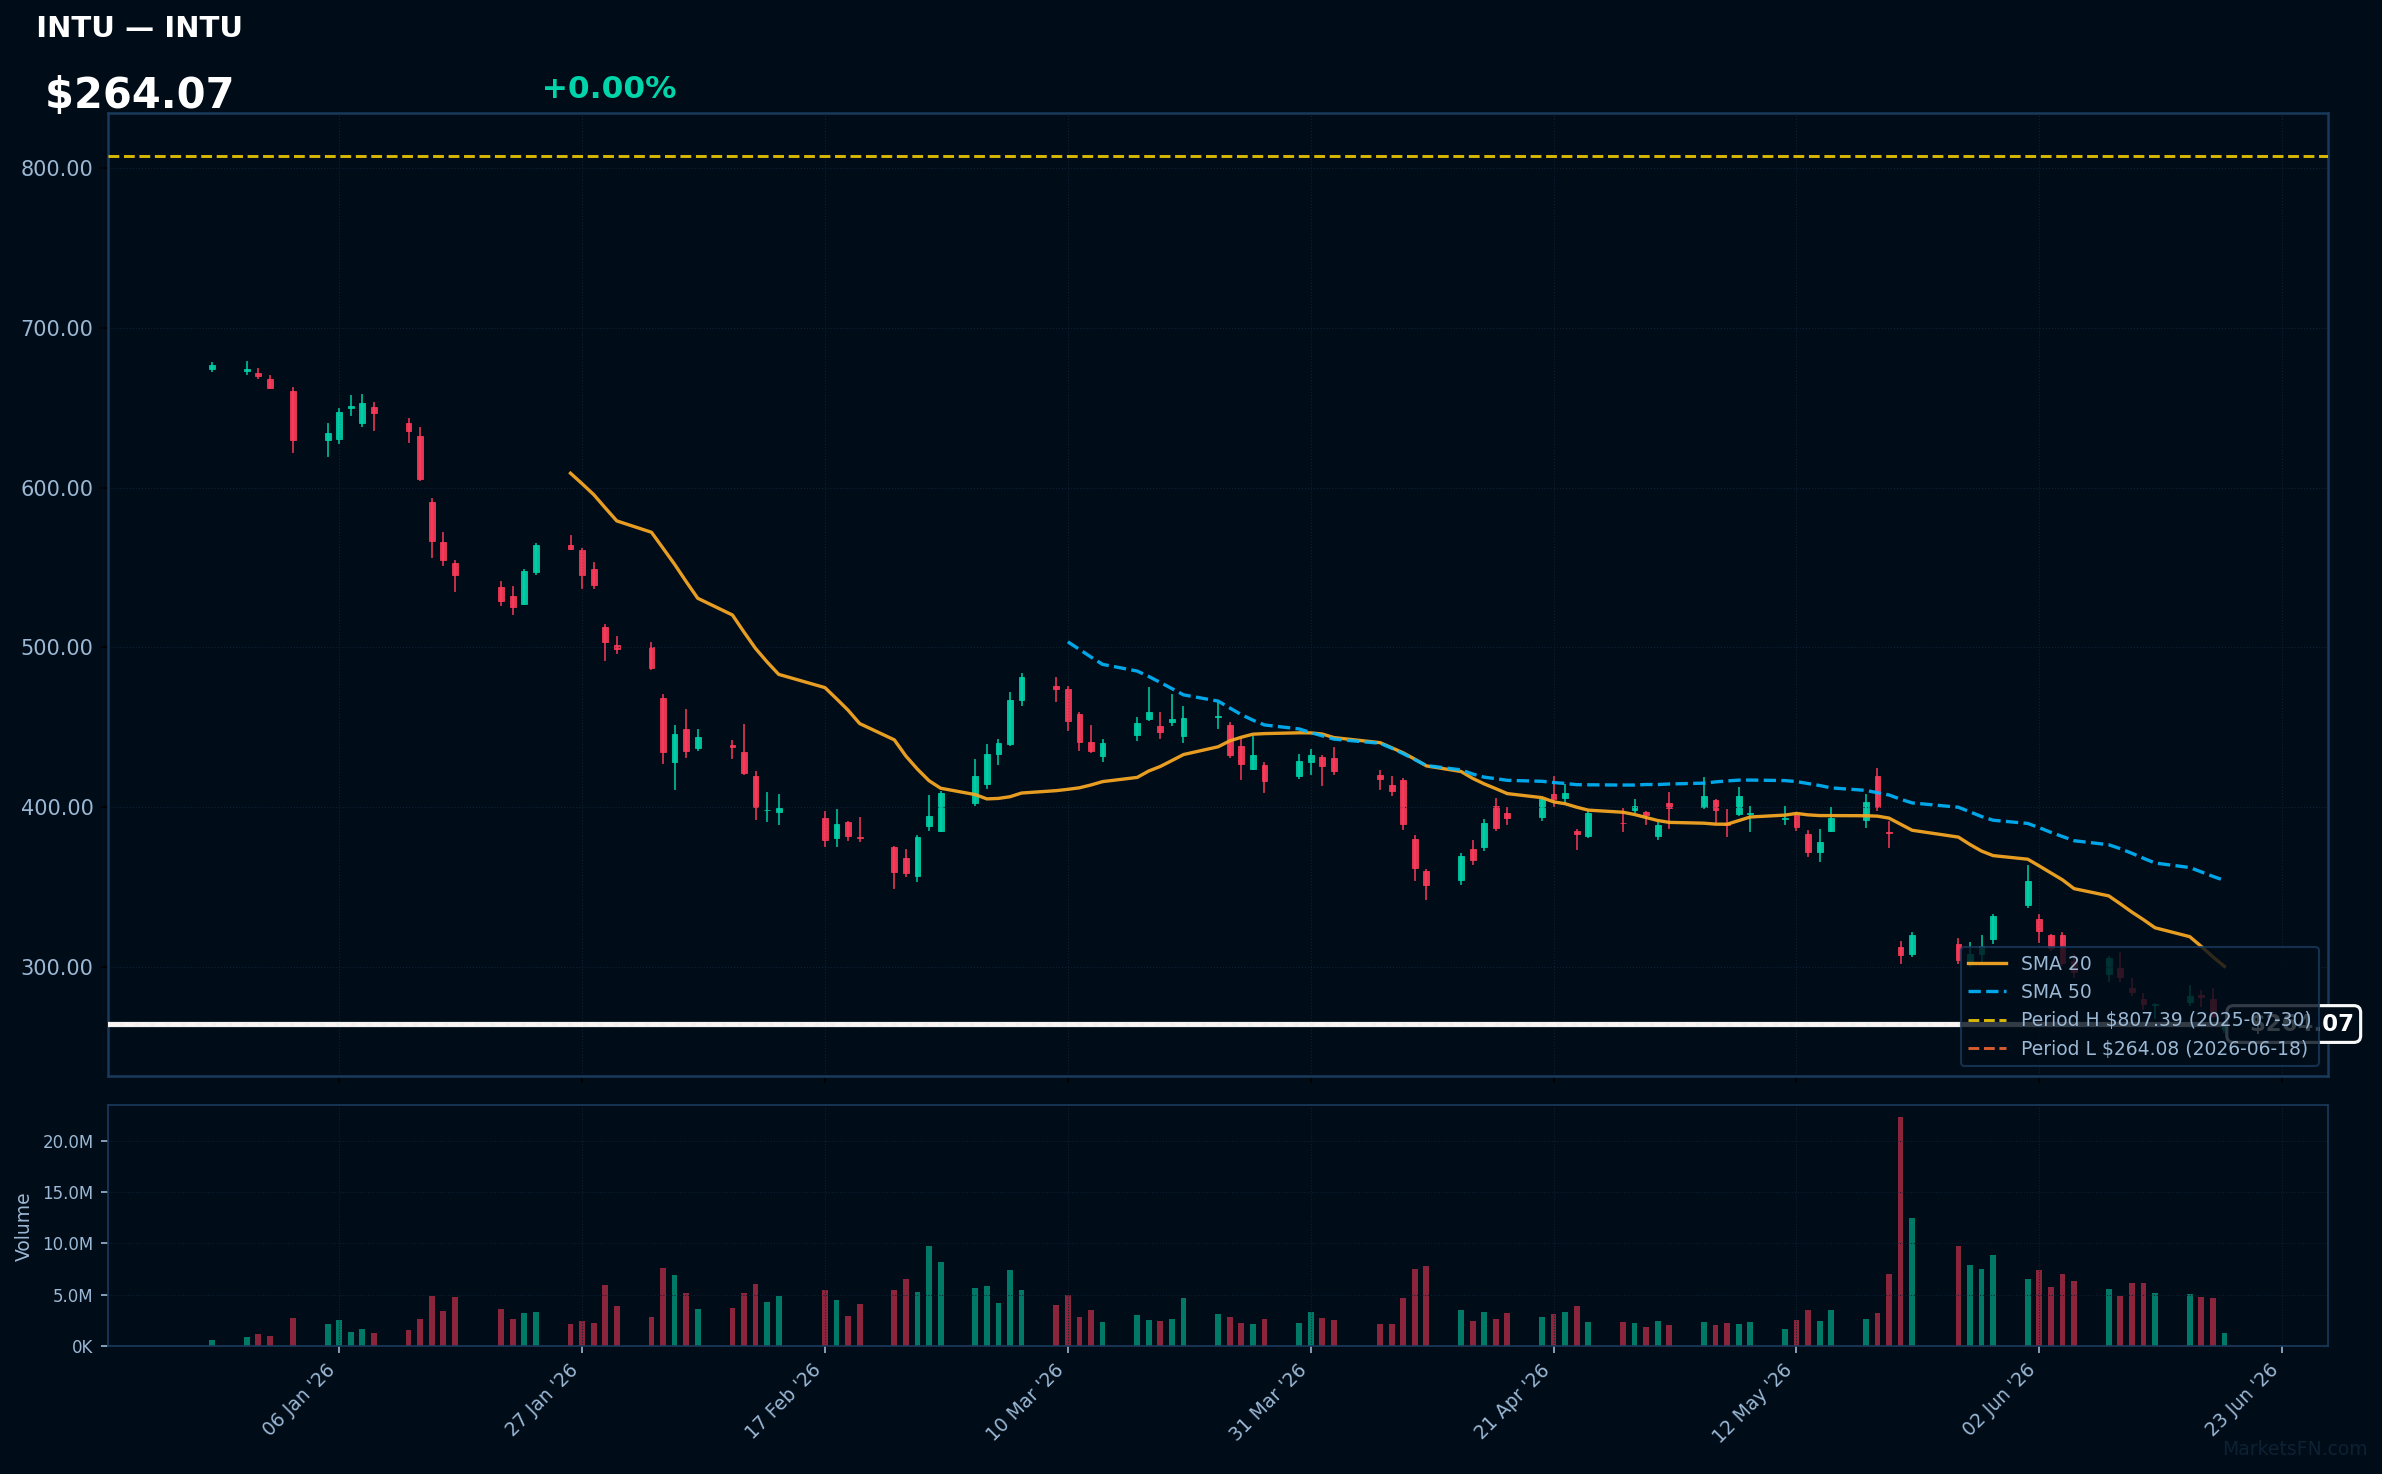
INTU | Intuit Inc | Technology | Price Last: $264.08 | % Realized: -65.02% | RSI: 30.7 | % above MA200: -49.5% | Trend: Below MA20, MA50, MA200
Intuit Inc (INTU) is a financial software company providing tax preparation, accounting, and payroll solutions. Investors should care about its performance as it reflects the demand for digital financial management tools and the company's ability to innovate and maintain market share.
INTU's technical situation is bearish, with an RSI(14) of 30.7 indicating oversold conditions, and a sustained downtrend as price ($264.07) remains below MA20, MA50, and MA200. The stock is testing major support at its 52-Week low.
Related headlines
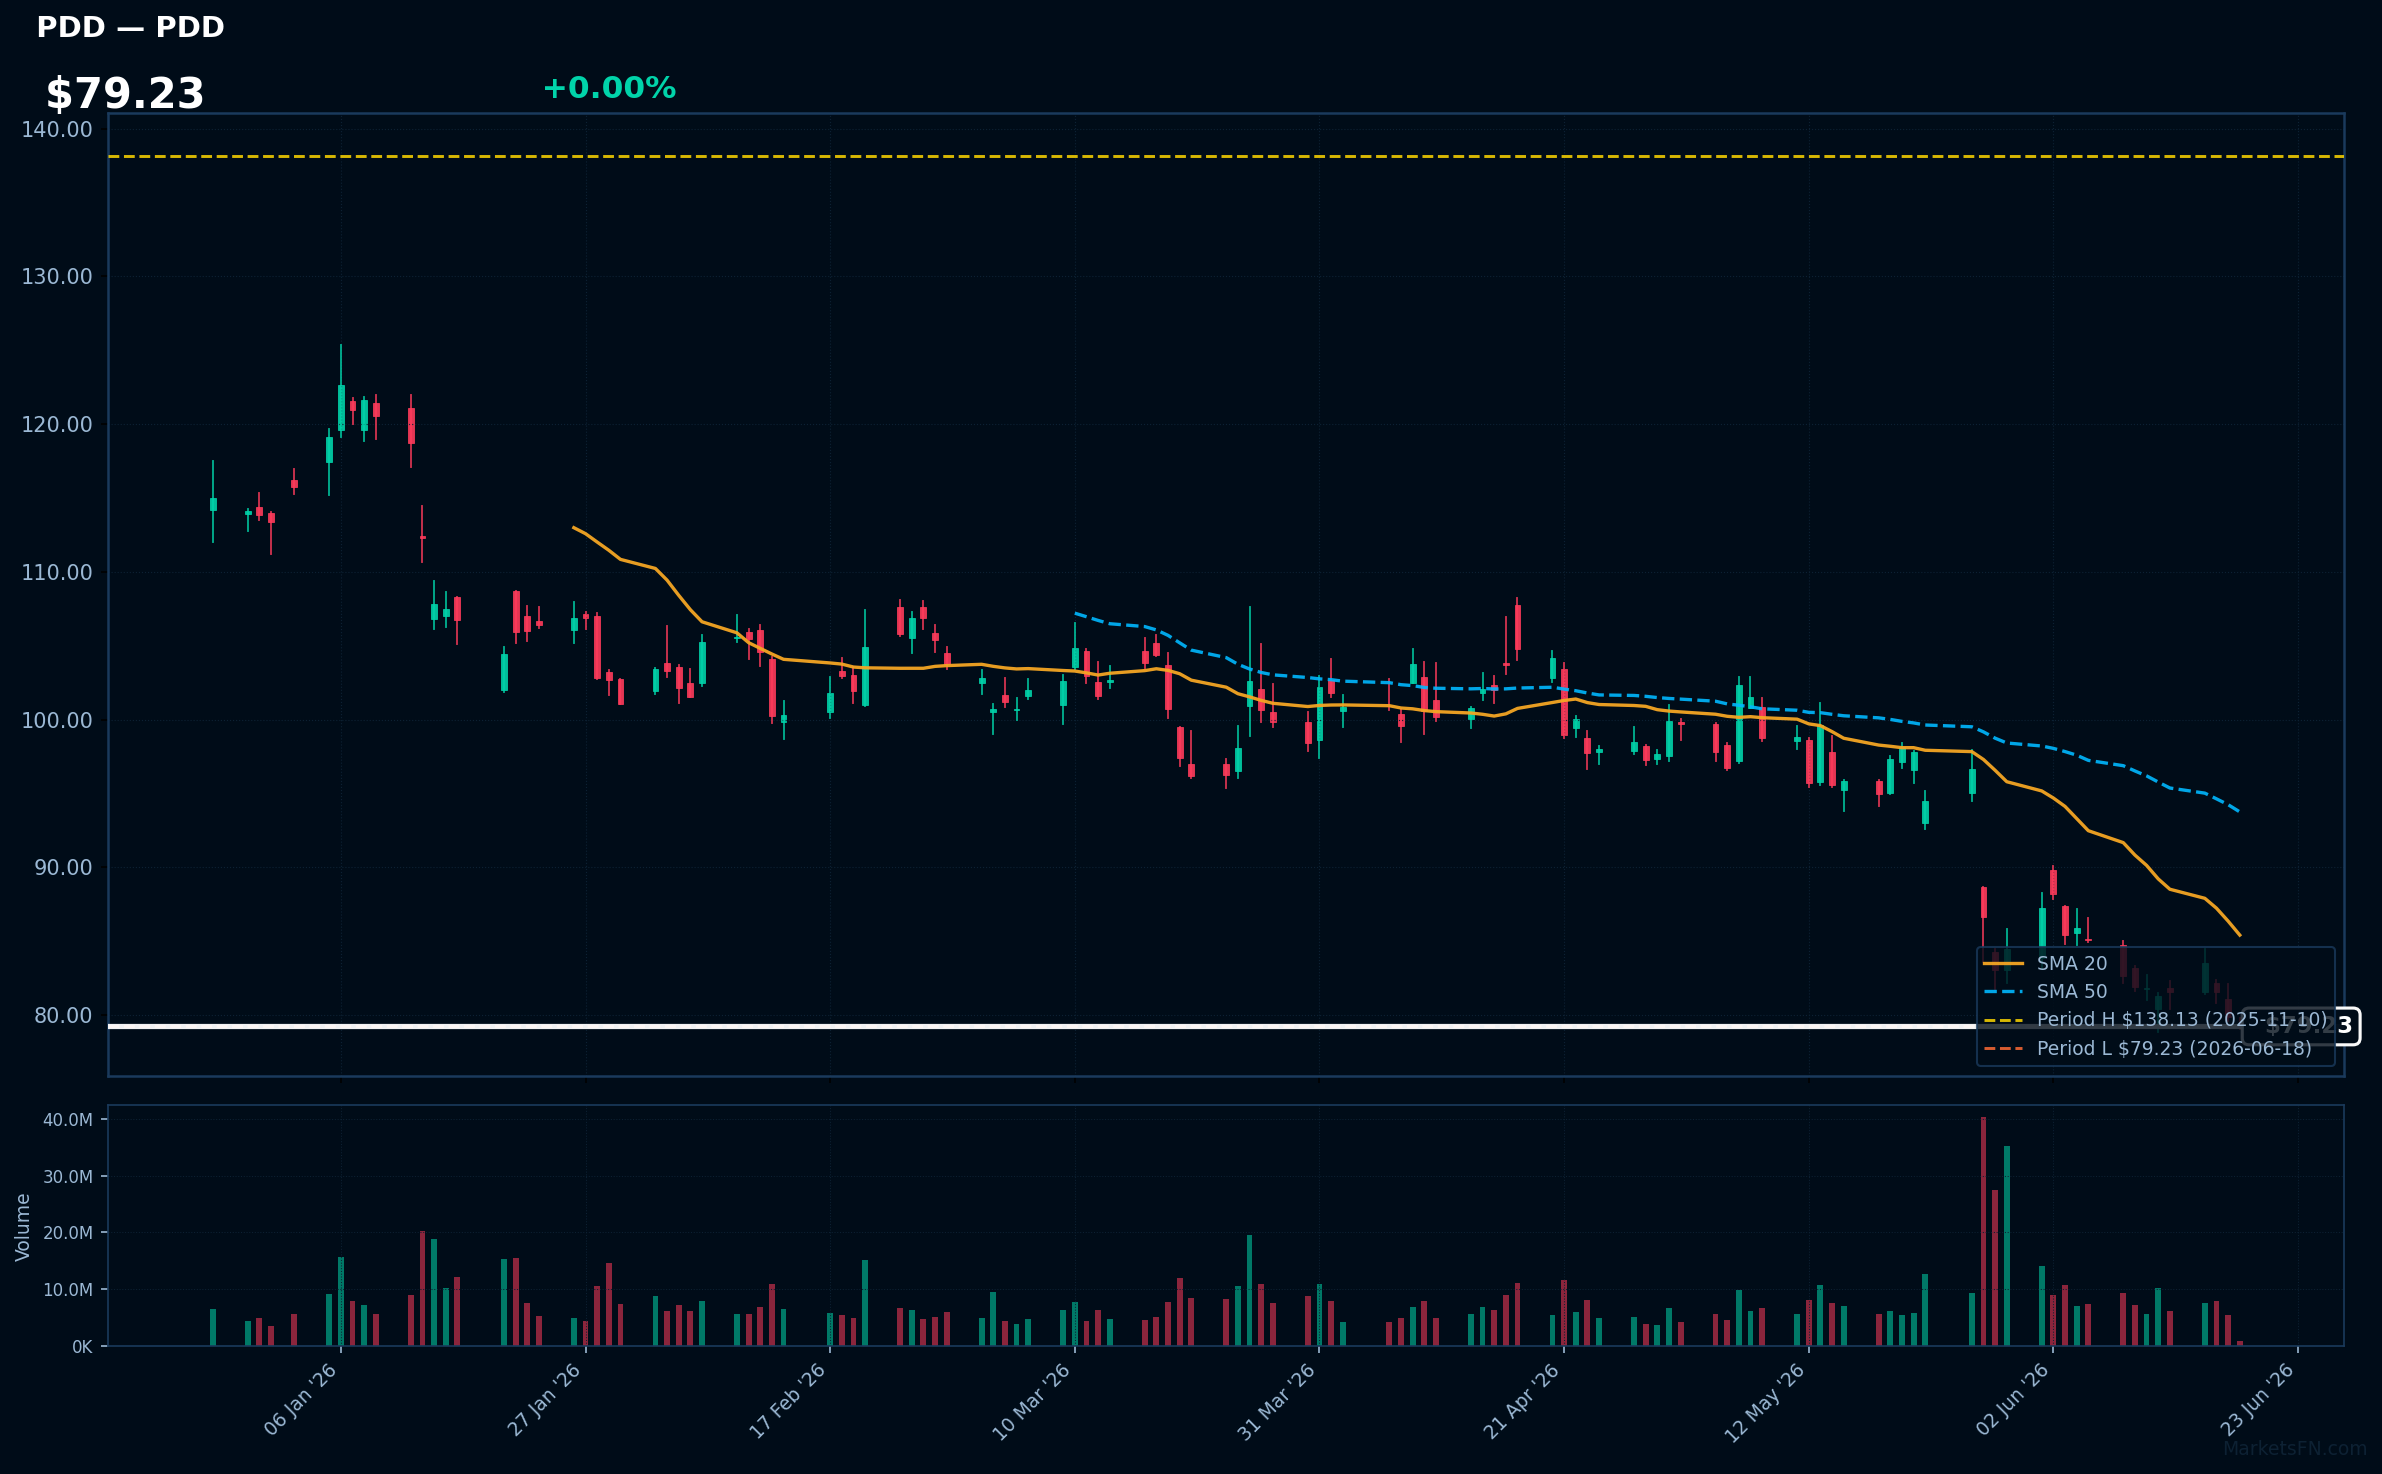
PDD | PDD Holdings Inc ADR | Consumer Cyclical | Price Last: $79.23 | % Realized: -22.51% | RSI: 31.6 | % above MA200: -28.4% | Trend: Below MA20, MA50, MA200
PDD Holdings Inc ADR operates e-commerce platforms, primarily through Temu and Pinduoduo, focusing on direct-from-factory sales and group buying. Investors should care about its innovative business model and competitive pricing strategy, which have driven rapid growth in the Chinese e-commerce market.
PDD is testing major support at its 52-Week low with an RSI(14) of 31.6, indicating oversold conditions. The bearish MA alignment (price < MA20 < MA50 < MA200) and -22.5% 52-Week return suggest a sustained downtrend, potentially warning of further downside.
Related headlines
- PDD Holding, Inc. Shareholders Are Encouraged to Reach Out to Johnson Fistel for More Information About Potentially Recovering Their Losses
- PDD Holdings Inc (PDD) Q1 2026 Earnings Call Highlights: Revenue Growth Amidst Profit Challenges
- PDD Holdings shares slide after revenue and profit miss
- PDD Stock Slides After Temu Parent's Revenue Misses Estimates
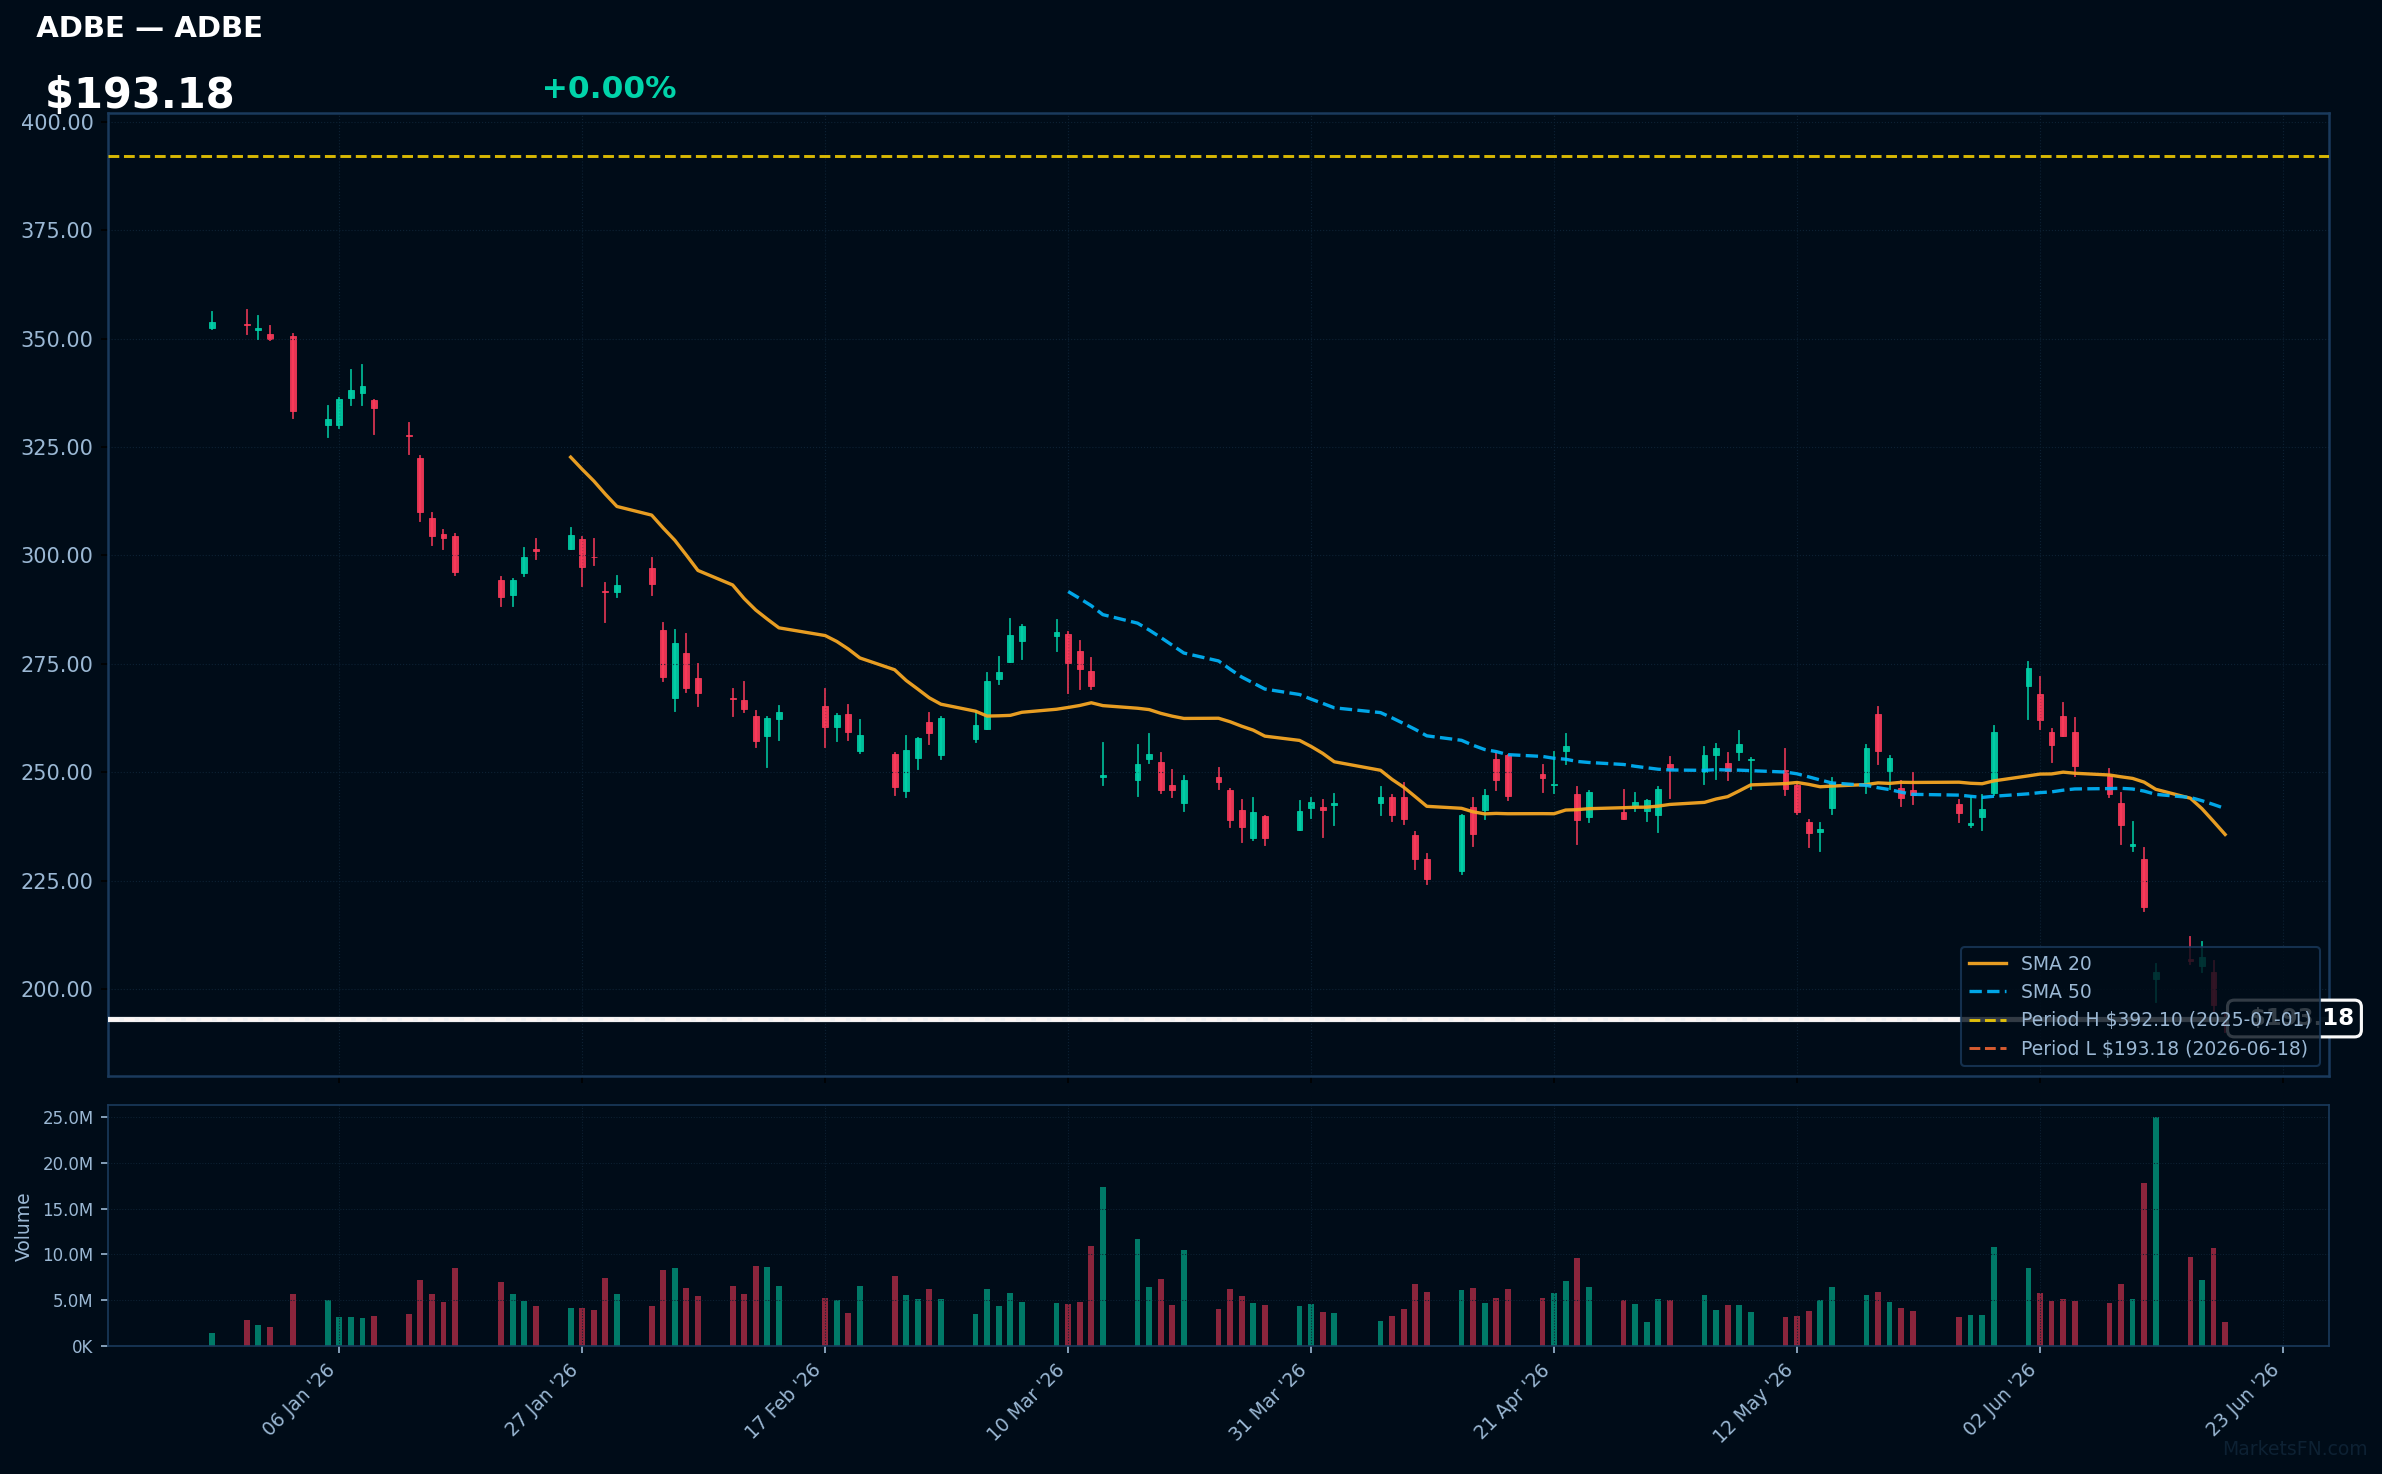
ADBE | Adobe Inc | Technology | Price Last: $193.18 | % Realized: -48.90% | RSI: 27.2 | % above MA200: -34.6% | Trend: Below MA20, MA50, MA200
Adobe Inc is a software company that provides creative and document management solutions, including Photoshop and Acrobat, serving creative professionals and enterprises. Investors care about its dominance in digital media and document cloud markets.
Adobe Inc's current technical situation is bearish, with RSI(14) at 27.2 indicating oversold conditions, price below all key MAs (MA20, MA50, MA200), and a 52-Week return of -48.9%, testing major support at its 52-Week low.
Related headlines
- Adobe Unveils Major Expansion of Creative Agent Across Firefly and Creative Cloud Apps Including Photoshop and Premiere
- Why Did ADBE, CRM, TTD Stocks Hit 52-Week Lows Today?
- Snubbing Nvidia for Adobe Costs Florida Stock-Picker $50 Billion
- Introducing Adobe Brand Visibility: A Unified Solution for the AI Search Era
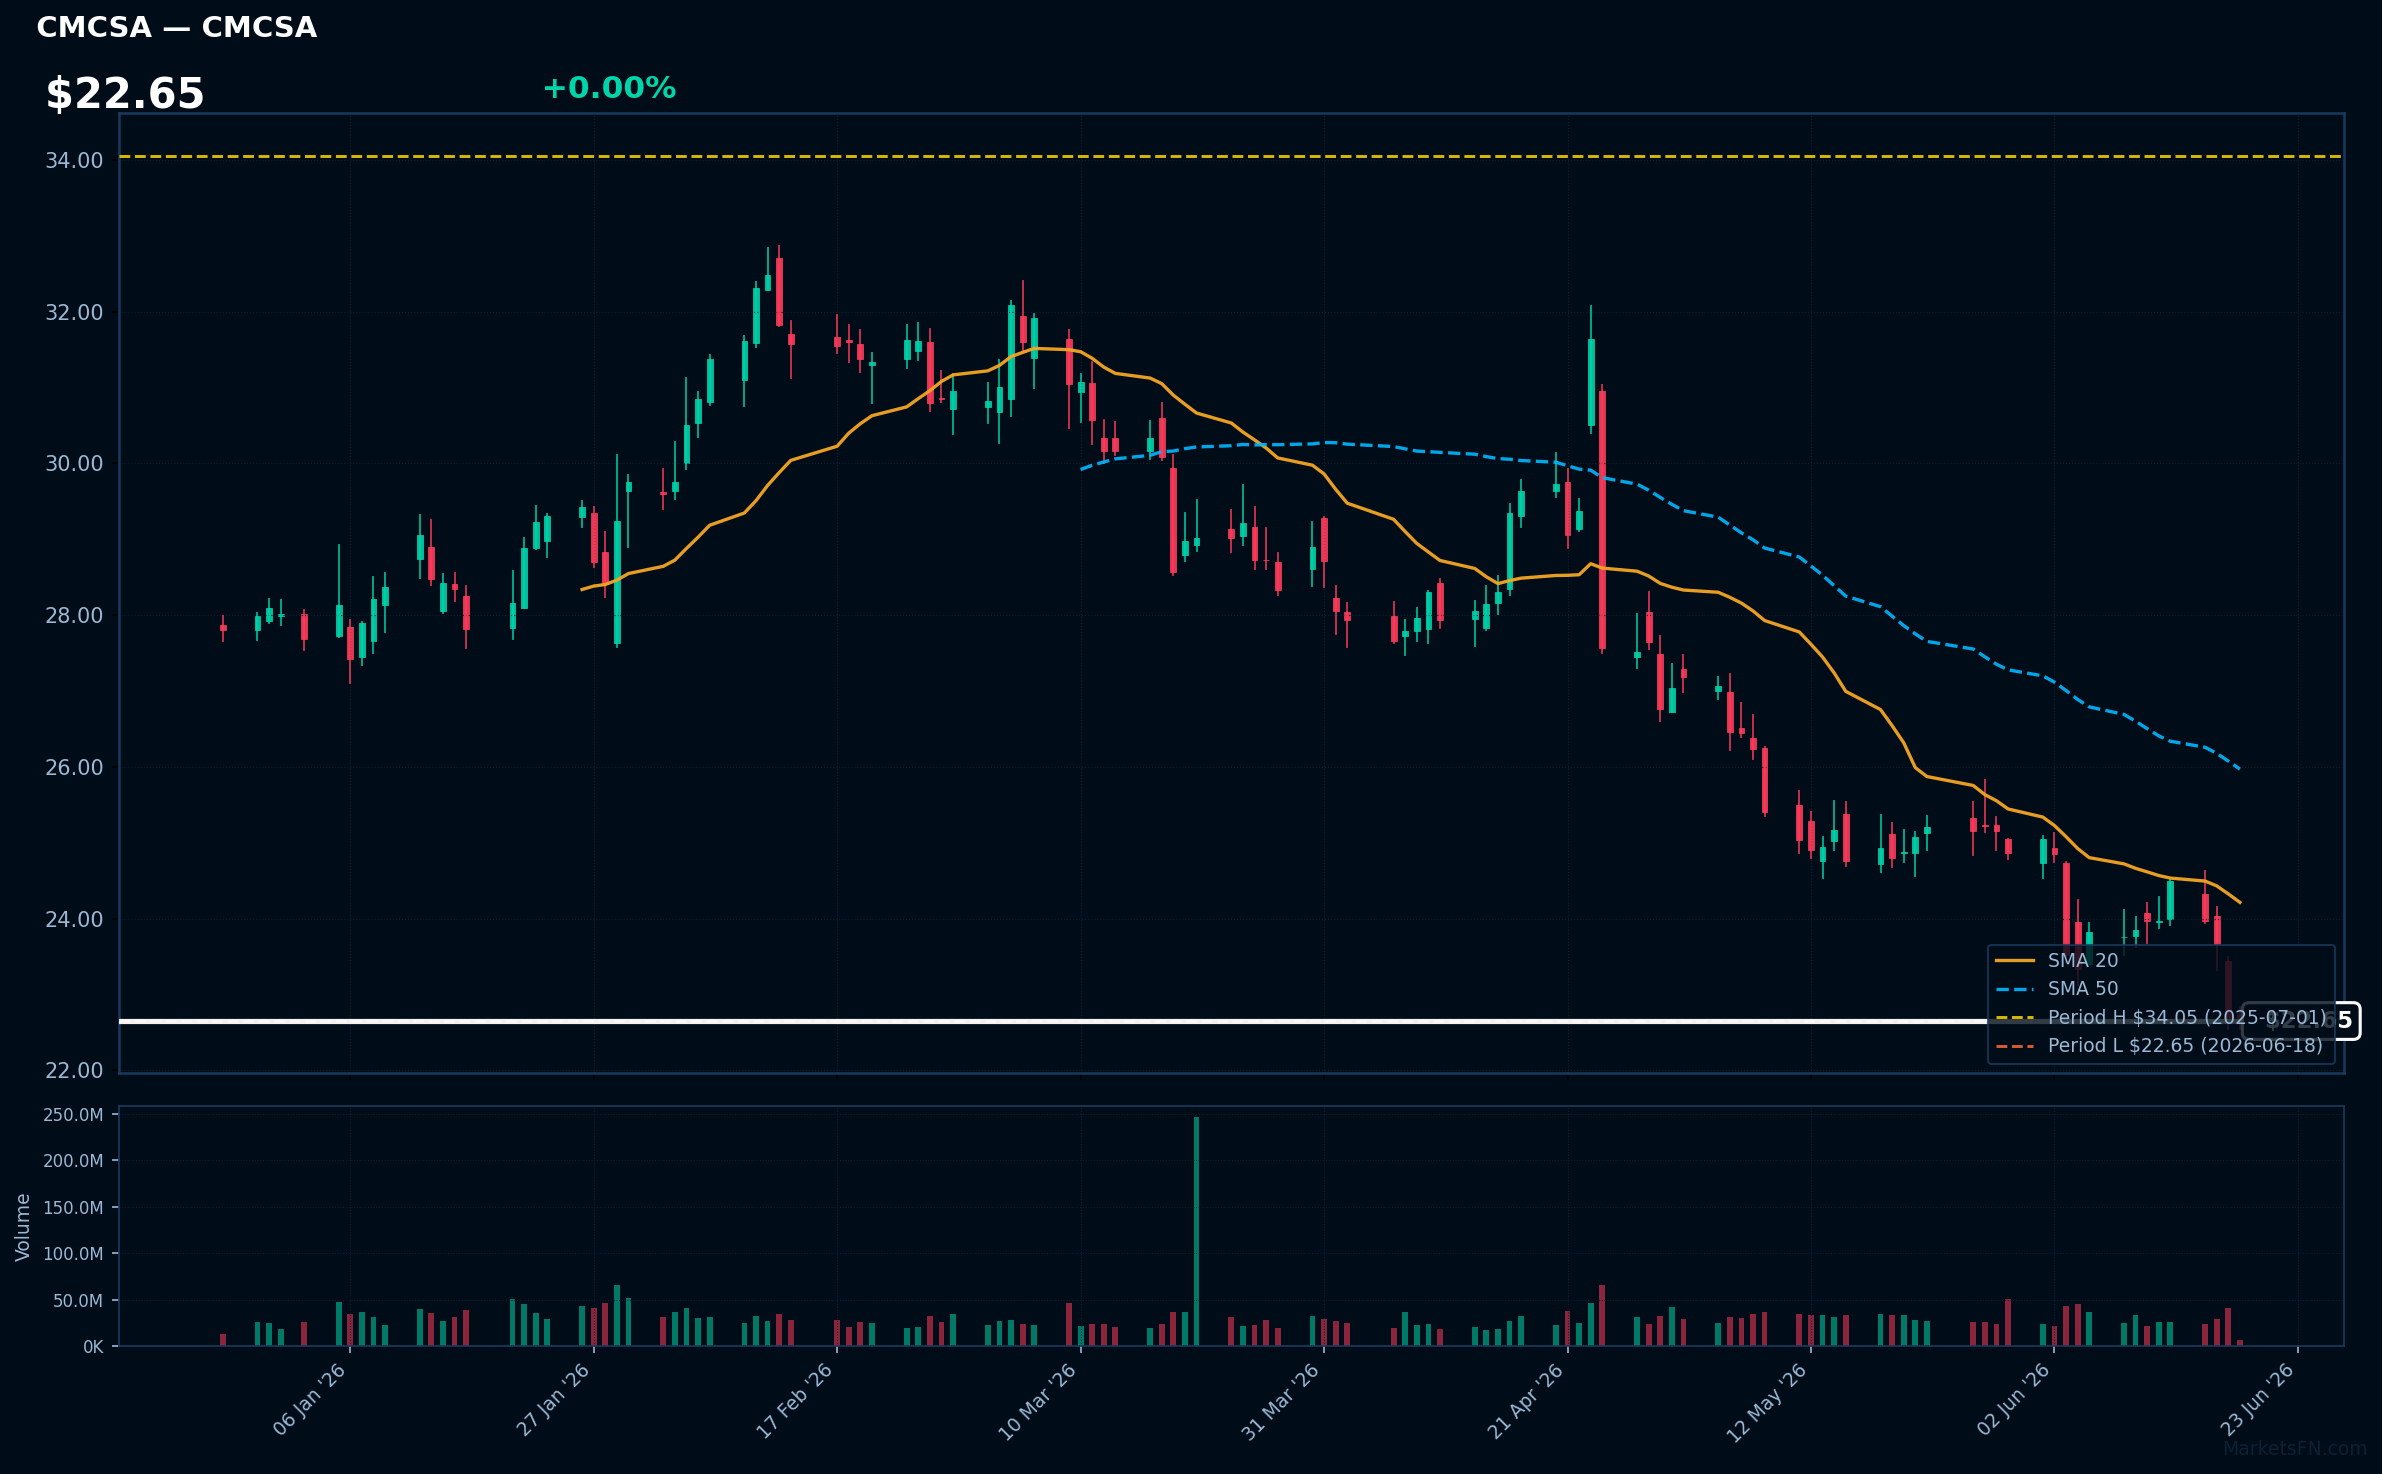
CMCSA | Comcast Corp | Communication Services | Price Last: $22.65 | % Realized: -29.46% | RSI: 28.6 | % above MA200: -18.8% | Trend: Below MA20, MA50, MA200
Comcast Corp is a media and telecommunications conglomerate providing cable television, internet, and phone services, as well as owning NBCUniversal, a major media company with film, television, and theme park assets, making it a significant player in both consumer connectivity and entertainment.
Comcast Corp's technical situation is bearish, with an RSI(14) of 28.6 indicating oversold conditions, and a sustained downtrend as price ($22.65) remains below MA20, MA50, and MA200, with the stock testing its 52-Week low, a potential warning sign for investors.
Related headlines
Market Commentary
The Nasdaq 100 stocks listed are currently trading near their 52-week extremes, with some at highs and others at lows. The stocks at 52-week highs include semiconductor companies like ASML, ARM, MU, AMAT, and LRCX, all at 0.0% from their 52-week highs. Conversely, stocks like PLTR, INTU, PDD, ADBE, and CMCSA are at their 52-week lows, with a +0.0% margin above these lows.
This positioning near extremes may signal significant investor sentiment and potential trend continuation or reversal in the technology sector. The concentration of semiconductor stocks near 52-week highs could be driven by themes such as AI-driven demand for advanced chips and manufacturing equipment. On the other hand, stocks near 52-week lows may be influenced by macroeconomic factors or company-specific challenges.
Key levels to watch include the current 52-week extremes for these stocks. A breakout above the highs or breakdown below the lows could be triggered by earnings reports, macroeconomic data releases, or sector-specific news. Investors should monitor these levels and potential catalysts closely to gauge the direction of the technology sector.
Methodology: All 101 Nasdaq 100 constituents screened. 52-week high = highest daily close over the past 252 trading days (approx. 1 year). 52-week low = lowest daily close over the same period. Distance = (current price / extreme − 1) × 100. Technical indicators computed on up to 1 year of daily OHLCV data.
Disclaimer: For informational purposes only. Not investment advice. Past performance is not indicative of future results.