Nasdaq 100 2026 YTD Highs & Lows Radar: Ross Stores, (ROST), Synopsys, (SNPS) and more
MarketsFN Team

Nasdaq 100 2026 YTD Highs & Lows Radar: Ross Stores, (ROST), Synopsys, (SNPS) and more
Screening all 101 Nasdaq 100 constituents for stocks nearest to their 2026 year-to-date high and their 2026 YTD low. Data as of July 31, 2026. % Realized = total return since Jan 1 2026.
Legend: RSI > 70 = overbought · RSI < 30 = oversold · Green % Realized = positive YTD return · Red = negative.
📈 Nearest to 2026 High
Sectors represented: Consumer Cyclical (2), Communication Services (1), Consumer Defensive (1), Healthcare (1)
| Ticker | Company | Sector | Price Last | % Realized | 2026 YTD High Date | RSI | % above MA200 | Trend |
|---|---|---|---|---|---|---|---|---|
| ROST | Ross Stores, Inc | Consumer Cyclical | $252.57 | +38.21% | 2026-07-30 | 71.5 | +24.8% | Above MA20, MA50, MA200 |
| EA | Electronic Arts, Inc | Communication Services | $209.59 | +2.53% | 2026-07-30 | 79.1 | +3.4% | Above MA20, MA50, MA200 |
| CCEP | Coca-Cola Europacific Partners Plc | Consumer Defensive | $111.71 | +26.64% | 2026-07-30 | 64.4 | +16.9% | Above MA20, MA50, MA200 |
| ABNB | Airbnb Inc | Consumer Cyclical | $152.08 | +14.34% | 2026-07-28 | 60.7 | +14.7% | Above MA20, MA50, MA200 |
| AMGN | AMGEN Inc | Healthcare | $387.64 | +18.31% | 2026-07-28 | 61.3 | +12.7% | Above MA20, MA50, MA200 |
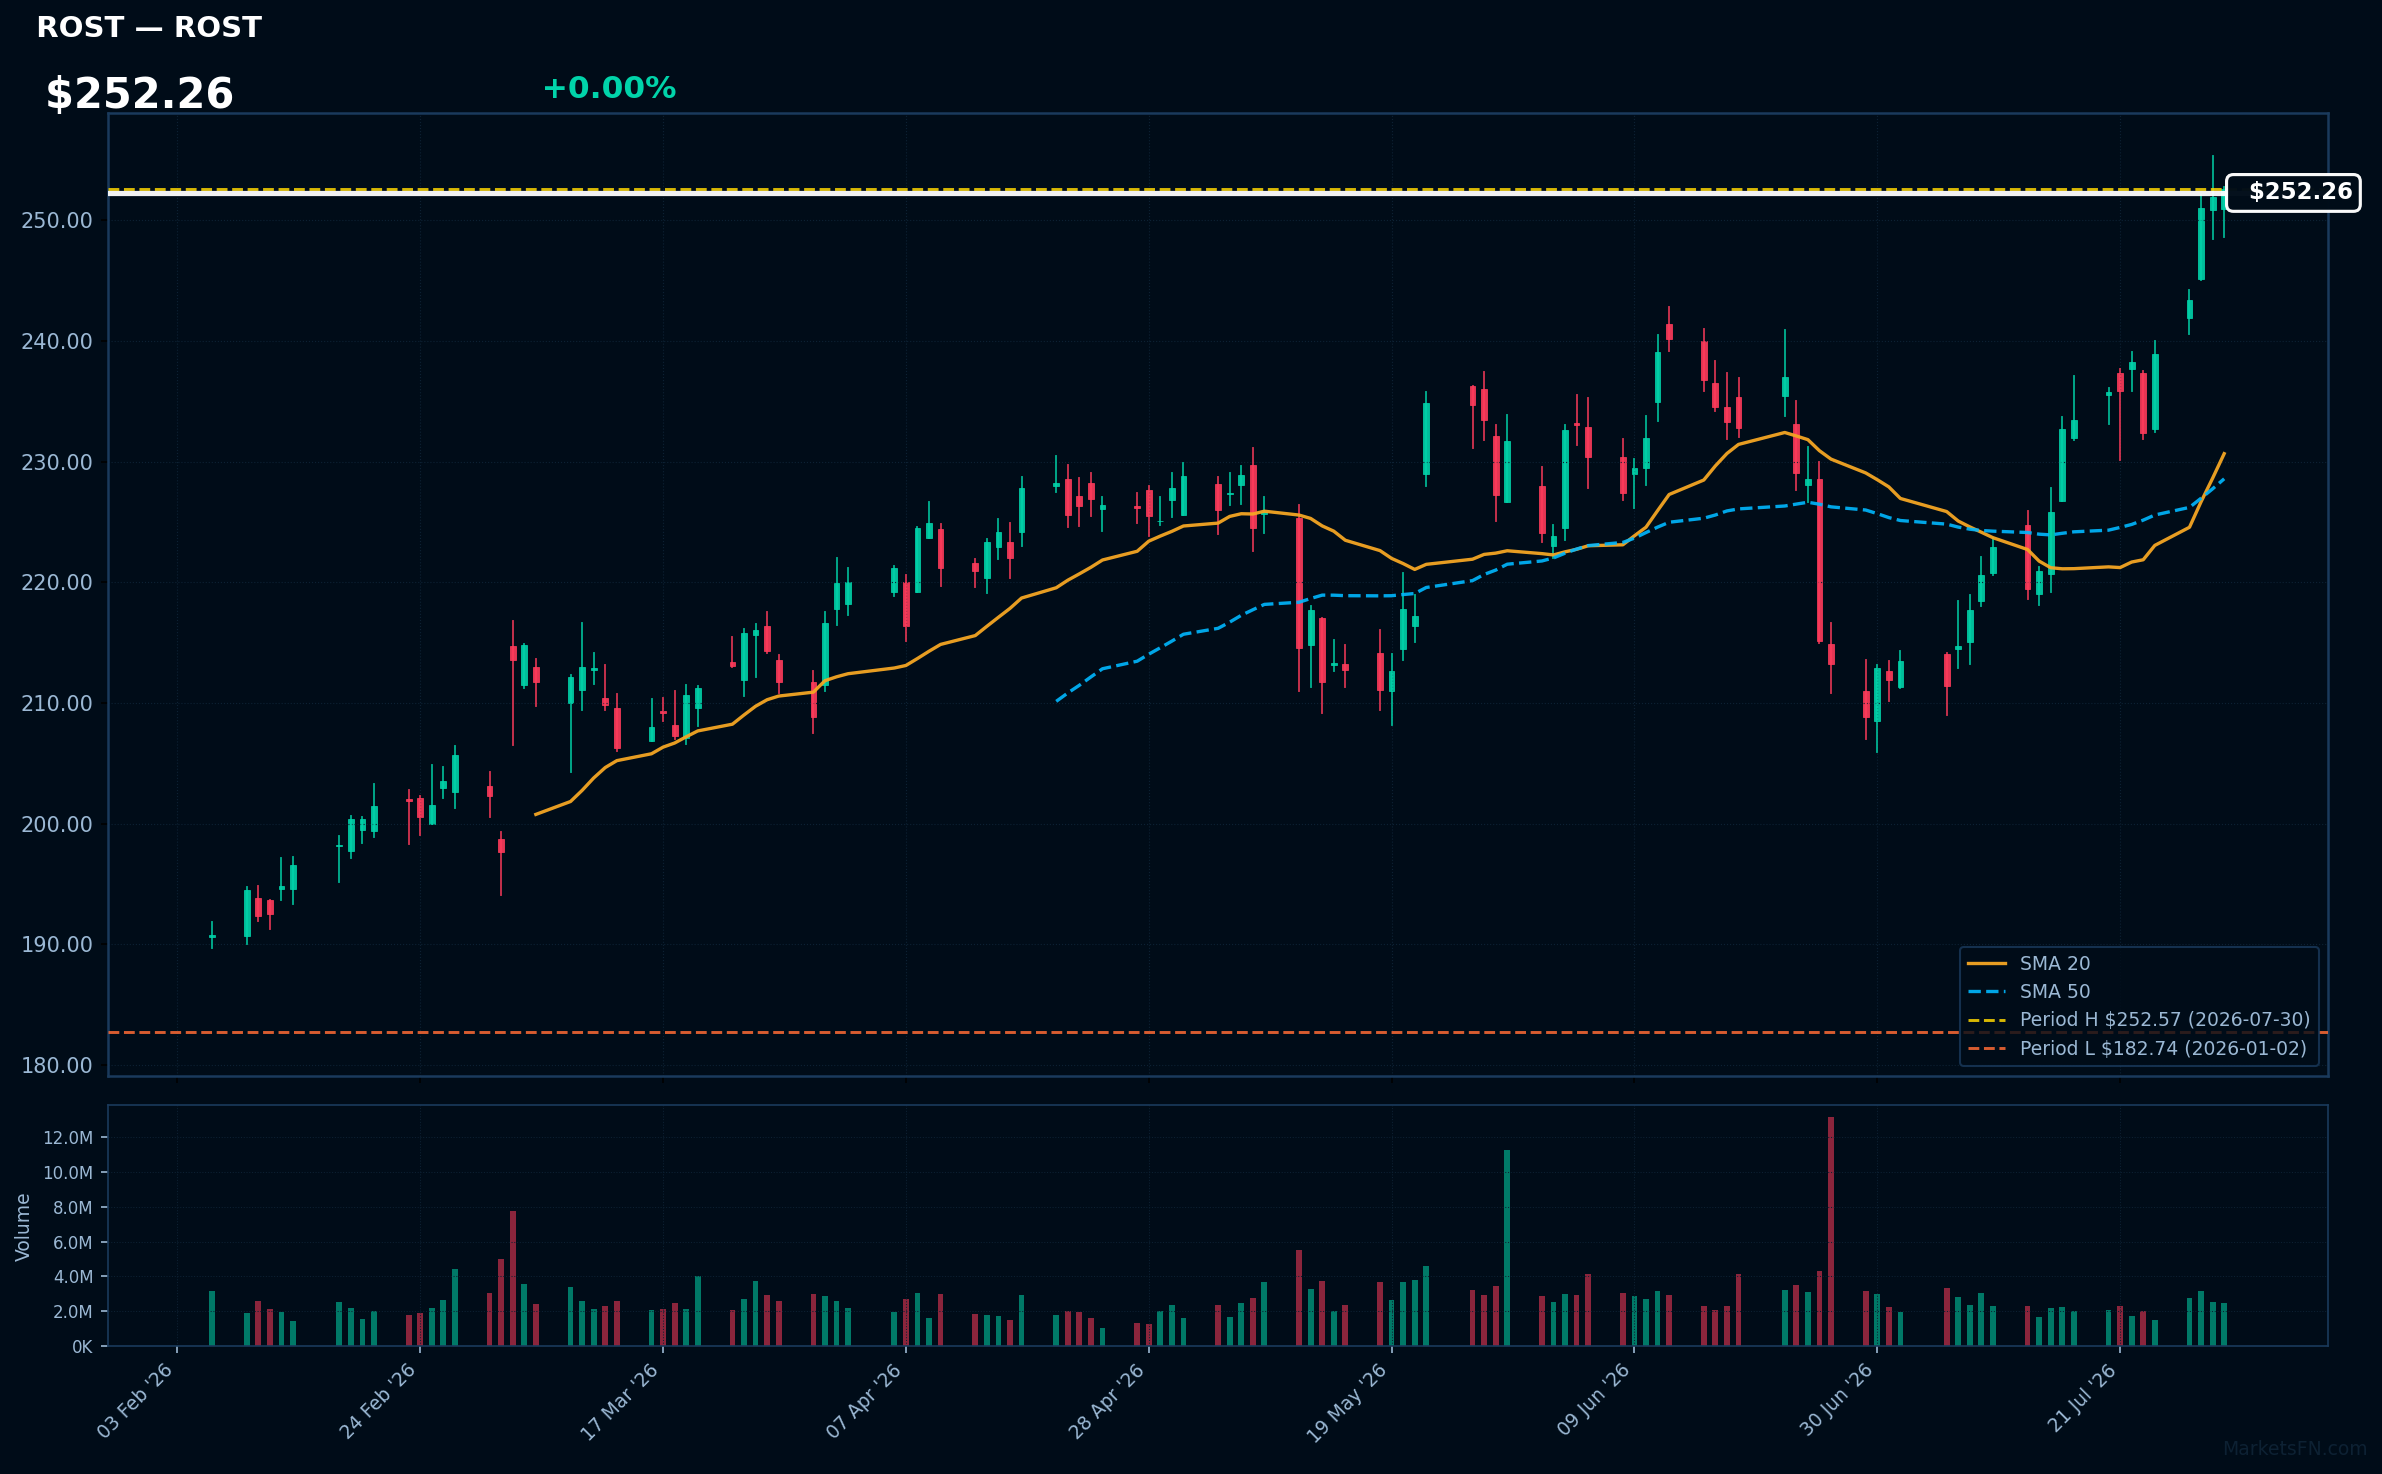
ROST | Ross Stores, Inc | Consumer Cyclical | Price Last: $252.57 | % Realized: +38.21% | RSI: 71.5 | % above MA200: +24.8% | Trend: Above MA20, MA50, MA200
Ross Stores, Inc operates off-price retail chains, offering discounted apparel and home goods. Investors should care due to its strong market position, appealing to budget-conscious consumers, and its ability to thrive in varying economic conditions.
The current technical situation shows bullish momentum with an RSI(14) of 71.5 and a strong MA alignment: price > MA20 > MA50 > MA200, indicating a sustained uptrend.
Related headlines
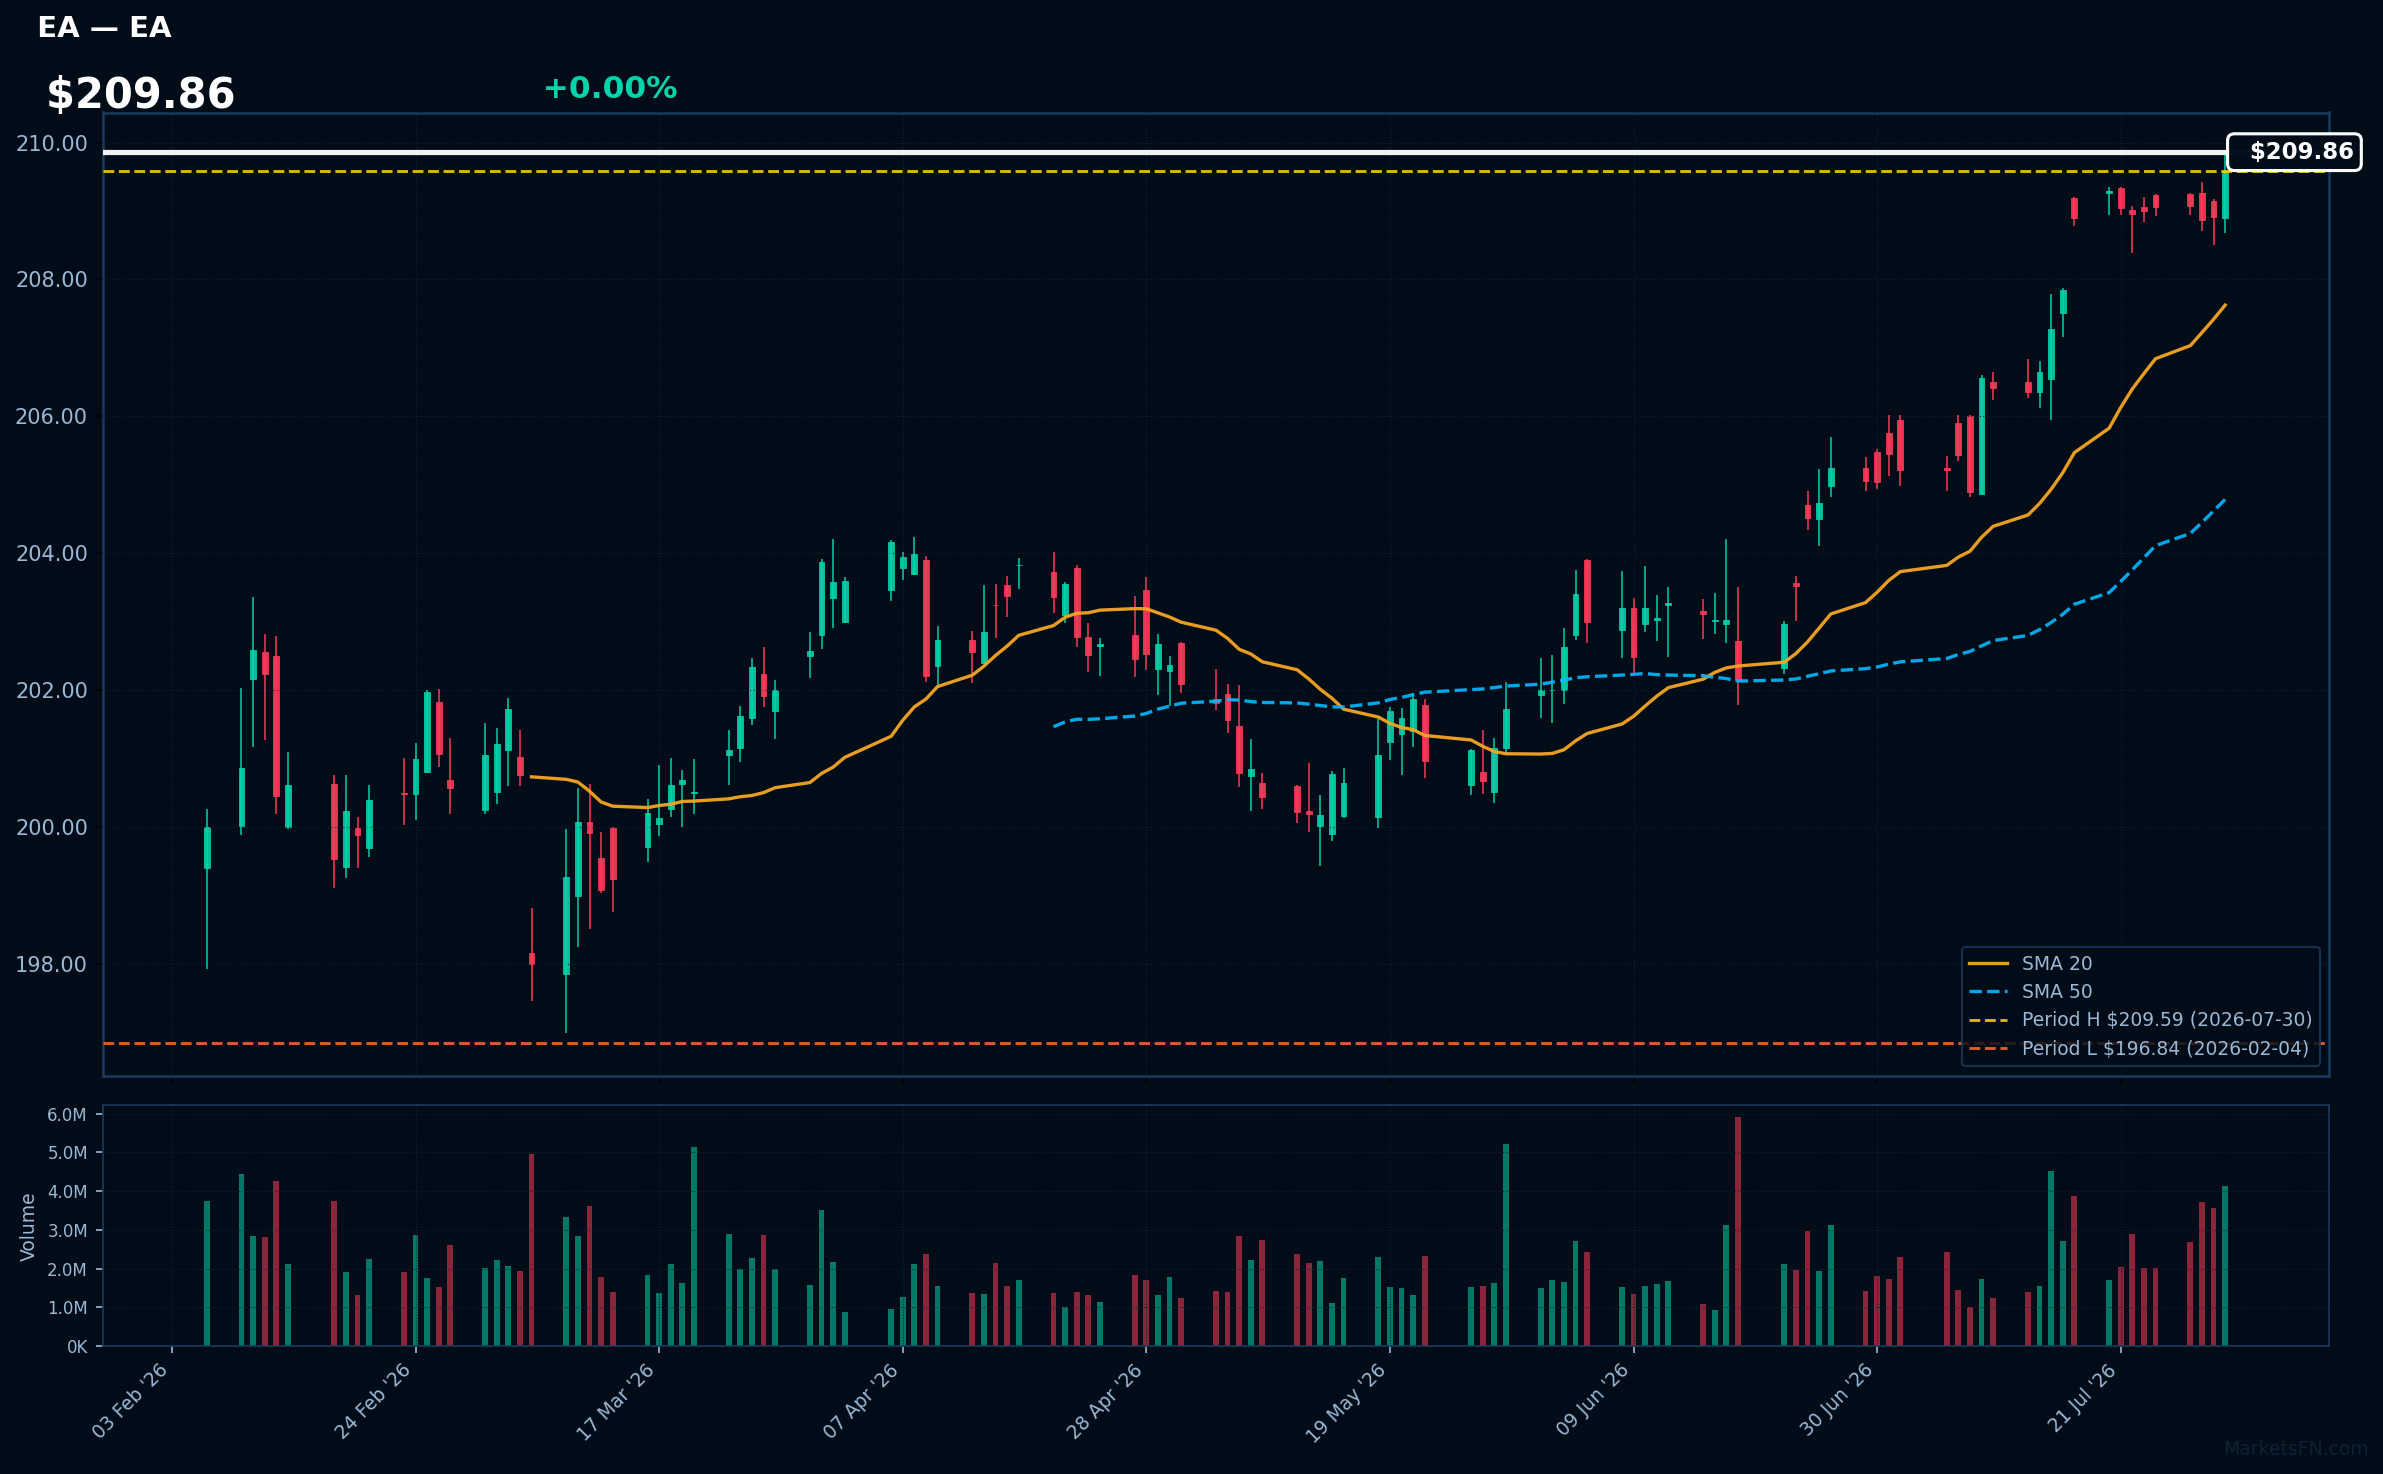
EA | Electronic Arts, Inc | Communication Services | Price Last: $209.59 | % Realized: +2.53% | RSI: 79.1 | % above MA200: +3.4% | Trend: Above MA20, MA50, MA200
Electronic Arts, Inc. develops and publishes interactive entertainment software, including popular franchises like FIFA and The Sims. Investors should care due to its strong market position and consistent revenue generation from both game sales and in-game purchases.
The current technical situation shows bullish momentum, with an RSI(14) of 79.1 and a bullish MA alignment: price > MA20 > MA50 > MA200. The stock is 0.0% below its 2026 YTD high, indicating potential for a breakout.
Related headlines
- Saudi PIF's $55 billion EA deal gets EU approval under subsidy rules
- EU clears PIF acquisition of sole control of EA in $55bn deal
- Kylian Mbappe and Jude Bellingham Welcome You to EA SPORTS FC 27, Launching Worldwide on September 25
- Kylian Mbapp and Jude Bellingham Welcome You to EA SPORTS FC 27, Launching Worldwide on September 25
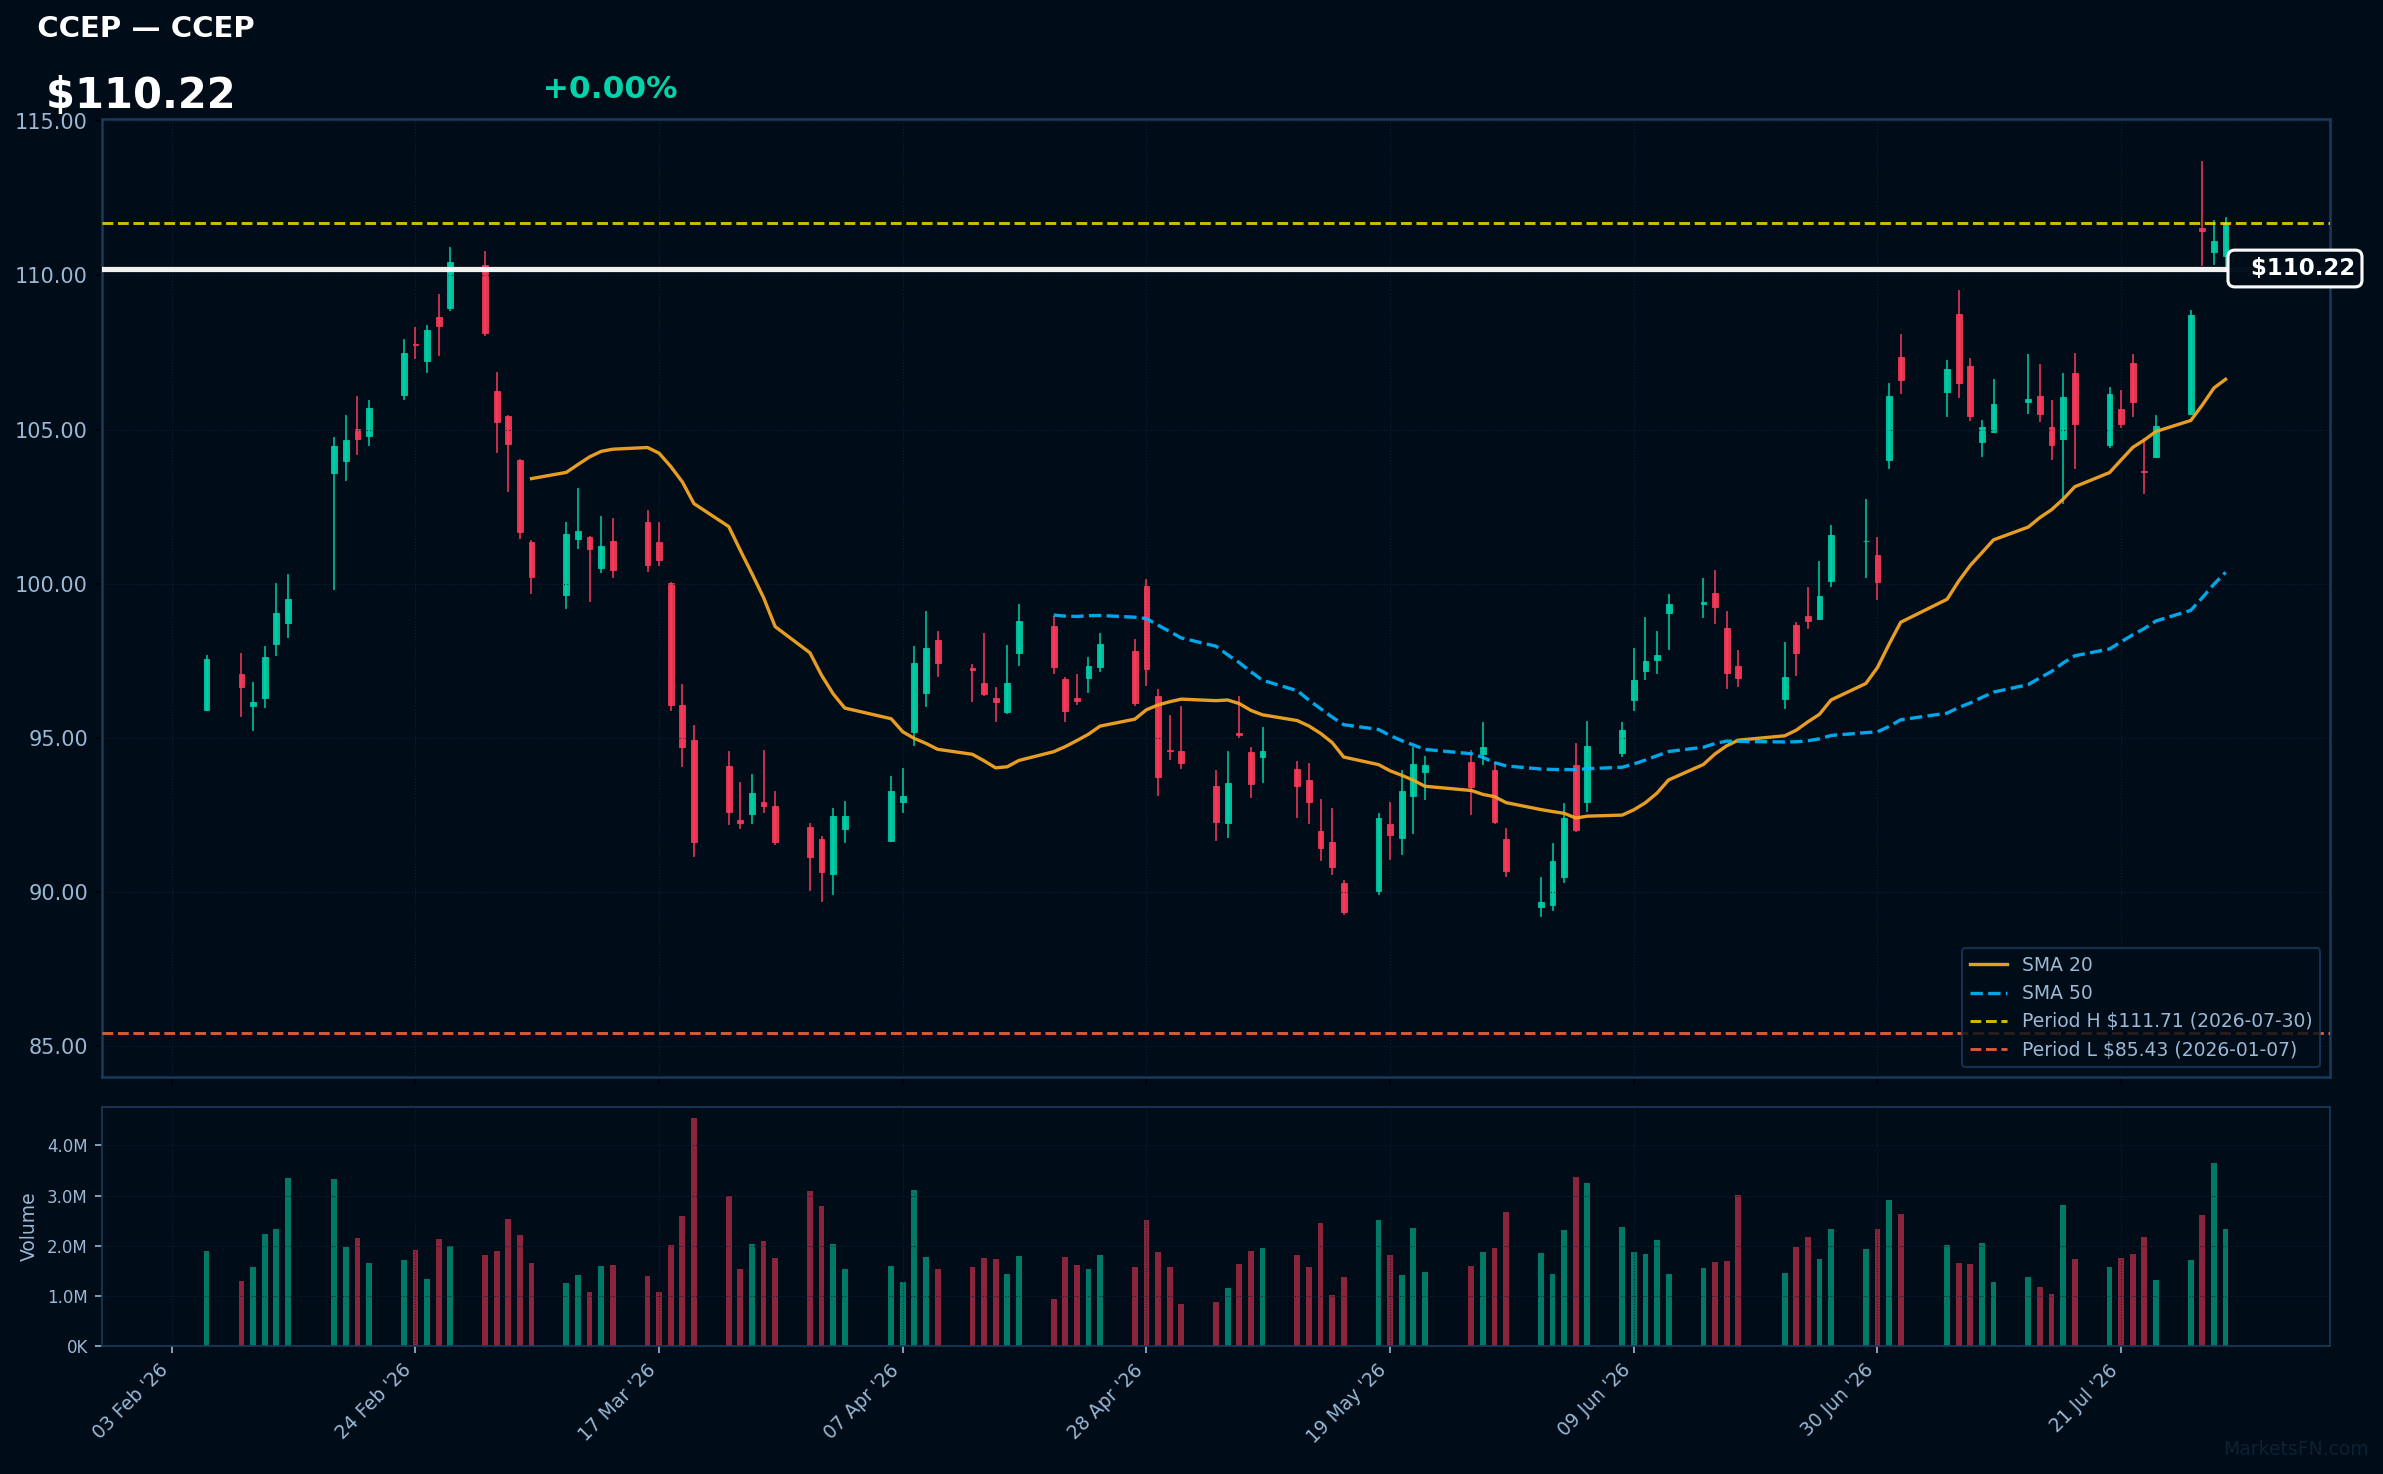
CCEP | Coca-Cola Europacific Partners Plc | Consumer Defensive | Price Last: $111.71 | % Realized: +26.64% | RSI: 64.4 | % above MA200: +16.9% | Trend: Above MA20, MA50, MA200
Coca-Cola Europacific Partners Plc is a leading bottler for The Coca-Cola Company, focusing on beverage distribution across Europe. Investors should care due to its strategic market position and potential for growth in the beverage sector, especially as consumer preferences shift towards healthier options.
The current technical situation indicates bullish momentum, with an RSI(14) of 64.4 and a strong MA alignment: price > MA20 > MA50 > MA200. The stock is also 0.0% below its 2026 YTD high, suggesting a potential breakout.
Related headlines
- Coca-Cola Europacific Partners plc Announces Q1 Trading Update & Interim Dividend Declaration
- Coca-Cola Europacific Partners plc Announces Notice of AGM
- Coca-Cola Europacific Partners plc Announces Annual Financial Report
- Coca-Cola Europacific (CCEP) 2025 Revenue Hits 20.9B as Operating Profit Rises 31% to 2.79B
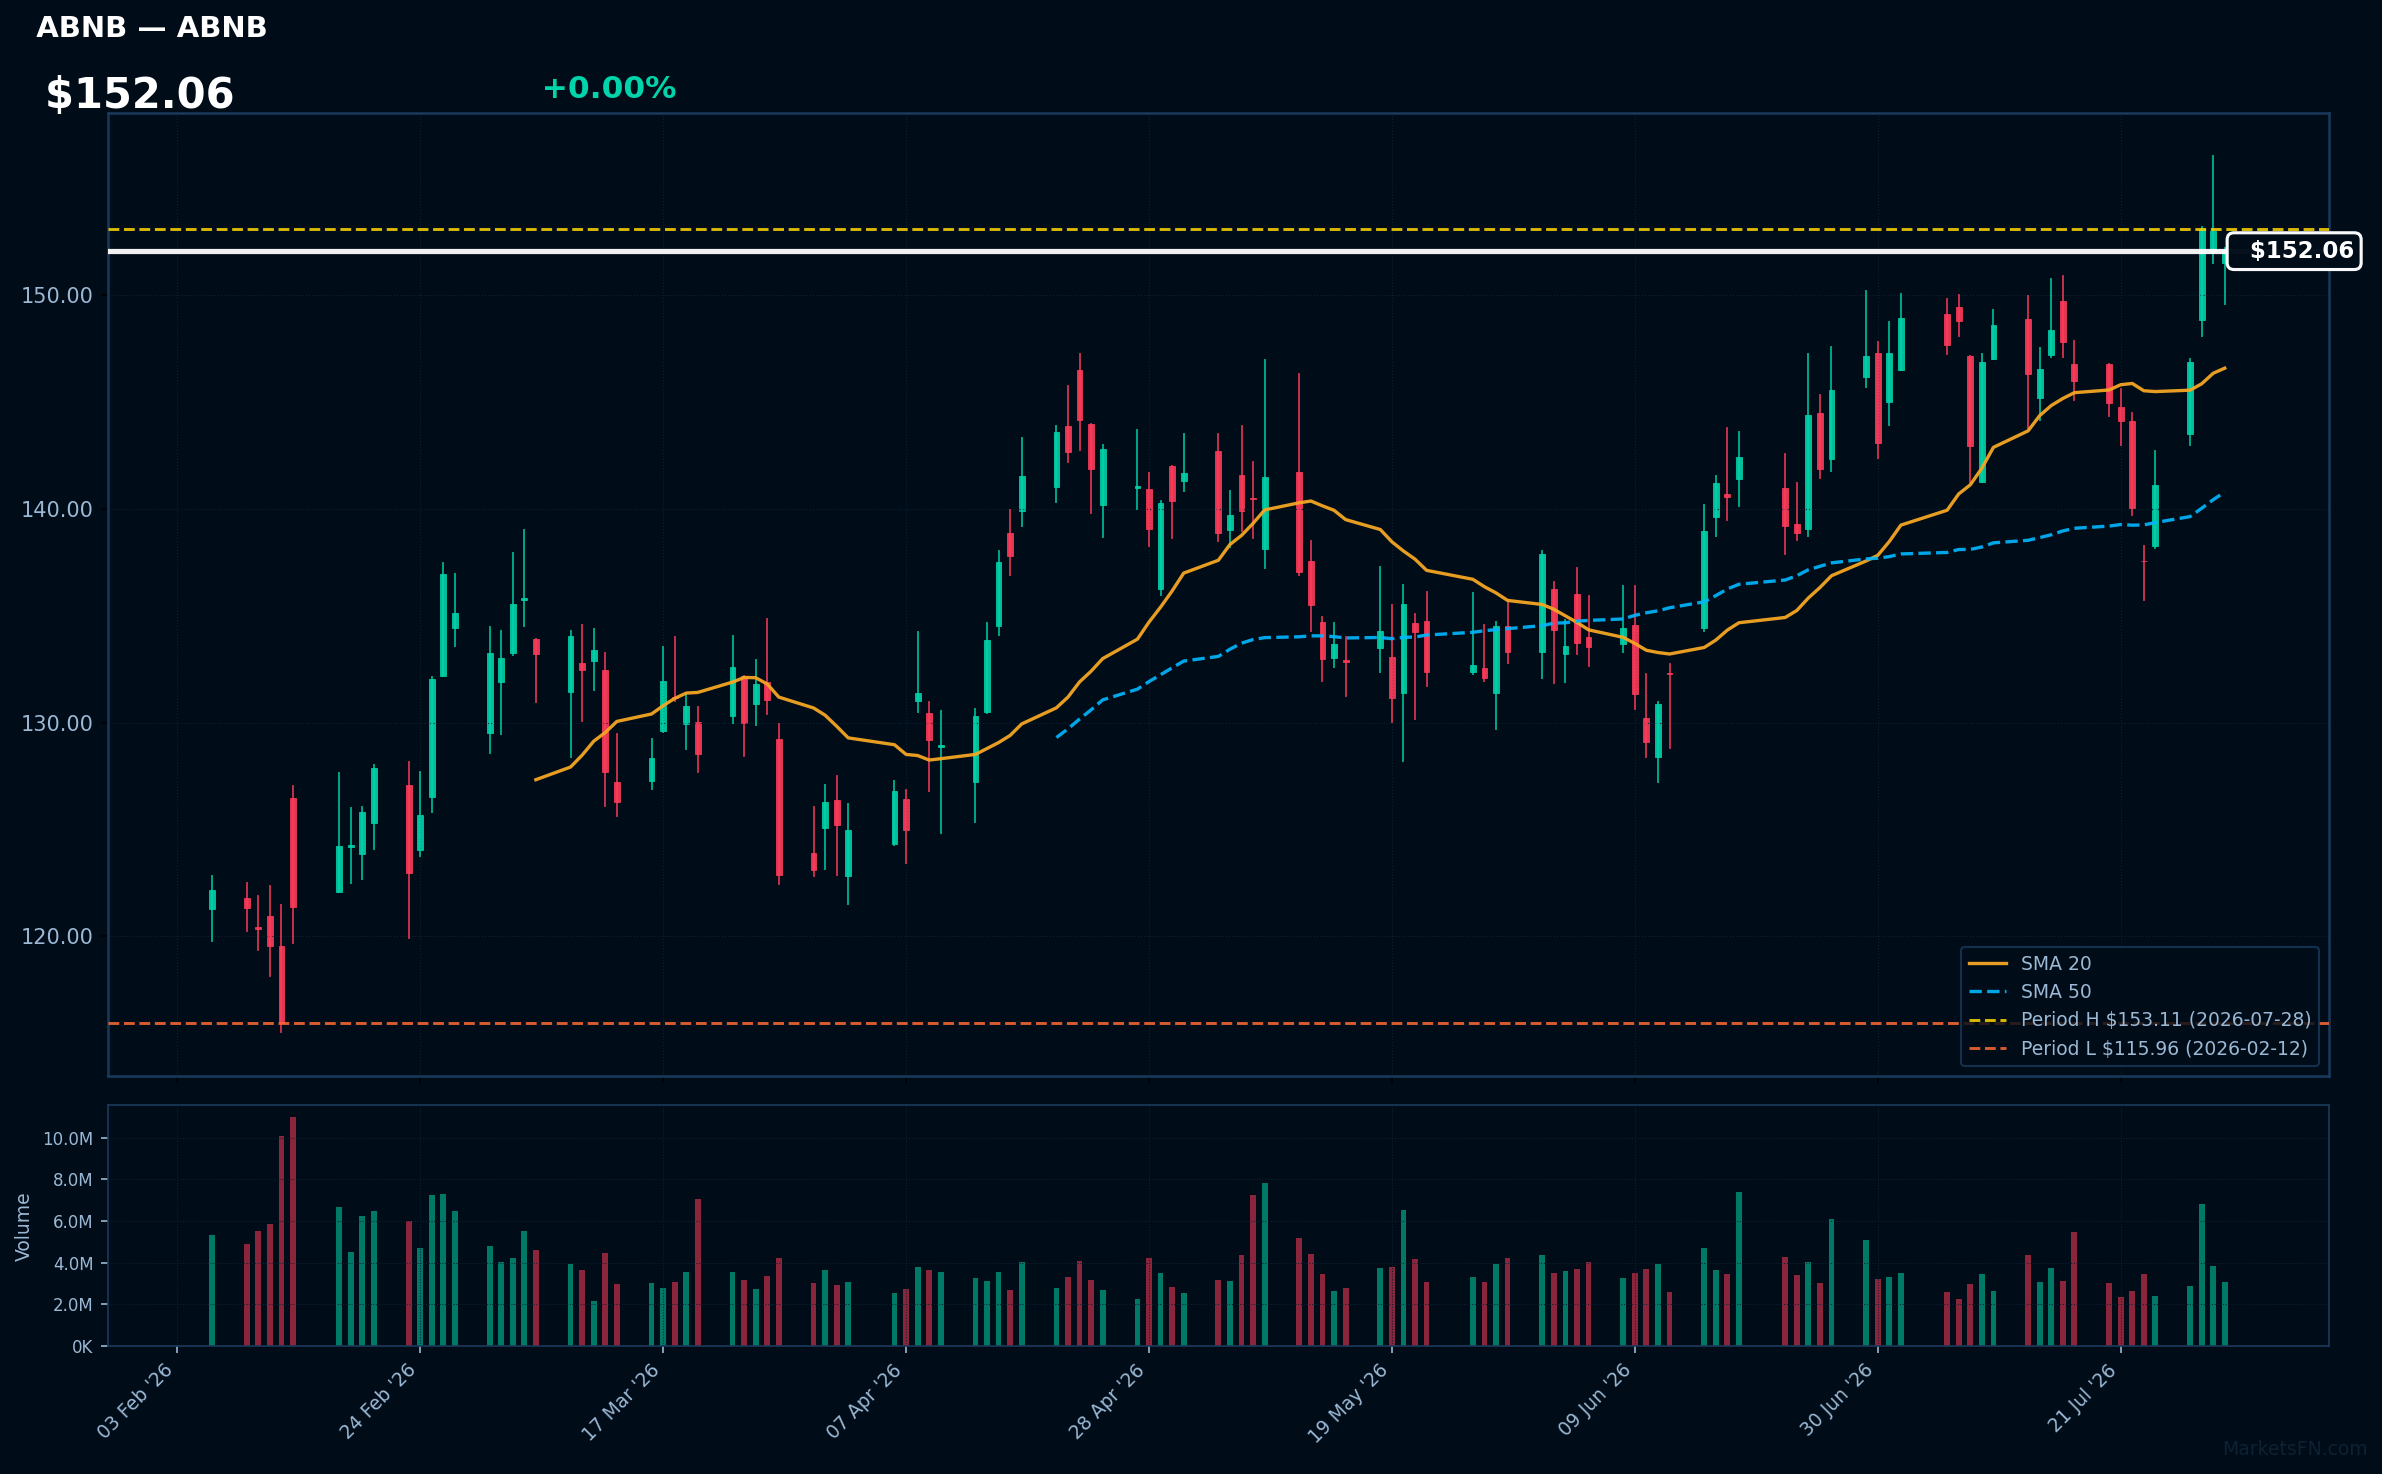
ABNB | Airbnb Inc | Consumer Cyclical | Price Last: $152.08 | % Realized: +14.34% | RSI: 60.7 | % above MA200: +14.7% | Trend: Above MA20, MA50, MA200
Airbnb Inc (ABNB) operates an online marketplace for lodging, primarily short-term rentals. Investors should care due to its innovative approach to travel accommodation, which has disrupted traditional hospitality and continues to grow in popularity, especially post-pandemic.
Currently, ABNB shows bullish momentum with an RSI(14) of 60.7 and a strong MA alignment: price > MA20 > MA50 > MA200, indicating a sustained uptrend. The stock is also 0.7% below its 2026 YTD high.
Related headlines
- Airbnb Wants to Be the Amazon for Services. That Doesn't Make the Stock a Buy.
- Jefferies Raises Airbnb to $175 as Product Changes Drive Booking Growth
- Strangers Won't Share A Home: Airbnbs Brian Chesky Draws An Unexpected Parallel To Tokenization
- Airbnb Buys Manhattan Office Despite NYC Rental Crackdown
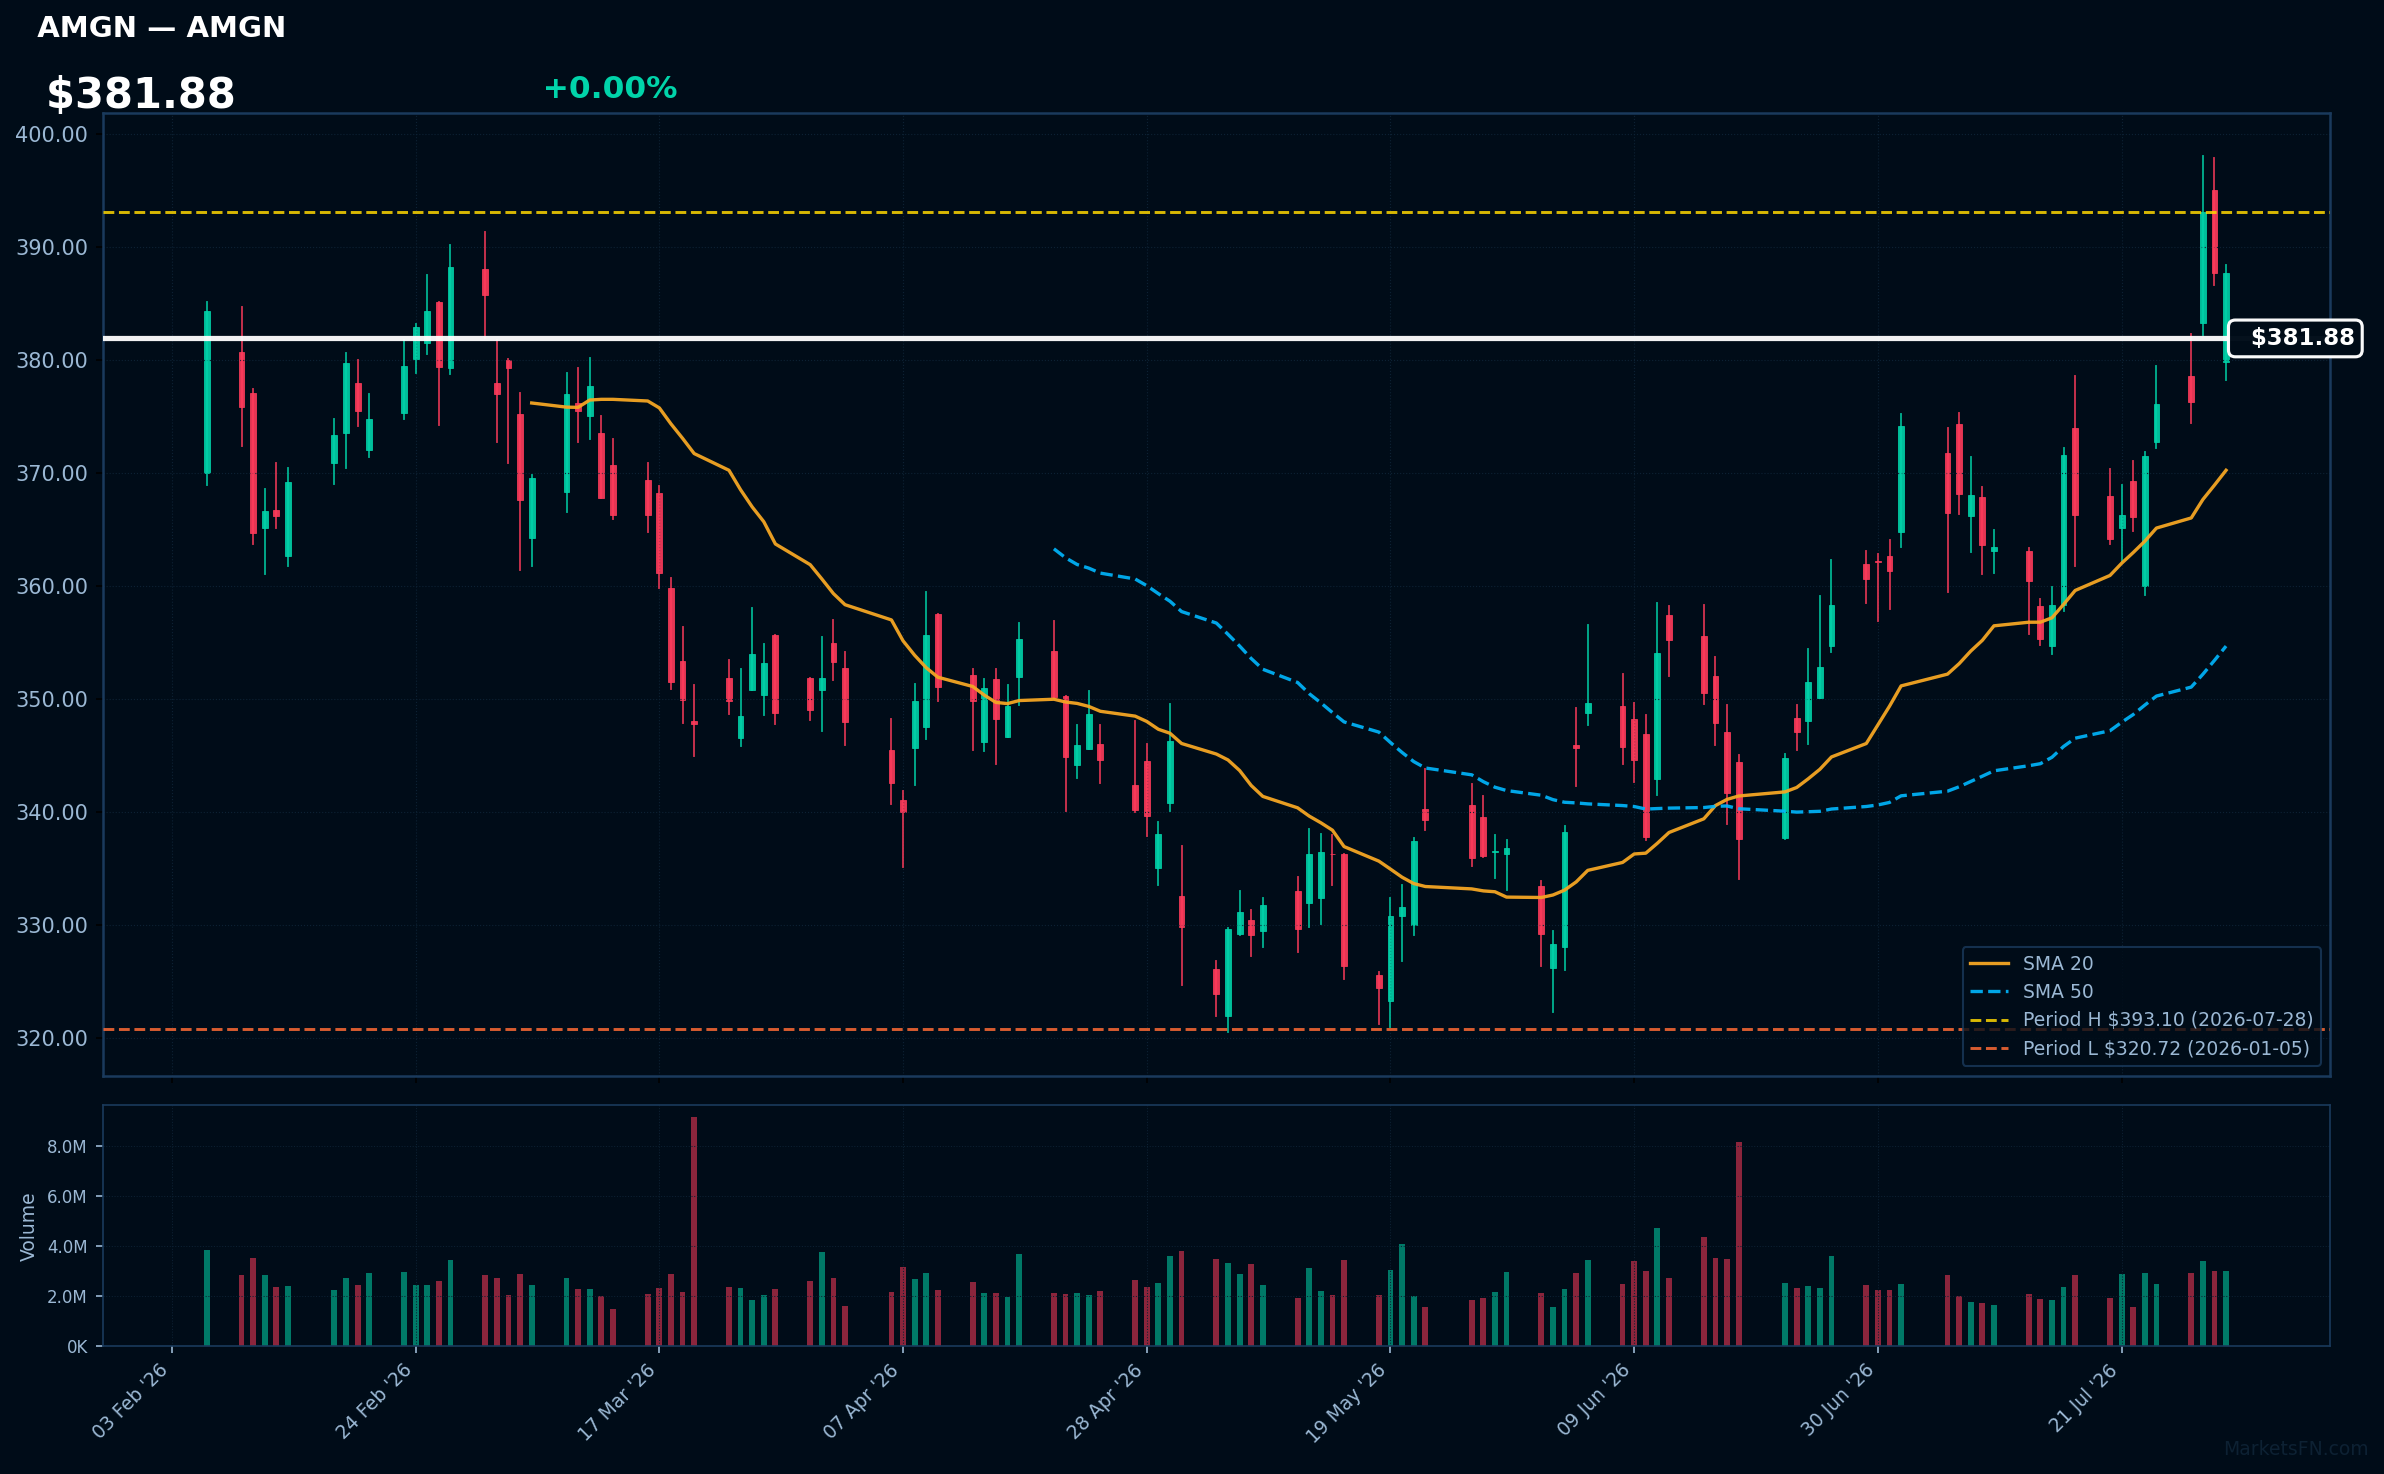
AMGN | AMGEN Inc | Healthcare | Price Last: $387.64 | % Realized: +18.31% | RSI: 61.3 | % above MA200: +12.7% | Trend: Above MA20, MA50, MA200
AMGEN Inc (AMGN) is a biotechnology company focused on developing innovative therapies for serious illnesses, particularly in oncology, nephrology, and inflammation. Investors should care due to its strong pipeline and potential for significant revenue growth in a competitive healthcare market.
The current technical situation shows bullish momentum, with an RSI(14) of 61.3 and a bullish MA alignment: price > MA20 > MA50 > MA200. The stock is also 1.4% below its 2026 YTD high, indicating a potential breakout.
Related headlines
📉 Nearest to 2026 Low
Sectors represented: Communication Services (3), Technology (1), Consumer Cyclical (1)
| Ticker | Company | Sector | Price Last | % Realized | 2026 YTD Low Date | RSI | % above MA200 | Trend |
|---|---|---|---|---|---|---|---|---|
| SNPS | Synopsys, Inc | Technology | $372.33 | -22.50% | 2026-07-30 | 36.4 | -17.2% | Below MA20, MA50, MA200 |
| WBD | Warner Bros. Discovery Inc | Communication Services | $25.47 | -10.66% | 2026-07-27 | 39.2 | -3.7% | Below MA20, MA50, MA200 |
| META | Meta Platforms Inc | Communication Services | $539.03 | -17.12% | 2026-03-27 | 35.2 | -15.0% | Below MA20, MA50, MA200 |
| TMUS | T-Mobile US Inc | Communication Services | $173.34 | -13.15% | 2026-06-30 | 40.5 | -12.9% | Below MA20, MA50, MA200 |
| TSLA | Tesla Inc | Consumer Cyclical | $308.85 | -29.50% | 2026-07-29 | 30.8 | -25.0% | Below MA20, MA50, MA200 |
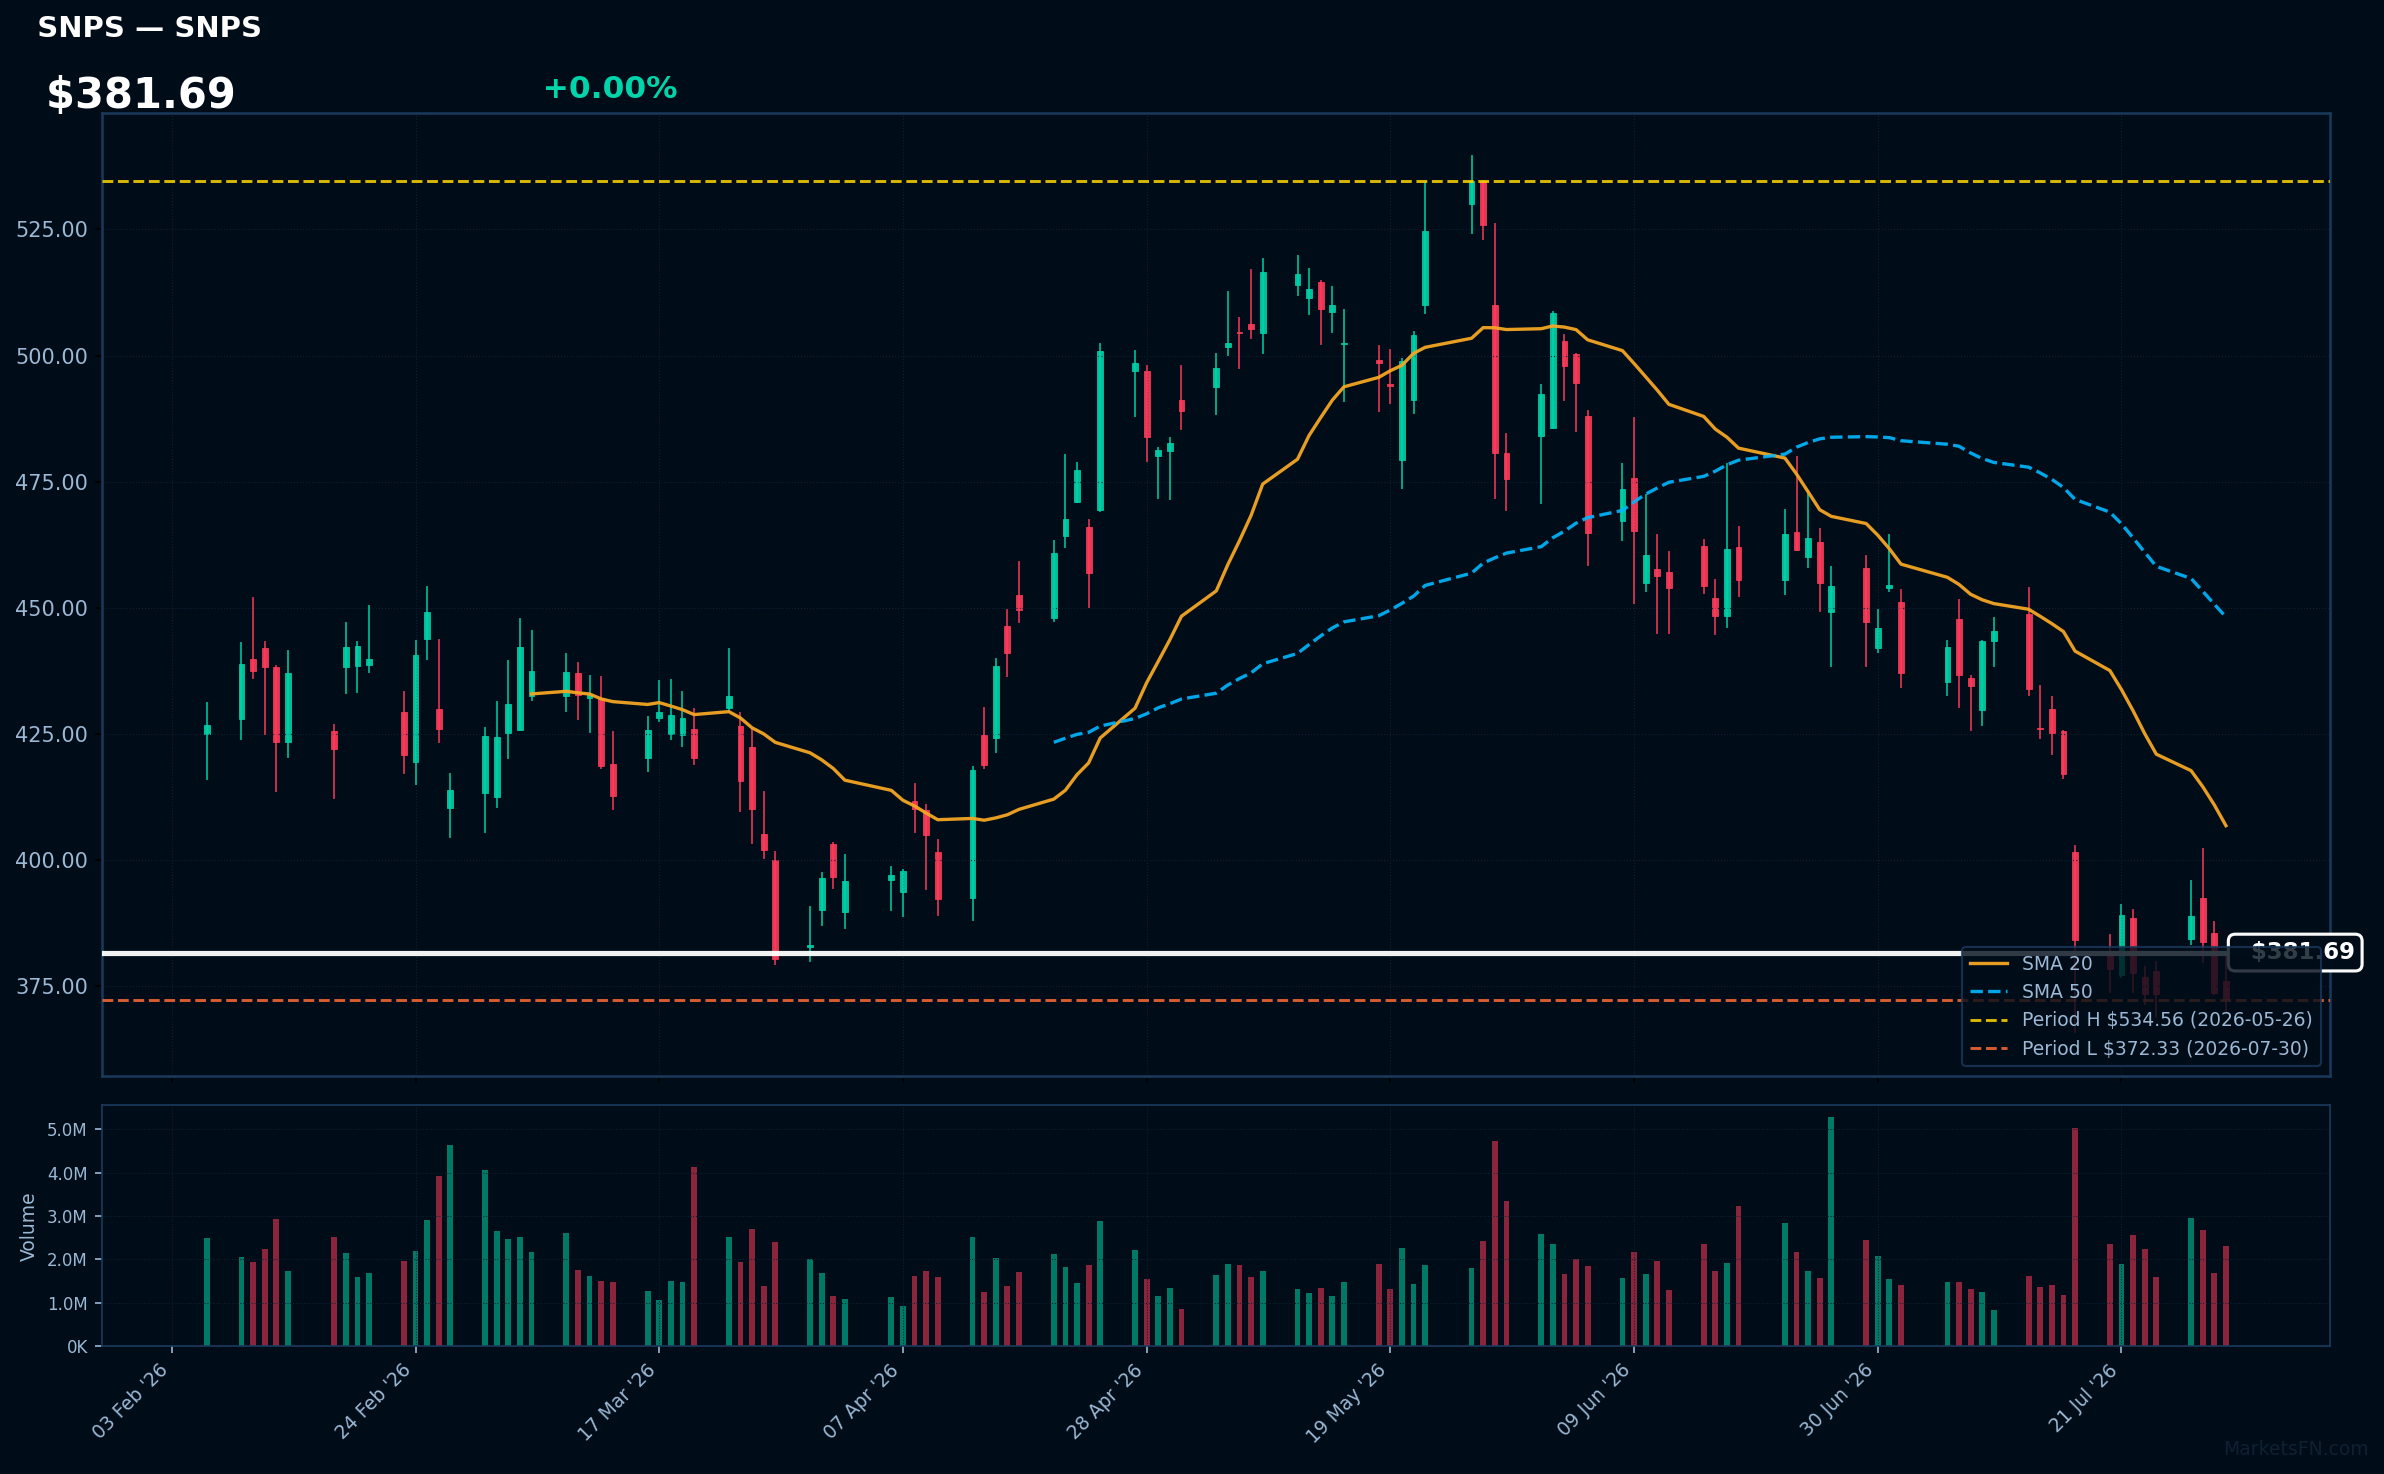
SNPS | Synopsys, Inc | Technology | Price Last: $372.33 | % Realized: -22.50% | RSI: 36.4 | % above MA200: -17.2% | Trend: Below MA20, MA50, MA200
Synopsys, Inc. provides software and services for electronic design automation, enabling companies to develop complex semiconductor products efficiently. Investors should care due to its critical role in the tech supply chain, especially as demand for advanced chips continues to grow.
The current technical situation indicates a bearish trend, with an RSI(14) of 36.4 and a MA alignment of price < MA20 < MA50 < MA200, suggesting sustained downtrend and testing major support.
Related headlines
- Synopsys unveils autonomous chip design workflows with Microsoft and AMD collaboration
- Synopsys and Intel Foundry Fast-Track Customer Readiness from Silicon to Systems on Intel 14A
- Synopsys Advances Agentic AI Chip Design with AMD and Microsoft
- Synopsys Showcases Comprehensive Autonomous Engineering Workflows from Silicon to Systems, Developed with NVIDIA Technology
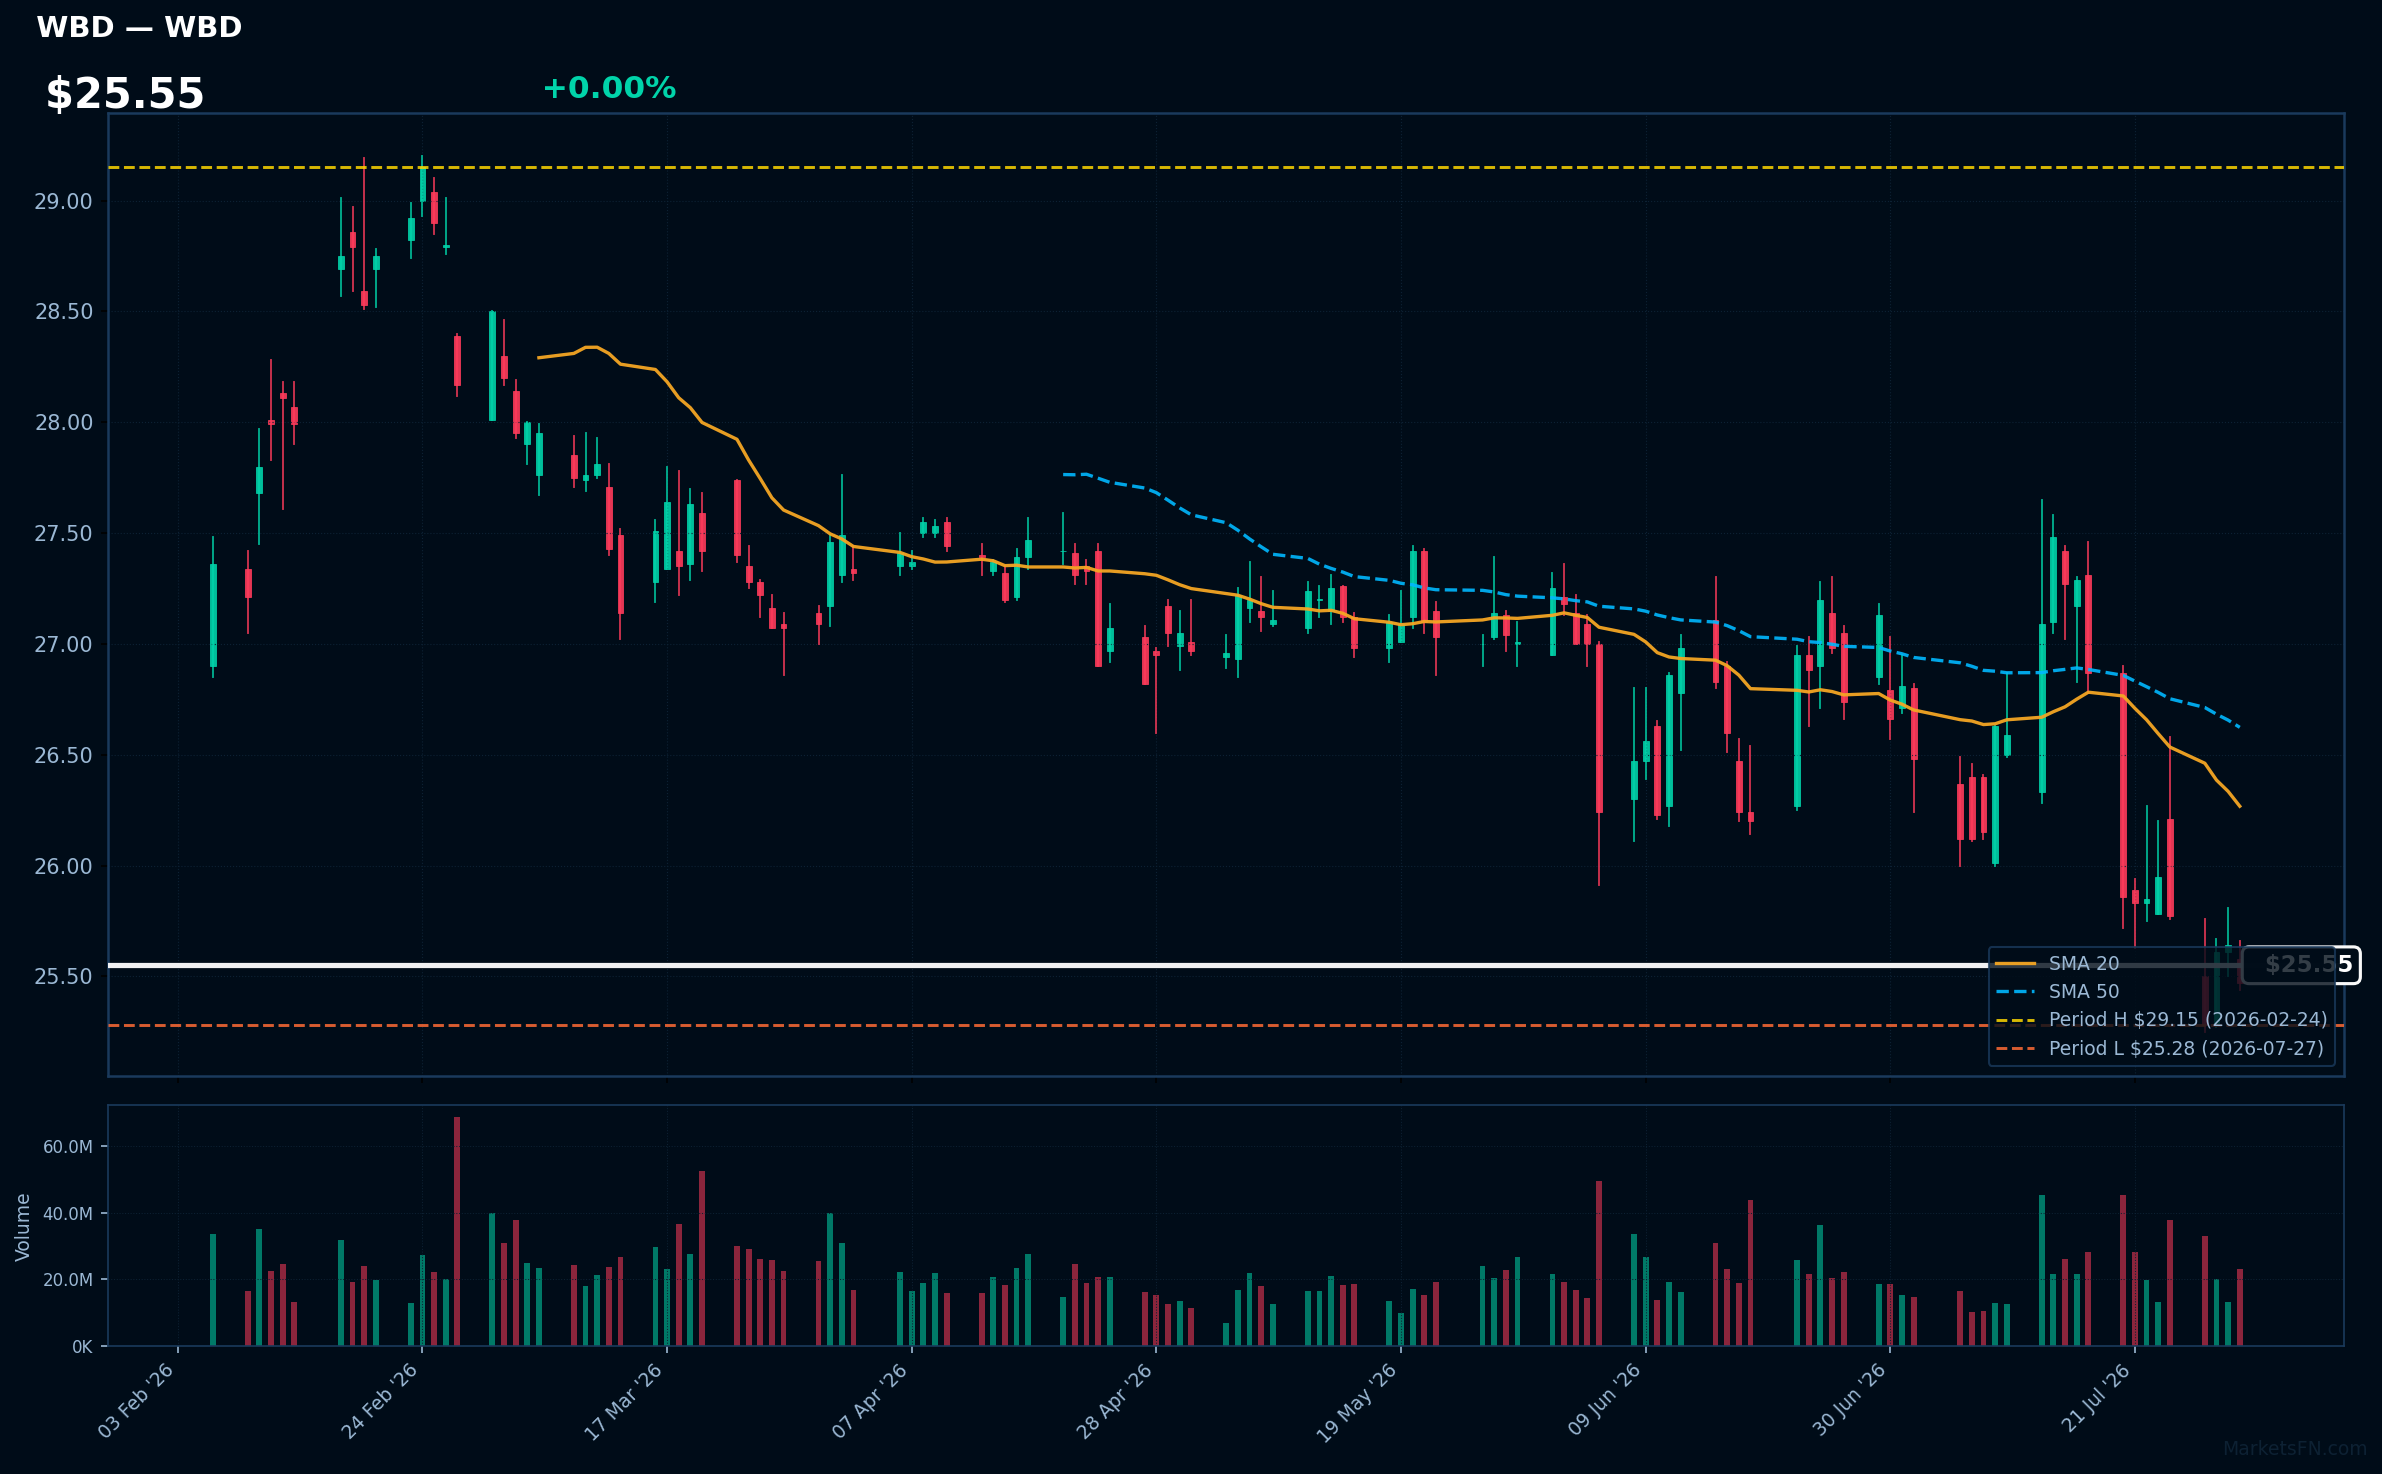
WBD | Warner Bros. Discovery Inc | Communication Services | Price Last: $25.47 | % Realized: -10.66% | RSI: 39.2 | % above MA200: -3.7% | Trend: Below MA20, MA50, MA200
Warner Bros. Discovery Inc. operates in the media and entertainment sector, producing and distributing films, television shows, and streaming content. Investors should care due to its extensive content library and potential for growth in the streaming market, which is increasingly competitive.
The current technical situation shows mixed signals with an RSI(14) of 39.2, indicating potential weakness. The stock is below MA20/MA50/MA200 and is only 0.8% above its 2026 YTD low, testing major support.
Related headlines
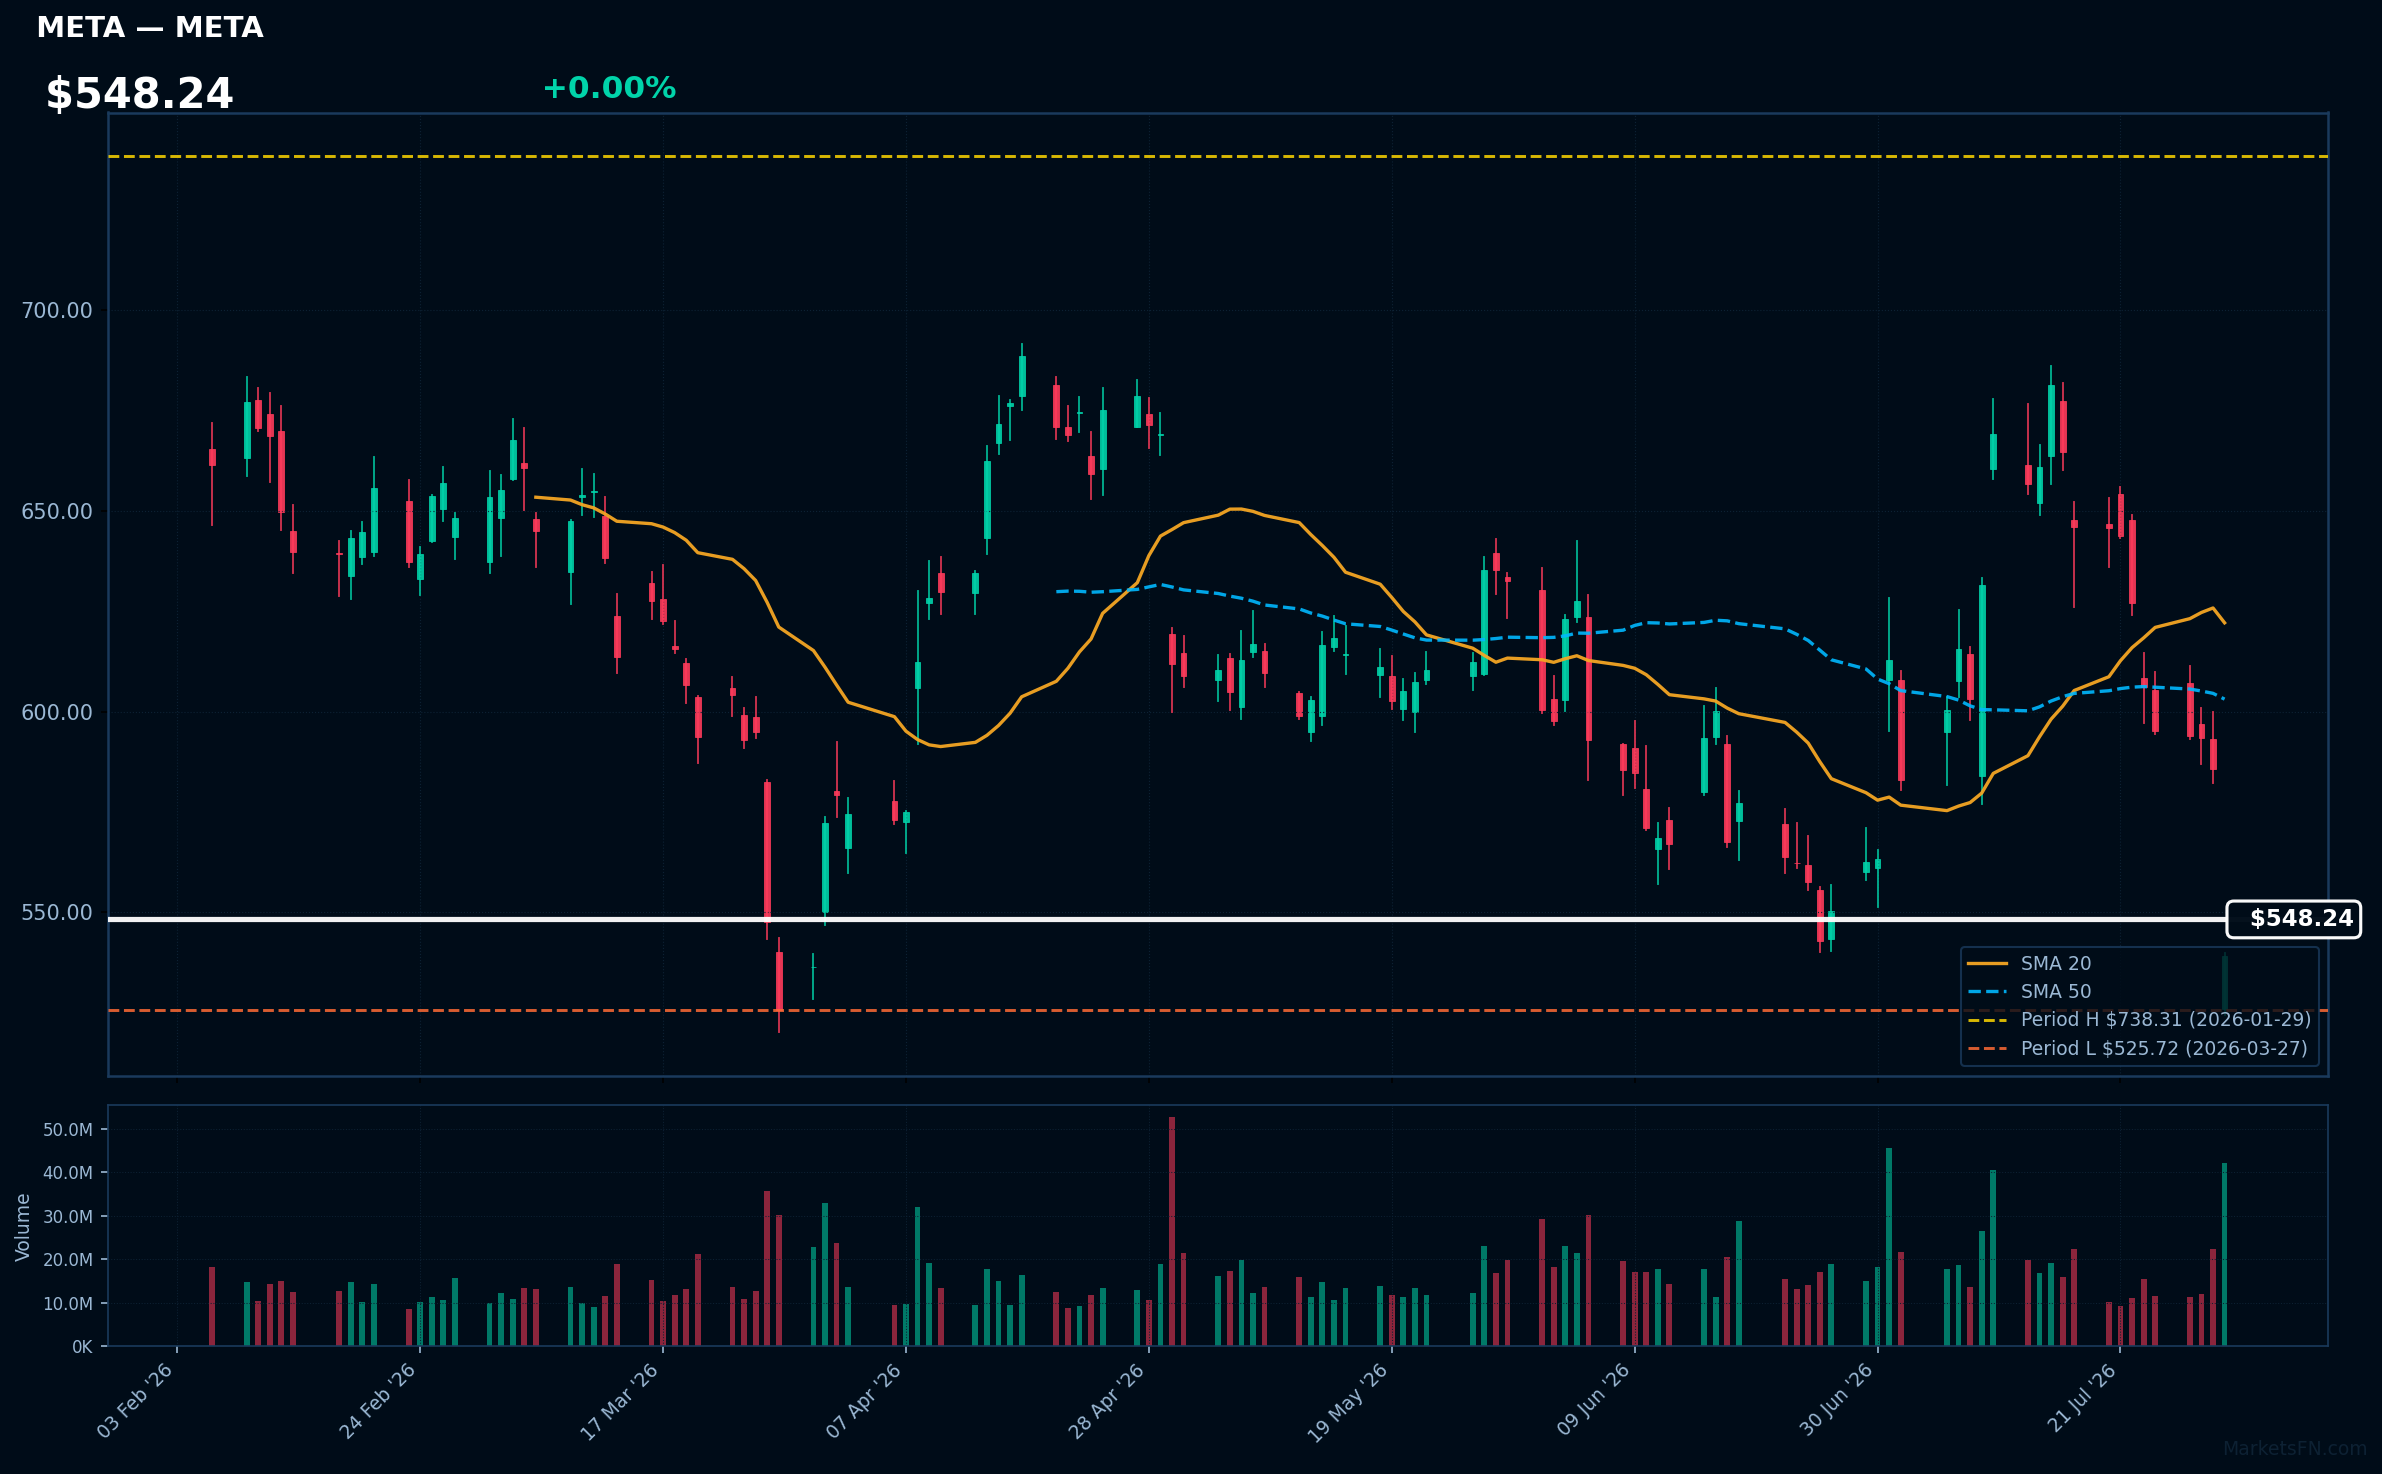
META | Meta Platforms Inc | Communication Services | Price Last: $539.03 | % Realized: -17.12% | RSI: 35.2 | % above MA200: -15.0% | Trend: Below MA20, MA50, MA200
Meta Platforms Inc (META) is a leading social media and technology company, known for its platforms like Facebook, Instagram, and WhatsApp. Investors should care due to its significant influence on digital advertising and user engagement trends, which are critical for revenue growth.
The current technical situation shows mixed signals with an RSI(14) of 35.2, indicating potential oversold conditions. The stock is below MA20, MA50, and MA200, suggesting a warning sign as it tests major support, being only 2.5% above its 2026 YTD low.
Related headlines
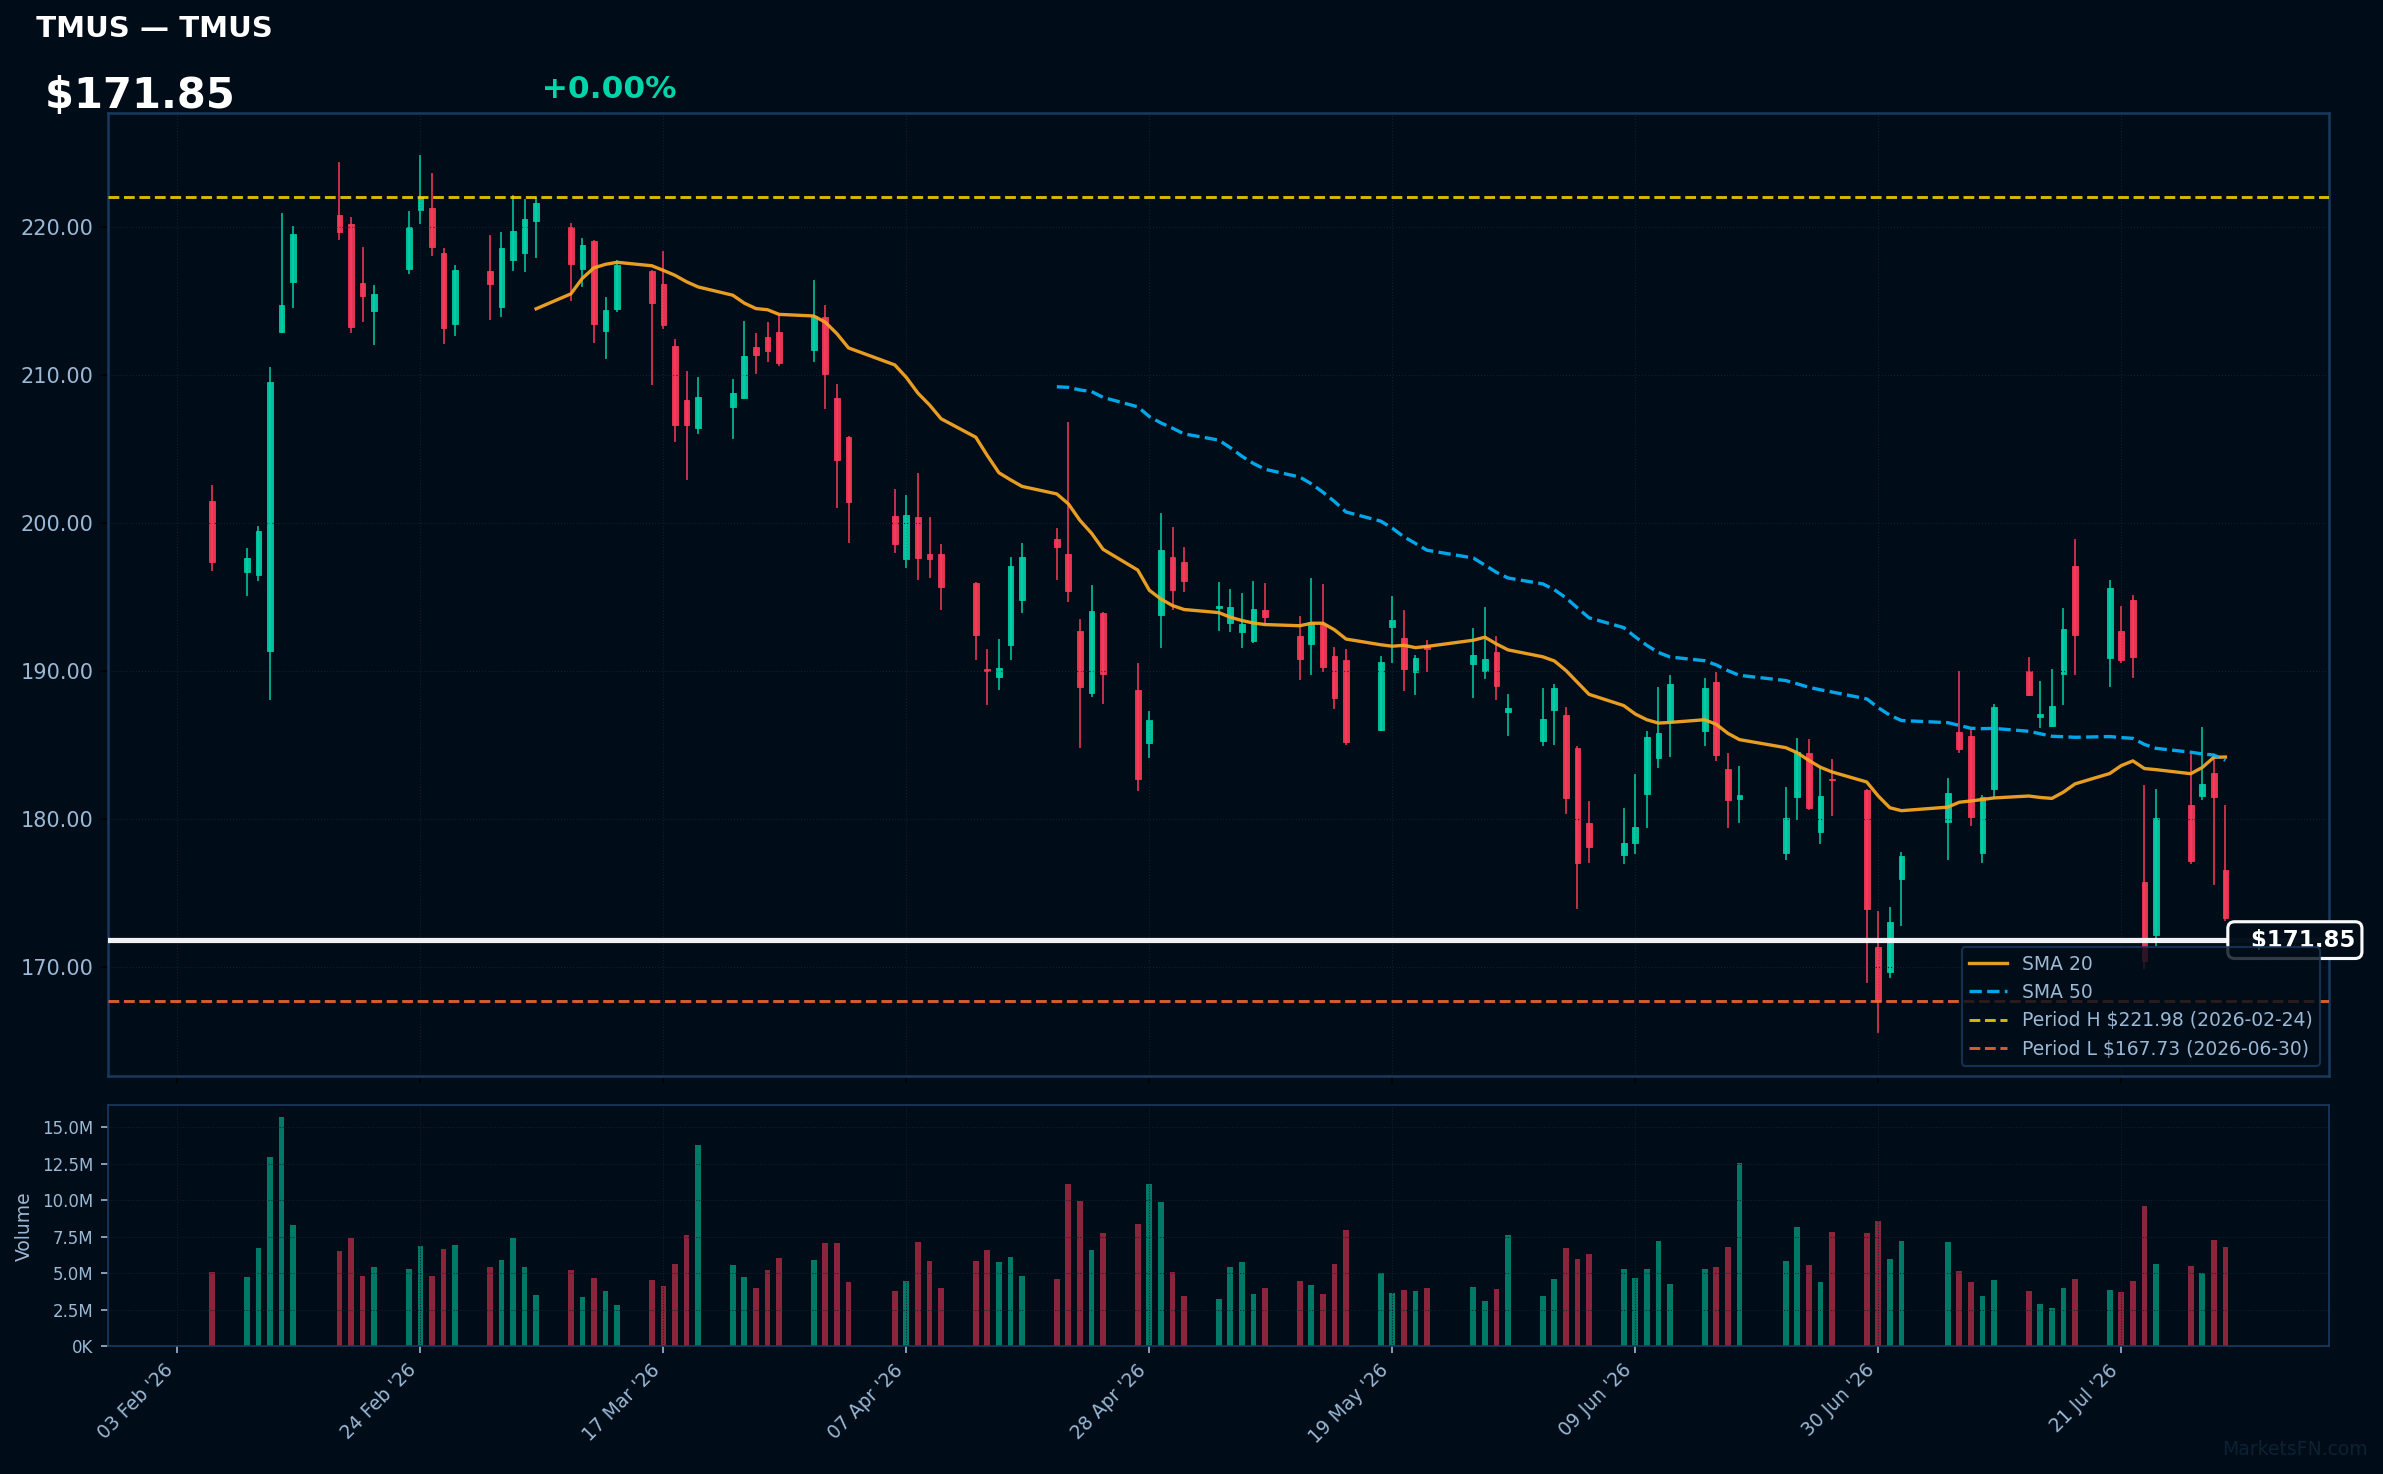
TMUS | T-Mobile US Inc | Communication Services | Price Last: $173.34 | % Realized: -13.15% | RSI: 40.5 | % above MA200: -12.9% | Trend: Below MA20, MA50, MA200
T-Mobile US Inc provides wireless voice, messaging, and data services across the United States. Investors should care due to its competitive positioning in the telecommunications sector and ongoing investments in 5G infrastructure, which could drive future growth and customer acquisition.
The current technical situation shows mixed signals with an RSI(14) of 40.5 and the stock below MA20/MA50/MA200. Additionally, it is only 3.3% above its 2026 YTD low, indicating potential testing of major support.
Related headlines
- T, VZ, TMUS Stocks Are Sliding Today Is There A SpaceX Connection?
- Can T-Mobile and Verizon win on the strength of customer experience?
- How T-Mobile Built a Network Ready for One of the Largest Live Events in U.S. History
- TMUS Stock Heads For Worst Week In Six Years, But Why Does Goldman Sachs Still See 35% Upside?
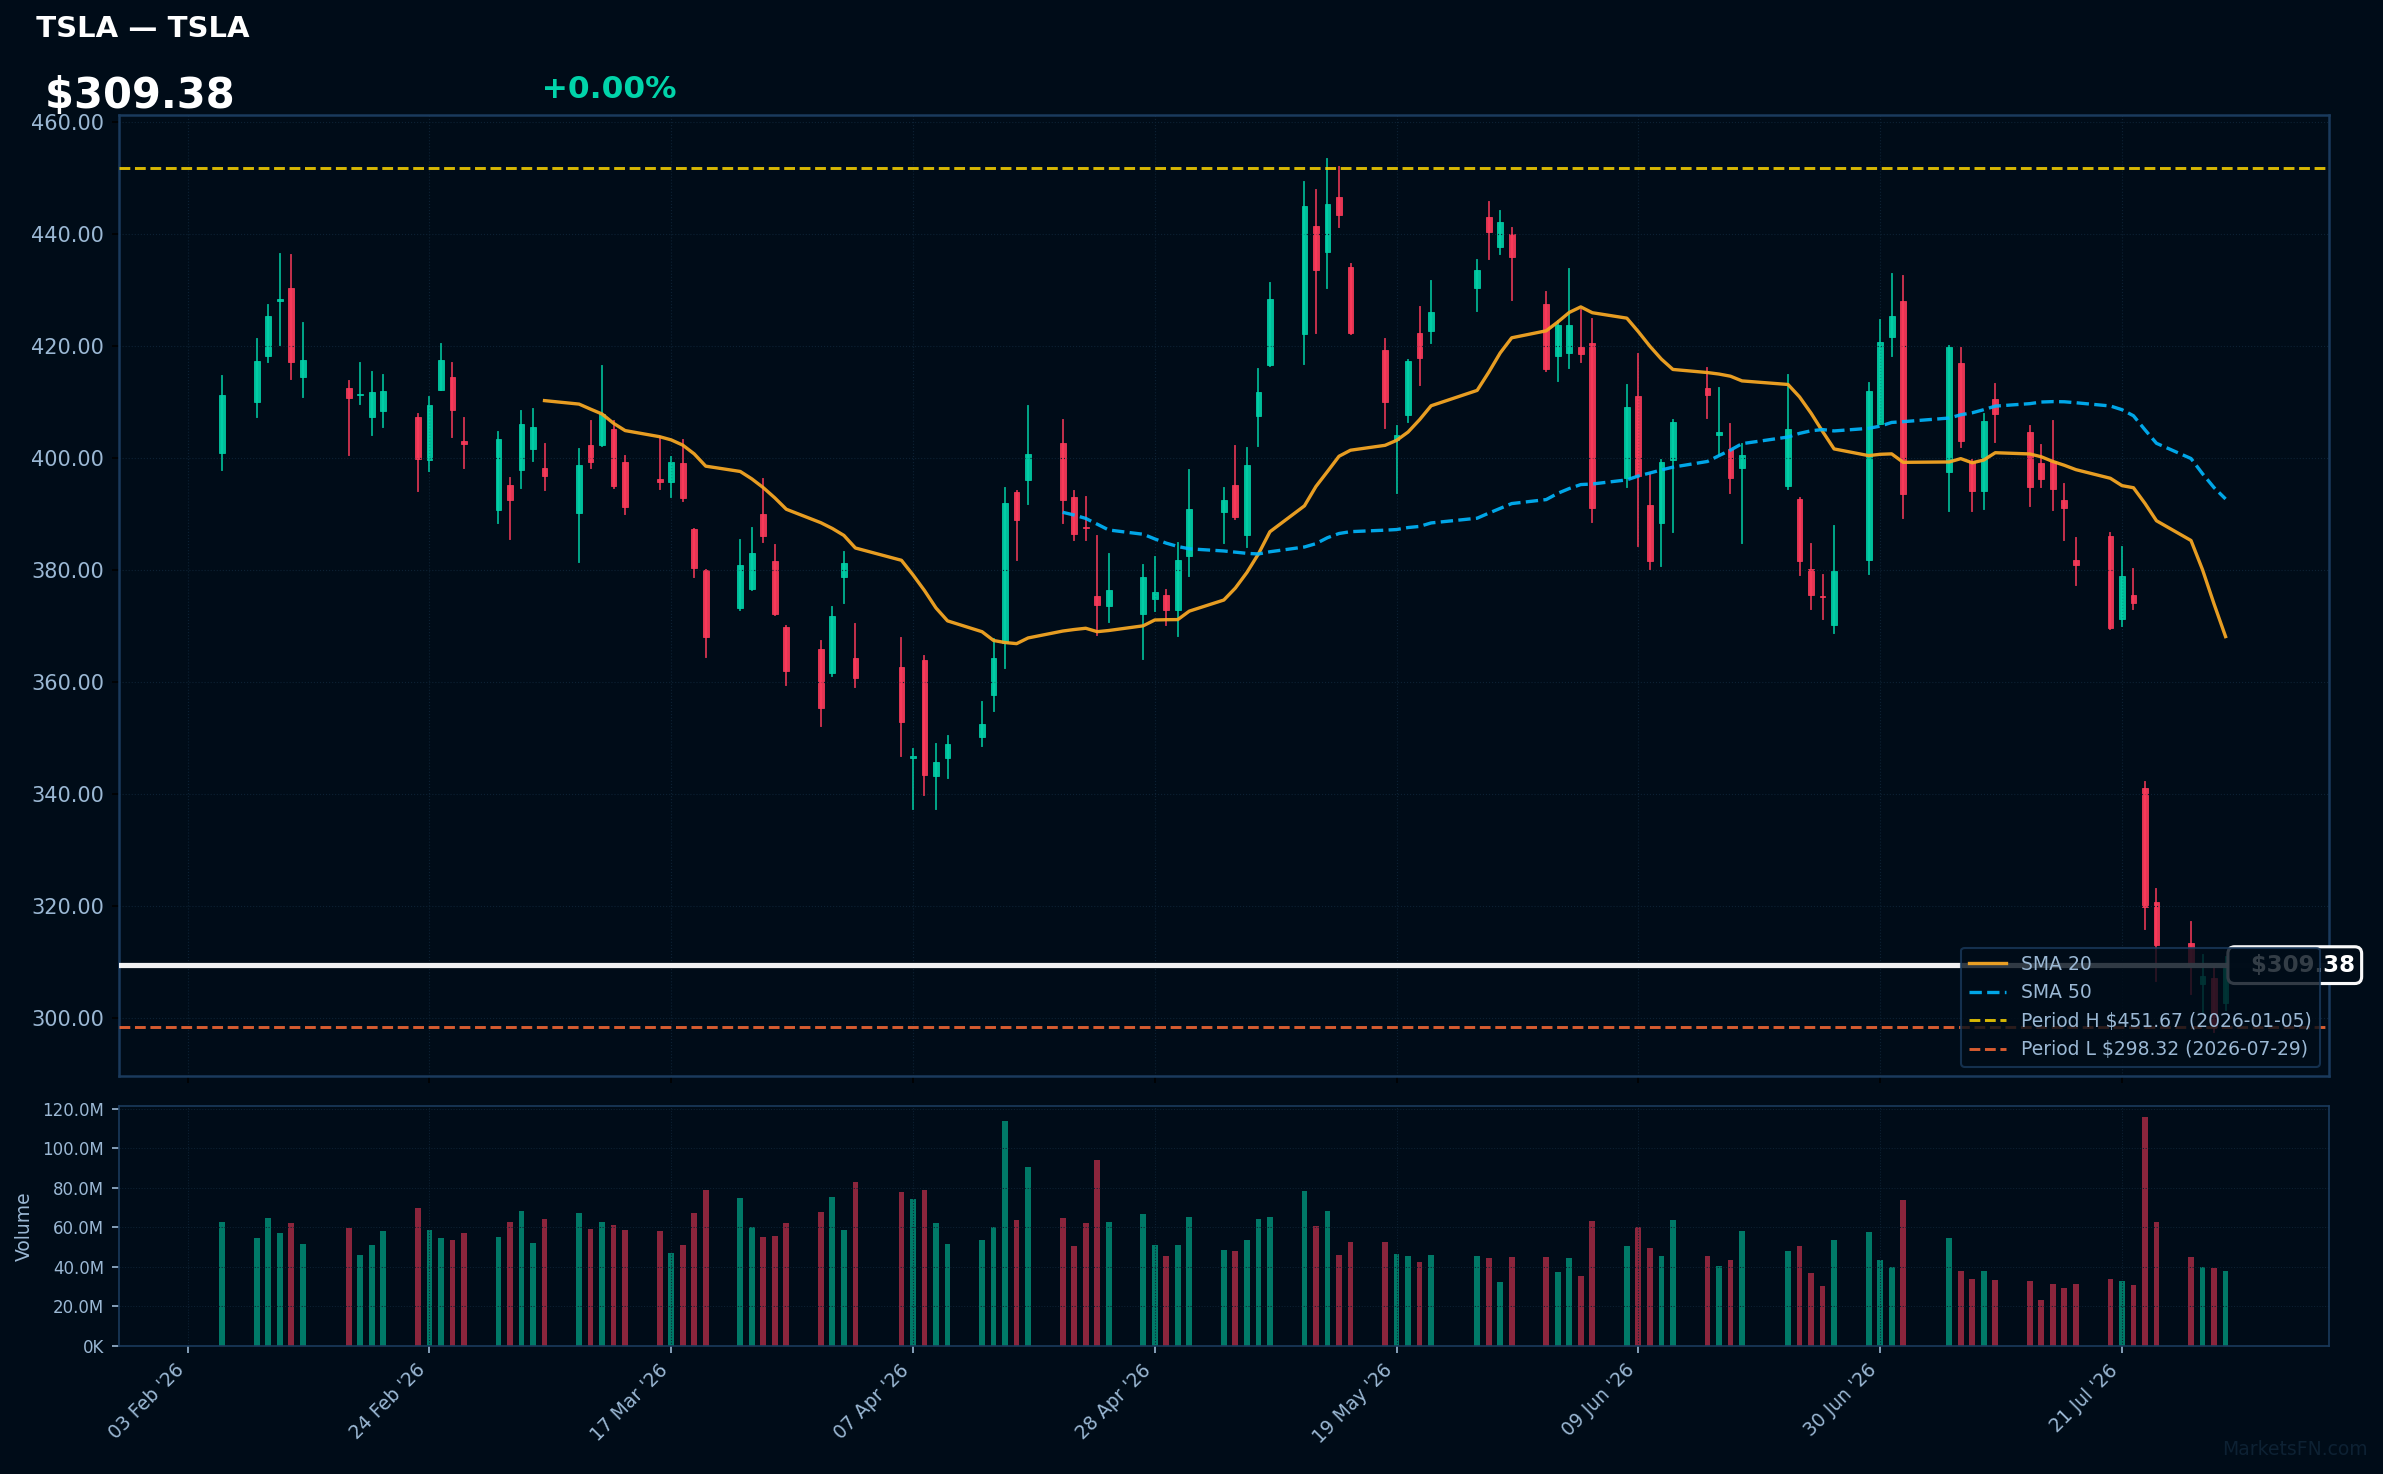
TSLA | Tesla Inc | Consumer Cyclical | Price Last: $308.85 | % Realized: -29.50% | RSI: 30.8 | % above MA200: -25.0% | Trend: Below MA20, MA50, MA200
Tesla Inc designs and manufactures electric vehicles and renewable energy products, positioning itself as a leader in sustainable transportation and energy solutions. Investors should care due to its significant market influence and potential for growth in the rapidly expanding EV sector.
The current technical situation indicates a bearish trend, with an RSI(14) of 30.8 and a MA alignment of price < MA20 < MA50 < MA200, suggesting sustained downtrend and testing major support just 3.5% above its 2026 YTD low.
Related headlines
Market Commentary
The proximity of Nasdaq 100 stocks to their 2026 year-to-date extremes indicates significant volatility and investor sentiment within the technology sector. Stocks like Ross Stores, Inc. (ROST), Electronic Arts, Inc. (EA), and Coca-Cola Europacific Partners Plc (CCEP) are at their highs, reflecting strong performance and positive market sentiment. Conversely, companies such as Synopsys, Inc. (SNPS) and Warner Bros. Discovery Inc. (WBD) are near their lows, suggesting challenges in their operational or market environments.
Current macroeconomic conditions, including interest rate fluctuations and inflationary pressures, are influencing these movements. The technology sector is particularly sensitive to these factors, as higher rates can dampen growth prospects and affect valuations. Additionally, ongoing trends such as digital transformation and increased consumer engagement in gaming and entertainment are driving performance for some companies while leaving others struggling to adapt.
Investors and traders should closely monitor upcoming earnings reports and economic indicators that could impact market sentiment. Key metrics such as consumer spending, inflation rates, and interest rate decisions will be crucial in determining whether these stocks can maintain their momentum or if further corrections are on the horizon. Staying informed on sector-specific developments will also be essential for making strategic investment decisions.
Methodology: All 101 Nasdaq 100 constituents screened. Close prices downloaded from 2026-01-01. Period high = highest close since Jan 1 2026; period low = lowest close since Jan 1 2026. Distance = (current price / period extreme − 1) × 100. Technical indicators computed on up to 1 year of daily OHLCV data.
Disclaimer: For informational purposes only. Not investment advice. Past performance is not indicative of future results.

