Nasdaq 100 52-Week Highs & Lows Radar: NVIDIA (NVDA), Netflix (NFLX) and more
MarketsFN Team

Nasdaq 100 52-Week Highs & Lows Radar: NVIDIA (NVDA), Netflix (NFLX) and more
Screening all 101 Nasdaq 100 constituents for stocks nearest to their 52-week high and their 52-week low. Data as of October 02, 2026. % Realized = 52-week total return.
Legend: RSI > 70 = overbought · RSI < 30 = oversold · Green % Realized = positive 52W return · Red = negative.
📈 Nearest to 52-Week High
Sectors represented: Technology (5)
| Ticker | Company | Sector | Price Last | % Realized | 52-Week High Date | RSI | % above MA200 | Trend |
|---|---|---|---|---|---|---|---|---|
| NVDA | NVIDIA Corp | Technology | $237.31 | +25.63% | 2026-10-02 | 65.5 | +18.2% | Above MA20, MA50, MA200 |
| AMD | Advanced Micro Devices Inc | Technology | $640.98 | +277.65% | 2026-10-02 | 71.1 | +71.0% | Above MA20, MA50, MA200 |
| PANW | Palo Alto Networks Inc | Technology | $405.11 | +93.55% | 2026-10-02 | 63.4 | +61.8% | Above MA20, MA50, MA200 |
| CRWD | Crowdstrike Holdings Inc | Technology | $271.45 | +118.55% | 2026-10-02 | 69.4 | +76.8% | Above MA20, MA50, MA200 |
| FTNT | Fortinet Inc | Technology | $182.40 | +111.38% | 2026-10-02 | 65.5 | +53.8% | Above MA20, MA50, MA200 |
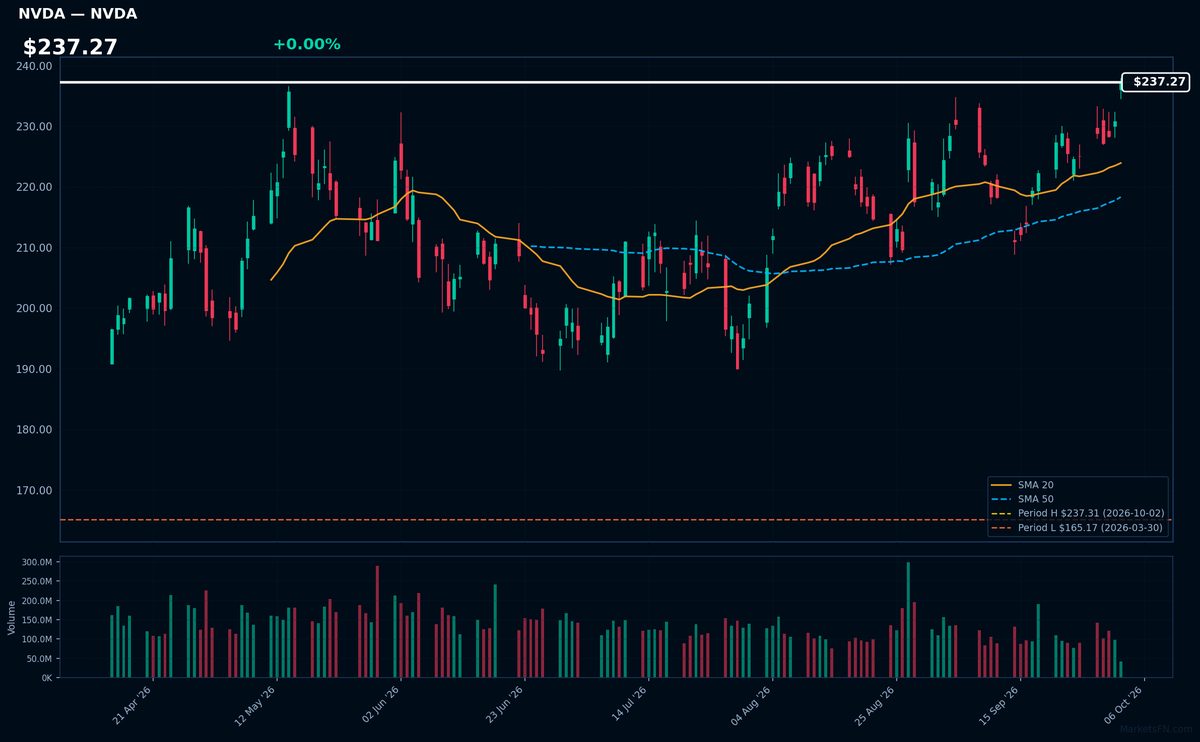
NVDA | NVIDIA Corp | Technology | Price Last: $237.31 | % Realized: +25.63% | RSI: 65.5 | % above MA200: +18.2% | Trend: Above MA20, MA50, MA200
NVIDIA Corp designs high-performance GPUs and AI infrastructure. Investors care because the company provides the essential hardware powering the global shift toward generative AI and accelerated computing, driving massive demand for its data center chips.
Momentum is strong with a bullish MA alignment (price > MA20 > MA50 > MA200) and a 25.6% 52-Week return. With an RSI(14) of 65.5 and the price 0.0% below its 52-Week high, the stock is positioned for a potential breakout.
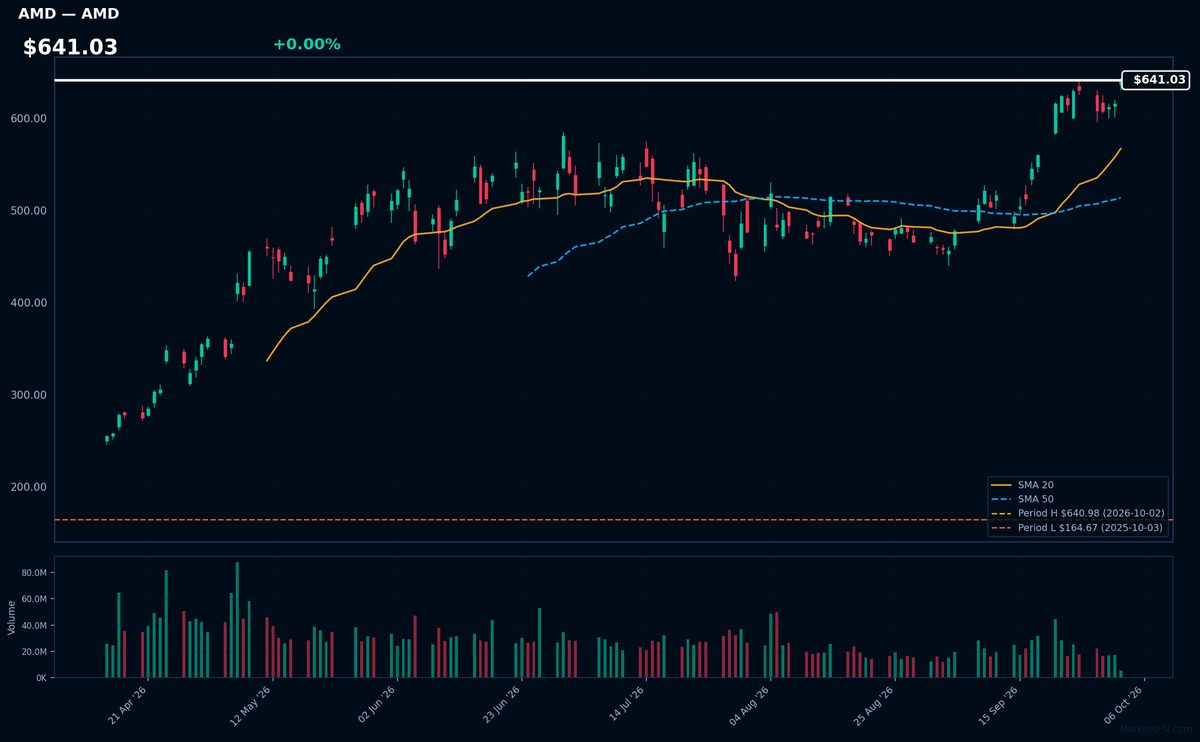
AMD | Advanced Micro Devices Inc | Technology | Price Last: $640.98 | % Realized: +277.65% | RSI: 71.1 | % above MA200: +71.0% | Trend: Above MA20, MA50, MA200
Advanced Micro Devices Inc (AMD) is a semiconductor company designing and manufacturing high-performance CPUs, GPUs, and other processing units for gaming PCs, data centers, and AI applications, making it a key player in the tech industry's growth.
AMD's current technical situation indicates strong momentum: RSI(14) is 71.1, nearing overbought territory, with a bullish MA alignment (price > MA20 > MA50 > MA200) and 0.0% below its 52-Week high, suggesting a potential breakout.
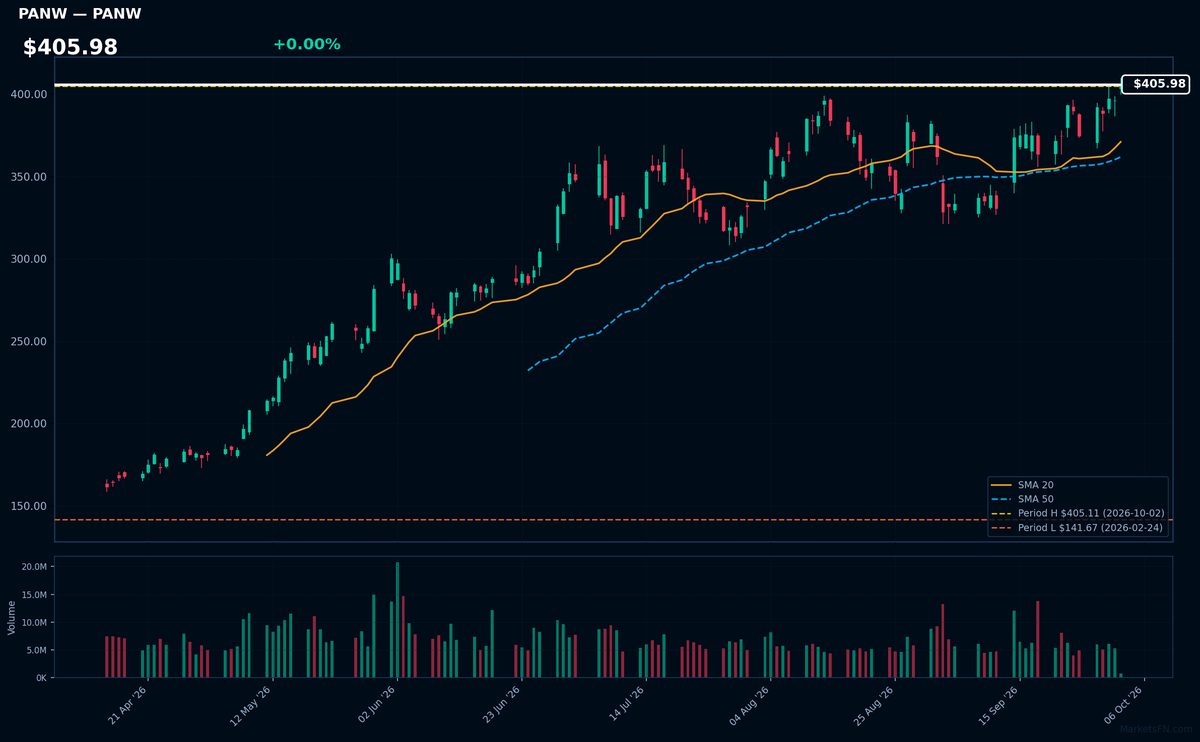
PANW | Palo Alto Networks Inc | Technology | Price Last: $405.11 | % Realized: +93.55% | RSI: 63.4 | % above MA200: +61.8% | Trend: Above MA20, MA50, MA200
Palo Alto Networks Inc provides cybersecurity solutions to protect digital assets. Investors should care because the company is demonstrating significant growth, evidenced by a 93.6% return over the 52-Week period.
The stock shows strong momentum with a bullish MA alignment (price > MA20 > MA50 > MA200) and an RSI(14) of 63.4. Trading at $405.98, it is 0.0% below its 52-Week high, signaling a potential breakout.
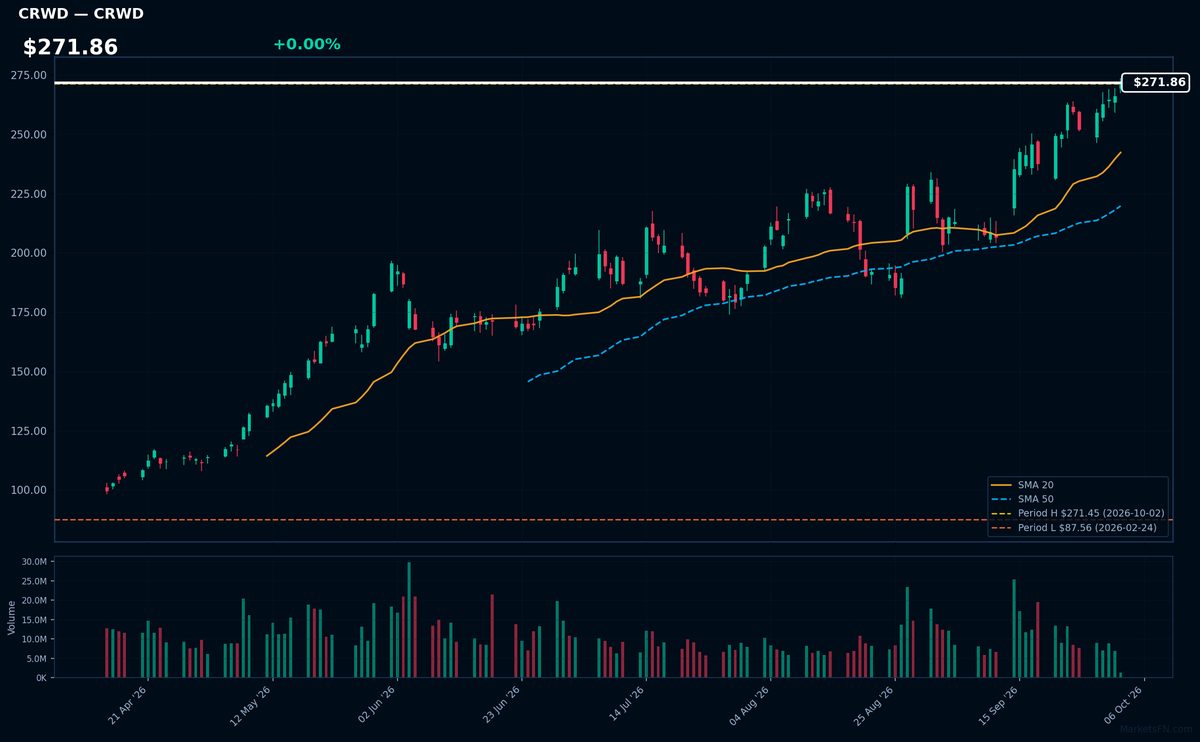
CRWD | Crowdstrike Holdings Inc | Technology | Price Last: $271.45 | % Realized: +118.55% | RSI: 69.4 | % above MA200: +76.8% | Trend: Above MA20, MA50, MA200
Crowdstrike Holdings Inc provides cloud-native endpoint protection and cybersecurity services. Investors should care because the company is demonstrating massive growth, evidenced by a 118.6% return over the 52-Week period.
Momentum is strongly bullish with price > MA20 > MA50 > MA200. The stock is 0.0% below its 52-Week high, suggesting a potential breakout. However, an RSI(14) of 69.4 indicates the asset is approaching overbought territory.
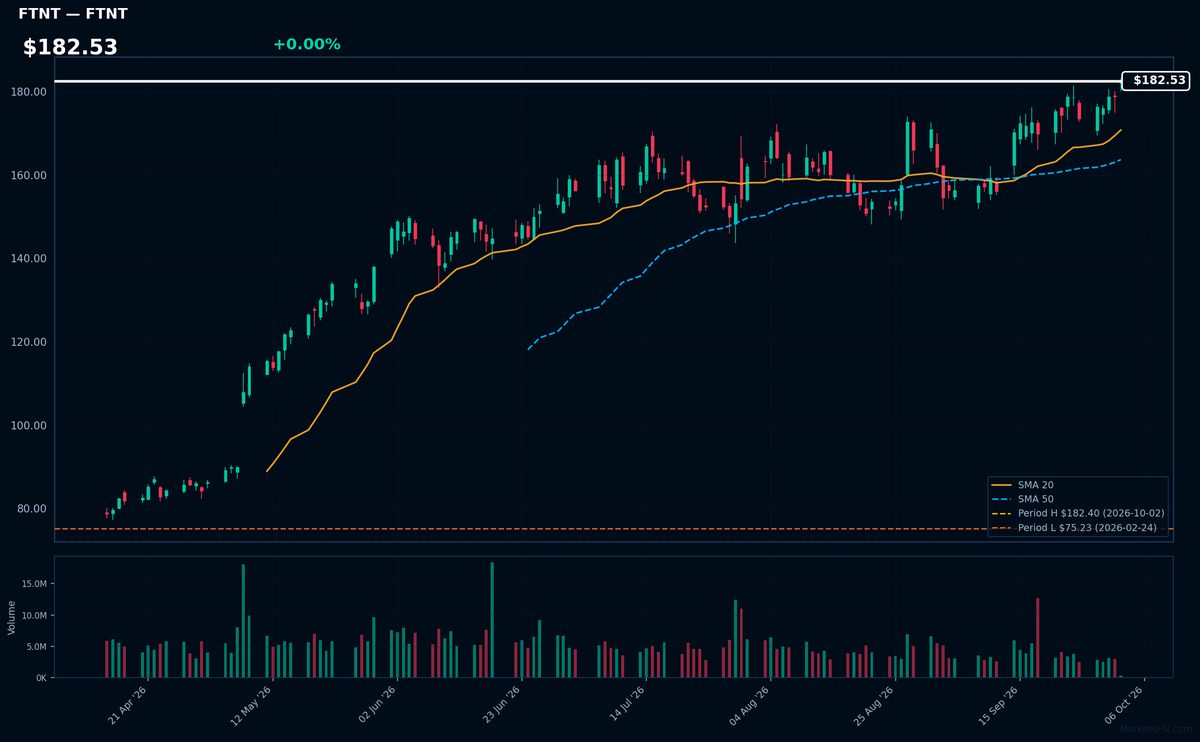
FTNT | Fortinet Inc | Technology | Price Last: $182.40 | % Realized: +111.38% | RSI: 65.5 | % above MA200: +53.8% | Trend: Above MA20, MA50, MA200
Fortinet Inc provides cybersecurity solutions. Investors should care because the company is demonstrating significant growth, evidenced by a 111.4% return over the 52-Week period.
The stock shows strong momentum with a bullish MA alignment (price > MA20 > MA50 > MA200) and an RSI(14) of 65.5. Trading at $182.53, it is 0.0% below its 52-Week high, suggesting a potential breakout.
📉 Nearest to 52-Week Low
Sectors represented: Communication Services (3), Consumer Cyclical (1), Consumer Defensive (1)
| Ticker | Company | Sector | Price Last | % Realized | 52-Week Low Date | RSI | % above MA200 | Trend |
|---|---|---|---|---|---|---|---|---|
| NFLX | Netflix Inc | Communication Services | $67.51 | -41.93% | 2026-10-02 | 31.8 | -19.7% | Below MA20, MA50, MA200 |
| APP | Applovin Corp | Communication Services | $275.36 | -59.72% | 2026-10-02 | 30.3 | -39.6% | Below MA20, MA50, MA200 |
| LULU | Lululemon Athletica inc | Consumer Cyclical | $95.93 | -46.17% | 2026-10-01 | 35.8 | -33.8% | Below MA20, MA50, MA200 |
| PEP | PepsiCo Inc | Consumer Defensive | $125.71 | -11.66% | 2026-10-01 | 24.5 | -14.6% | Below MA20, MA50, MA200 |
| TTD | Trade Desk Inc | Communication Services | $12.08 | -76.26% | 2026-09-29 | 30.7 | -46.5% | Below MA20, MA50, MA200 |
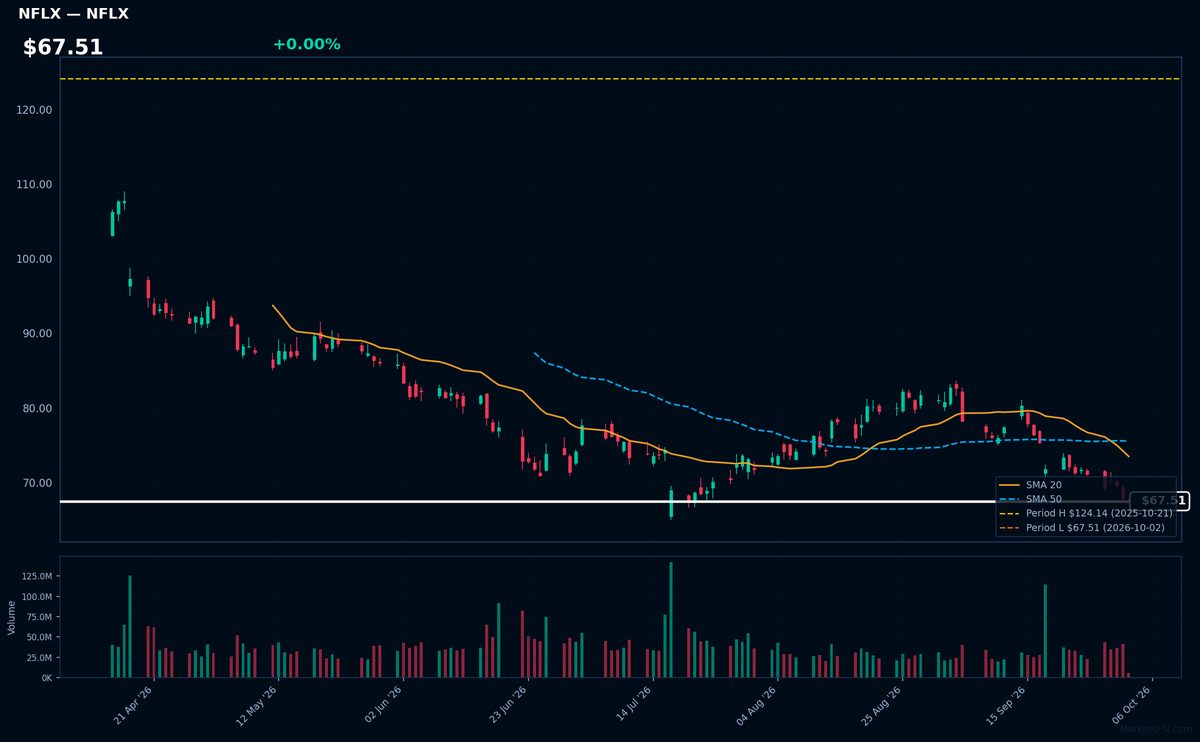
NFLX | Netflix Inc | Communication Services | Price Last: $67.51 | % Realized: -41.93% | RSI: 31.8 | % above MA200: -19.7% | Trend: Below MA20, MA50, MA200
Netflix Inc is a streaming giant providing original content across various genres; investors care due to its significant market share and growth potential in the streaming industry.
NFLX is in a sustained downtrend with RSI(14) at 31.8, testing major support near its 52-Week low; MA alignment is bearish as price ($67.51) < MA20 < MA50 < MA200, indicating a warning sign.
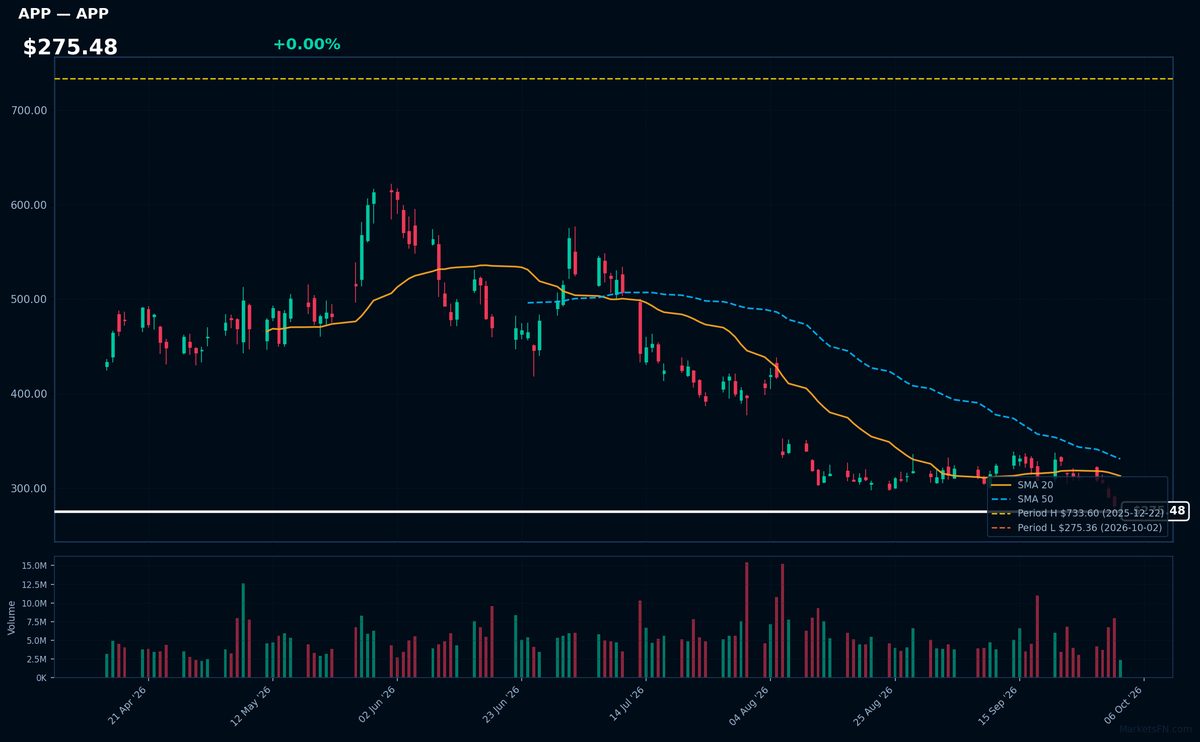
APP | Applovin Corp | Communication Services | Price Last: $275.36 | % Realized: -59.72% | RSI: 30.3 | % above MA200: -39.6% | Trend: Below MA20, MA50, MA200
Applovin Corp operates in the mobile app ecosystem, providing software and advertising technology that allows developers to monetize their apps and acquire users. Investors should care about its ability to scale AI-driven ad performance within the competitive mobile gaming and app markets.
The technicals signal a severe warning. With a -59.7% 52-Week return and a bearish MA alignment (price < MA20 < MA50 < MA200), the stock is in a sustained downtrend. An RSI(14) of 30.3 and proximity of 0.0% above its 52-Week low indicate it is testing major support.
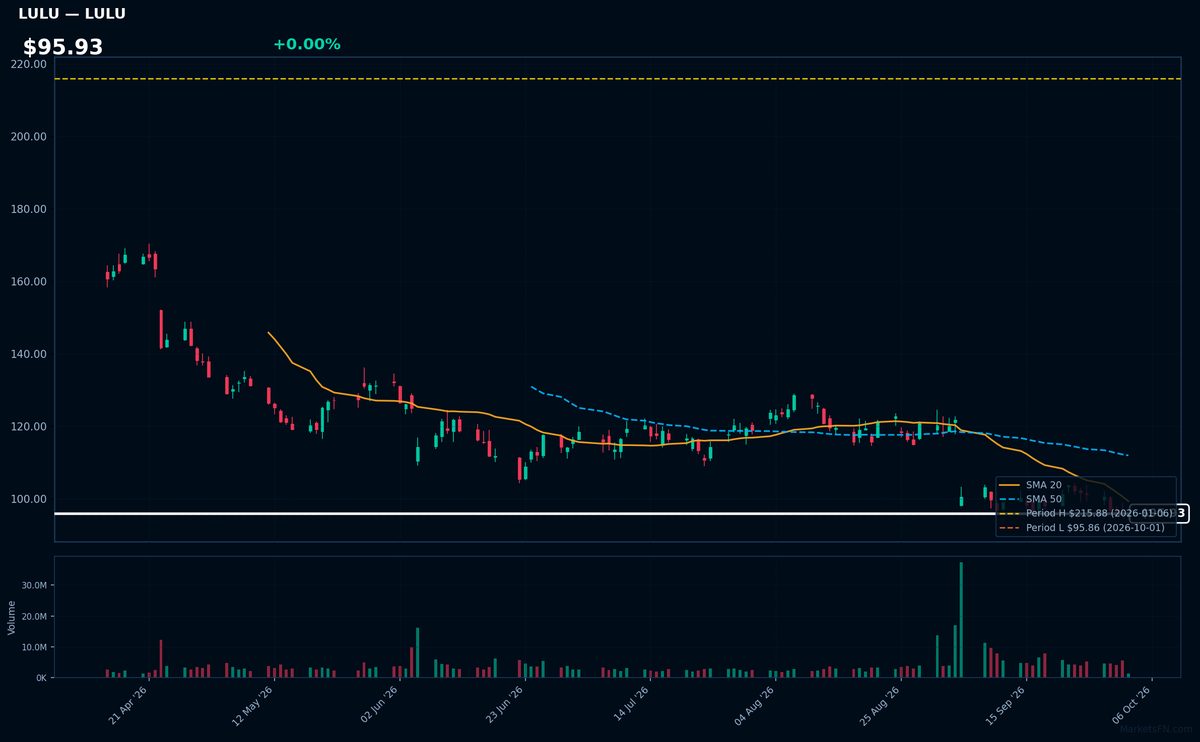
LULU | Lululemon Athletica inc | Consumer Cyclical | Price Last: $95.93 | % Realized: -46.17% | RSI: 35.8 | % above MA200: -33.8% | Trend: Below MA20, MA50, MA200
Lululemon Athletica inc designs and sells athletic apparel, particularly yoga and running wear. Investors care about its performance as it reflects consumer demand for premium activewear and the company's ability to maintain brand momentum and expand its market share.
Lululemon's current technical situation is bearish, with an RSI(14) of 35.8 indicating oversold conditions, and a bearish MA alignment (price < MA20 < MA50 < MA200). The stock is near its 52-Week low, down 46.2% over the period, signaling a sustained downtrend.
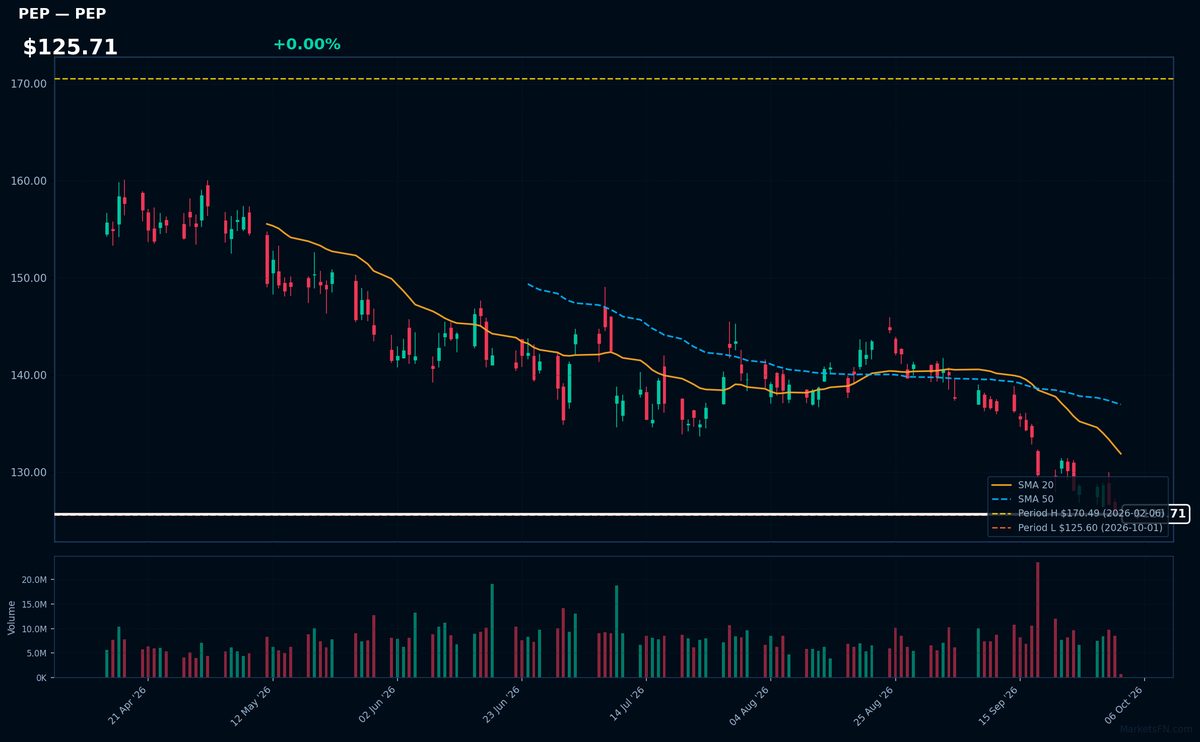
PEP | PepsiCo Inc | Consumer Defensive | Price Last: $125.71 | % Realized: -11.66% | RSI: 24.5 | % above MA200: -14.6% | Trend: Below MA20, MA50, MA200
PepsiCo Inc is a diversified food and beverage company with brands like Pepsi, Lay's, and Gatorade, generating revenue through beverage sales, snack foods, and other categories, making it a significant player in the consumer staples sector.
PepsiCo's current technical situation is bearish, with an RSI(14) of 24.5 indicating oversold conditions, price below all key MAs (MA20, MA50, MA200), and a 52-Week low proximity of 0.1%, signaling a potential support test.
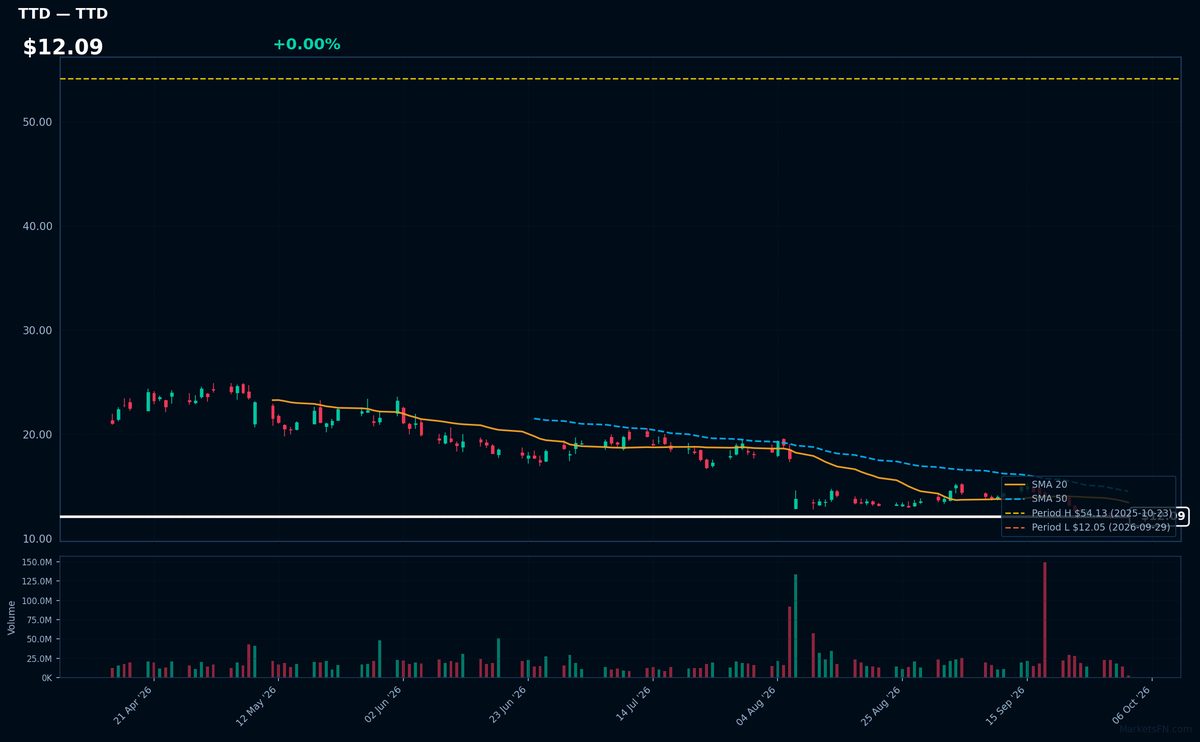
TTD | Trade Desk Inc | Communication Services | Price Last: $12.08 | % Realized: -76.26% | RSI: 30.7 | % above MA200: -46.5% | Trend: Below MA20, MA50, MA200
Trade Desk Inc operates a demand-side platform that allows ad buyers to manage digital advertising campaigns across various channels. Investors care because it provides the infrastructure for programmatic advertising, enabling precise targeting and real-time bidding for global brands.
The technicals signal a severe warning. TTD is in a sustained downtrend with bearish MA alignment (price < MA20 < MA50 < MA200) and an RSI(14) of 30.7. Trading at $12.09, the stock is only 0.2% above its 52-Week low after a -76.3% period return.
Market Commentary
The concentration of Nasdaq 100 stocks at 52-week extremes signals a stark divergence in market sentiment. With NVDA, AMD, PANW, CRWD, and FTNT all 0.0% from their 52-week highs, there is aggressive momentum in specific tech verticals. Conversely, the proximity of NFLX, APP, LULU, PEP, and TTD to their 52-week lows—ranging from +0.0% to +0.2% above those levels—indicates significant bearish pressure on other components.
Price levels are being driven by a clear thematic split. The 0.0% distance from highs for NVDA and AMD highlights the continued dominance of semiconductor demand, while PANW, CRWD, and FTNT suggest a strong macro tailwind for cybersecurity. Meanwhile, the weakness in NFLX and TTD suggests a cooling or correction in digital advertising and streaming sectors.
Investors should monitor the 0.0% threshold for the high-flyers to see if they can sustain these peaks. For the laggards, the critical levels are the narrow margins above their lows, specifically the +0.1% mark for LULU and PEP and the +0.2% mark for TTD, where a further dip could trigger a broader breakdown.
Methodology: All 101 Nasdaq 100 constituents screened. 52-week high = highest daily close over the past 252 trading days (approx. 1 year). 52-week low = lowest daily close over the same period. Distance = (current price / extreme − 1) × 100. Technical indicators computed on up to 1 year of daily OHLCV data.
Disclaimer: For informational purposes only. Not investment advice. Past performance is not indicative of future results.

