Nasdaq 100 52-Week Highs & Lows Radar: Palo Alto Networks (PANW), T-Mobile US (TMUS) and more
· Stocks · MarketsFN Team
Nasdaq 100 52-Week Highs & Lows Radar: Palo Alto Networks (PANW), T-Mobile US (TMUS) and more
Screening all 101 Nasdaq 100 constituents for stocks nearest to their 52-week high and their 52-week low. Data as of June 29, 2026. % Realized = 52-week total return.
Legend: RSI > 70 = overbought · RSI < 30 = oversold · Green % Realized = positive 52W return · Red = negative.
📈 Nearest to 52-Week High
Sectors represented: Technology (1), Consumer Cyclical (1), Consumer Defensive (1), Industrials (1), Utilities (1)
| Ticker | Company | Sector | Price Last | % Realized | 52-Week High Date | RSI | % above MA200 | Trend |
|---|---|---|---|---|---|---|---|---|
| PANW | Palo Alto Networks Inc | Technology | $323.38 | +58.02% | 2026-06-29 | 75.8 | +62.3% | Above MA20, MA50, MA200 |
| ABNB | Airbnb Inc | Consumer Cyclical | $148.96 | +12.55% | 2026-06-29 | 66.7 | +14.8% | Above MA20, MA50, MA200 |
| MNST | Monster Beverage Corp | Consumer Defensive | $97.36 | +55.43% | 2026-06-29 | 76.6 | +26.3% | Above MA20, MA50, MA200 |
| CSX | CSX Corp | Industrials | $48.26 | +47.90% | 2026-06-29 | 64.2 | +22.1% | Above MA20, MA50, MA200 |
| AEP | American Electric Power Company Inc | Utilities | $138.82 | +33.79% | 2026-06-29 | 70.2 | +12.2% | Above MA20, MA50, MA200 |
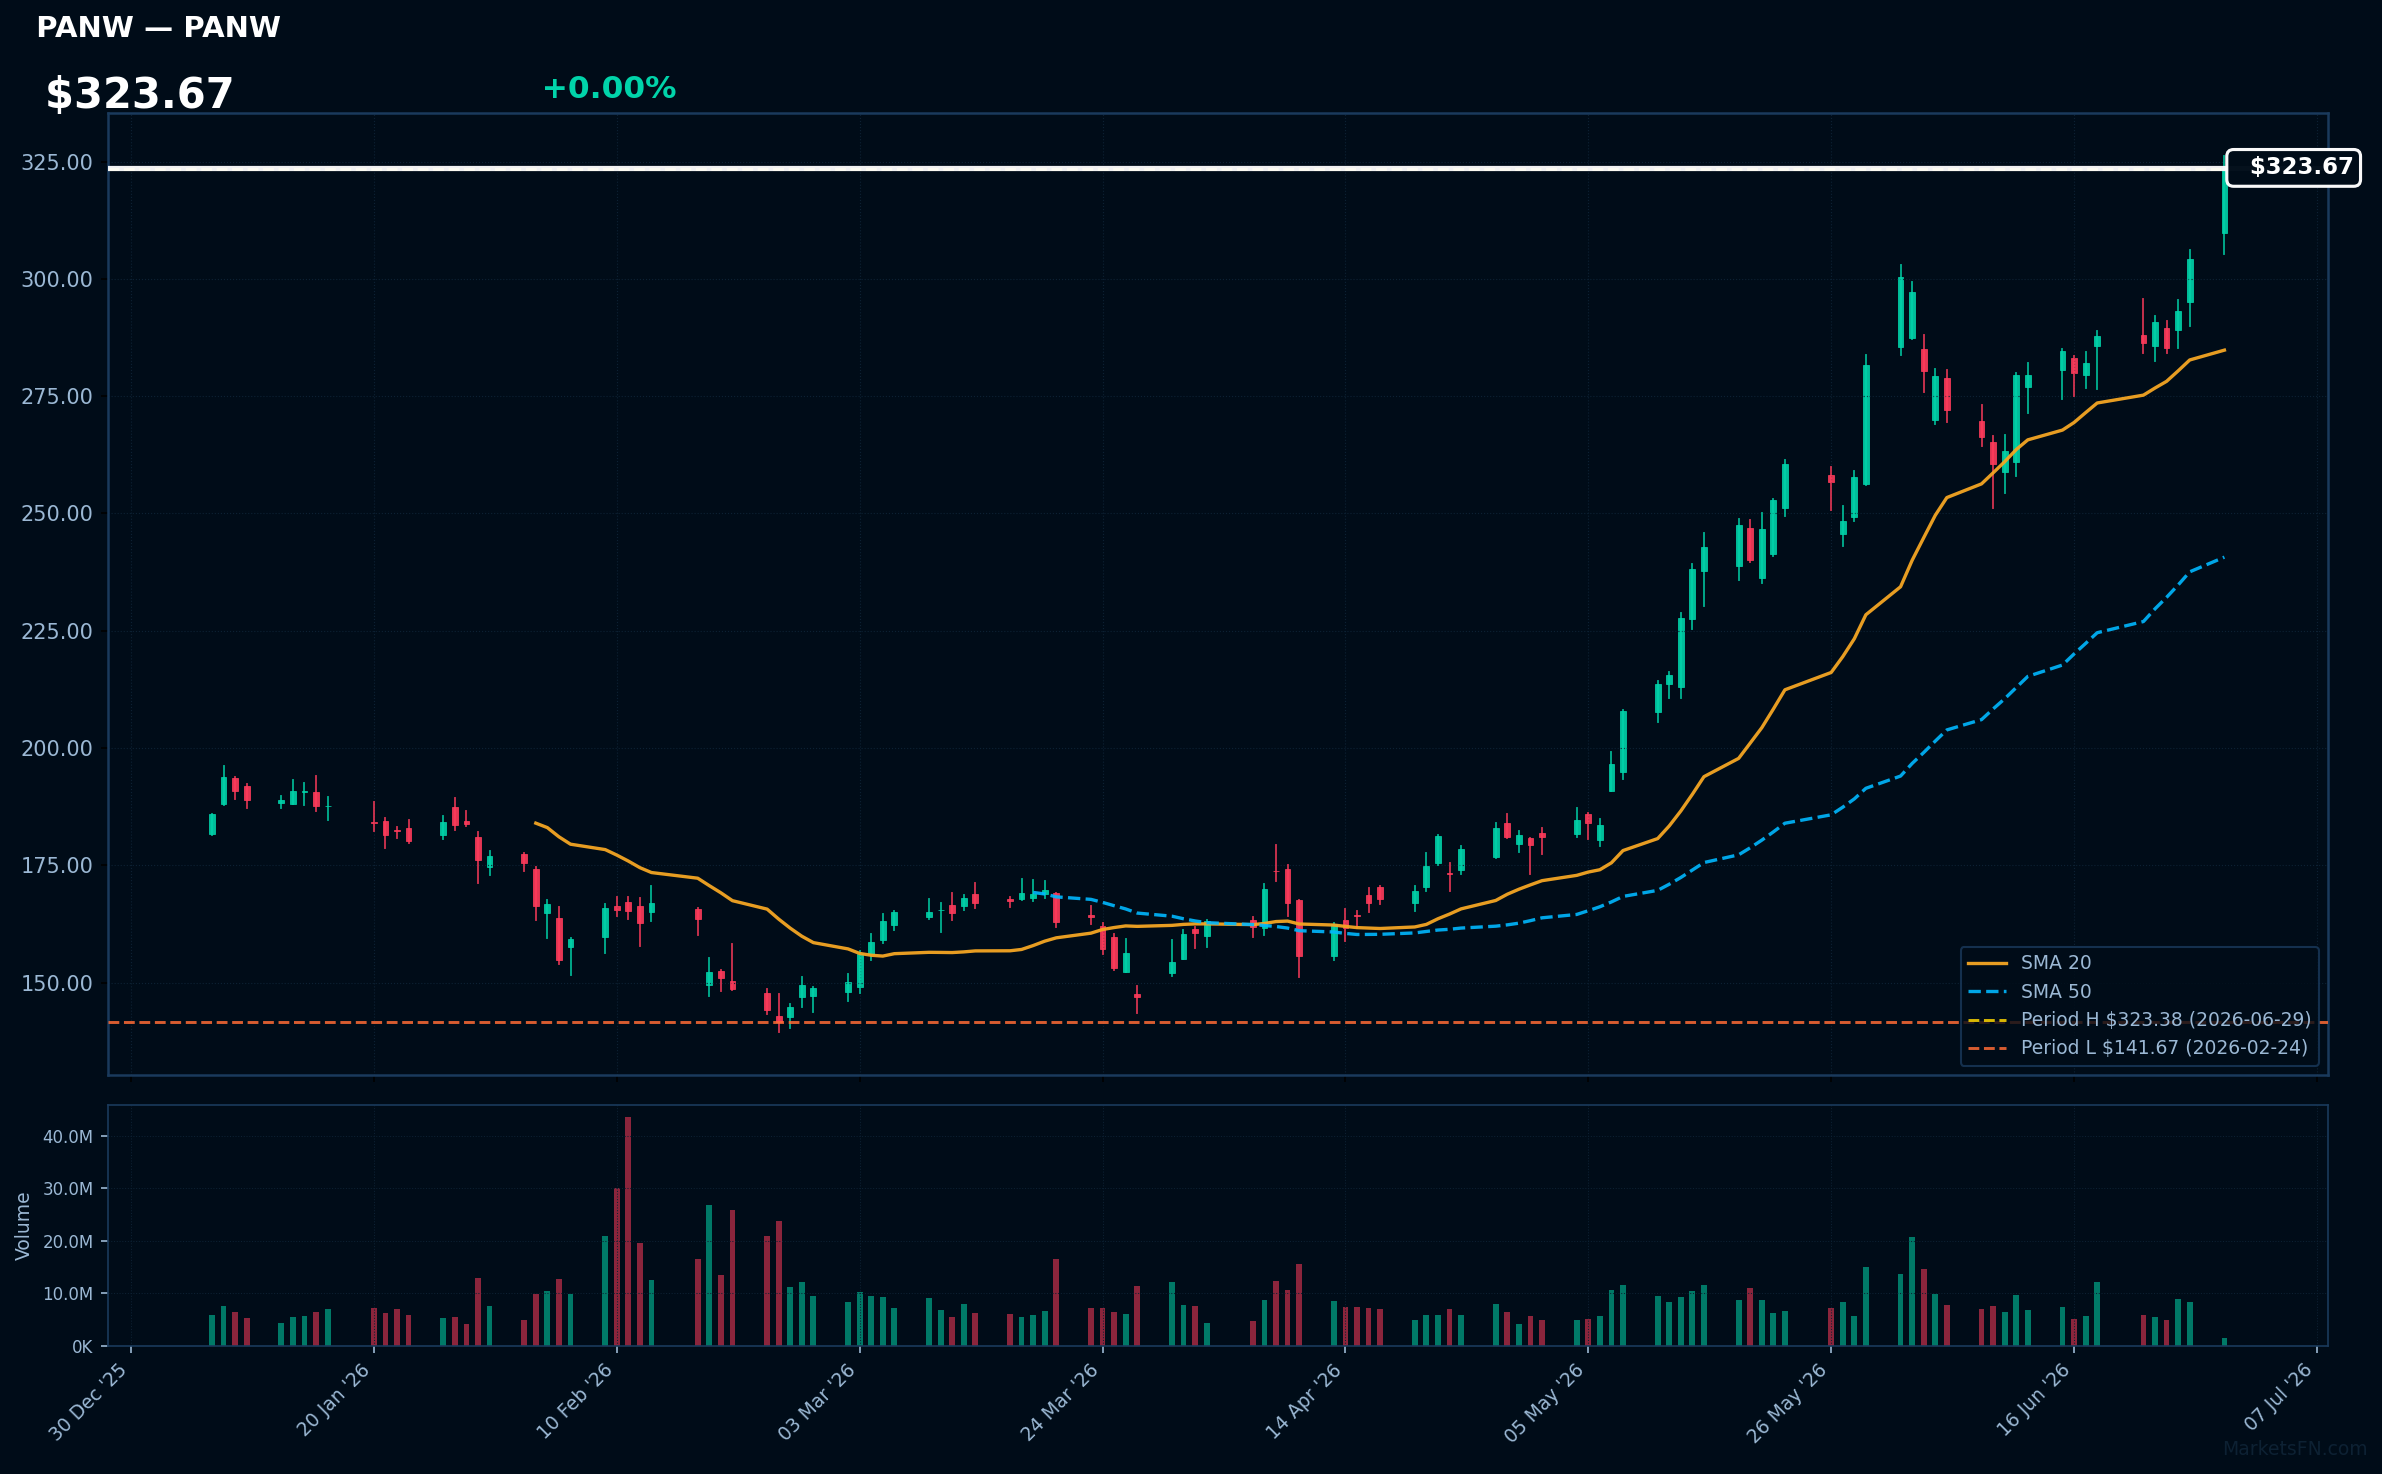
PANW | Palo Alto Networks Inc | Technology | Price Last: $323.38 | % Realized: +58.02% | RSI: 75.8 | % above MA200: +62.3% | Trend: Above MA20, MA50, MA200
Palo Alto Networks Inc is a cybersecurity company providing advanced threat prevention and security solutions. Investors should care due to its strong market position and growth prospects driven by increasing demand for robust cybersecurity measures.
Palo Alto Networks Inc is in a sustained uptrend with price at $323.67, RSI(14) at 75.8, and MA alignment: price > MA20 > MA50 > MA200. The stock is 0.0% below its 52-Week high, indicating potential breakout momentum.
Related headlines
- The Old-School Signal That Lit Up Palo Alto Networks Stock
- Is the Market Totally Wrong About PANW Stock?
- PANW vs CRWD vs AVGO: Morningstar Has A 'Top Pick' Trading At A 40% Discount After Earnings
- Palo Alto Networks and Deutsche Telekom Bring AI-Driven Security with Advanced Sovereignty Controls for European Regulated Industries
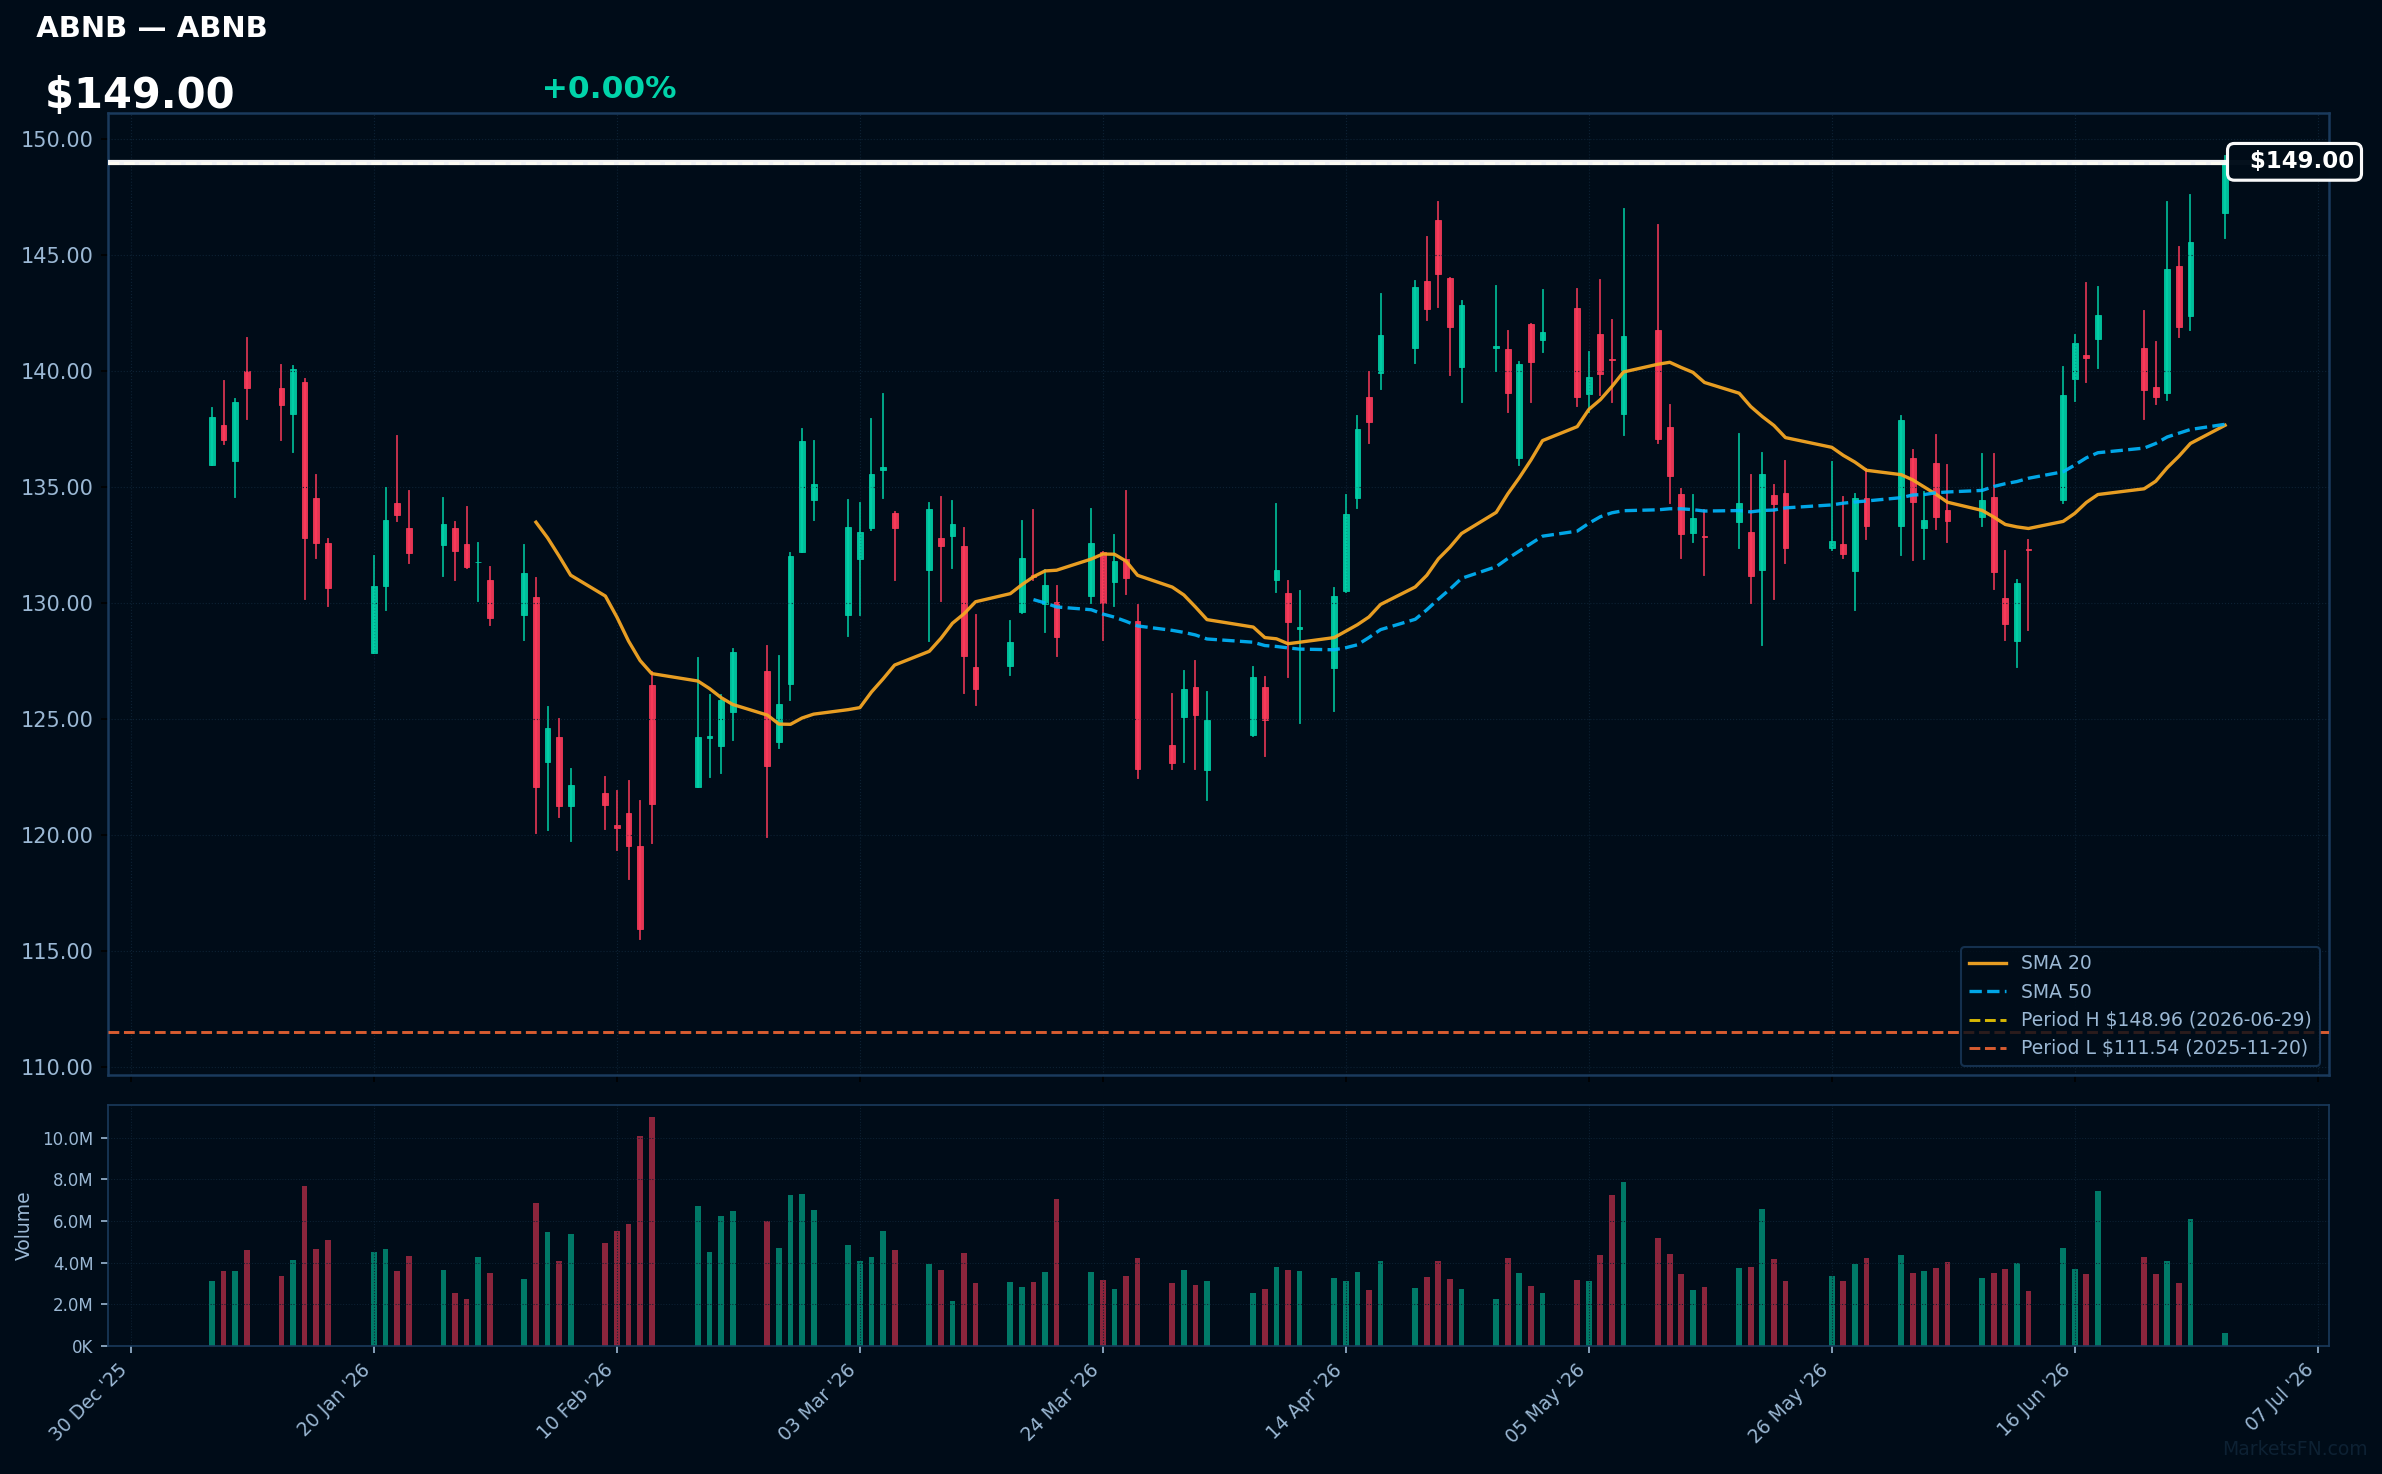
ABNB | Airbnb Inc | Consumer Cyclical | Price Last: $148.96 | % Realized: +12.55% | RSI: 66.7 | % above MA200: +14.8% | Trend: Above MA20, MA50, MA200
Airbnb Inc operates a platform connecting travelers with local hosts offering unique accommodations, experiences, and services. Investors should care about its growth potential in the short-term rental market and its ability to maintain market share amidst increasing competition.
Airbnb Inc is near a potential breakout level, with its price 0.0% below its 52-Week high. The RSI(14) is 66.7, indicating rising momentum. The stock is above MA20, MA50, and MA200, showing mixed signals, but overall suggesting a strong uptrend.
Related headlines
- Airbnb is once again using machine learning to block party bookings over July 4 weekend
- Airbnb hotels and experiences push could add $1.8B to 2030 revenue, Jefferies estimates
- Airbnbs Brian Chesky Passed on OpenAI Now Hes Quietly Building His Own AI Company
- Airbnb CEO Brian Chesky Plans to Start a New AI Company
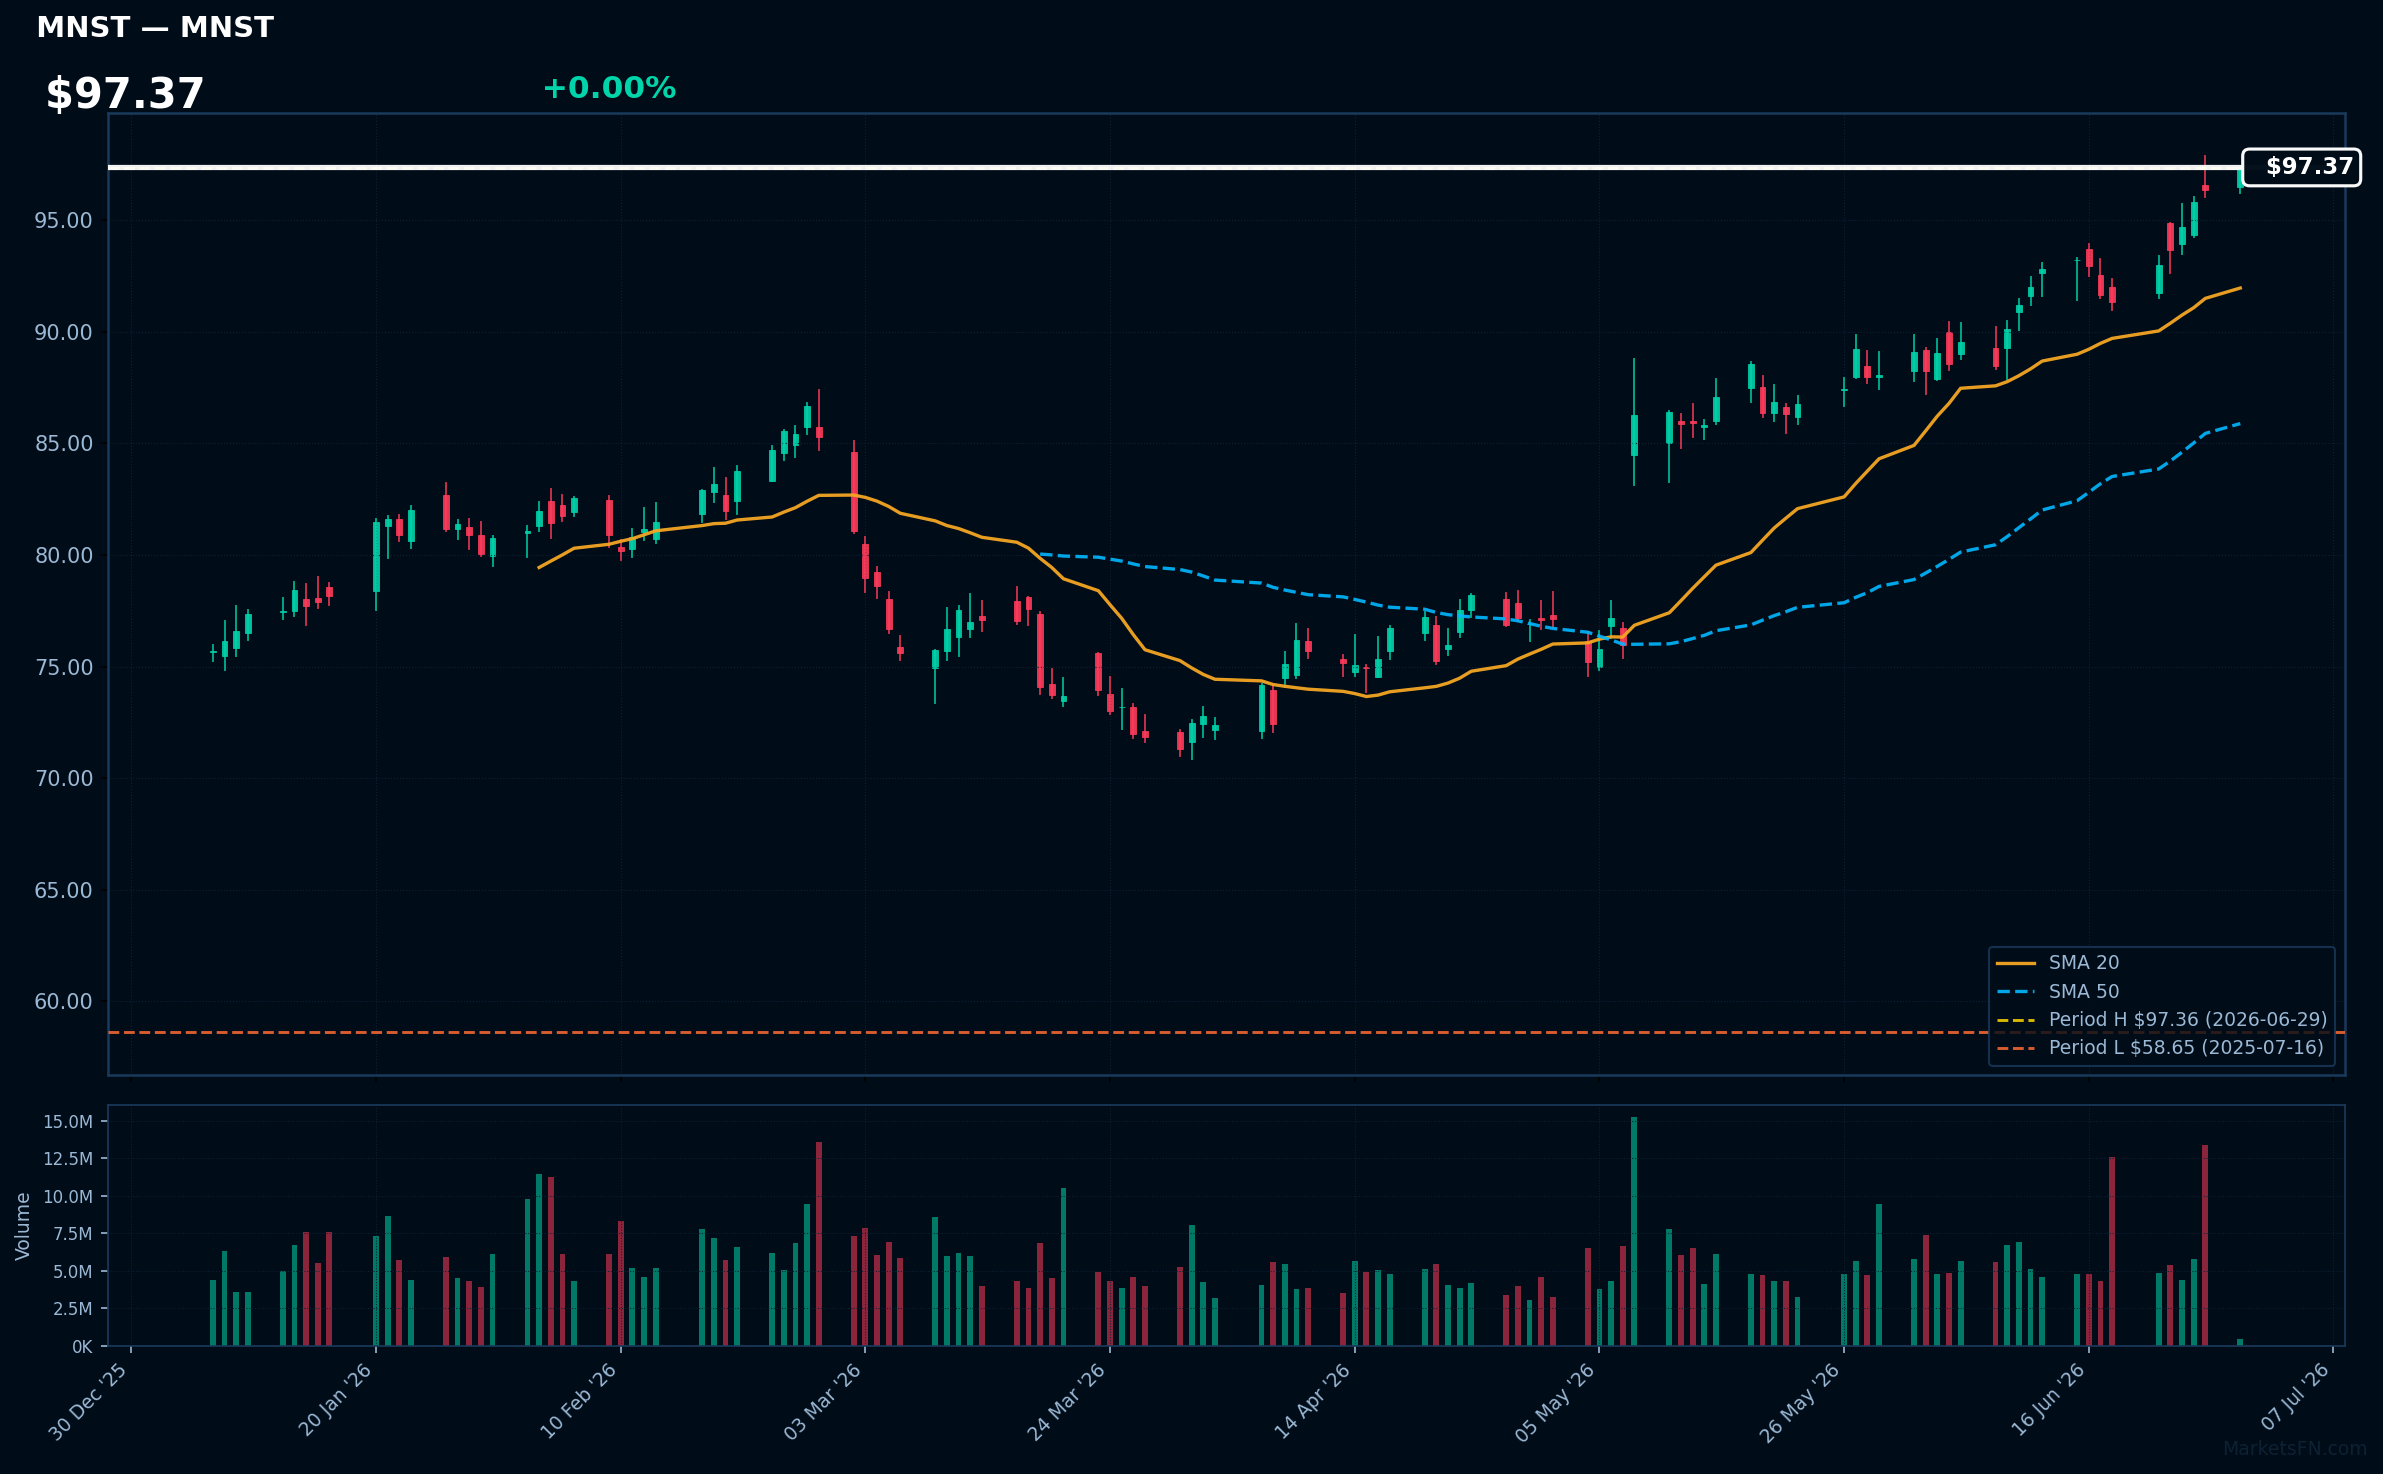
MNST | Monster Beverage Corp | Consumer Defensive | Price Last: $97.36 | % Realized: +55.43% | RSI: 76.6 | % above MA200: +26.3% | Trend: Above MA20, MA50, MA200
Monster Beverage Corp is a leading energy drink manufacturer with popular brands like Monster Energy. Investors should care due to its strong brand portfolio and growth potential in the energy drink market.
The stock shows bullish technicals with RSI(14) at 76.6, price > MA20 > MA50 > MA200, and is 0.0% below its 52-Week high, indicating strong momentum and a potential breakout.
Related headlines
- Massive Gap-Up Propels This Monster To Record High. These Clues Point To More Gains Ahead.
- Monster Beverage Announces Participation in dbAccess Global Consumer Conference 2026
- Dow Jones Leader Amazon, AI Stock Quanta, Monster Beverage In Or Near Buy Zones
- See How Institutions Drive Monster Beverage Shares Higher
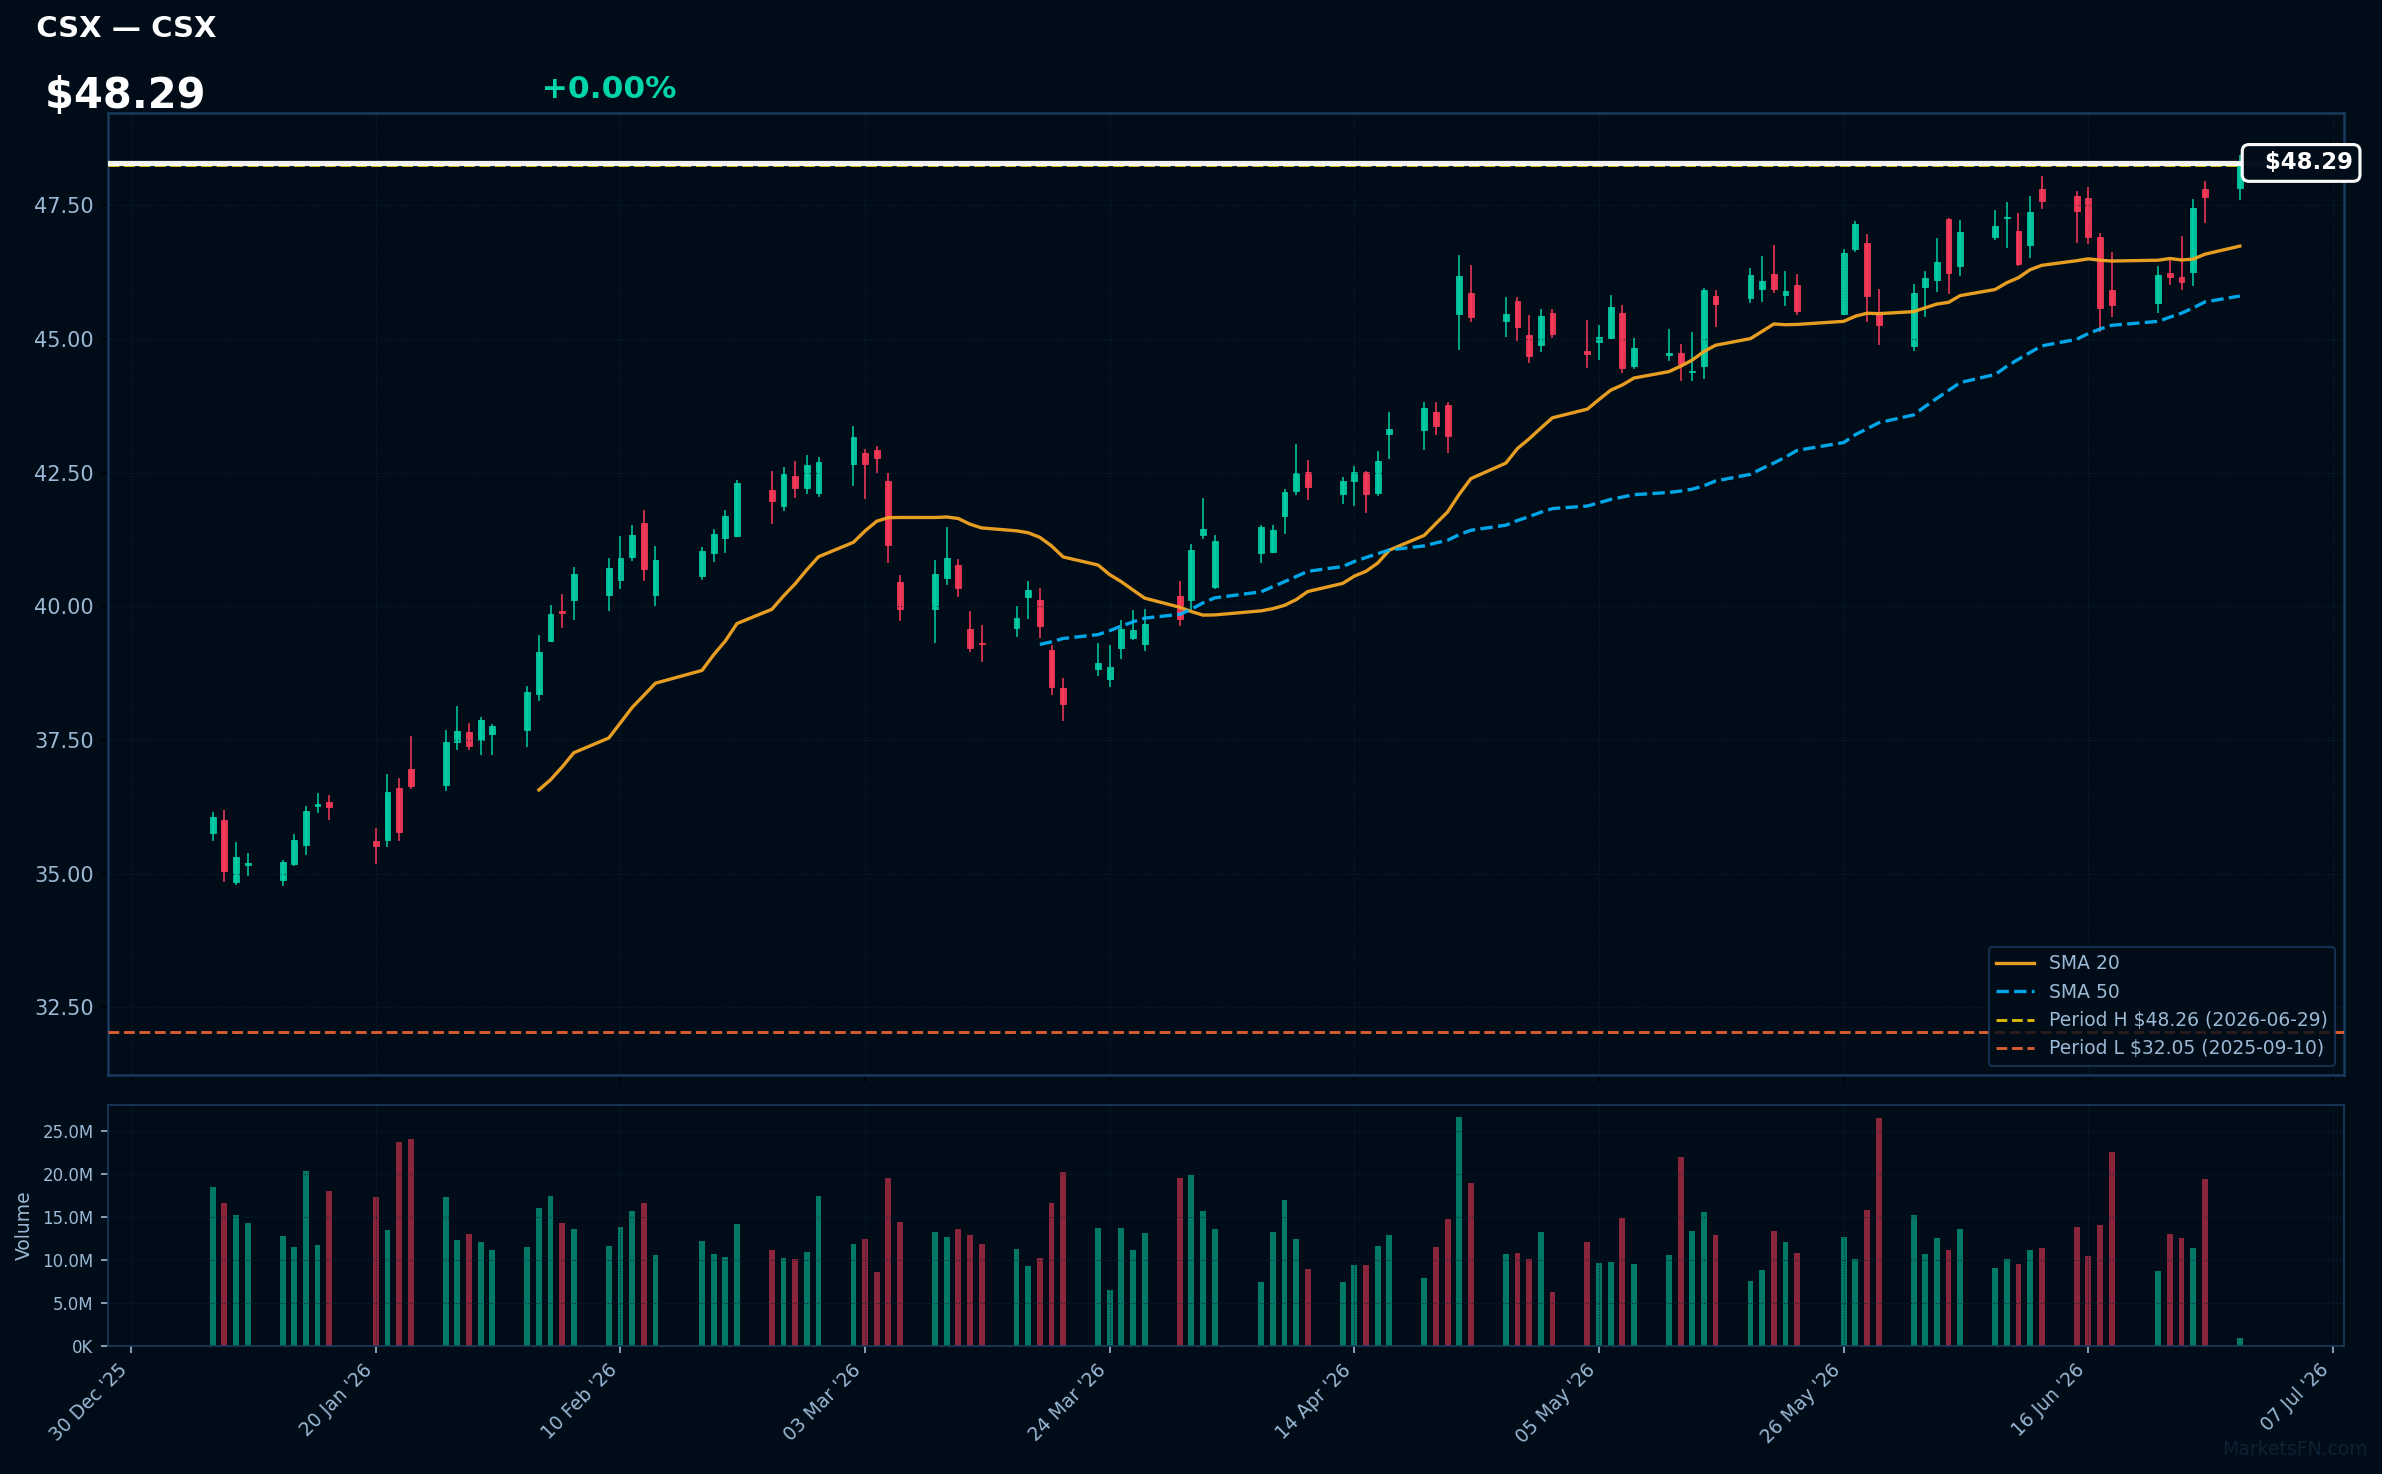
CSX | CSX Corp | Industrials | Price Last: $48.26 | % Realized: +47.90% | RSI: 64.2 | % above MA200: +22.1% | Trend: Above MA20, MA50, MA200
CSX Corp operates a rail network transporting coal, intermodal, and automotive goods, making it a critical link in North American supply chains; investors should care due to its exposure to industrial production and potential economic growth.
CSX Corp's technicals indicate momentum, with RSI(14) at 64.2 and a bullish MA alignment (price > MA20 > MA50 > MA200); it's near a breakout level, 0.0% below its 52-Week high, after a 47.9% 52-Week return.
Related headlines
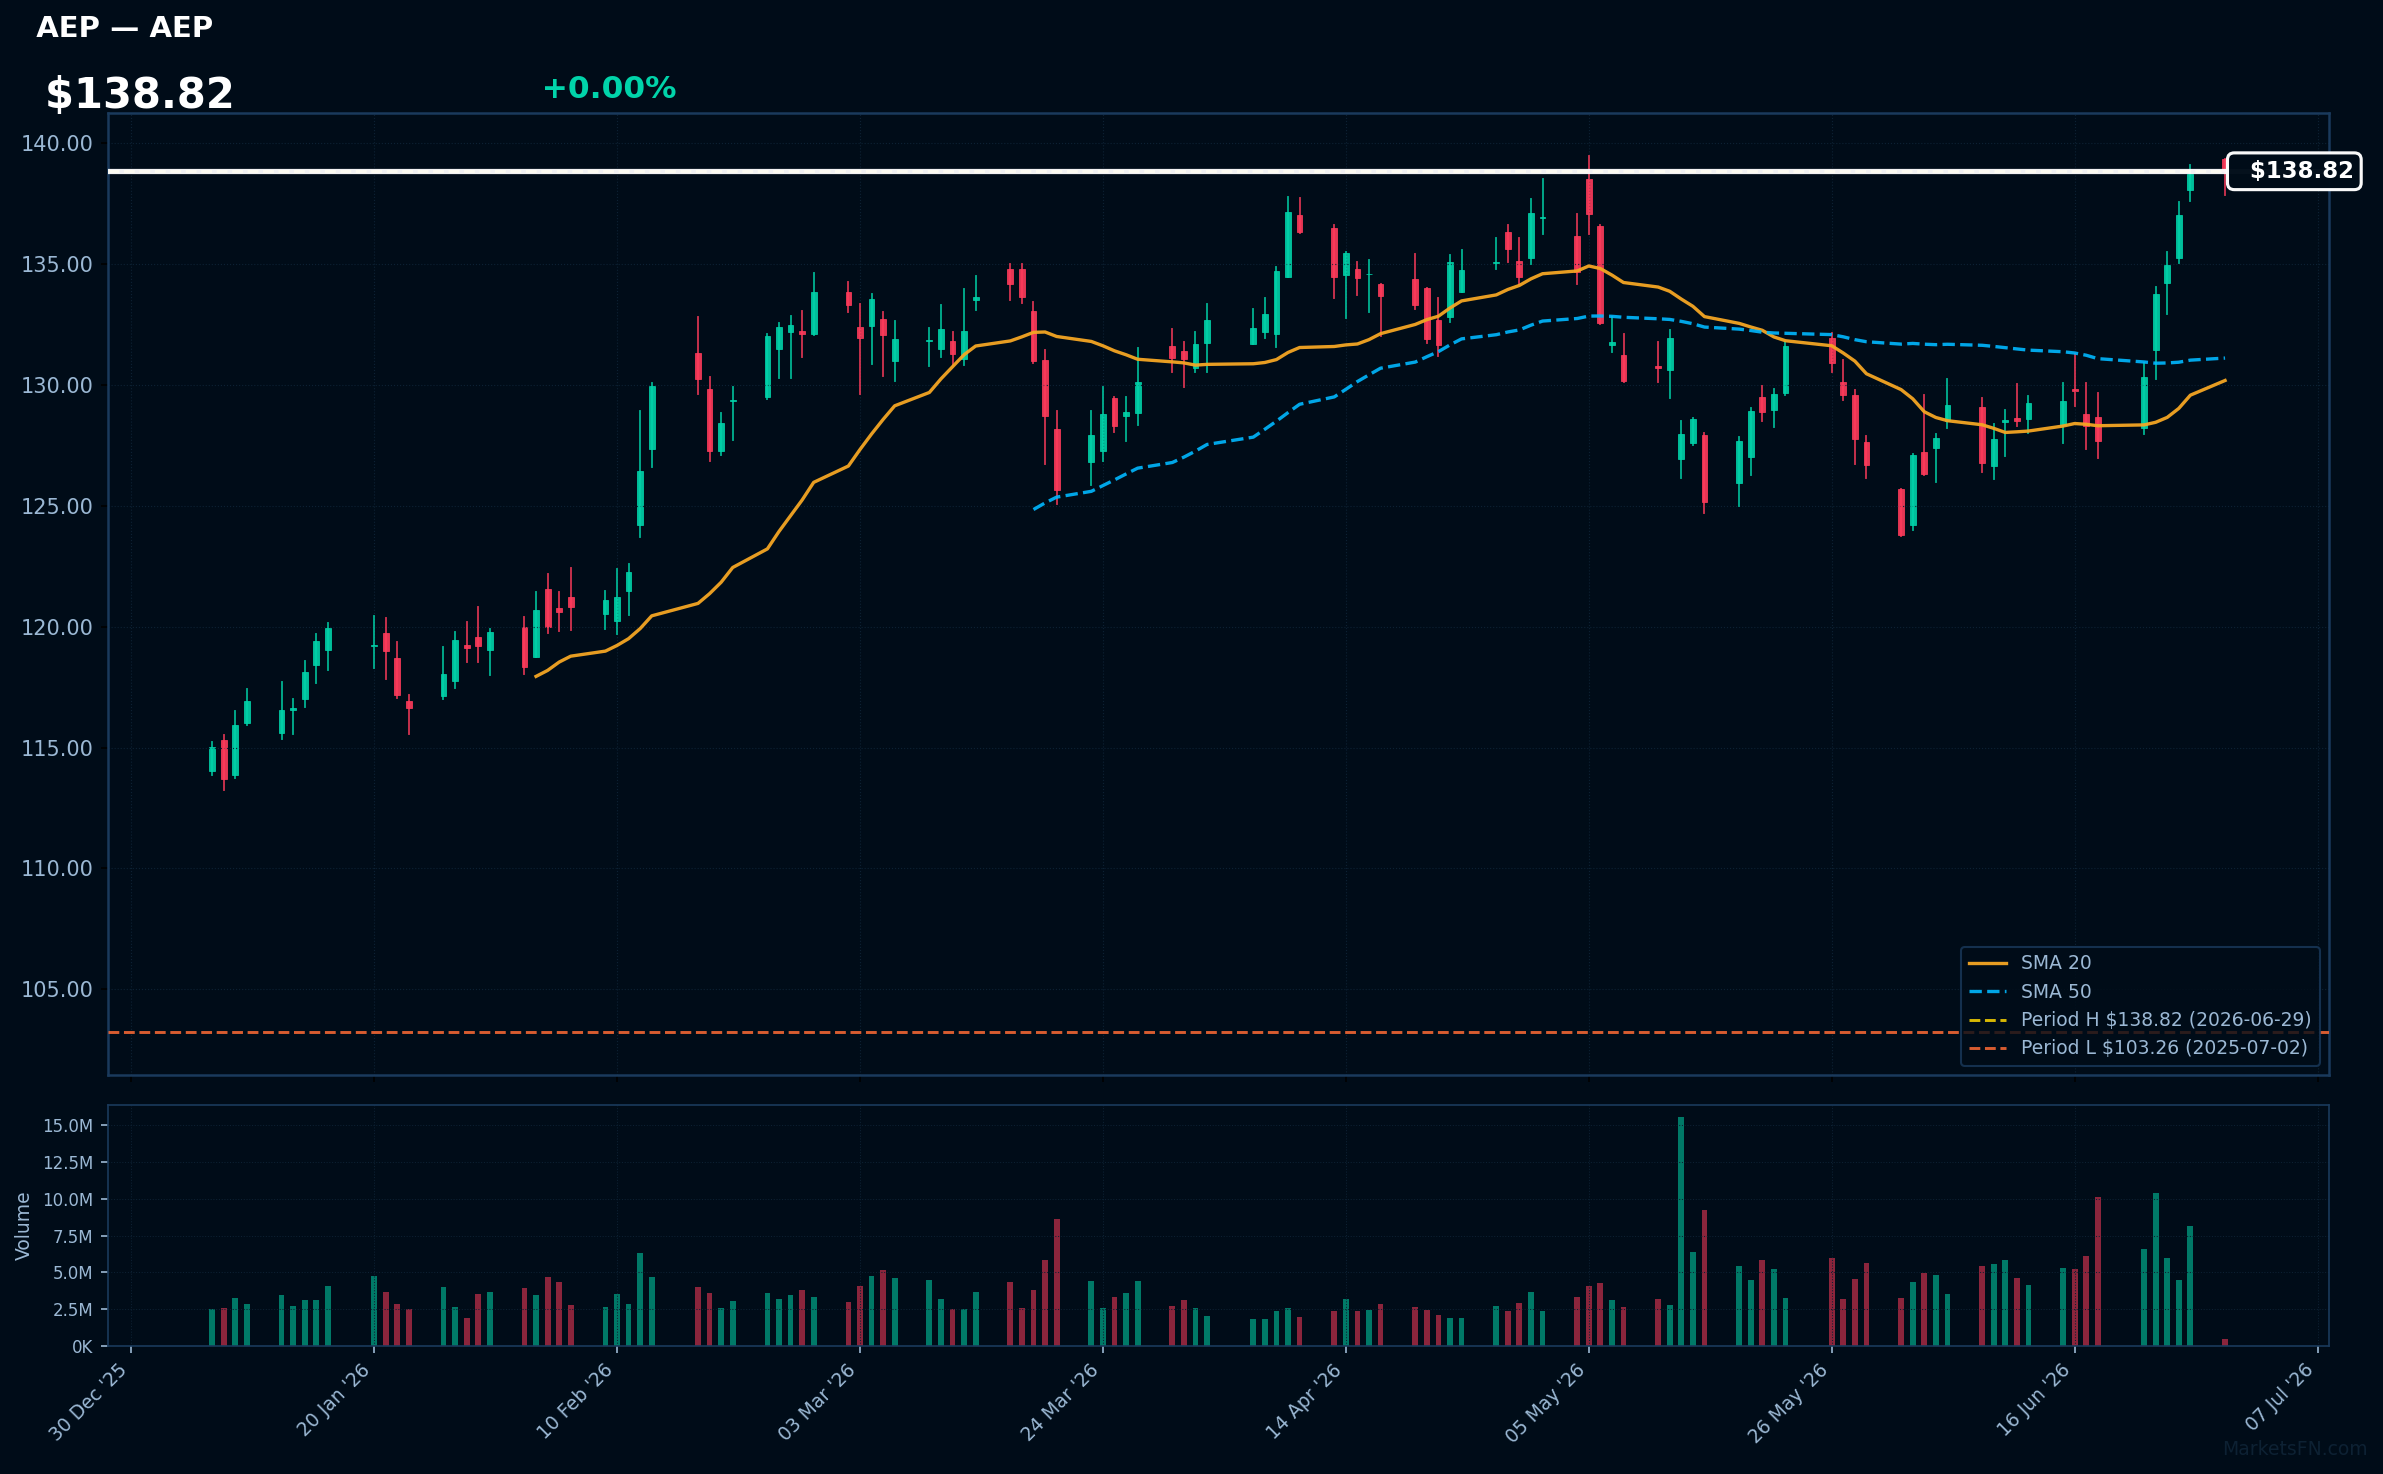
AEP | American Electric Power Company Inc | Utilities | Price Last: $138.82 | % Realized: +33.79% | RSI: 70.2 | % above MA200: +12.2% | Trend: Above MA20, MA50, MA200
American Electric Power Company Inc (AEP) is a leading electricity utility firm, generating and distributing electricity across various states. Investors care due to its stable revenue streams and potential for growth in the energy transition, driven by its significant asset base and regulated returns.
AEP's technicals indicate strong momentum: RSI(14) is 70.2, nearing overbought territory, with the price above MA20, MA50, and MA200. The stock is 0.0% below its 52-Week high, suggesting a potential breakout level, and has delivered a 33.8% return over the 52-Week period.
Related headlines
📉 Nearest to 52-Week Low
Sectors represented: Technology (2), Communication Services (1), Industrials (1), Healthcare (1)
| Ticker | Company | Sector | Price Last | % Realized | 52-Week Low Date | RSI | % above MA200 | Trend |
|---|---|---|---|---|---|---|---|---|
| TMUS | T-Mobile US Inc | Communication Services | $174.59 | -26.73% | 2026-06-29 | 36.1 | -14.9% | Below MA20, MA50, MA200 |
| CPRT | Copart, Inc | Industrials | $29.50 | -39.87% | 2026-06-22 | 38.9 | -22.0% | Below MA20, MA50, MA200 |
| ISRG | Intuitive Surgical Inc | Healthcare | $411.10 | -24.35% | 2026-06-25 | 46.2 | -15.9% | Above MA20 · Below MA50, MA200 |
| CTSH | Cognizant Technology Solutions Corp | Technology | $40.27 | -48.39% | 2026-06-25 | 26.1 | -39.6% | Below MA20, MA50, MA200 |
| MSTR | Strategy Inc | Technology | $84.87 | -79.00% | 2026-06-26 | 25.9 | -54.1% | Below MA20, MA50, MA200 |
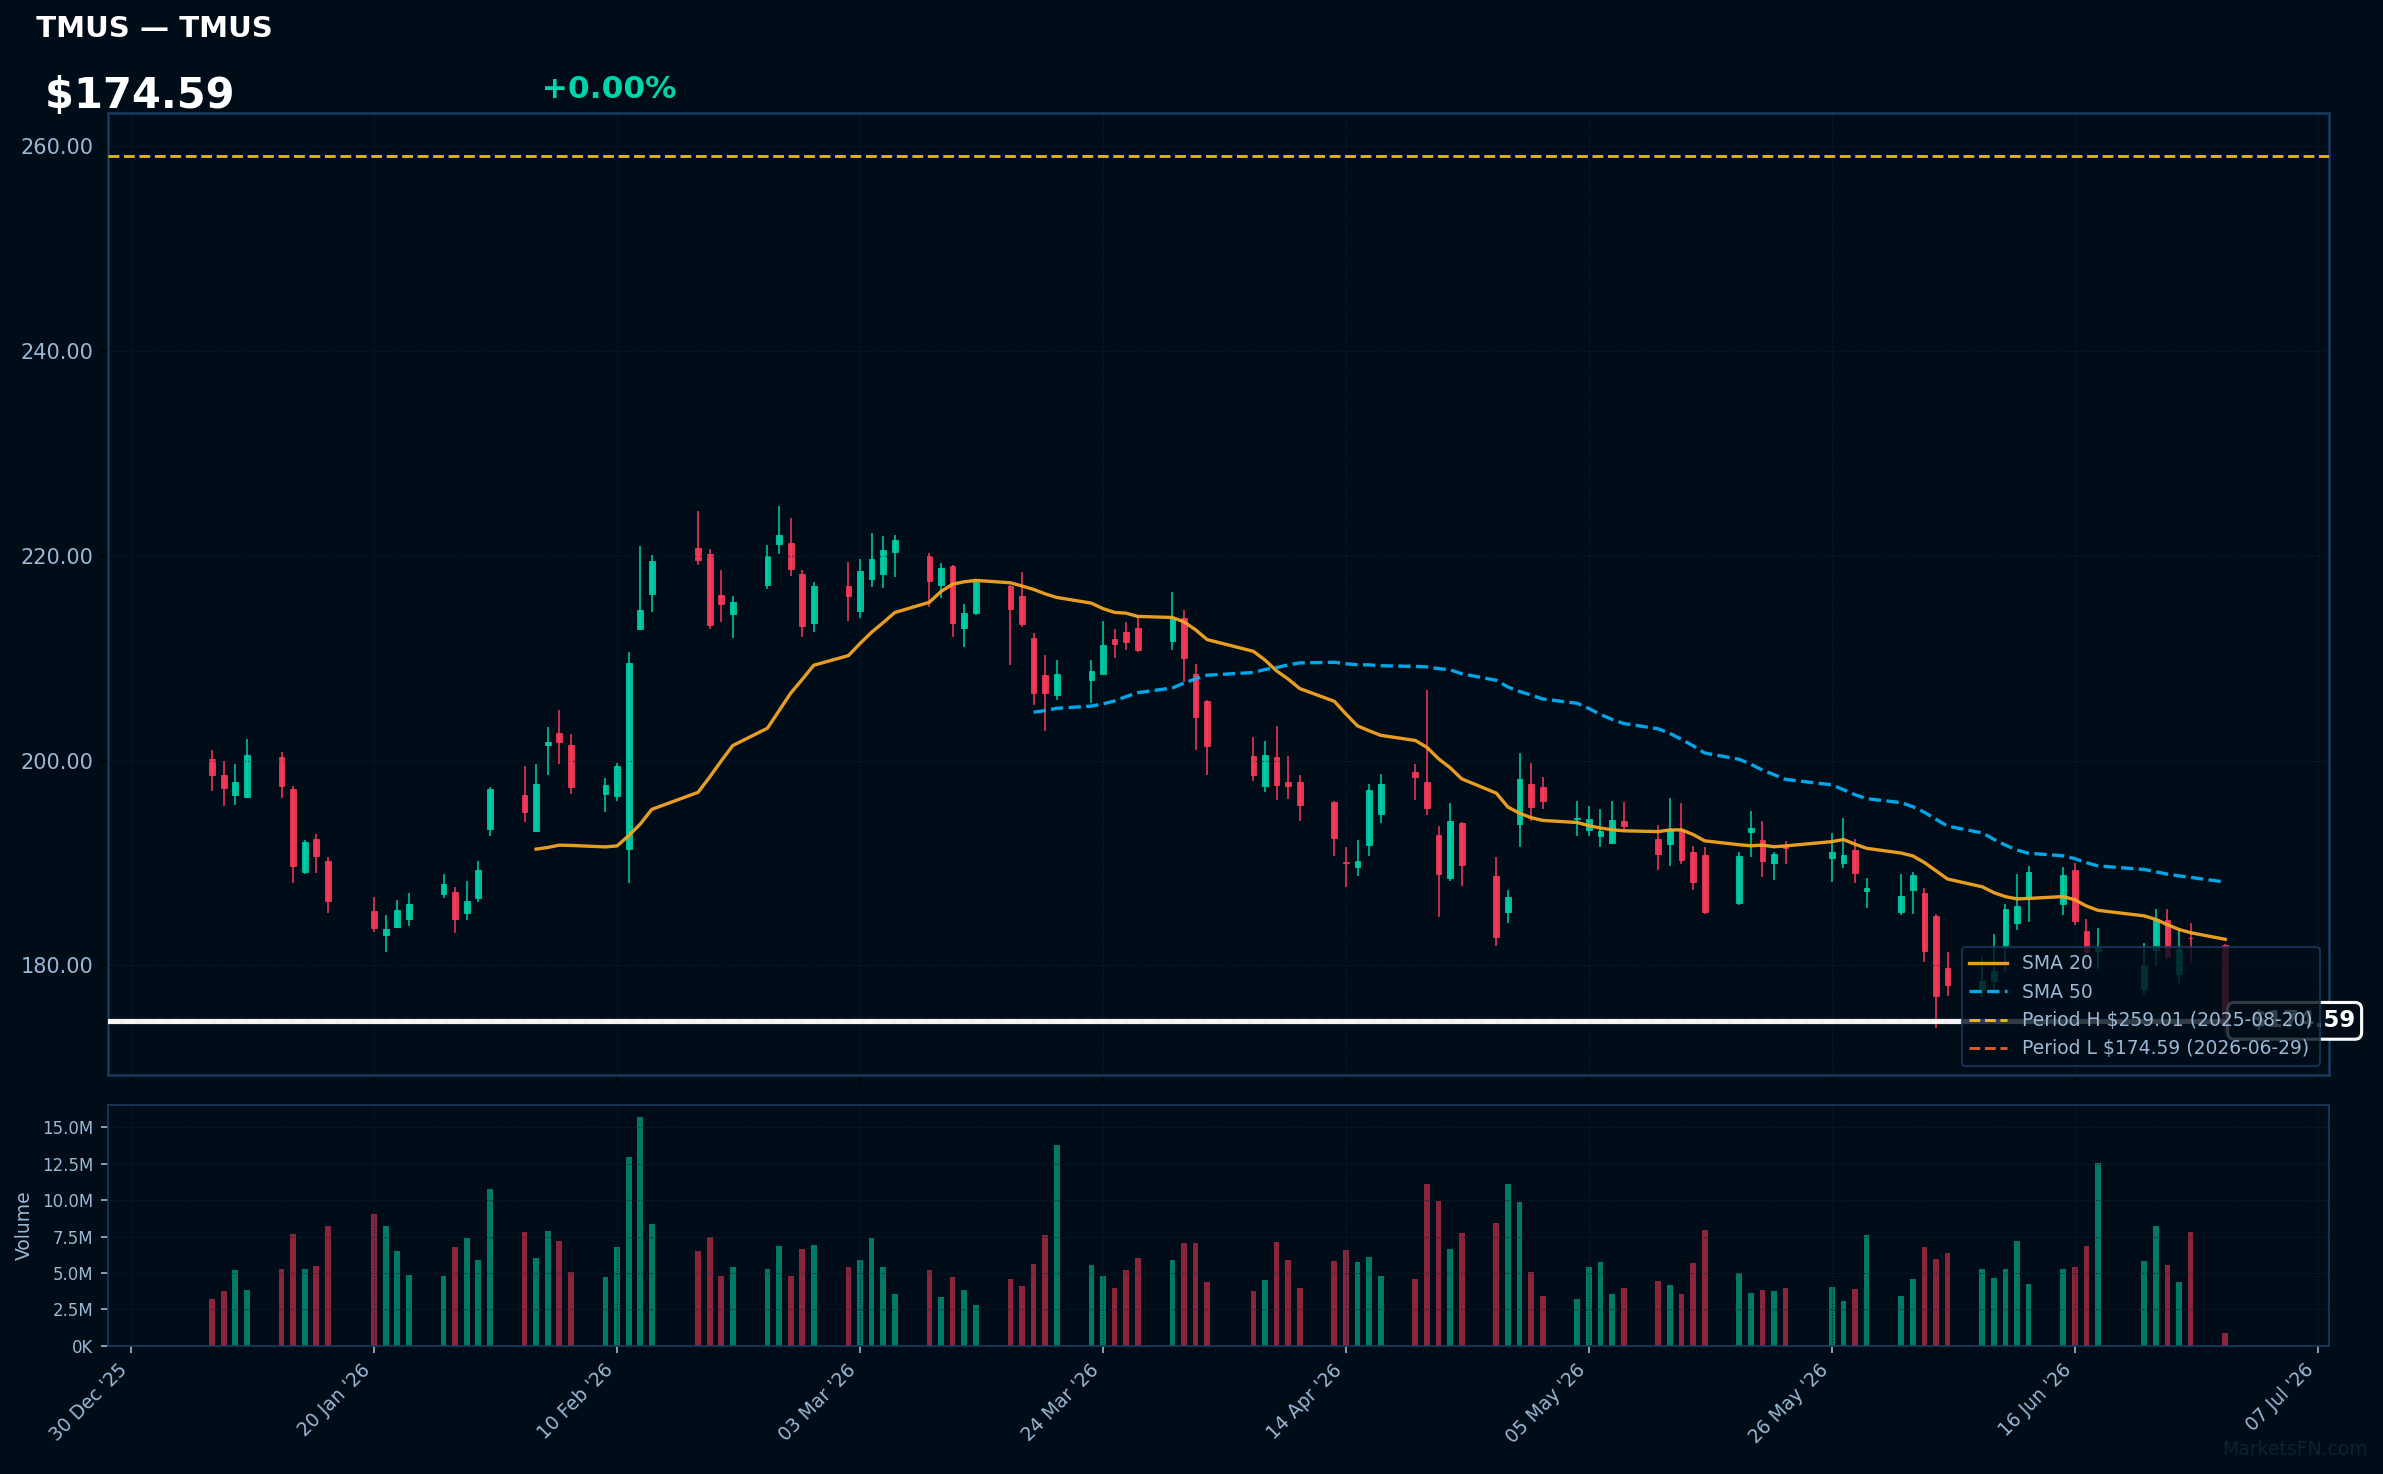
TMUS | T-Mobile US Inc | Communication Services | Price Last: $174.59 | % Realized: -26.73% | RSI: 36.1 | % above MA200: -14.9% | Trend: Below MA20, MA50, MA200
T-Mobile US Inc is a wireless network operator providing mobile services. Investors should care about its competitive positioning, 5G rollout, and subscriber growth, as these factors drive revenue and profitability in the telecom sector.
T-Mobile US Inc is in a sustained downtrend with price ($174.59) below MA20, MA50, and MA200. RSI(14) is 36.1, near oversold territory. The stock is at its 52-Week low, indicating potential support testing, with a 52-Week return of -26.7%.
Related headlines
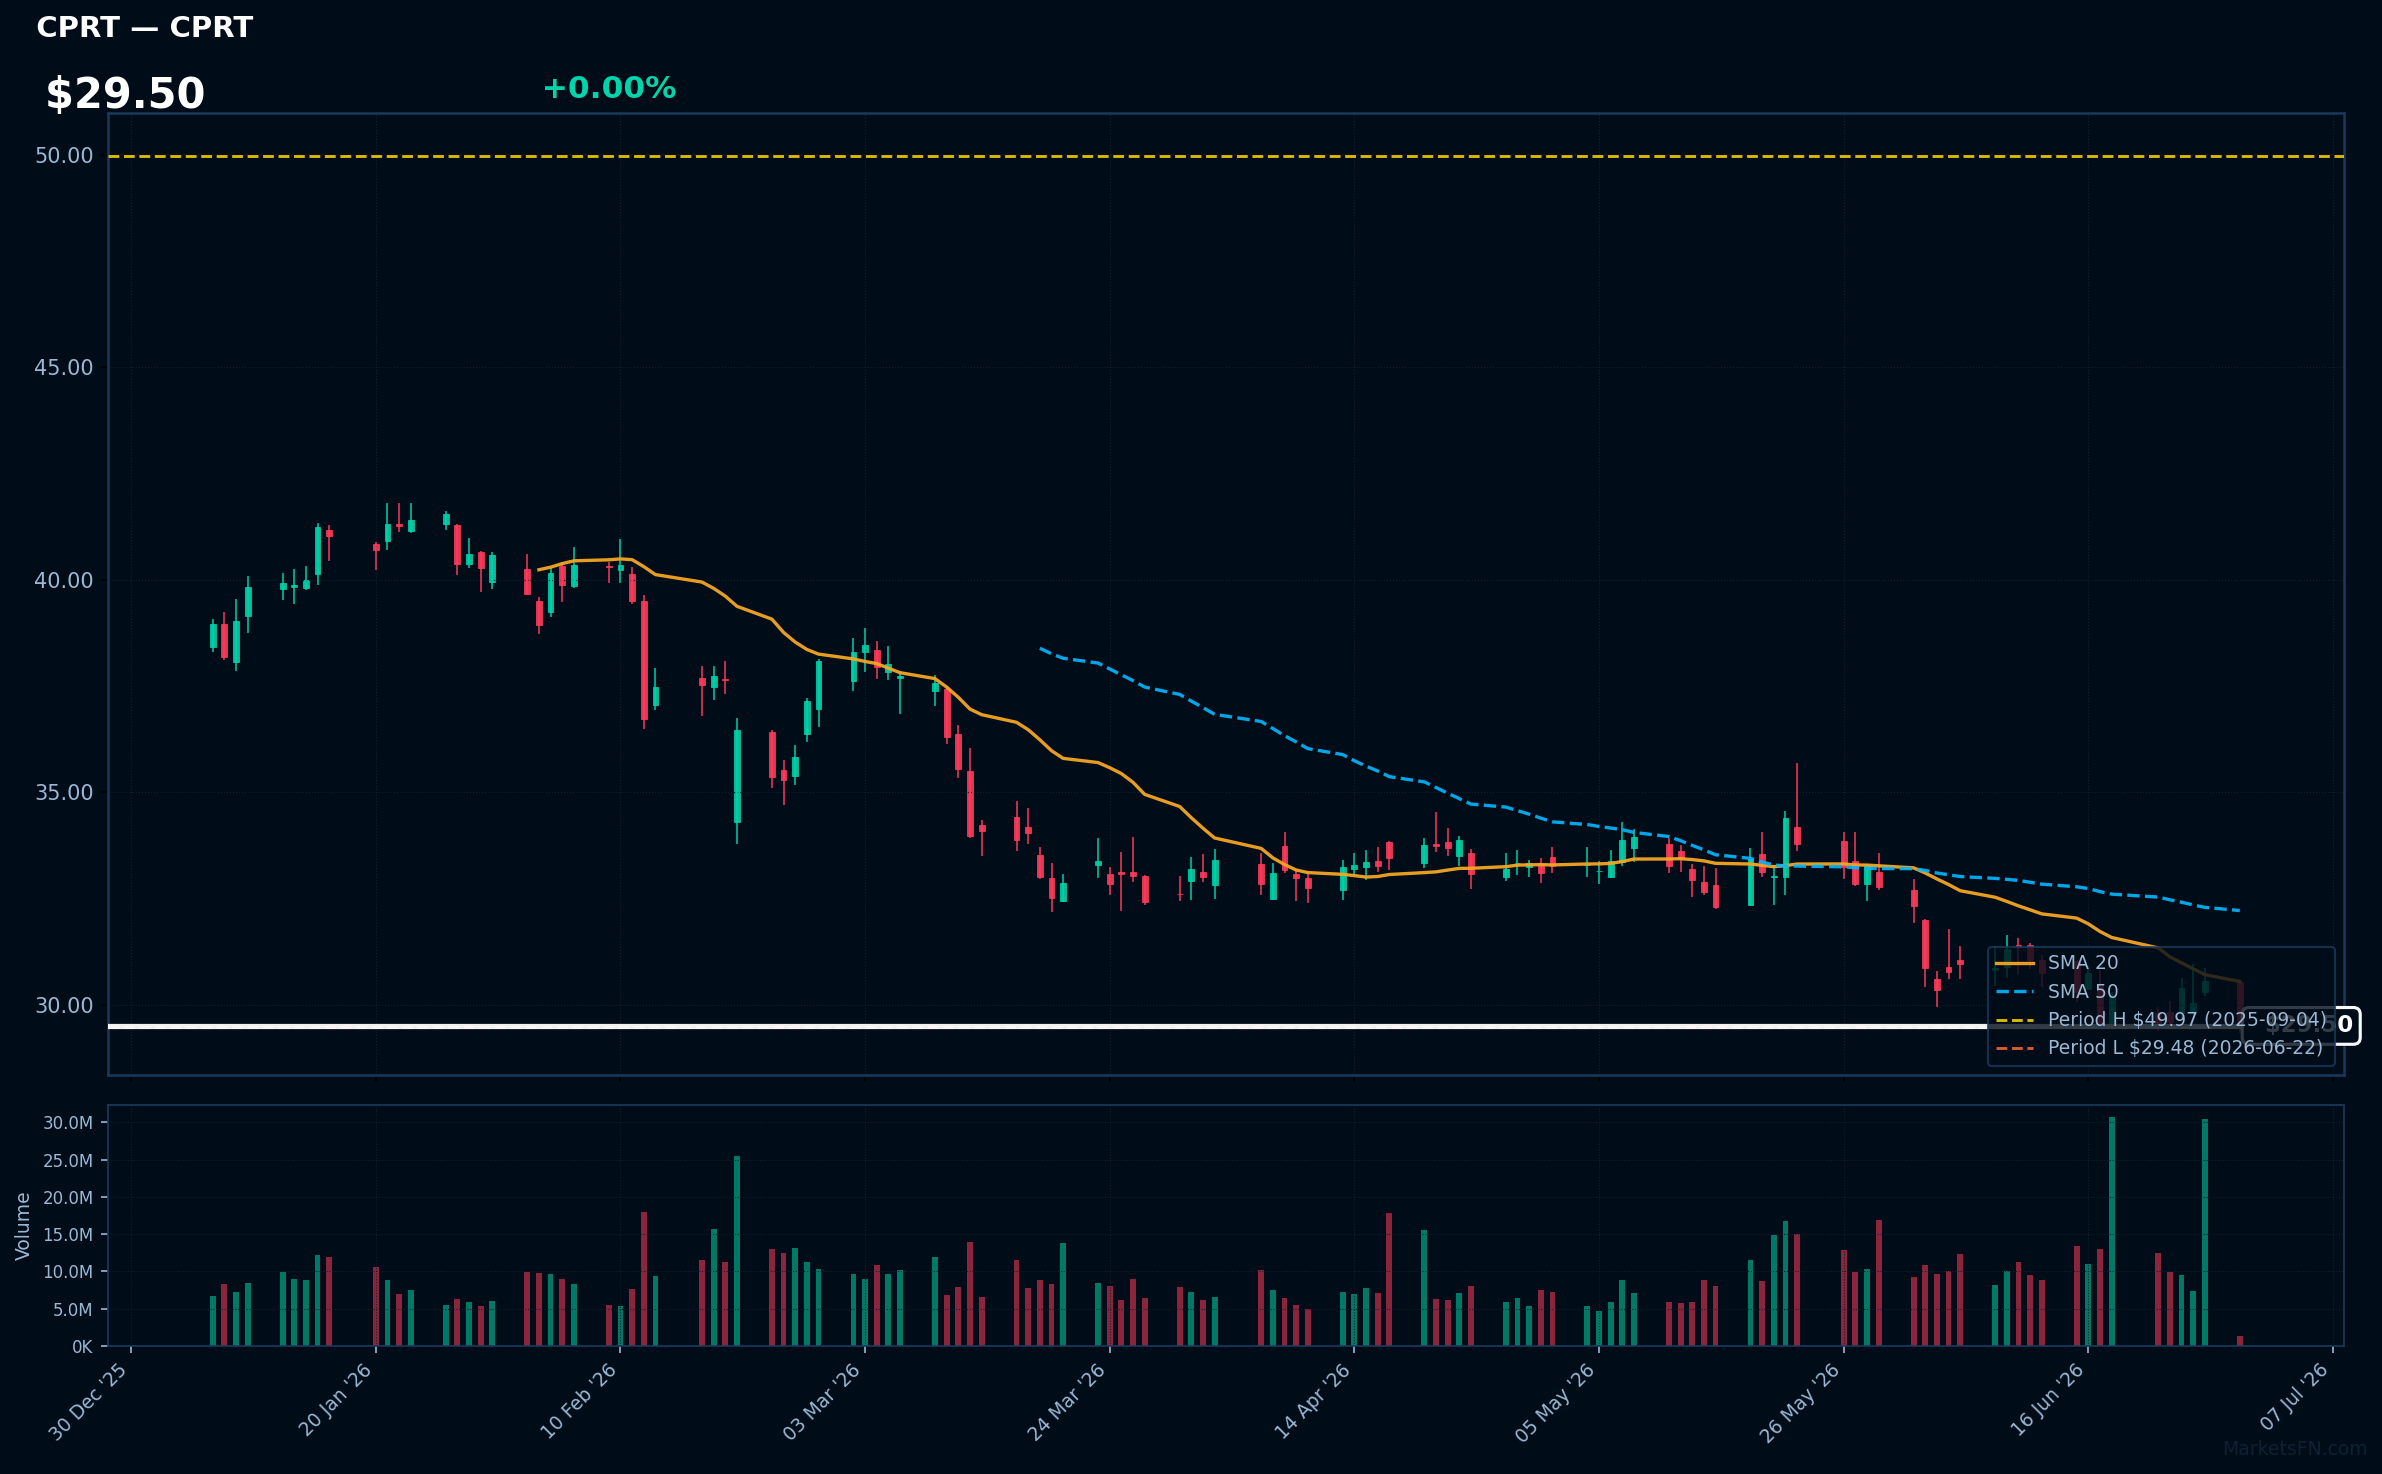
CPRT | Copart, Inc | Industrials | Price Last: $29.50 | % Realized: -39.87% | RSI: 38.9 | % above MA200: -22.0% | Trend: Below MA20, MA50, MA200
Copart, Inc (CPRT) operates online vehicle auction platforms, providing salvage and used vehicle sales. Investors should care due to its dominant market position and exposure to the automotive industry's supply chain and insurance claims.
CPRT's technicals indicate a sustained downtrend with price ($29.50) below MA20, MA50, and MA200. RSI(14) at 38.9 suggests bearish momentum, and being 0.1% above its 52-Week low signals testing major support, potentially a warning sign.
Related headlines
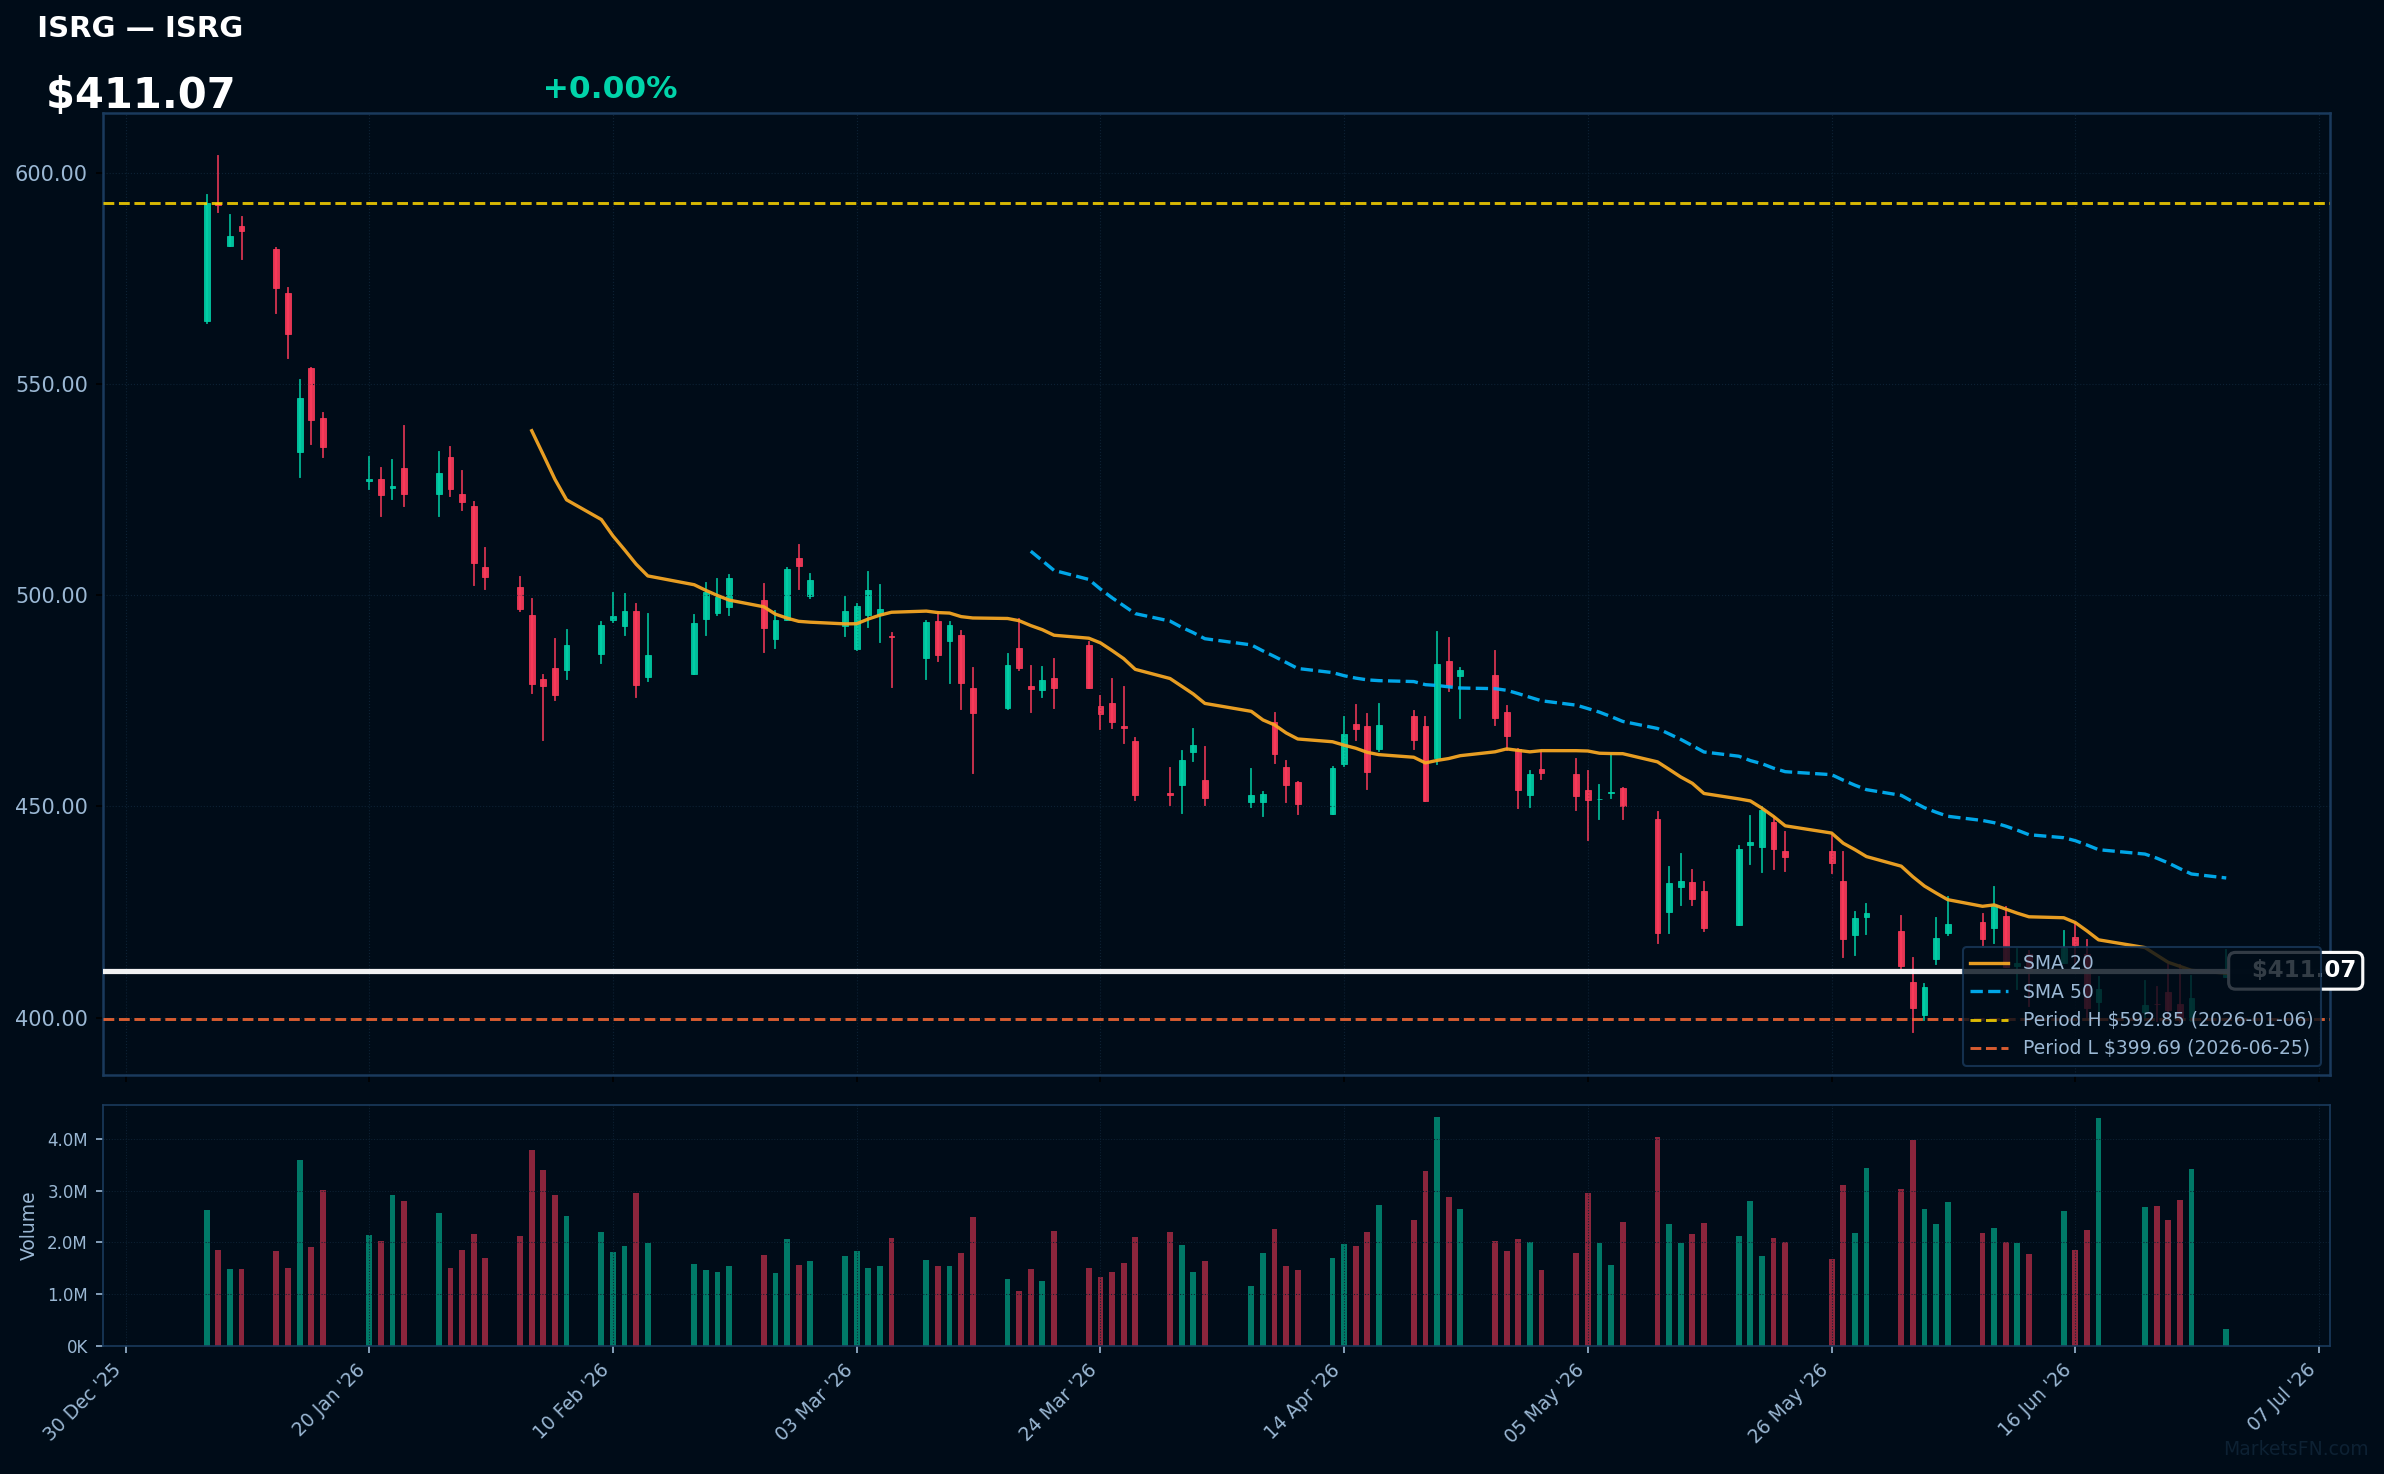
ISRG | Intuitive Surgical Inc | Healthcare | Price Last: $411.10 | % Realized: -24.35% | RSI: 46.2 | % above MA200: -15.9% | Trend: Above MA20 · Below MA50, MA200
Intuitive Surgical Inc develops and markets robotic-assisted surgical systems, enabling minimally invasive procedures. Investors should care about its innovative technology and market penetration, as it disrupts traditional surgical practices and creates new growth opportunities.
ISRG's technicals show mixed signals: RSI(14) at 46.2 indicates neutral momentum, while price above MA20 but below MA50/MA200 suggests uncertain trend. Being only 2.9% above its 52-Week low, it tests major support, potentially warning of further downside, with a -24.3% 52-Week return.
Related headlines
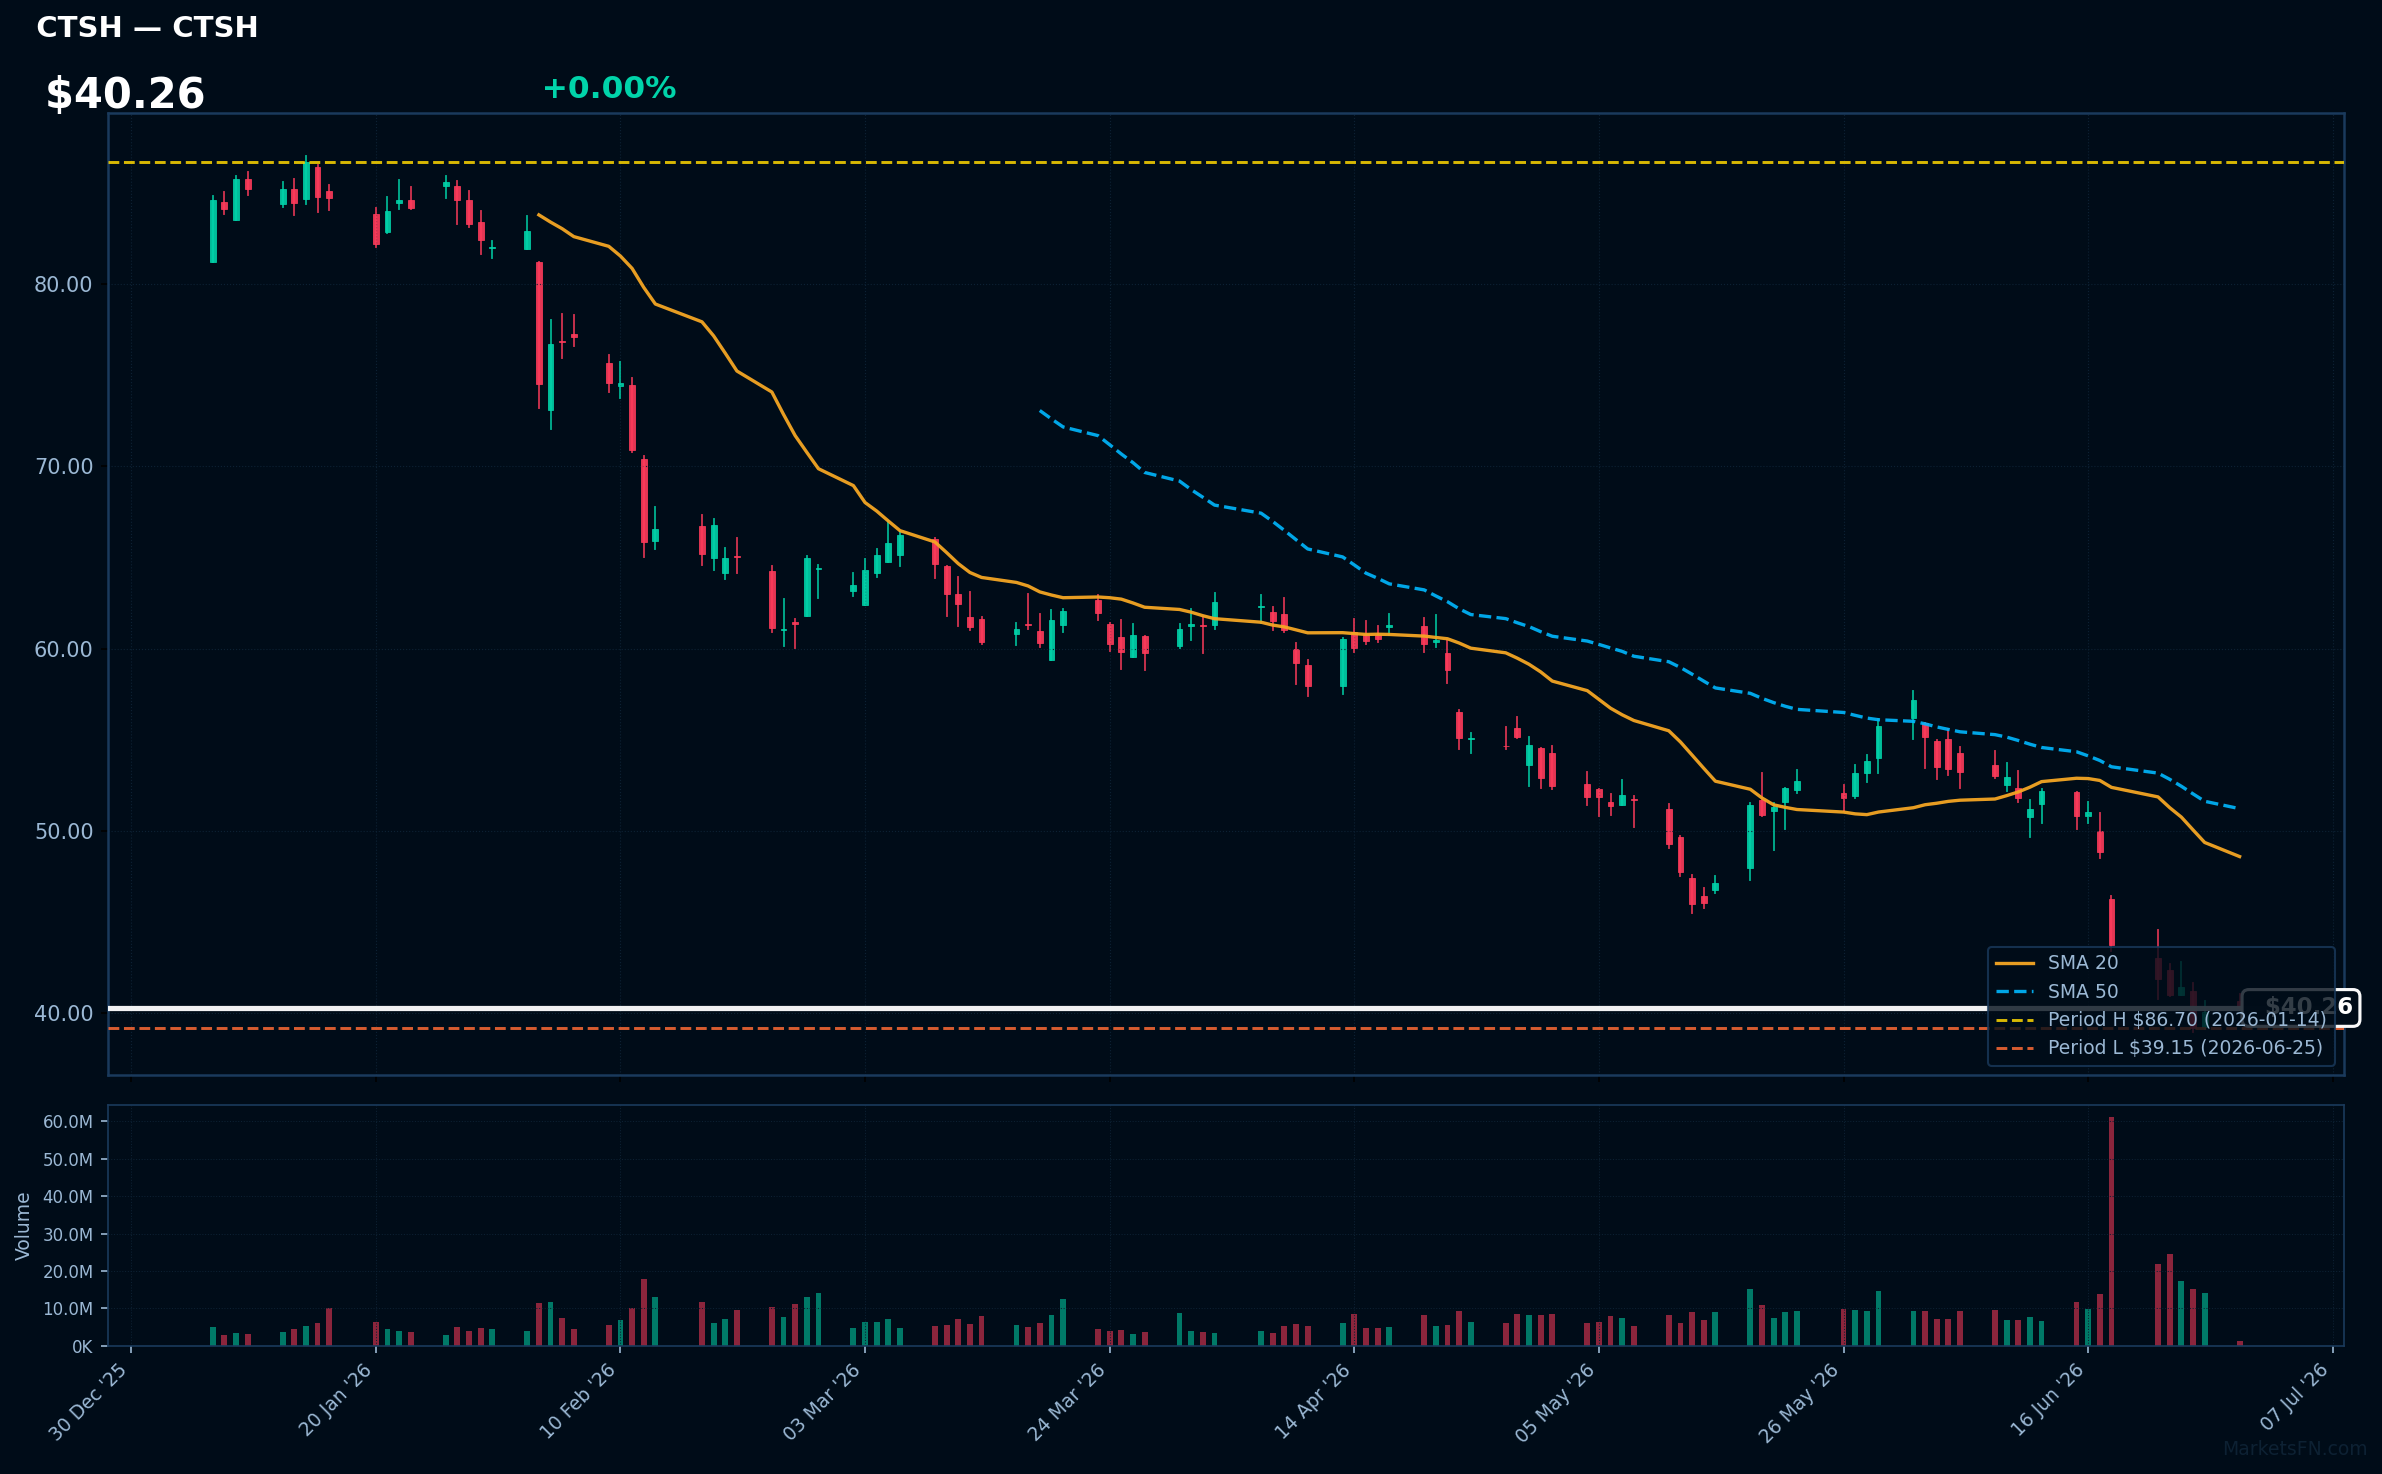
CTSH | Cognizant Technology Solutions Corp | Technology | Price Last: $40.27 | % Realized: -48.39% | RSI: 26.1 | % above MA200: -39.6% | Trend: Below MA20, MA50, MA200
Cognizant Technology Solutions Corp is an IT services company providing digital transformation, consulting, and technology services. Investors should care about its ability to adapt to changing tech landscapes and client needs, impacting its revenue growth and profitability.
Cognizant's technical situation is bearish, with RSI(14) at 26.1, indicating oversold conditions. The MA alignment (price < MA20 < MA50 < MA200) confirms a sustained downtrend. The stock is 2.9% above its 52-Week low, testing major support, and has returned -48.4% over the 52-Week period.
Related headlines
- Cognizant Technology Solutions Corp. stock underperforms Thursday when compared to competitors
- Cognizant expands cross-platform agentic AI with new ServiceNow AI Agent interoperability
- Entry-Level Work Remains Essential: 94% of HR Leaders Expect AI to Create New Entry-Level Roles, Cognizant and Pearson Study Reveals
- Berenberg downgrades Cognizant as AI risks cloud IT services outlook
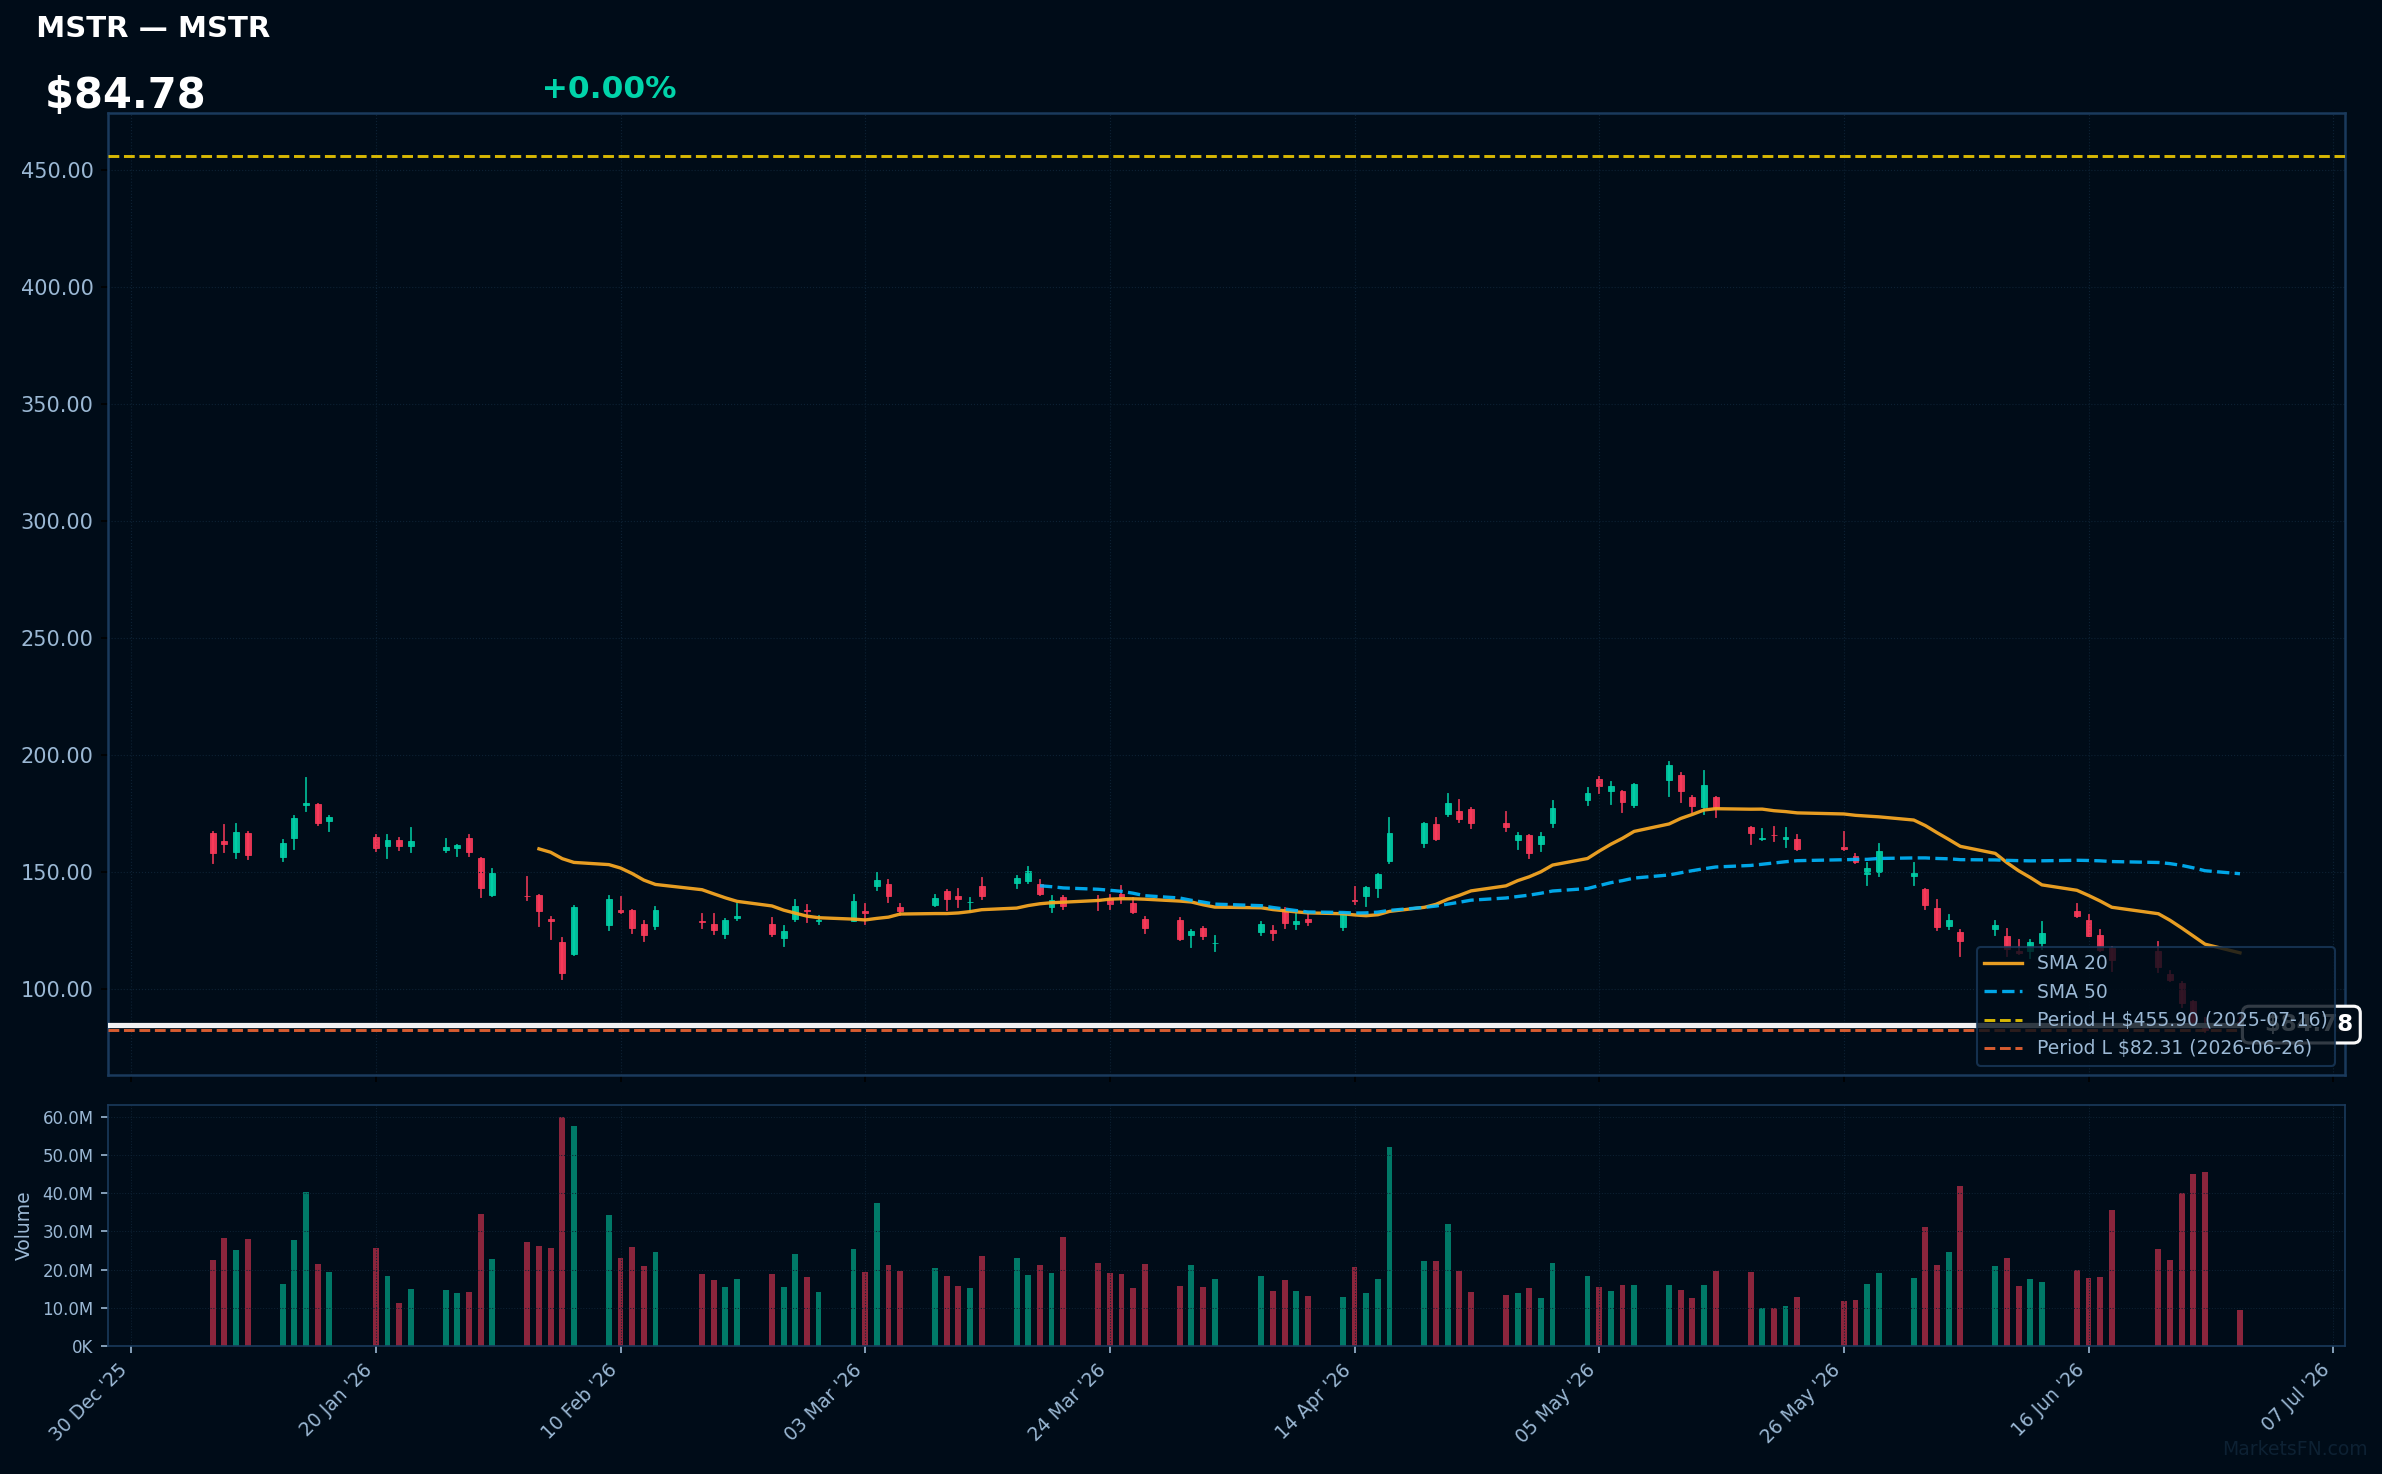
MSTR | Strategy Inc | Technology | Price Last: $84.87 | % Realized: -79.00% | RSI: 25.9 | % above MA200: -54.1% | Trend: Below MA20, MA50, MA200
Strategy Inc is a business that focuses on developing and implementing software and strategies related to bitcoin and other digital assets; investors should care because its performance is closely tied to the company's ability to navigate the volatile cryptocurrency market.
The stock is in a sustained downtrend with a bearish MA alignment: price ($84.78) < MA20 < MA50 < MA200, RSI(14) at 25.9, indicating oversold conditions. The stock is 3.1% above its 52-Week low, testing major support, and has returned -79.0% over the 52-Week period.
Related headlines
Market Commentary
The Nasdaq 100 stocks listed near 52-week extremes indicate a significant price movement, with some stocks reaching new highs and others hovering near their lows. Stocks like PANW, ABNB, and MNST are at their 52-week highs, while TMUS and CPRT are just above their 52-week lows.
The technology sector is driving these price levels, with companies like ISRG and CTSH showing resilience near their 52-week lows. Macro themes such as investor sentiment and market trends are likely influencing these price movements. The presence of stocks like AEP and CSX near 52-week highs suggests that the broader market is also playing a role.
Key levels to watch include the 52-week highs and lows for these stocks. A breakout above the 52-week high for stocks like PANW and ABNB could signal further upside, while a breakdown below the 52-week low for stocks like TMUS and CPRT could indicate additional downside. Catalysts to watch include earnings reports and industry trends that could impact these stocks' price movements.
Methodology: All 101 Nasdaq 100 constituents screened. 52-week high = highest daily close over the past 252 trading days (approx. 1 year). 52-week low = lowest daily close over the same period. Distance = (current price / extreme − 1) × 100. Technical indicators computed on up to 1 year of daily OHLCV data.
Disclaimer: For informational purposes only. Not investment advice. Past performance is not indicative of future results.