S&P 500 52-Week Highs & Lows Radar: Lilly(Eli) & (LLY), T-Mobile US (TMUS) and more
· Stocks · MarketsFN Team
S&P 500 52-Week Highs & Lows Radar: Lilly(Eli) & (LLY), T-Mobile US (TMUS) and more
Screening all 503 S&P 500 constituents for stocks nearest to their 52-week high and their 52-week low. Data as of June 29, 2026. % Realized = 52-week total return.
Legend: RSI > 70 = overbought · RSI < 30 = oversold · Green % Realized = positive 52W return · Red = negative.
📈 Nearest to 52-Week High
Sectors represented: Healthcare (2), Industrials (1), Technology (1), Financial (1)
| Ticker | Company | Sector | Price Last | % Realized | 52-Week High Date | RSI | % above MA200 | Trend |
|---|---|---|---|---|---|---|---|---|
| LLY | Lilly(Eli) & Co | Healthcare | $1233.05 | +58.18% | 2026-06-29 | 74.7 | +26.0% | Above MA20, MA50, MA200 |
| JNJ | Johnson & Johnson | Healthcare | $254.95 | +66.90% | 2026-06-29 | 72.3 | +17.1% | Above MA20, MA50, MA200 |
| GE | GE Aerospace | Industrials | $374.29 | +45.42% | 2026-06-29 | 74.6 | +21.5% | Above MA20, MA50, MA200 |
| PANW | Palo Alto Networks Inc | Technology | $322.51 | +57.60% | 2026-06-29 | 75.9 | +61.9% | Above MA20, MA50, MA200 |
| PNC | PNC Financial Services Group Inc | Financial | $246.07 | +32.00% | 2026-06-29 | 71.1 | +16.9% | Above MA20, MA50, MA200 |
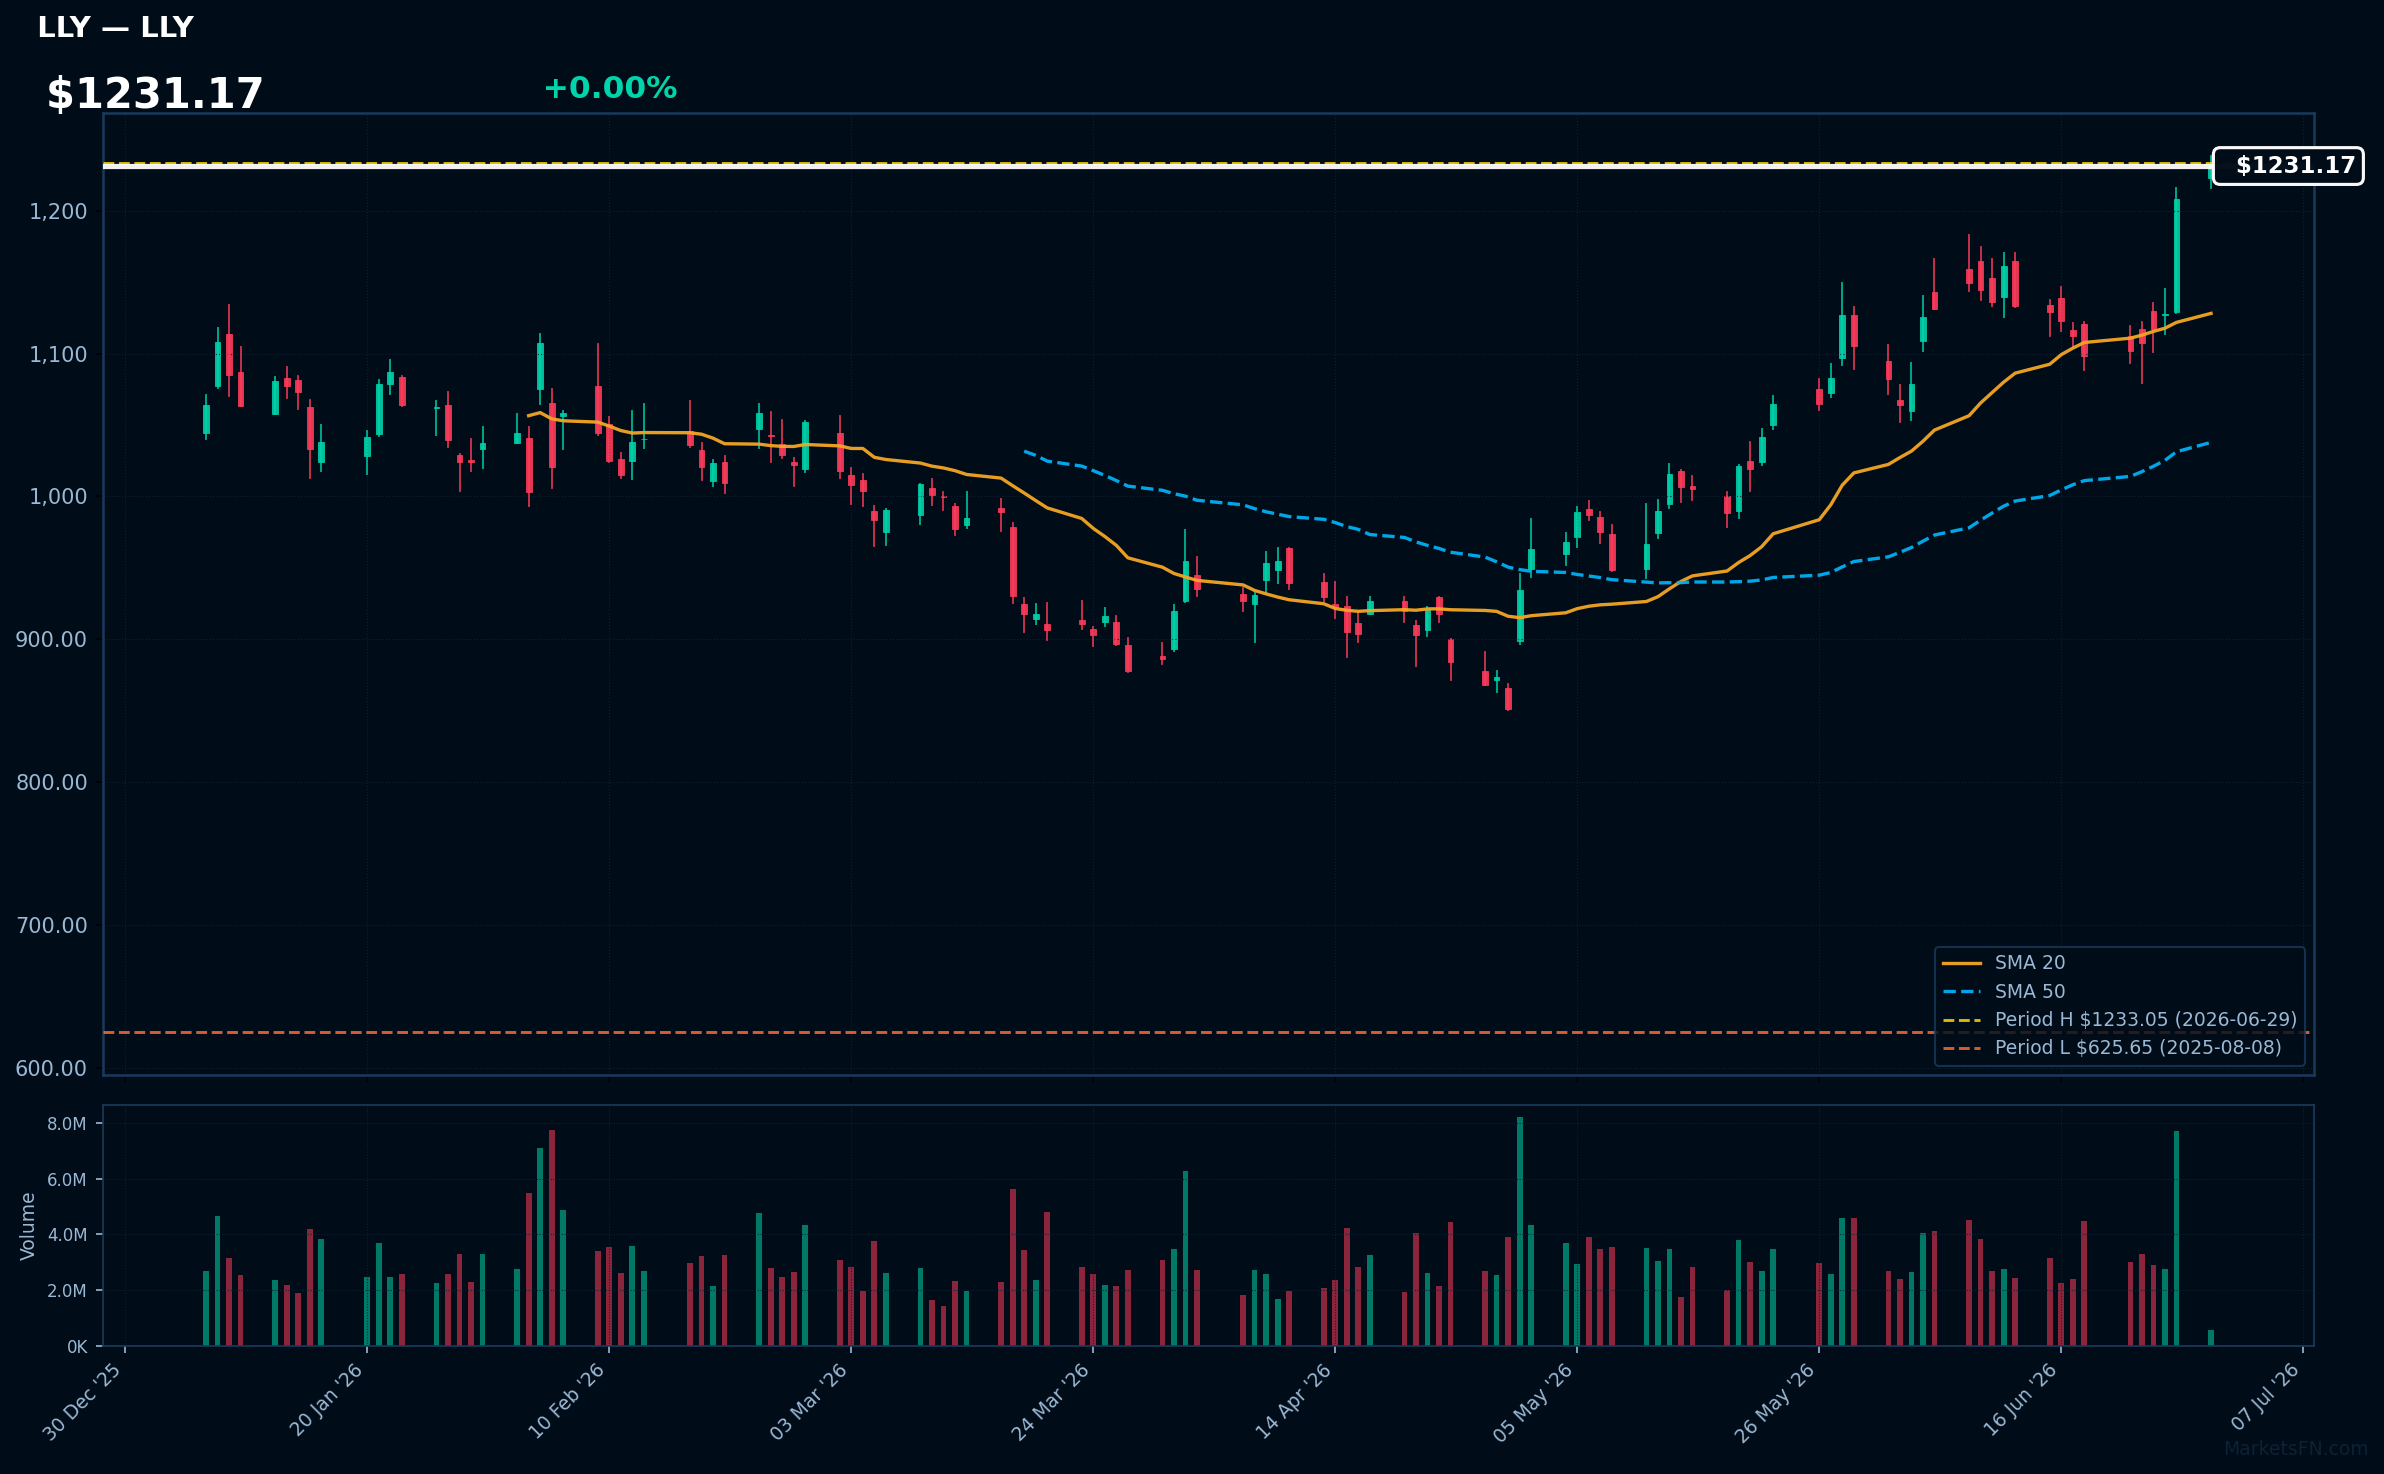
LLY | Lilly(Eli) & Co | Healthcare | Price Last: $1233.05 | % Realized: +58.18% | RSI: 74.7 | % above MA200: +26.0% | Trend: Above MA20, MA50, MA200
Eli Lilly is a pharmaceutical company developing and marketing medicines, with a focus on diabetes, oncology, and neuroscience treatments. Investors care about its pipeline, regulatory approvals, and sales growth, particularly for products like tirzepatide and donanemab.
Lilly's technicals indicate strong momentum: RSI(14) is 74.7, nearing overbought territory, with a bullish MA alignment (price > MA20 > MA50 > MA200) and 0.0% below its 52-Week high, suggesting a potential breakout.
Related headlines
- Eli Lilly Leads 5 Stocks Near Buy Points As The Market Rally Rotates
- Dow Jones Futures: Market At Tipping Point, Here's What To Do. Eli Lilly Soars, Tesla On Tap.
- Lilly, J&J and AbbVie Hit New Highs
- Trump name-dropped Nokia and Eli Lilly in a Pennsylvania speech. Here's what happened to 5 other stocks he singled out
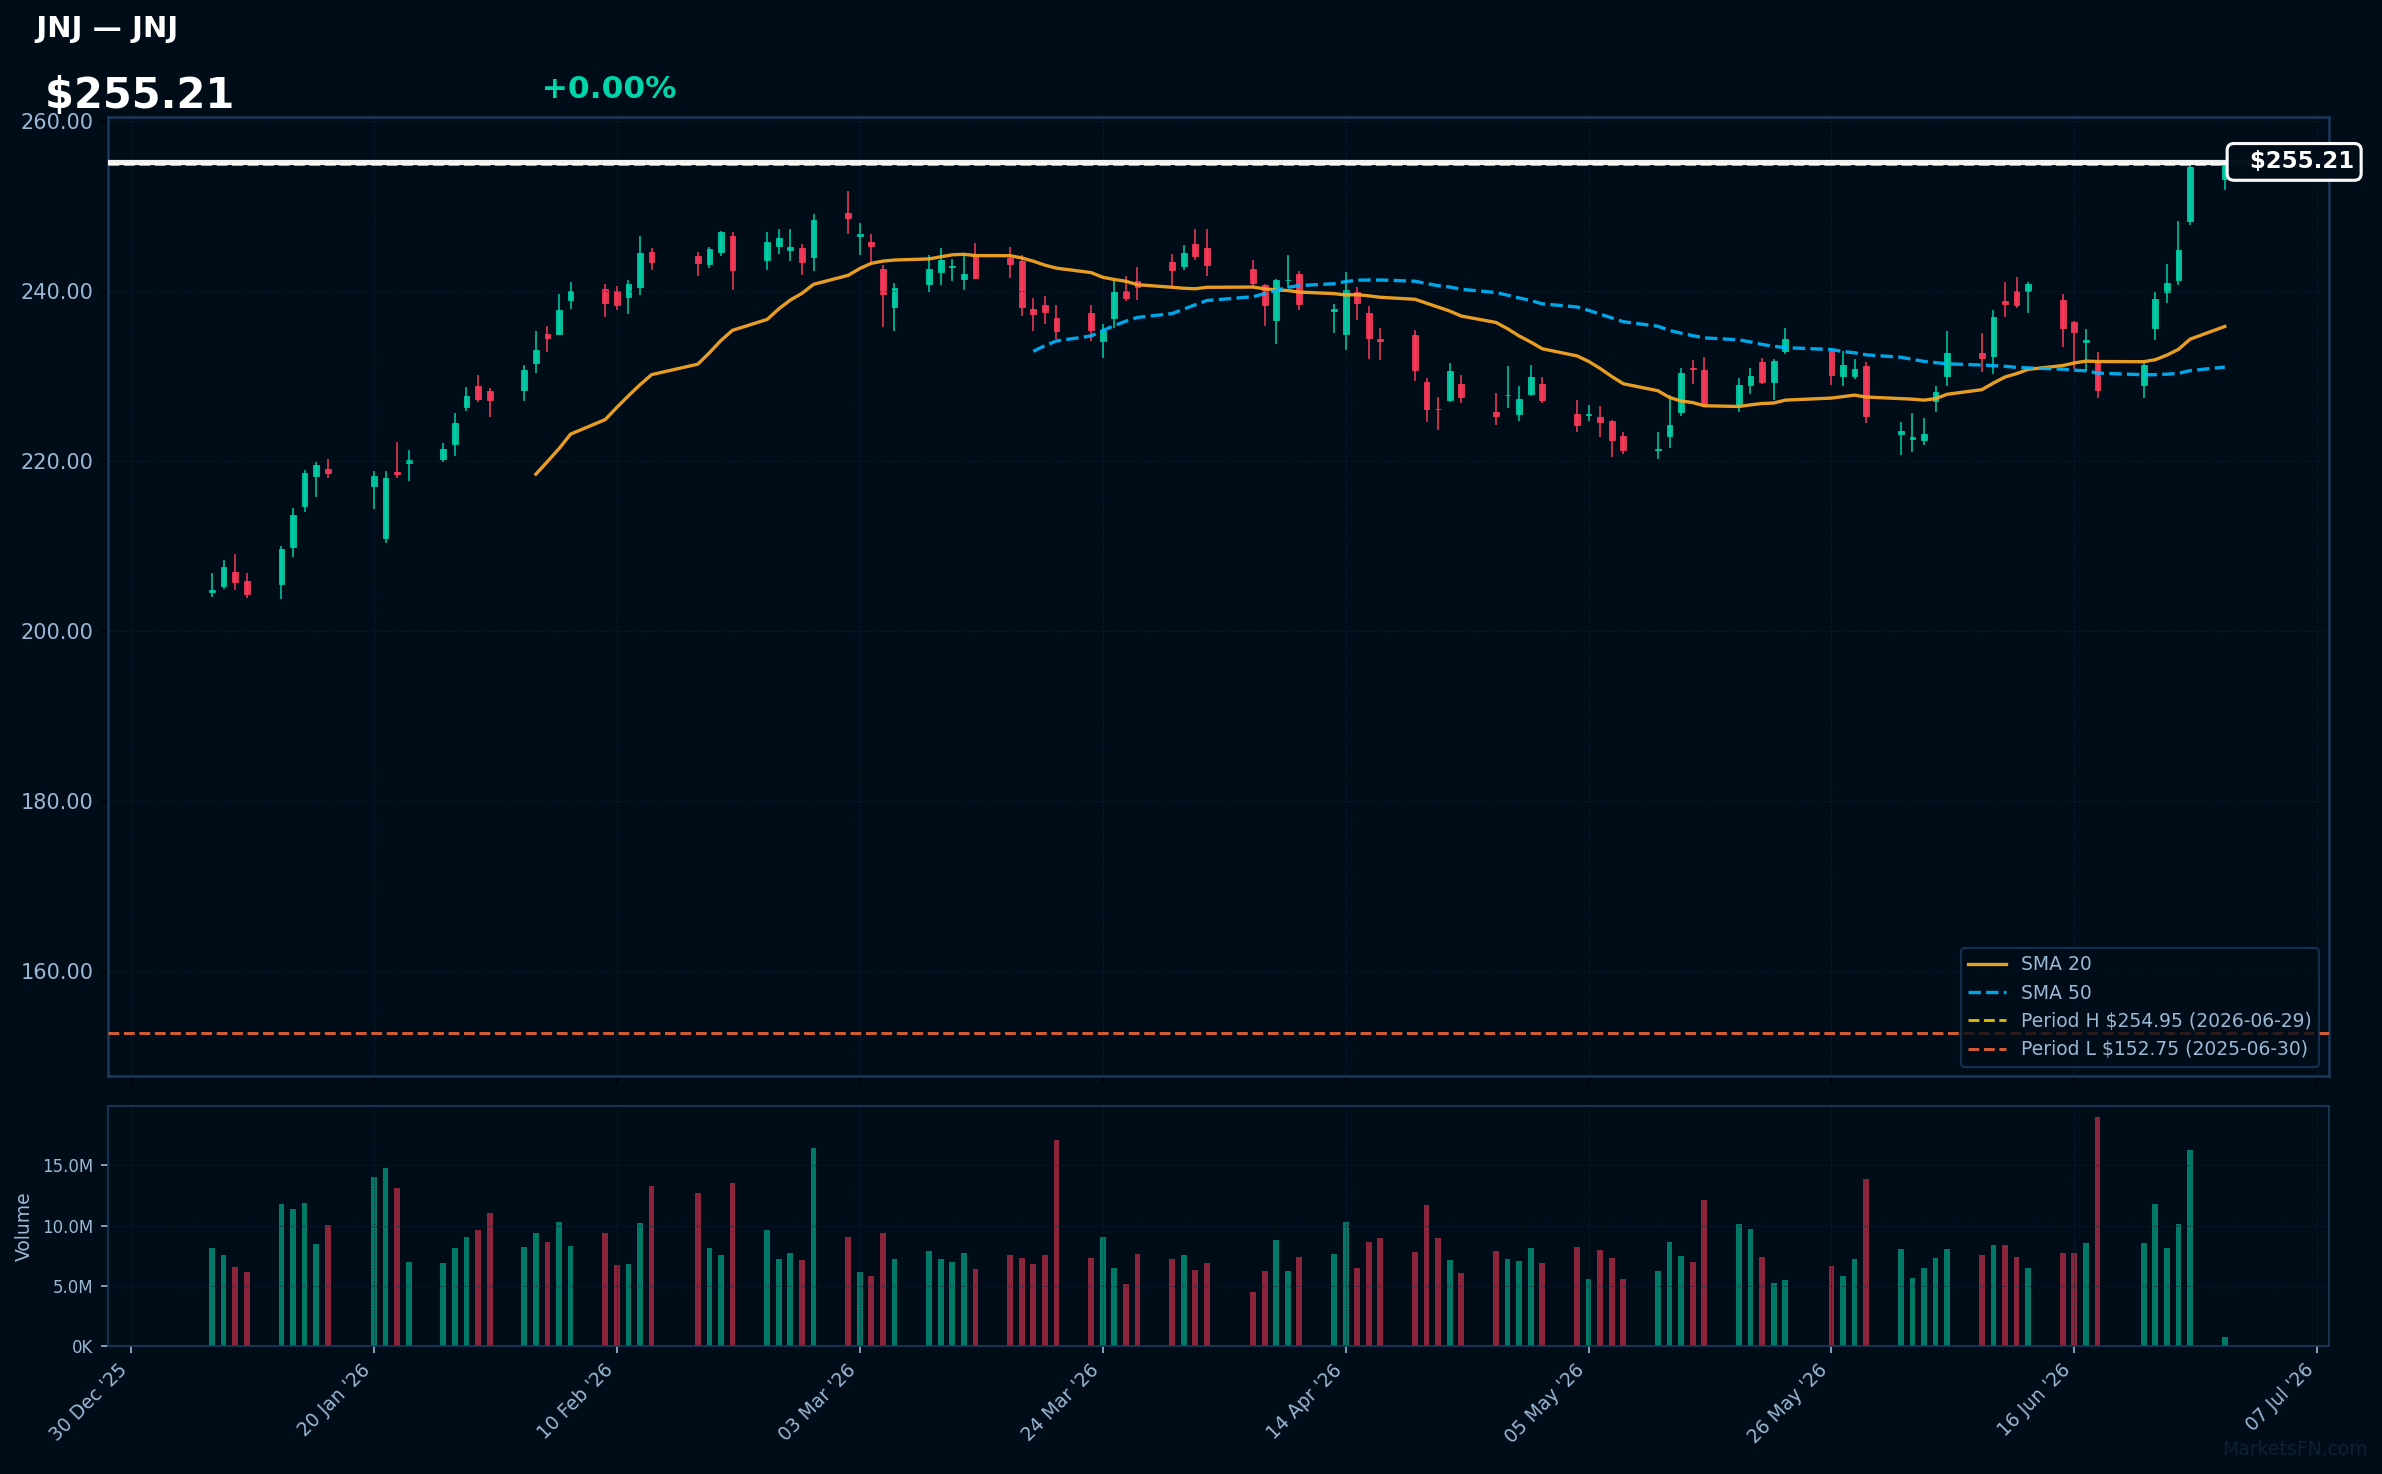
JNJ | Johnson & Johnson | Healthcare | Price Last: $254.95 | % Realized: +66.90% | RSI: 72.3 | % above MA200: +17.1% | Trend: Above MA20, MA50, MA200
Johnson & Johnson is a diversified healthcare company with a broad portfolio of pharmaceuticals, medical devices, and consumer products, including blockbuster drugs like Stelara and Darzalex, making it a significant player in the healthcare sector.
JNJ's RSI is 72.3, indicating strong momentum as it's near its 52-Week high, with a bullish MA alignment: price ($255.21) > MA20 > MA50 > MA200, suggesting a sustained uptrend with potential for further breakout.
Related headlines
- Johnson & Johnson presents new IMAAVY (nipocalimab-aahu) data at European Academy of Neurology (EAN) 2026 Congress reinforcing sustained disease control in generalized myasthenia gravis
- The Number That Could Test Johnson & Johnson Stock
- Johnson & Johnson to stay out of obesity drugs, focus on cancer, CEO says
- Johnson & Johnson Invests more than $1 Billion to Strengthen U.S. Vision Manufacturing in Jacksonville, Florida
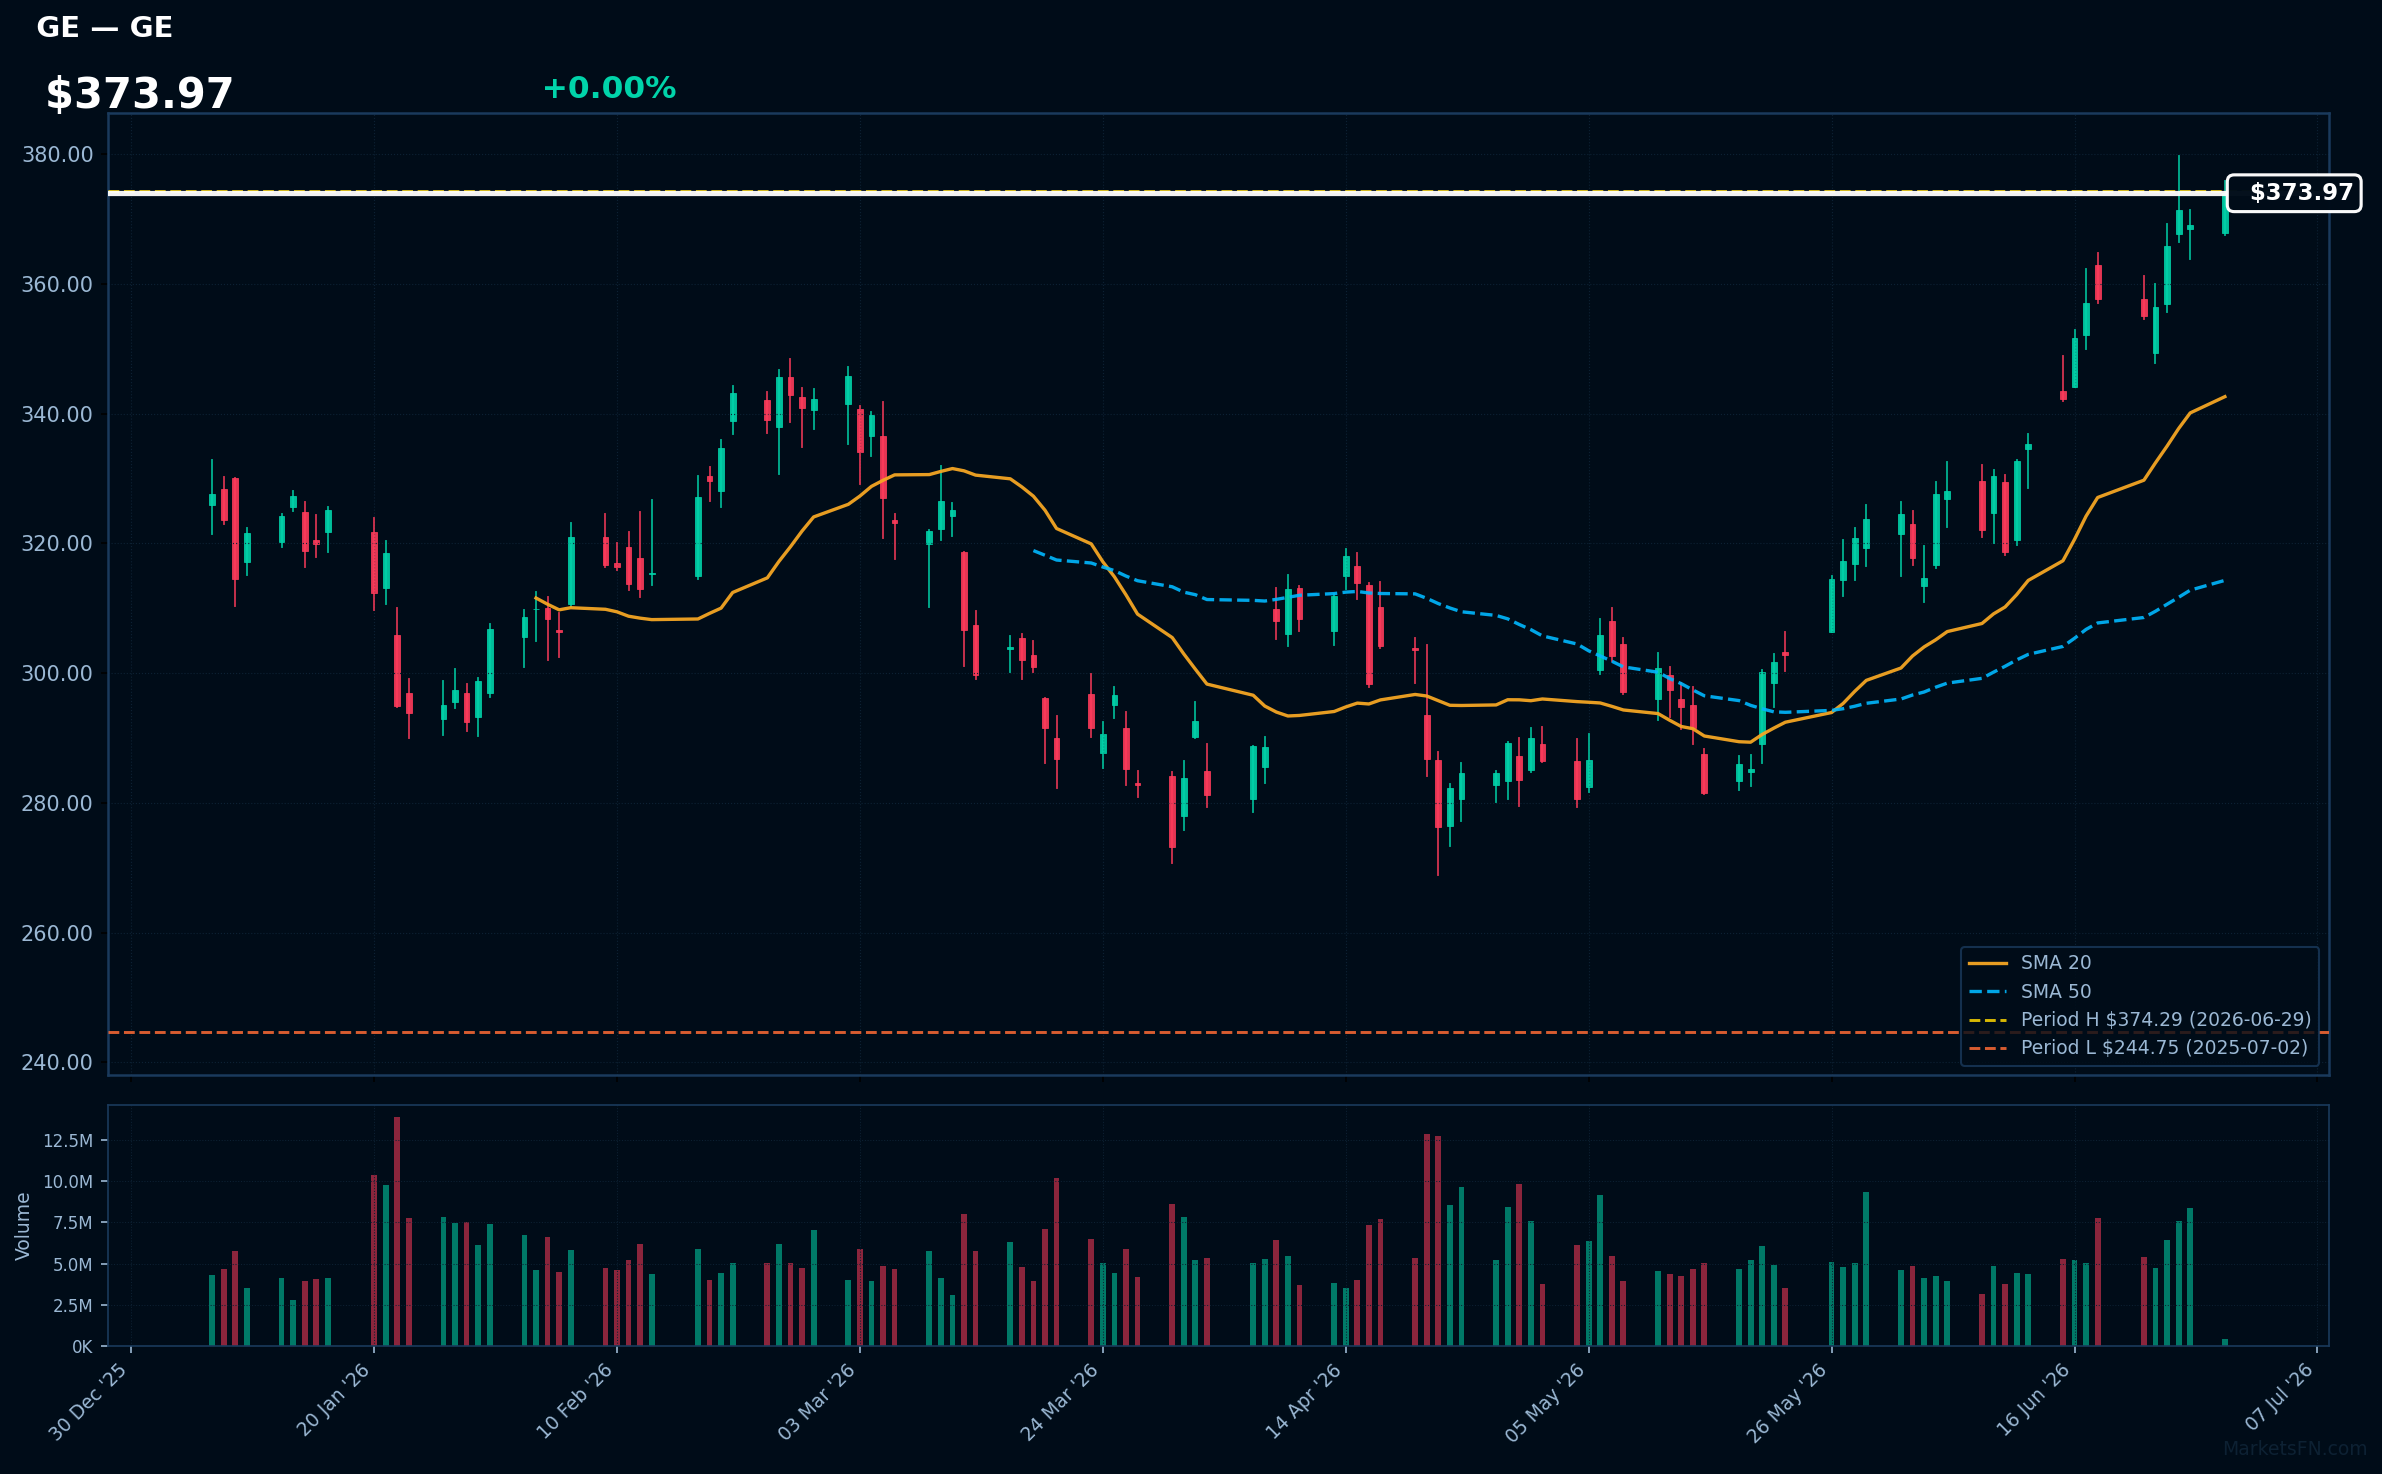
GE | GE Aerospace | Industrials | Price Last: $374.29 | % Realized: +45.42% | RSI: 74.6 | % above MA200: +21.5% | Trend: Above MA20, MA50, MA200
GE Aerospace is a leader in the aerospace industry, manufacturing commercial and military jet engines, and providing related services. Investors should care about its technological advancements, market share, and aftermarket maintenance demand, which drive revenue growth and profitability.
GE Aerospace's technicals indicate strong momentum: RSI(14) is 74.6, nearing overbought territory, with a bullish MA alignment (price > MA20 > MA50 > MA200) and a 0.0% gap to its 52-Week high, suggesting a potential breakout.
Related headlines
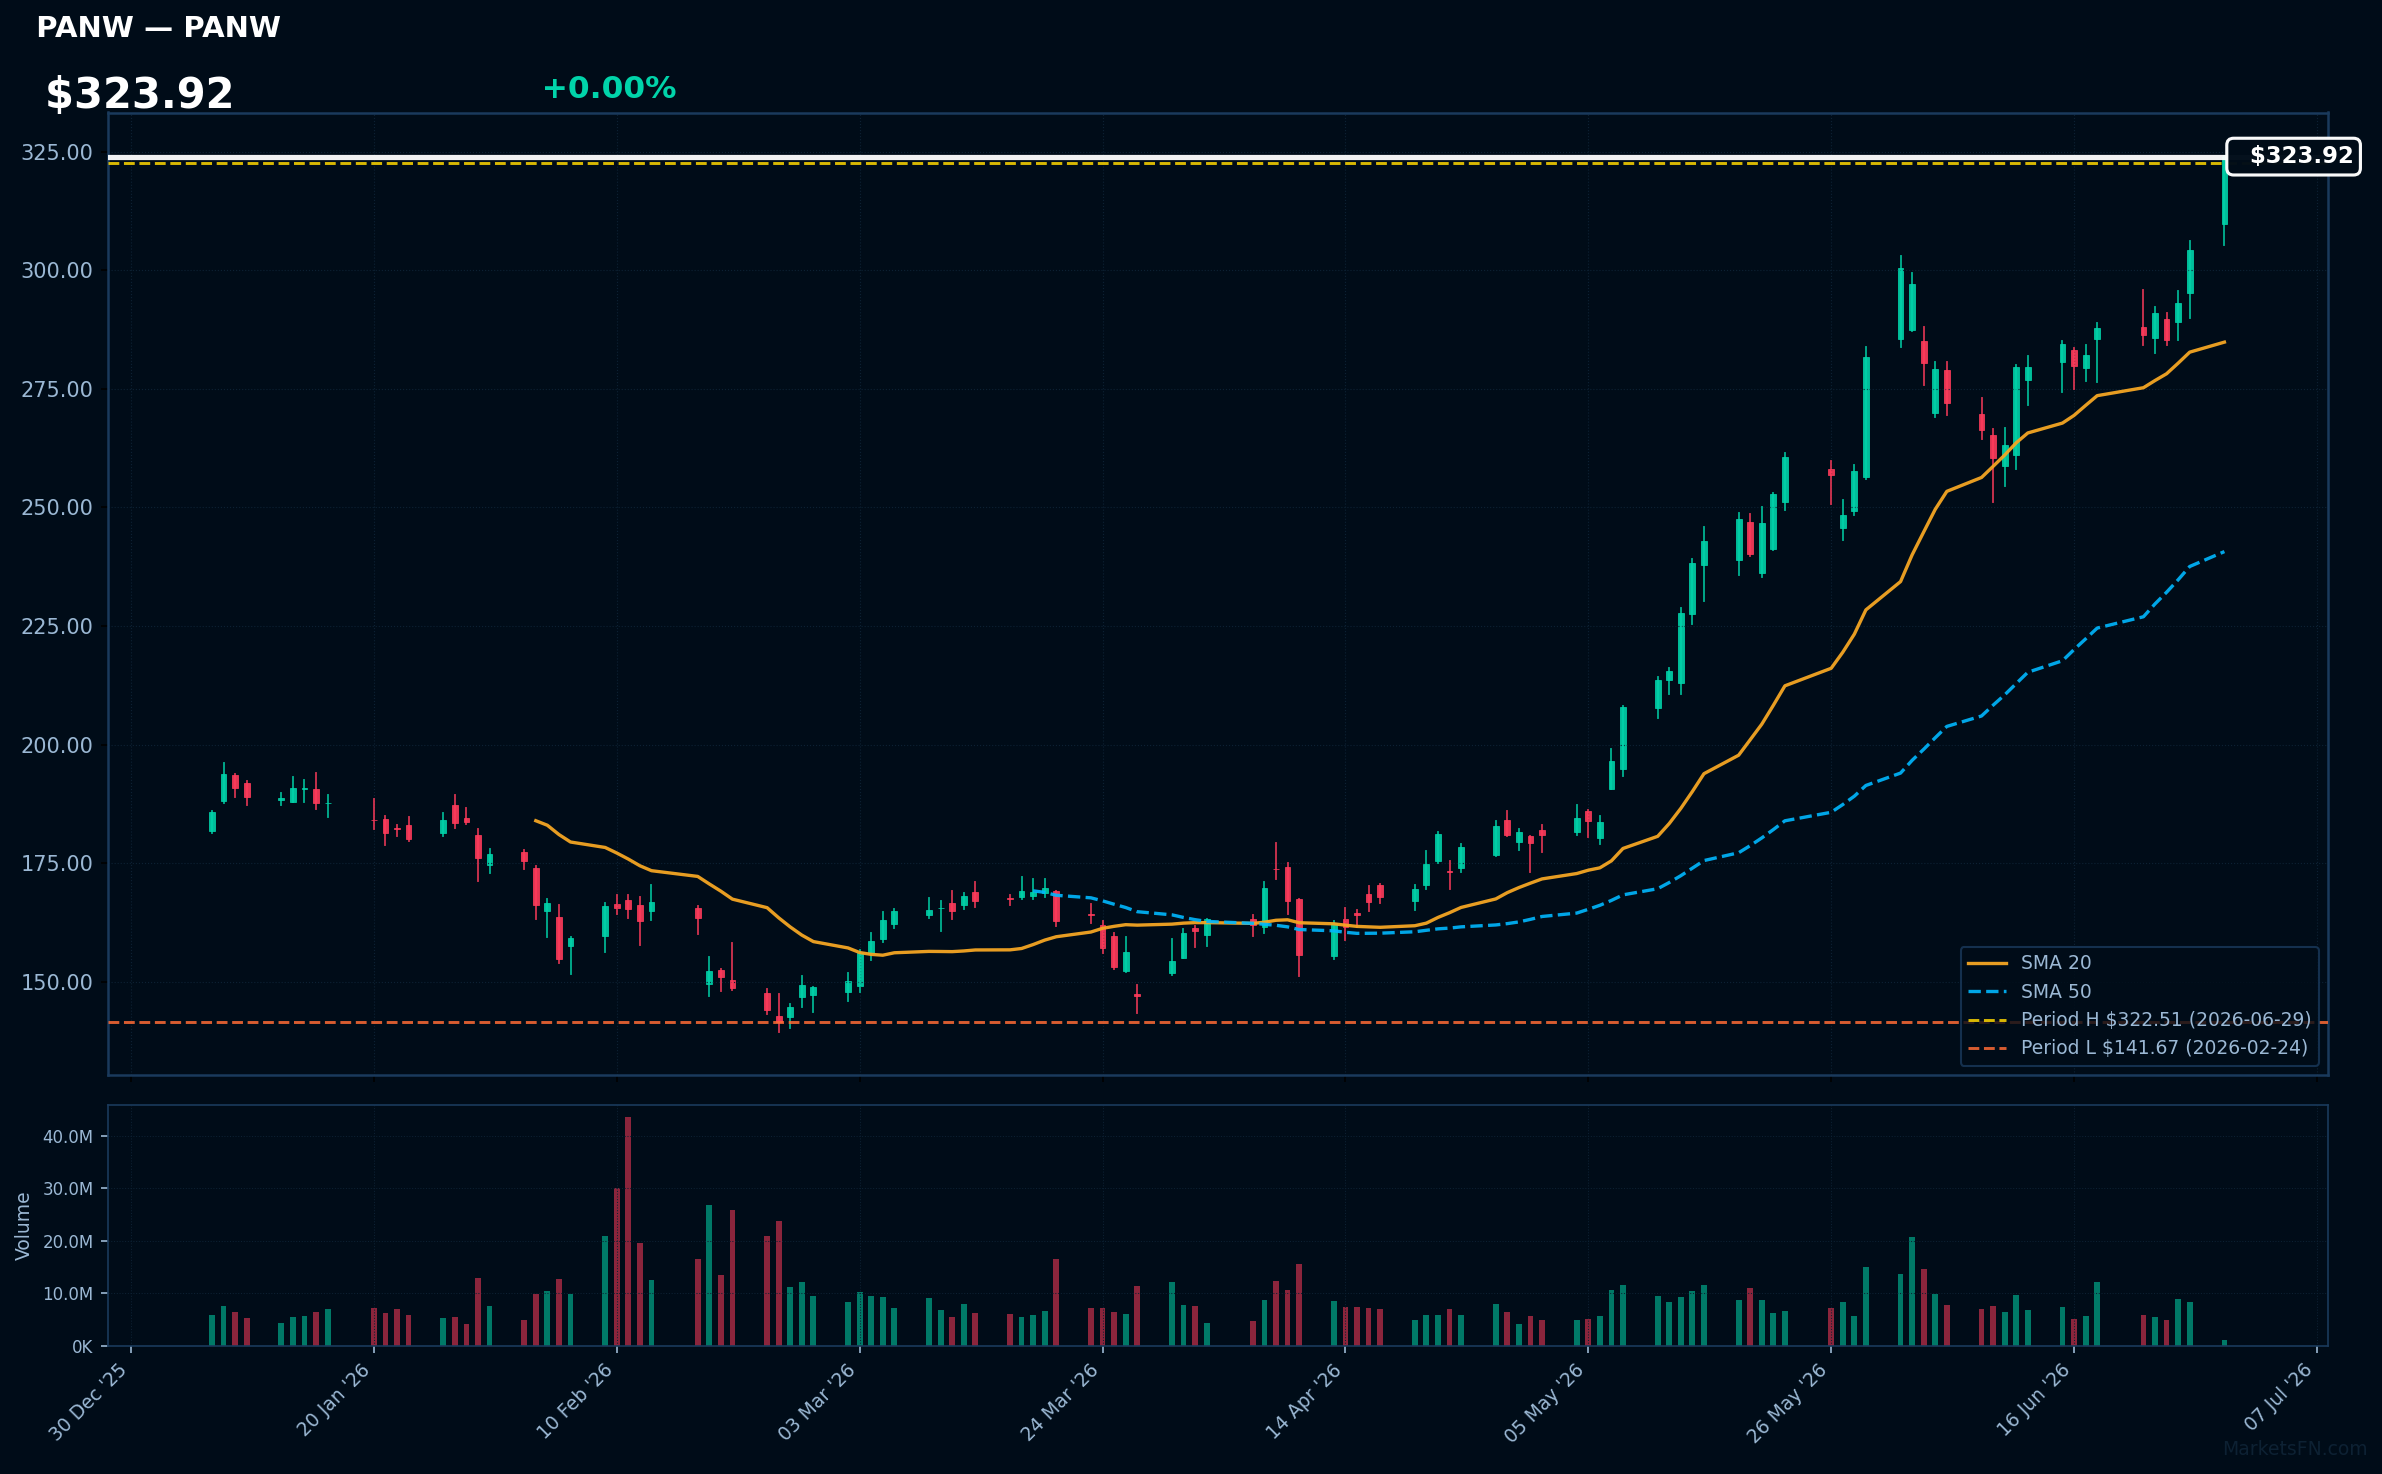
PANW | Palo Alto Networks Inc | Technology | Price Last: $322.51 | % Realized: +57.60% | RSI: 75.9 | % above MA200: +61.9% | Trend: Above MA20, MA50, MA200
Palo Alto Networks Inc is a cybersecurity company providing advanced threat prevention and security solutions. Investors should care as its innovative products and strong demand drive growth, making it a key player in the rapidly expanding cybersecurity market.
Palo Alto Networks Inc is in a sustained uptrend with price ($323.92) above MA20 > MA50 > MA200. RSI(14) is 75.9, nearing overbought territory. The stock is 0.0% below its 52-Week high, indicating potential breakout momentum.
Related headlines
- The Old-School Signal That Lit Up Palo Alto Networks Stock
- Is the Market Totally Wrong About PANW Stock?
- PANW vs CRWD vs AVGO: Morningstar Has A 'Top Pick' Trading At A 40% Discount After Earnings
- Palo Alto Networks and Deutsche Telekom Bring AI-Driven Security with Advanced Sovereignty Controls for European Regulated Industries
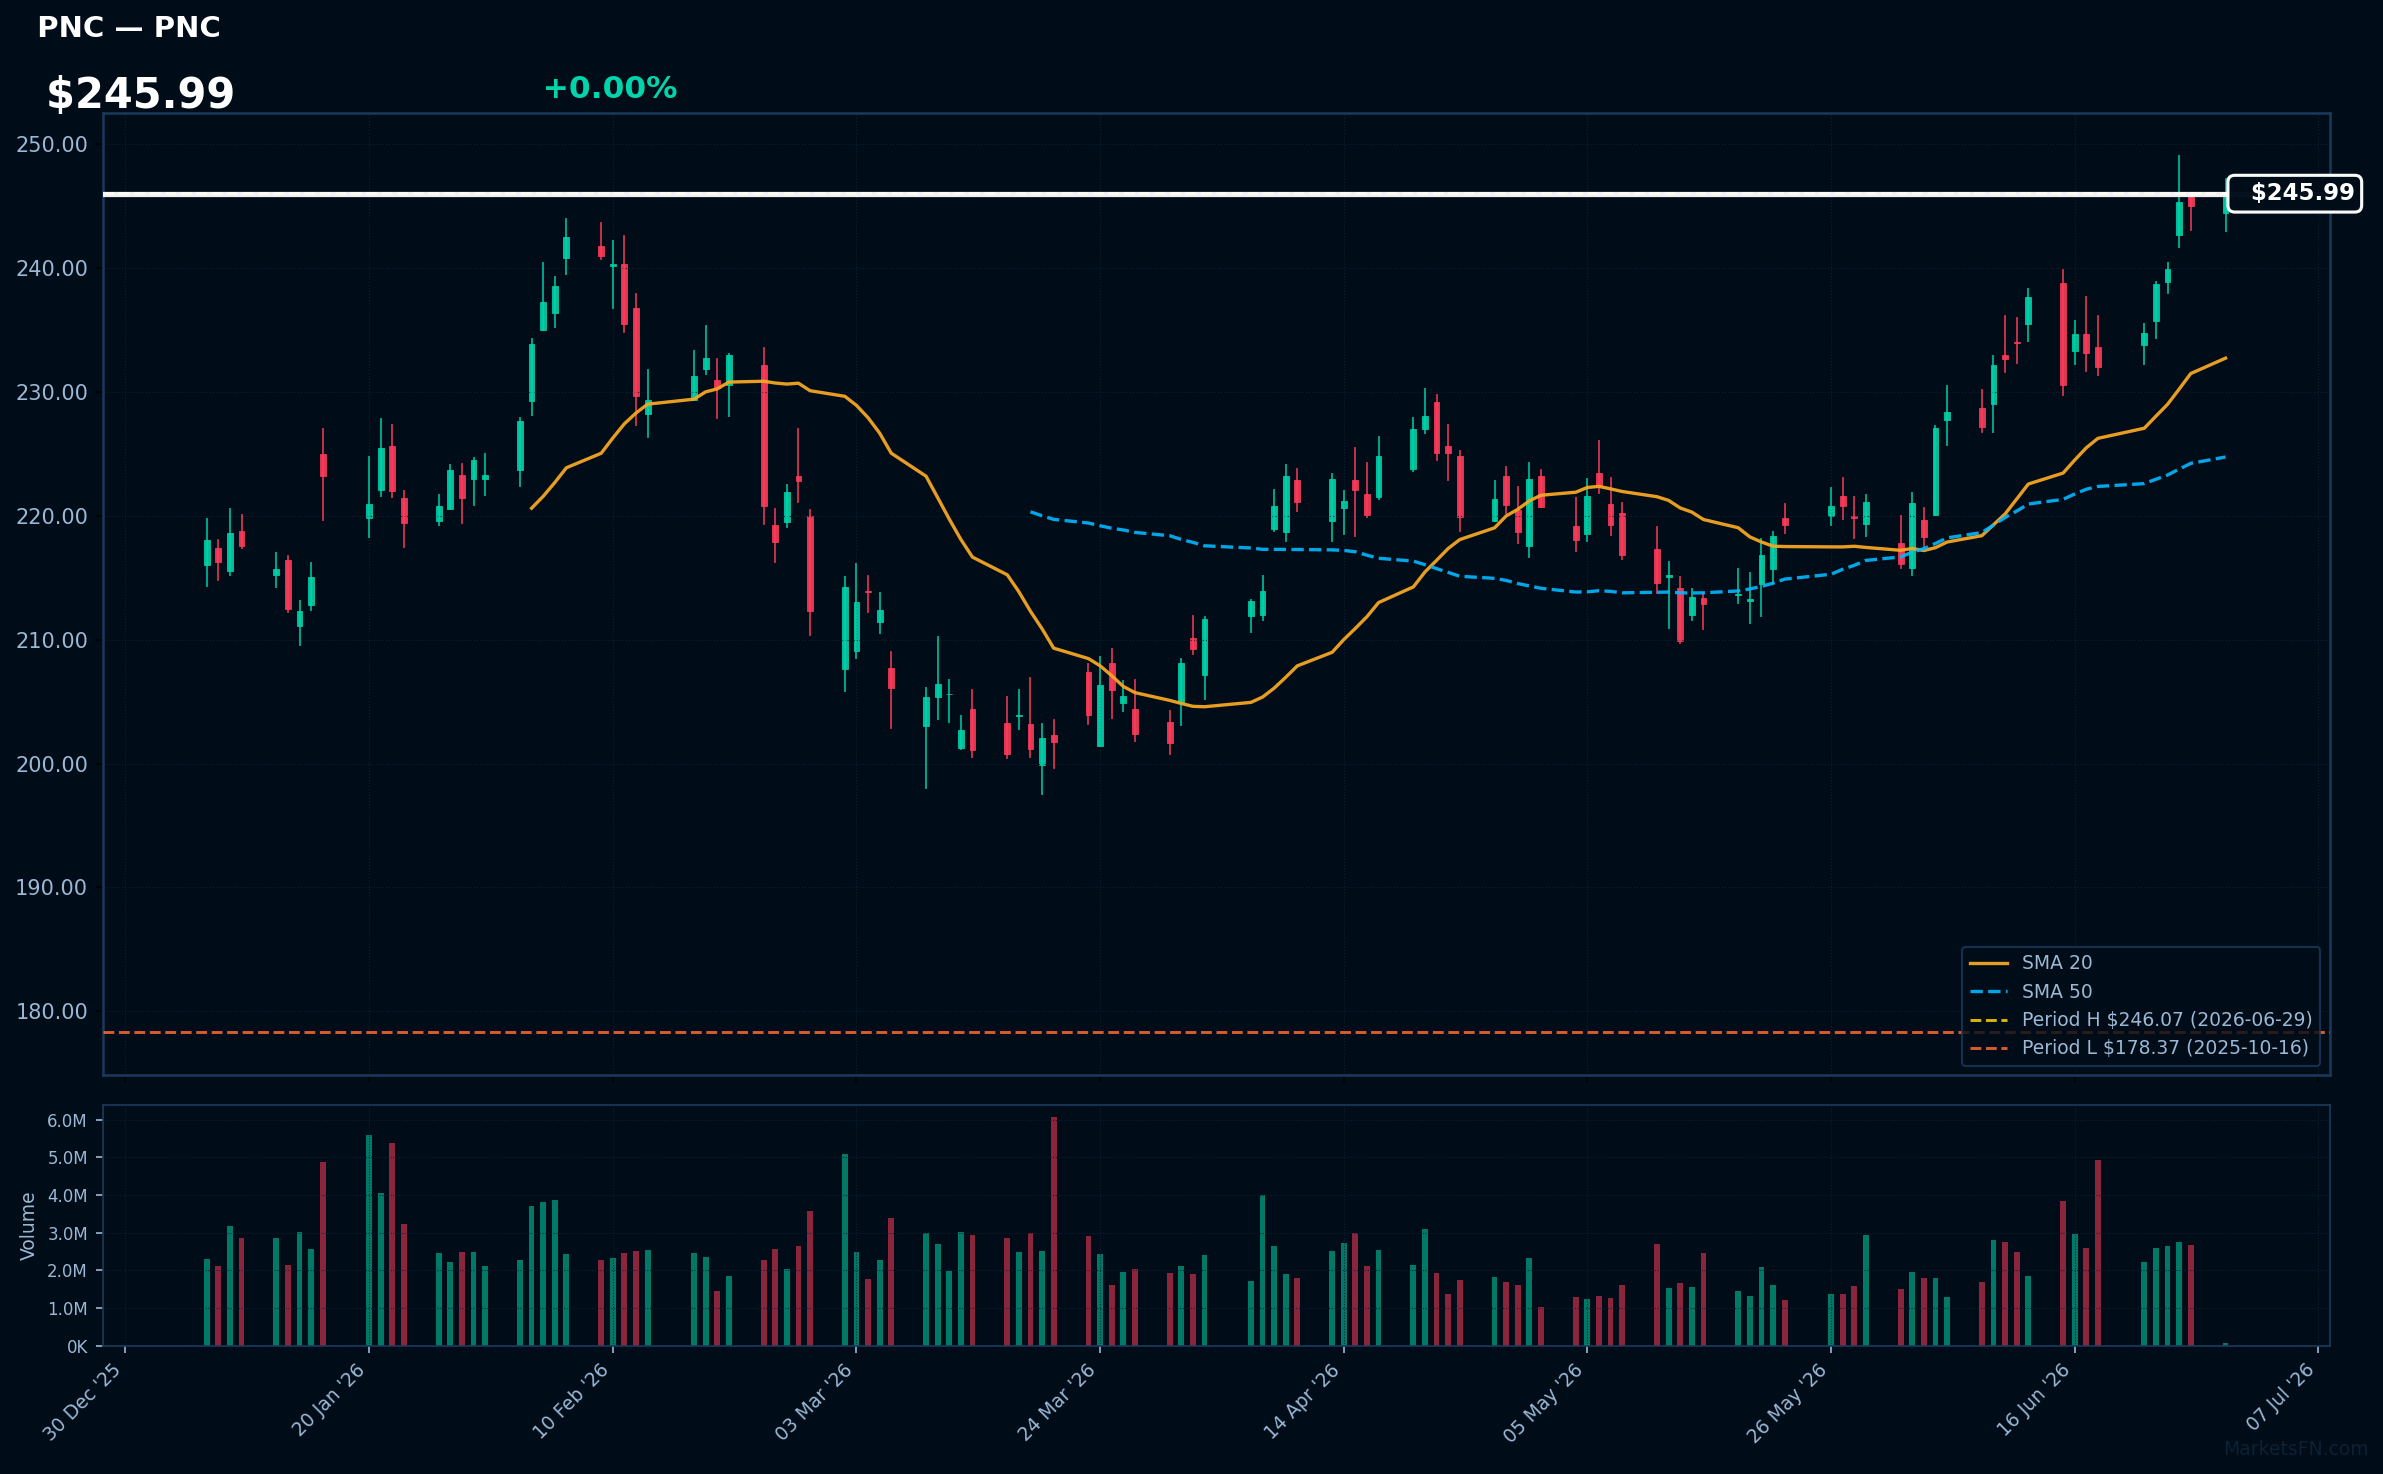
PNC | PNC Financial Services Group Inc | Financial | Price Last: $246.07 | % Realized: +32.00% | RSI: 71.1 | % above MA200: +16.9% | Trend: Above MA20, MA50, MA200
PNC Financial serves as a regional bank holding company, providing financial services including lending, treasury management, and asset management to individuals, corporations, and governments, making it a significant player in the US banking sector.
PNC is near a breakout at its 52-Week high, with RSI(14) at 71.1 and a bullish MA alignment (price > MA20 > MA50 > MA200), indicating strong momentum; however, an RSI near 70 may signal overbought conditions.
Related headlines
📉 Nearest to 52-Week Low
Sectors represented: Communication Services (2), Financial (1), Industrials (1), Healthcare (1)
| Ticker | Company | Sector | Price Last | % Realized | 52-Week Low Date | RSI | % above MA200 | Trend |
|---|---|---|---|---|---|---|---|---|
| TMUS | T-Mobile US Inc | Communication Services | $175.43 | -26.37% | 2026-06-29 | 36.5 | -14.5% | Below MA20, MA50, MA200 |
| T | AT&T, Inc | Communication Services | $21.67 | -25.10% | 2026-06-29 | 33.7 | -16.2% | Below MA20, MA50, MA200 |
| ICE | Intercontinental Exchange Inc | Financial | $123.61 | -32.63% | 2026-06-29 | 21.9 | -21.6% | Below MA20, MA50, MA200 |
| NOC | Northrop Grumman Corp | Industrials | $498.61 | -0.27% | 2026-06-29 | 30.1 | -18.7% | Below MA20, MA50, MA200 |
| BSX | Boston Scientific Corp | Healthcare | $44.24 | -58.81% | 2026-06-25 | 29.5 | -44.2% | Below MA20, MA50, MA200 |
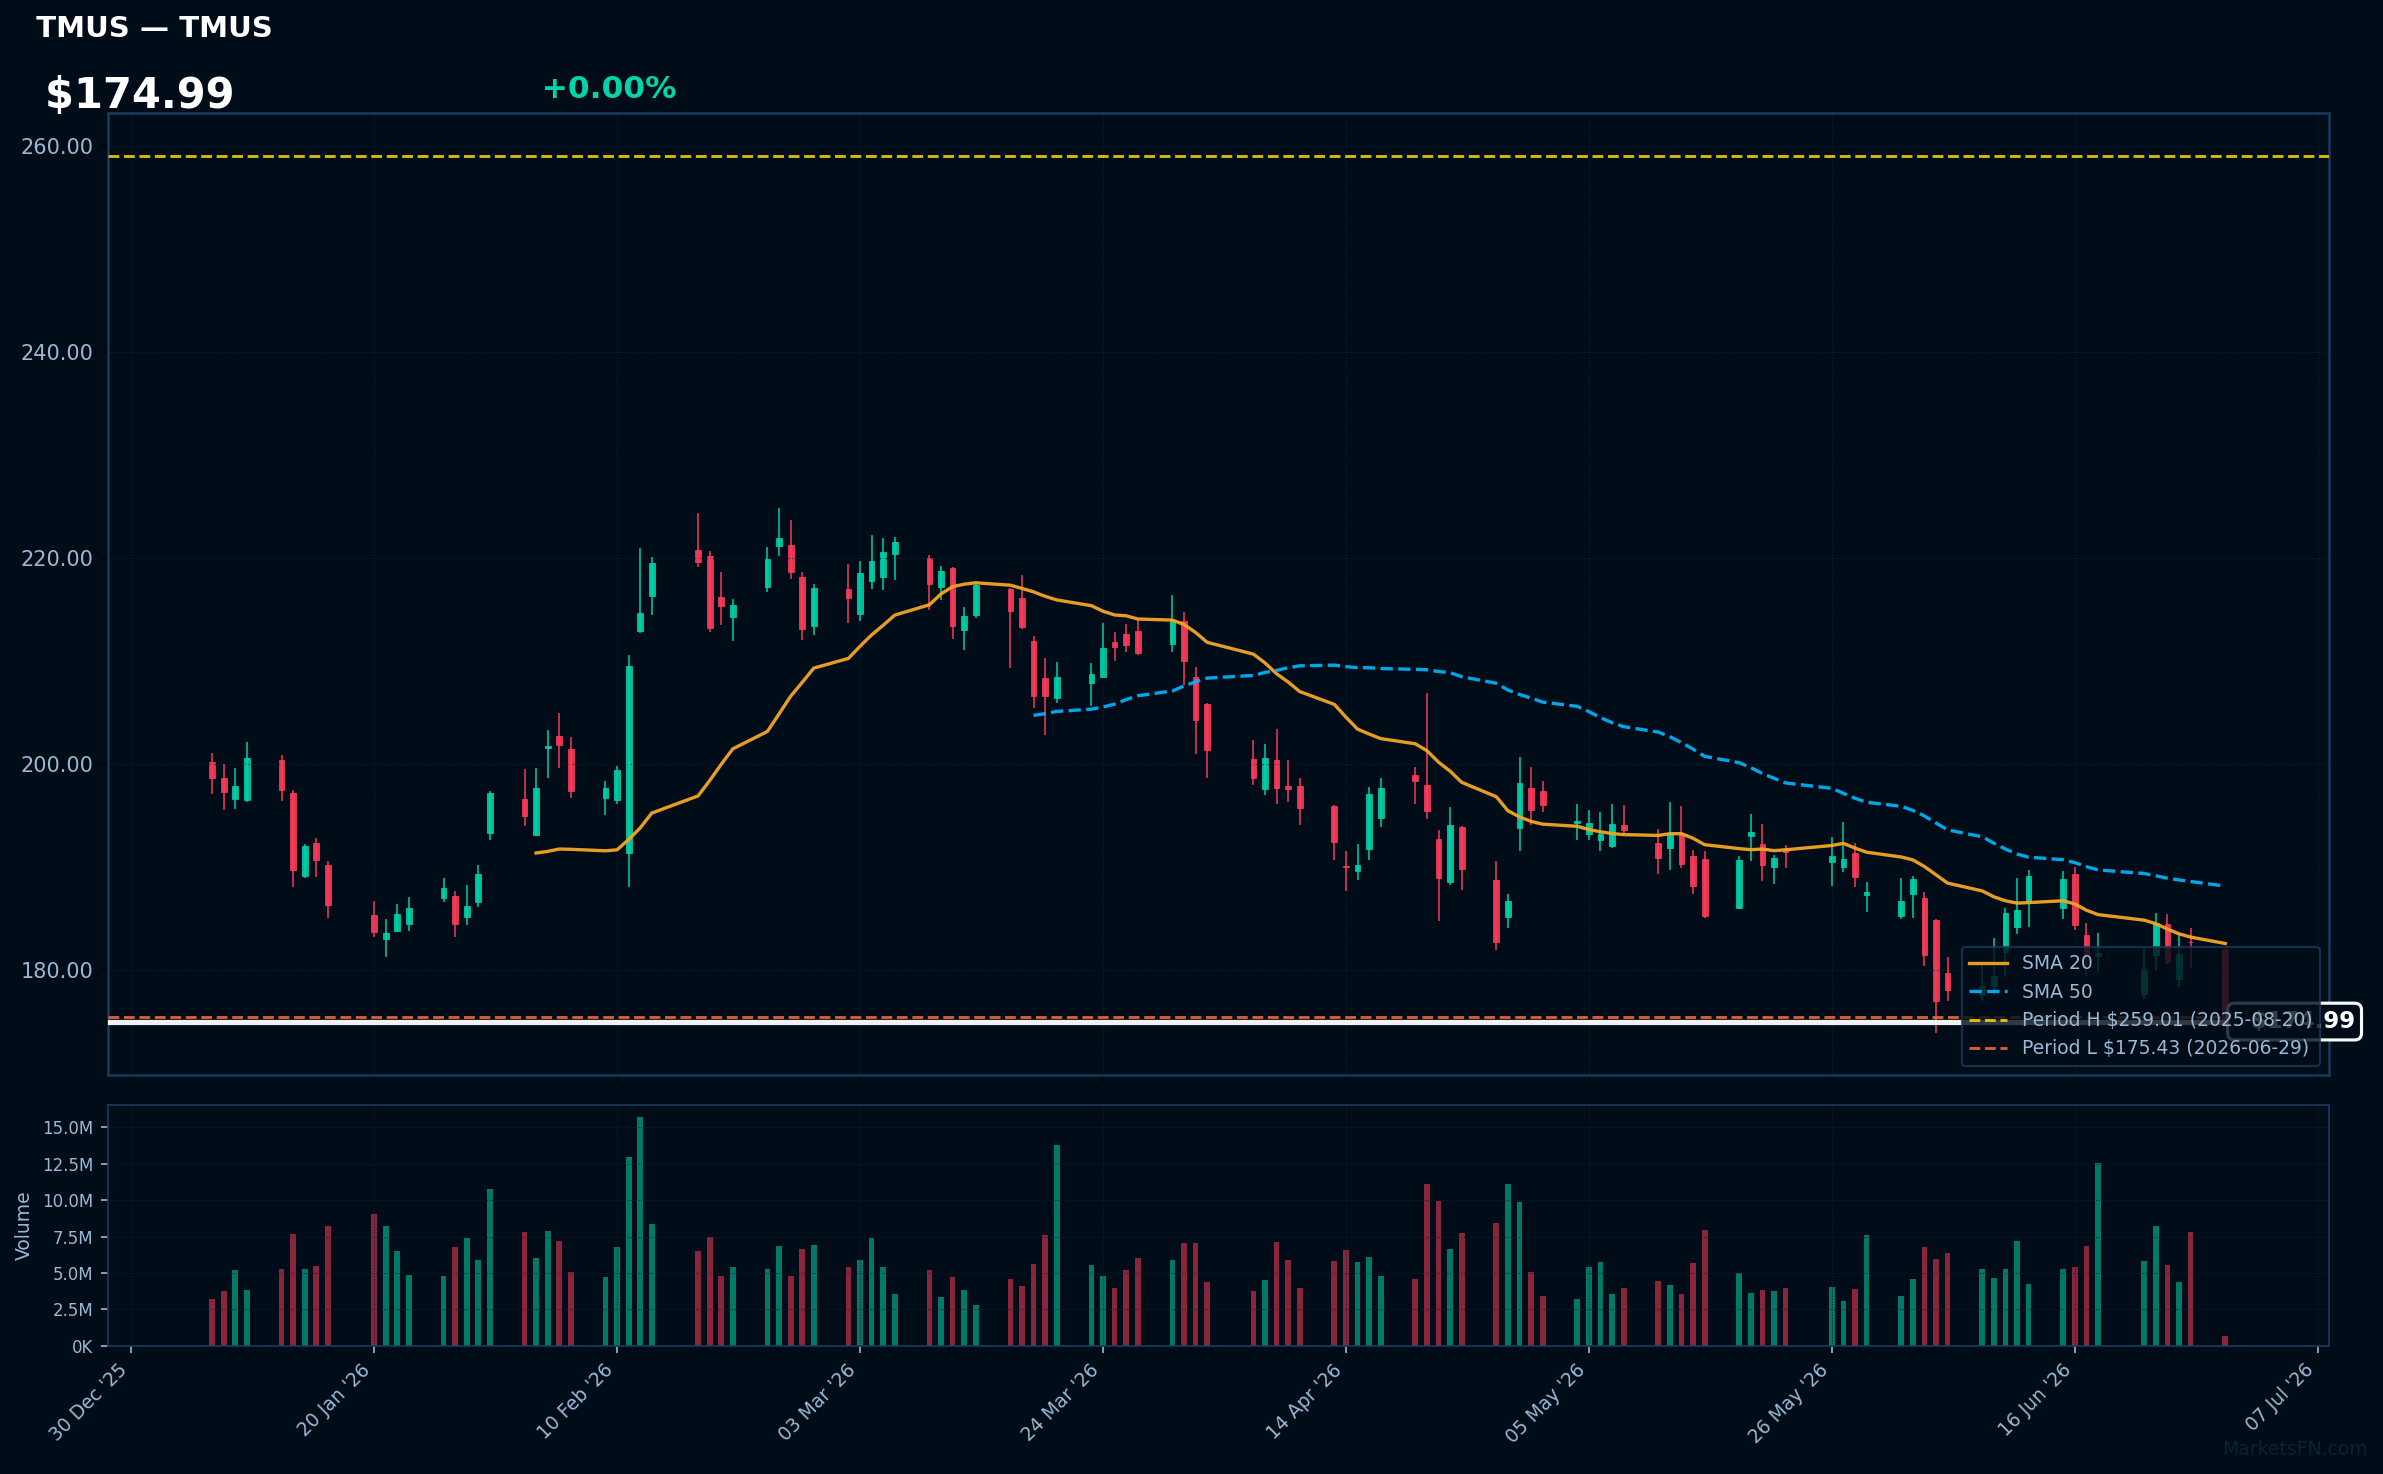
TMUS | T-Mobile US Inc | Communication Services | Price Last: $175.43 | % Realized: -26.37% | RSI: 36.5 | % above MA200: -14.5% | Trend: Below MA20, MA50, MA200
T-Mobile US Inc is a wireless network operator providing mobile services to consumers and businesses. Investors should care about its competitive positioning, 5G rollout progress, and subscriber growth, as these factors drive revenue and profitability in the telecom sector.
T-Mobile US Inc is in a sustained downtrend with price ($174.99) below MA20, MA50, and MA200. The RSI(14) is 36.5, near oversold territory, and the stock is at its 52-Week low, indicating potential support testing, but also a -26.4% 52-Week return, signaling significant weakness.
Related headlines
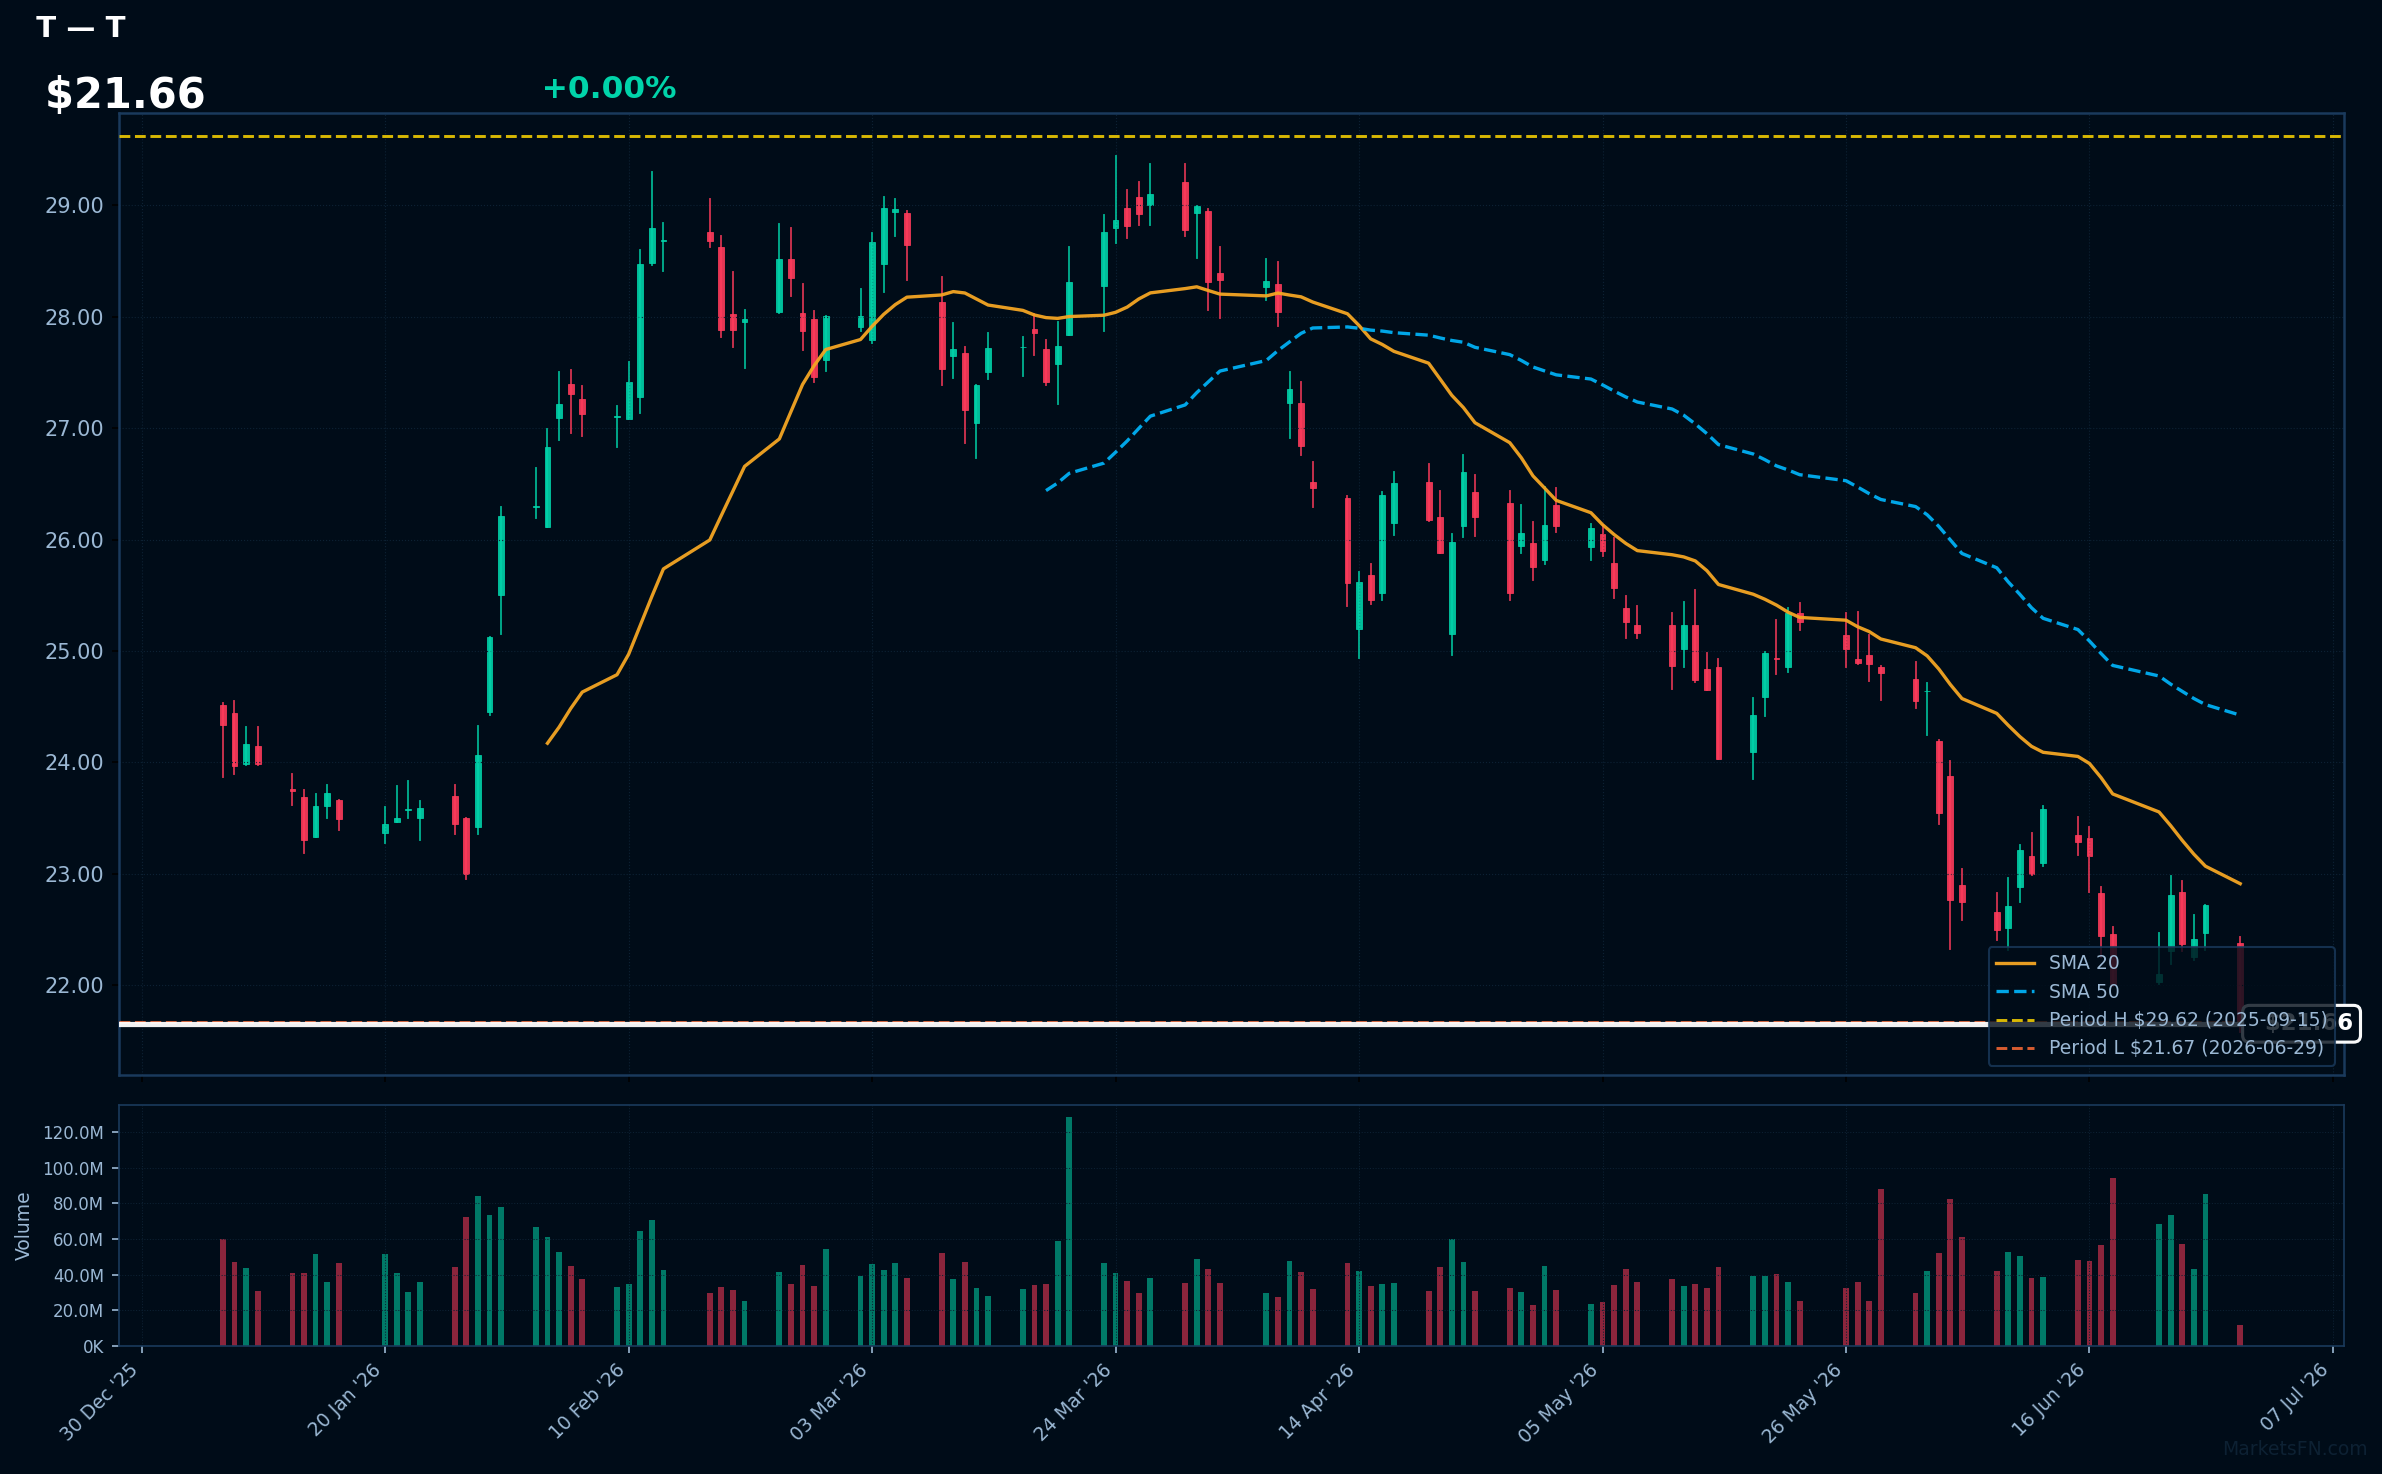
T | AT&T, Inc | Communication Services | Price Last: $21.67 | % Realized: -25.10% | RSI: 33.7 | % above MA200: -16.2% | Trend: Below MA20, MA50, MA200
AT&T, Inc is a telecommunications conglomerate providing wireless communications, local exchange, and long-distance services. Investors care due to its significant market presence and dividend yield, although its performance has been impacted by intense competition and regulatory changes.
AT&T's technical situation indicates a sustained downtrend with price ($21.66) below MA20, MA50, and MA200. The RSI(14) at 33.7 suggests oversold conditions, and the stock is at its 52-Week low, testing major support, potentially a warning sign.
Related headlines
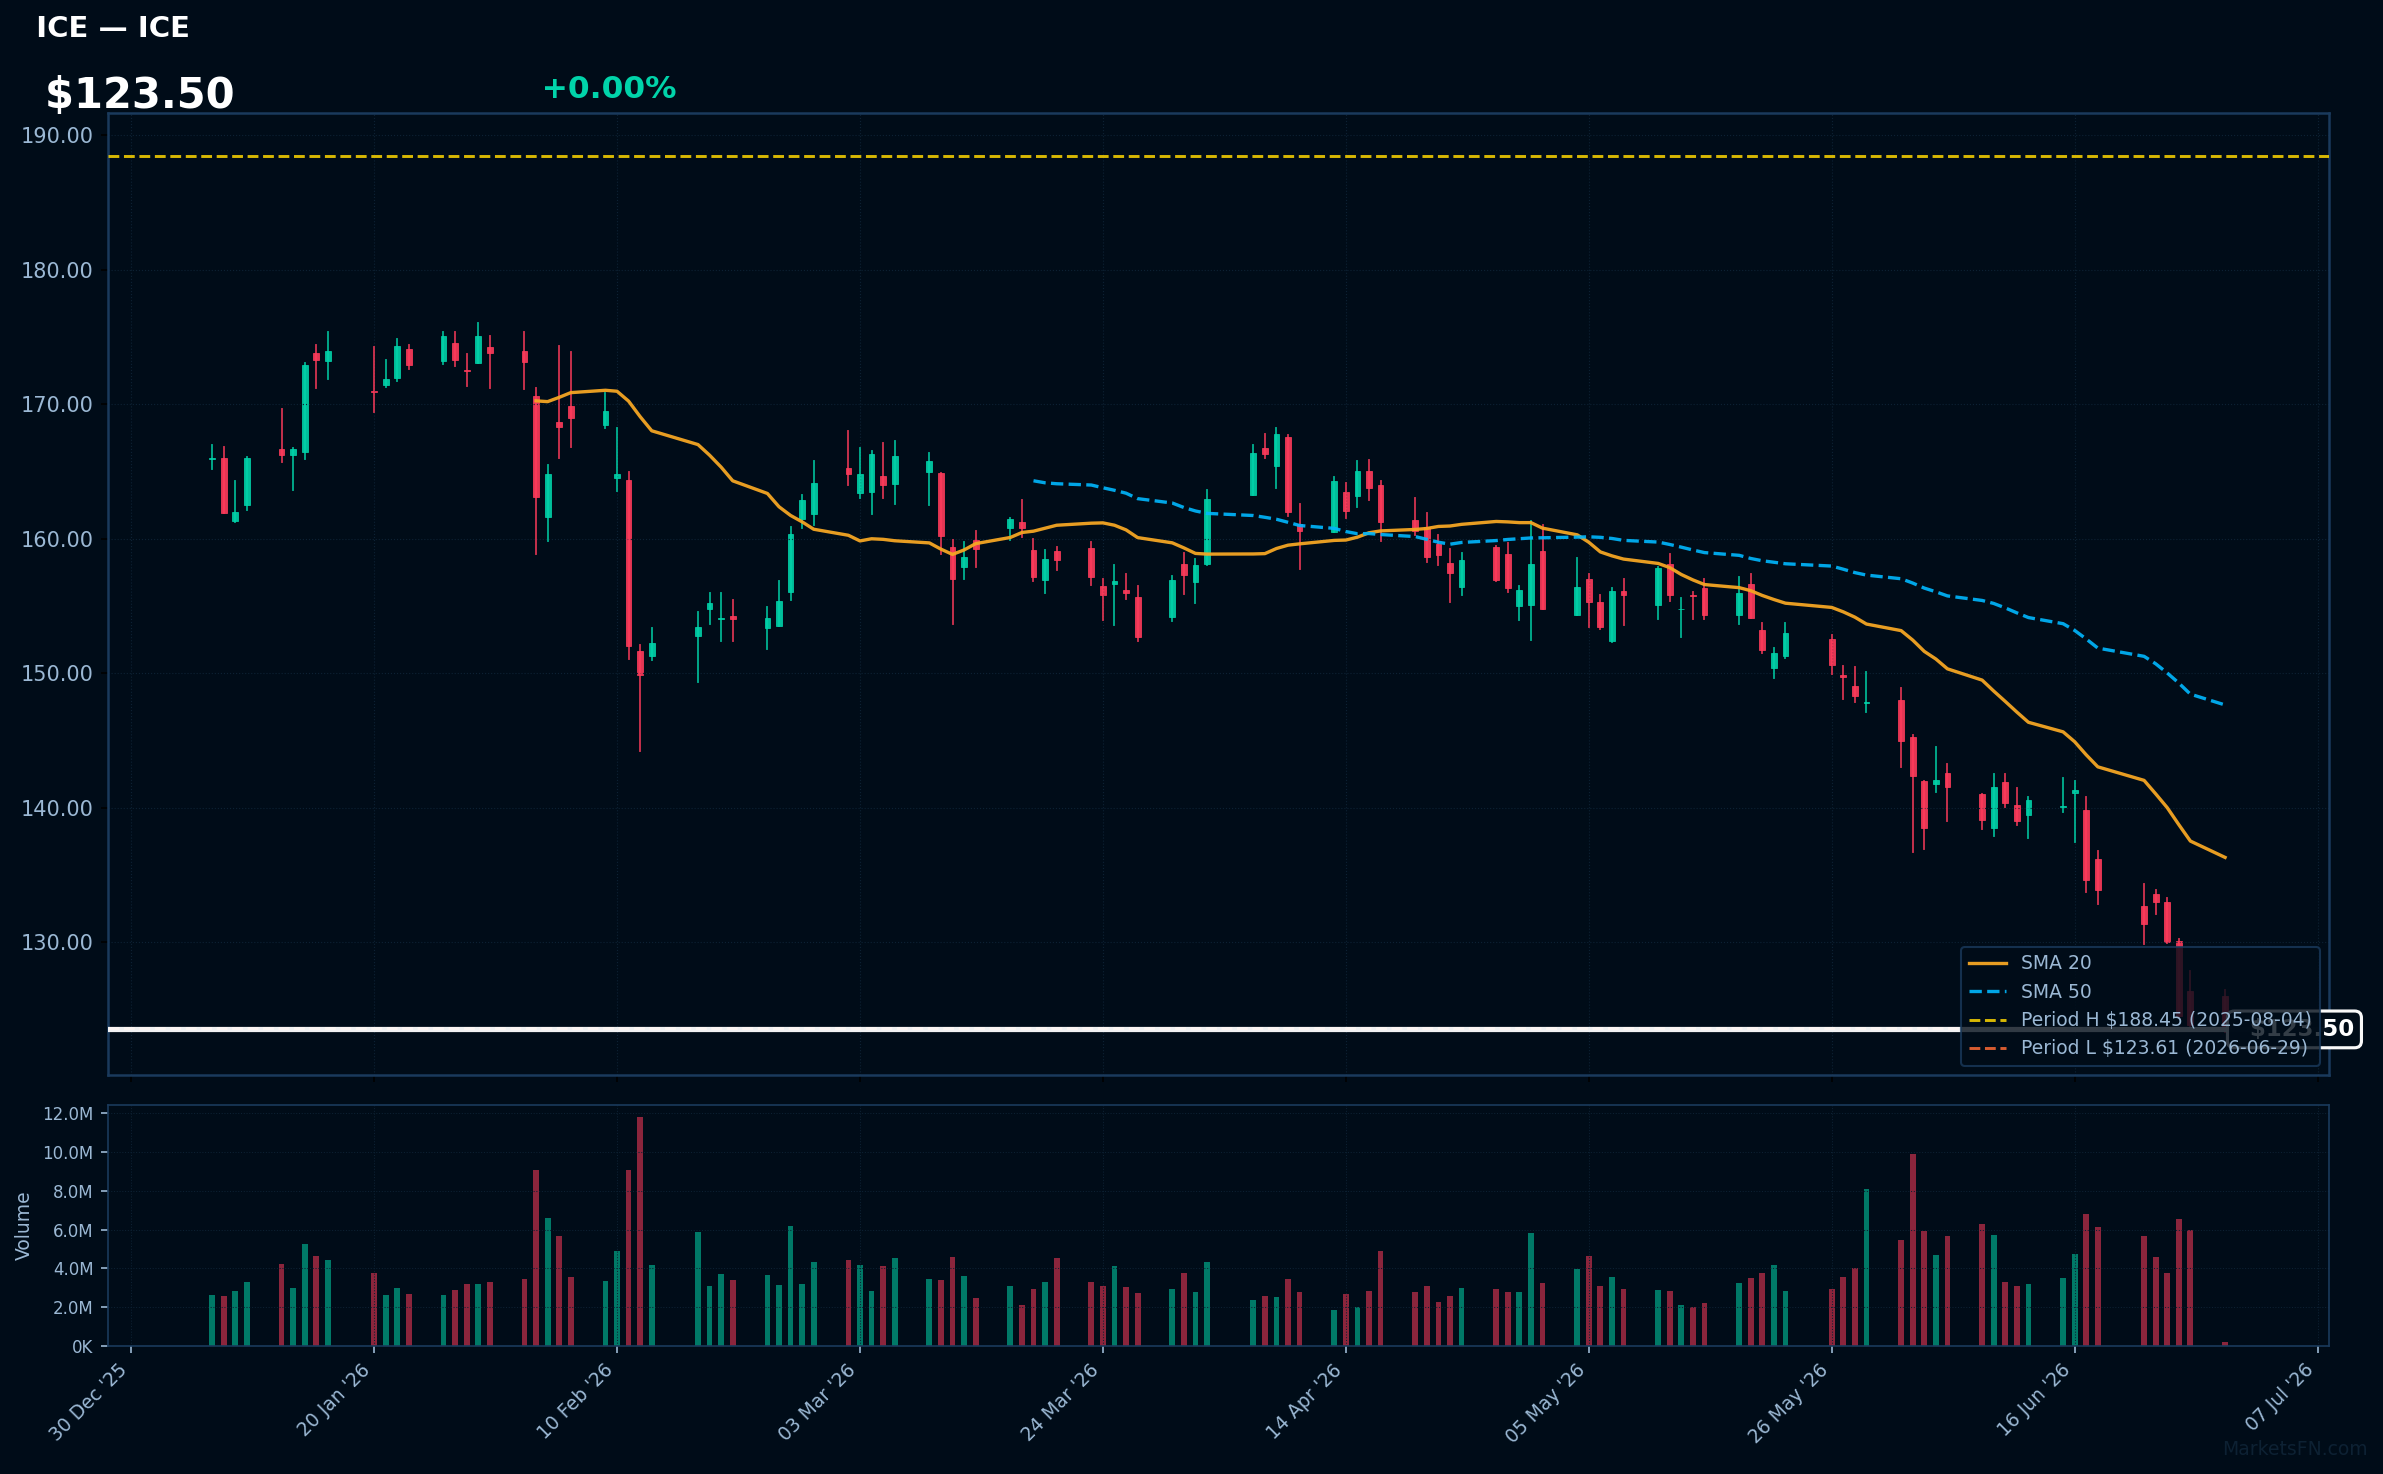
ICE | Intercontinental Exchange Inc | Financial | Price Last: $123.61 | % Realized: -32.63% | RSI: 21.9 | % above MA200: -21.6% | Trend: Below MA20, MA50, MA200
Intercontinental Exchange Inc (ICE) operates global exchanges, clearing houses, and data services for financial and commodity markets, providing critical infrastructure for trading and risk management; investors care due to its central role in global financial markets.
ICE's technical situation is bearish: RSI(14) at 21.9 indicates oversold conditions, with price below all MAs (MA20, MA50, MA200) in a sustained downtrend, and currently testing major support at its 52-Week low, a warning sign.
Related headlines
- ICE to Launch Economic Indicator Futures Contracts
- ICE First Look at Mortgage Performance: Mortgage Performance Holds Steady Despite Calendar-Driven Rise in Delinquencies
- ICE & OKX Are Getting Ready to Drink Coinbases Tokenized Milkshake
- ICE Invests in OKX at $25 Billion to Launch Tokenized NYSE Stocks
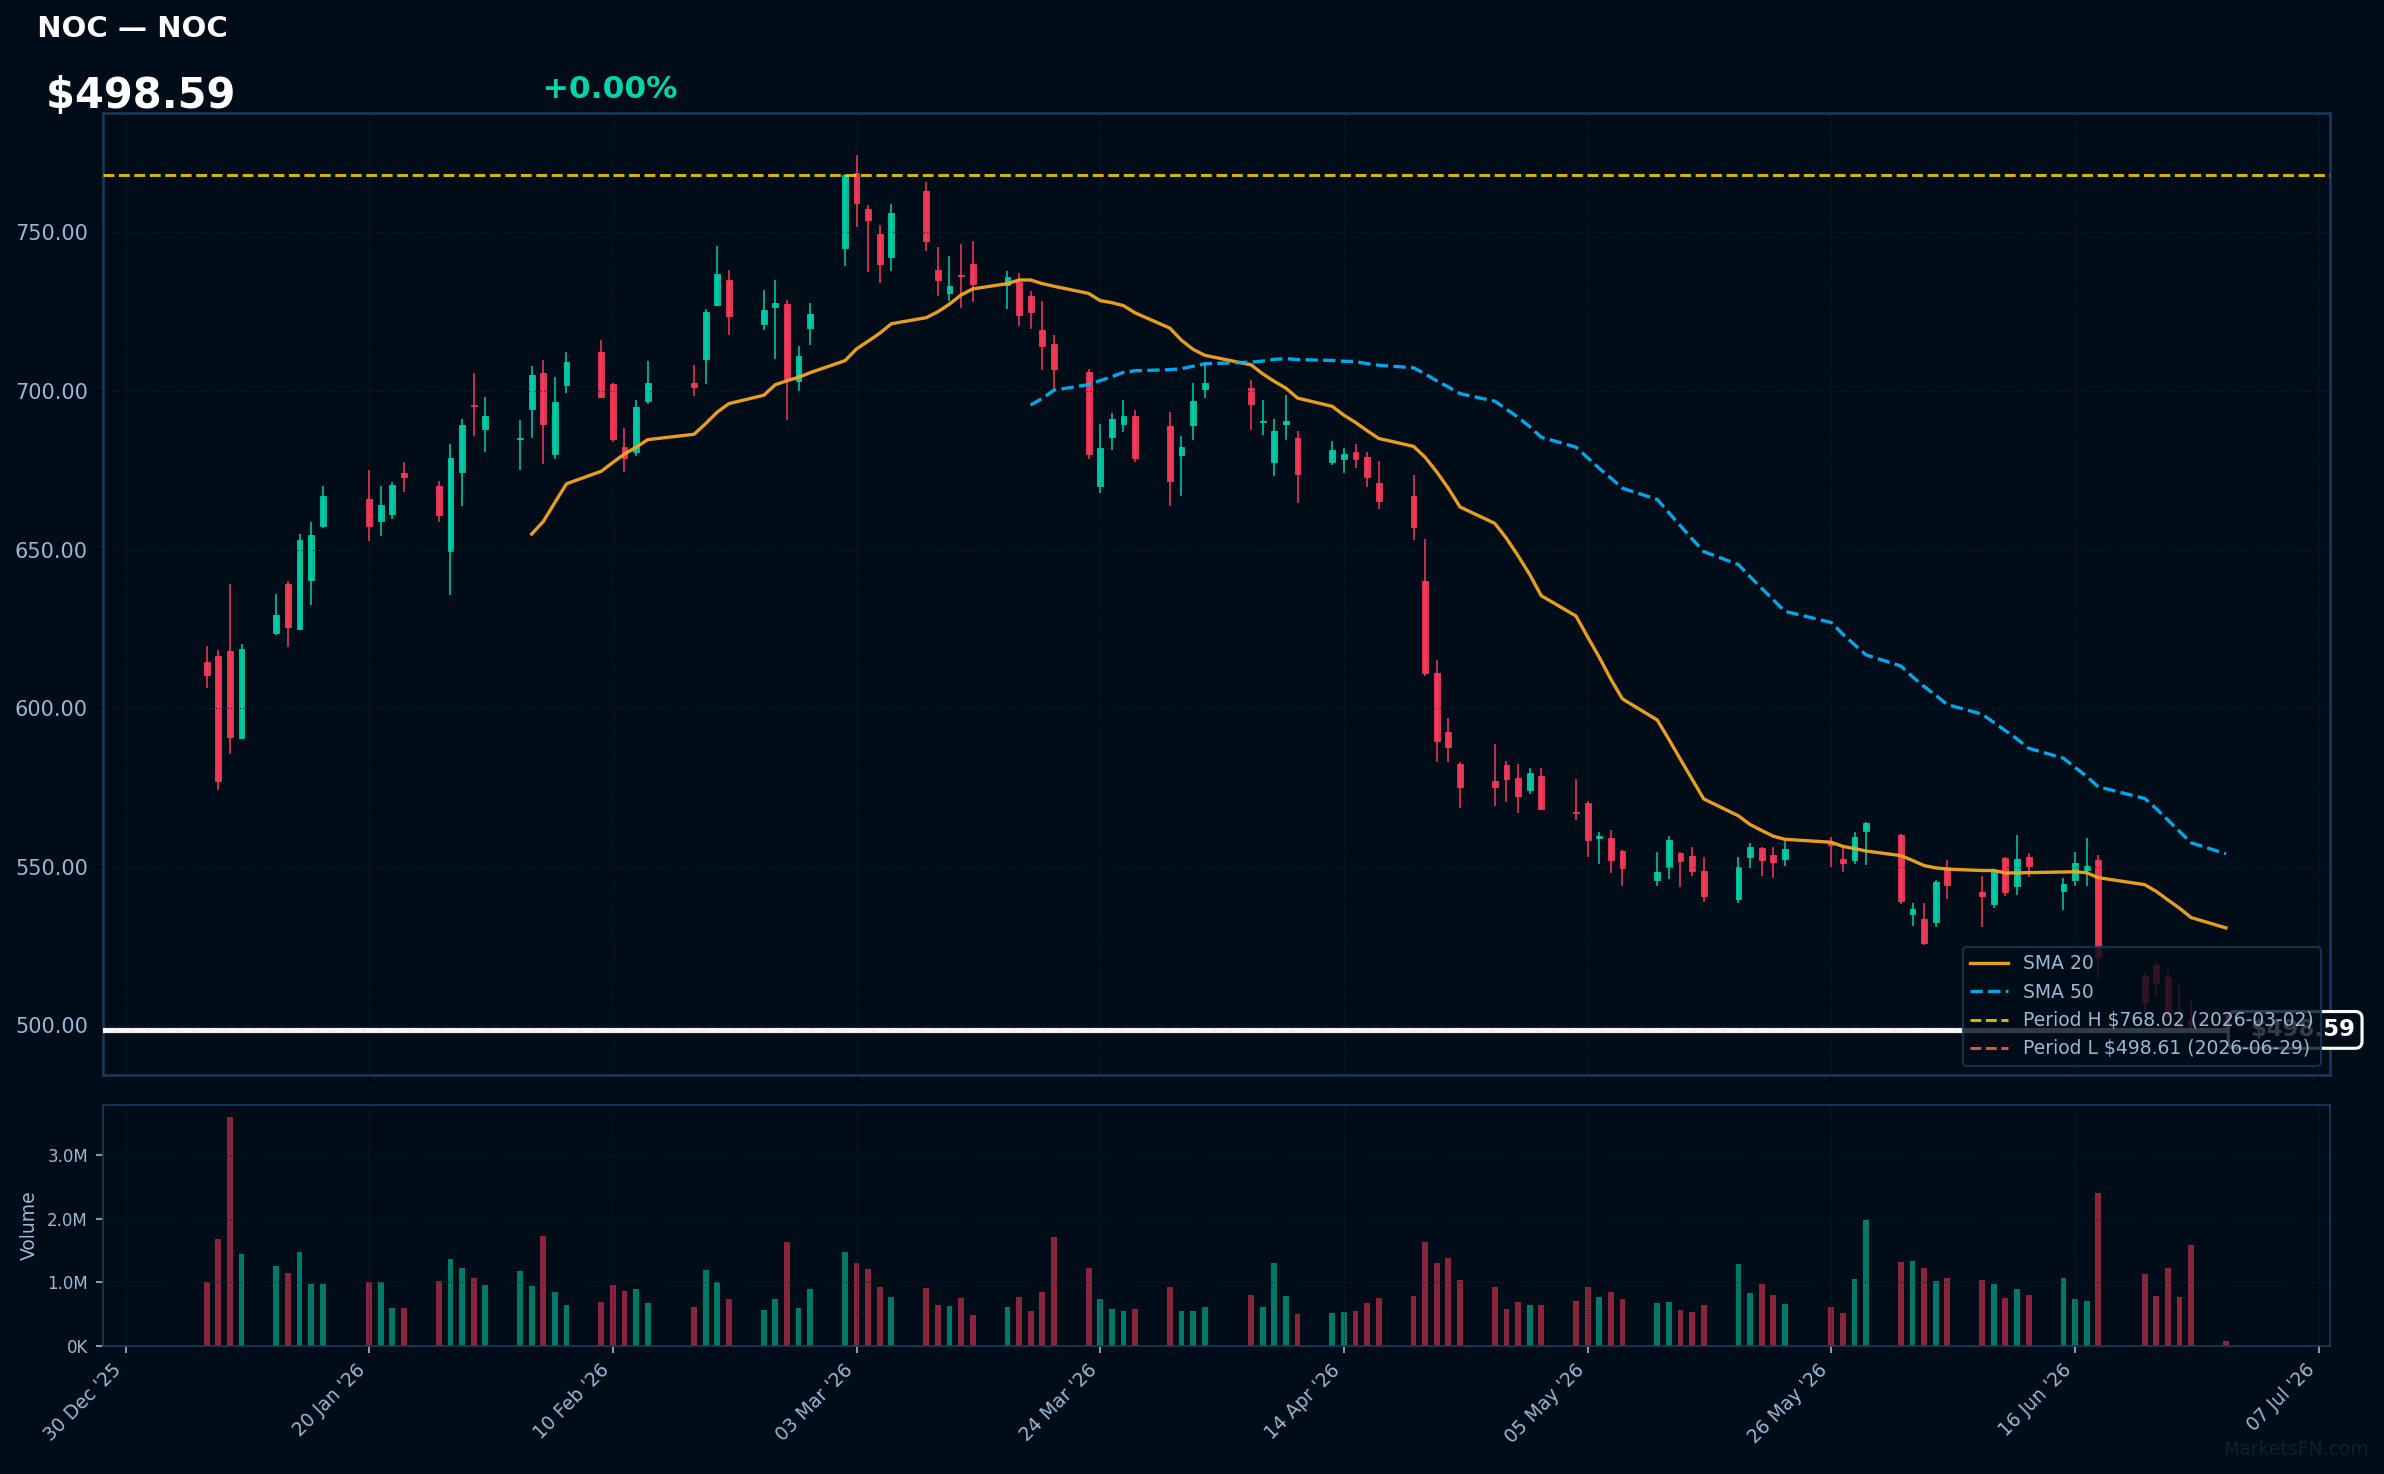
NOC | Northrop Grumman Corp | Industrials | Price Last: $498.61 | % Realized: -0.27% | RSI: 30.1 | % above MA200: -18.7% | Trend: Below MA20, MA50, MA200
Northrop Grumman Corp is a leading defense contractor specializing in advanced aerospace systems, cybersecurity, and electronic warfare solutions. Investors care due to its significant role in government defense spending and potential for long-term contracts.
NOC's RSI(14) is 30.1, indicating oversold conditions. The bearish MA alignment (price < MA20 < MA50 < MA200) and 0.0% proximity to 52-Week low suggest a sustained downtrend and testing of major support, potentially a warning sign.
Related headlines
- Northrop Grumman Announces Date for Second Quarter 2026 Financial Results and Webcast
- L3Harris, Northrop Win Pentagon Contracts. Karman Bolsters AI Efforts.
- Northrop Grumman Selects Apex for Space-Based Missile Defense Demonstration (NOC)
- Northrop Grumman to Participate in Bernstein's 42nd Annual Strategic Decisions Conference
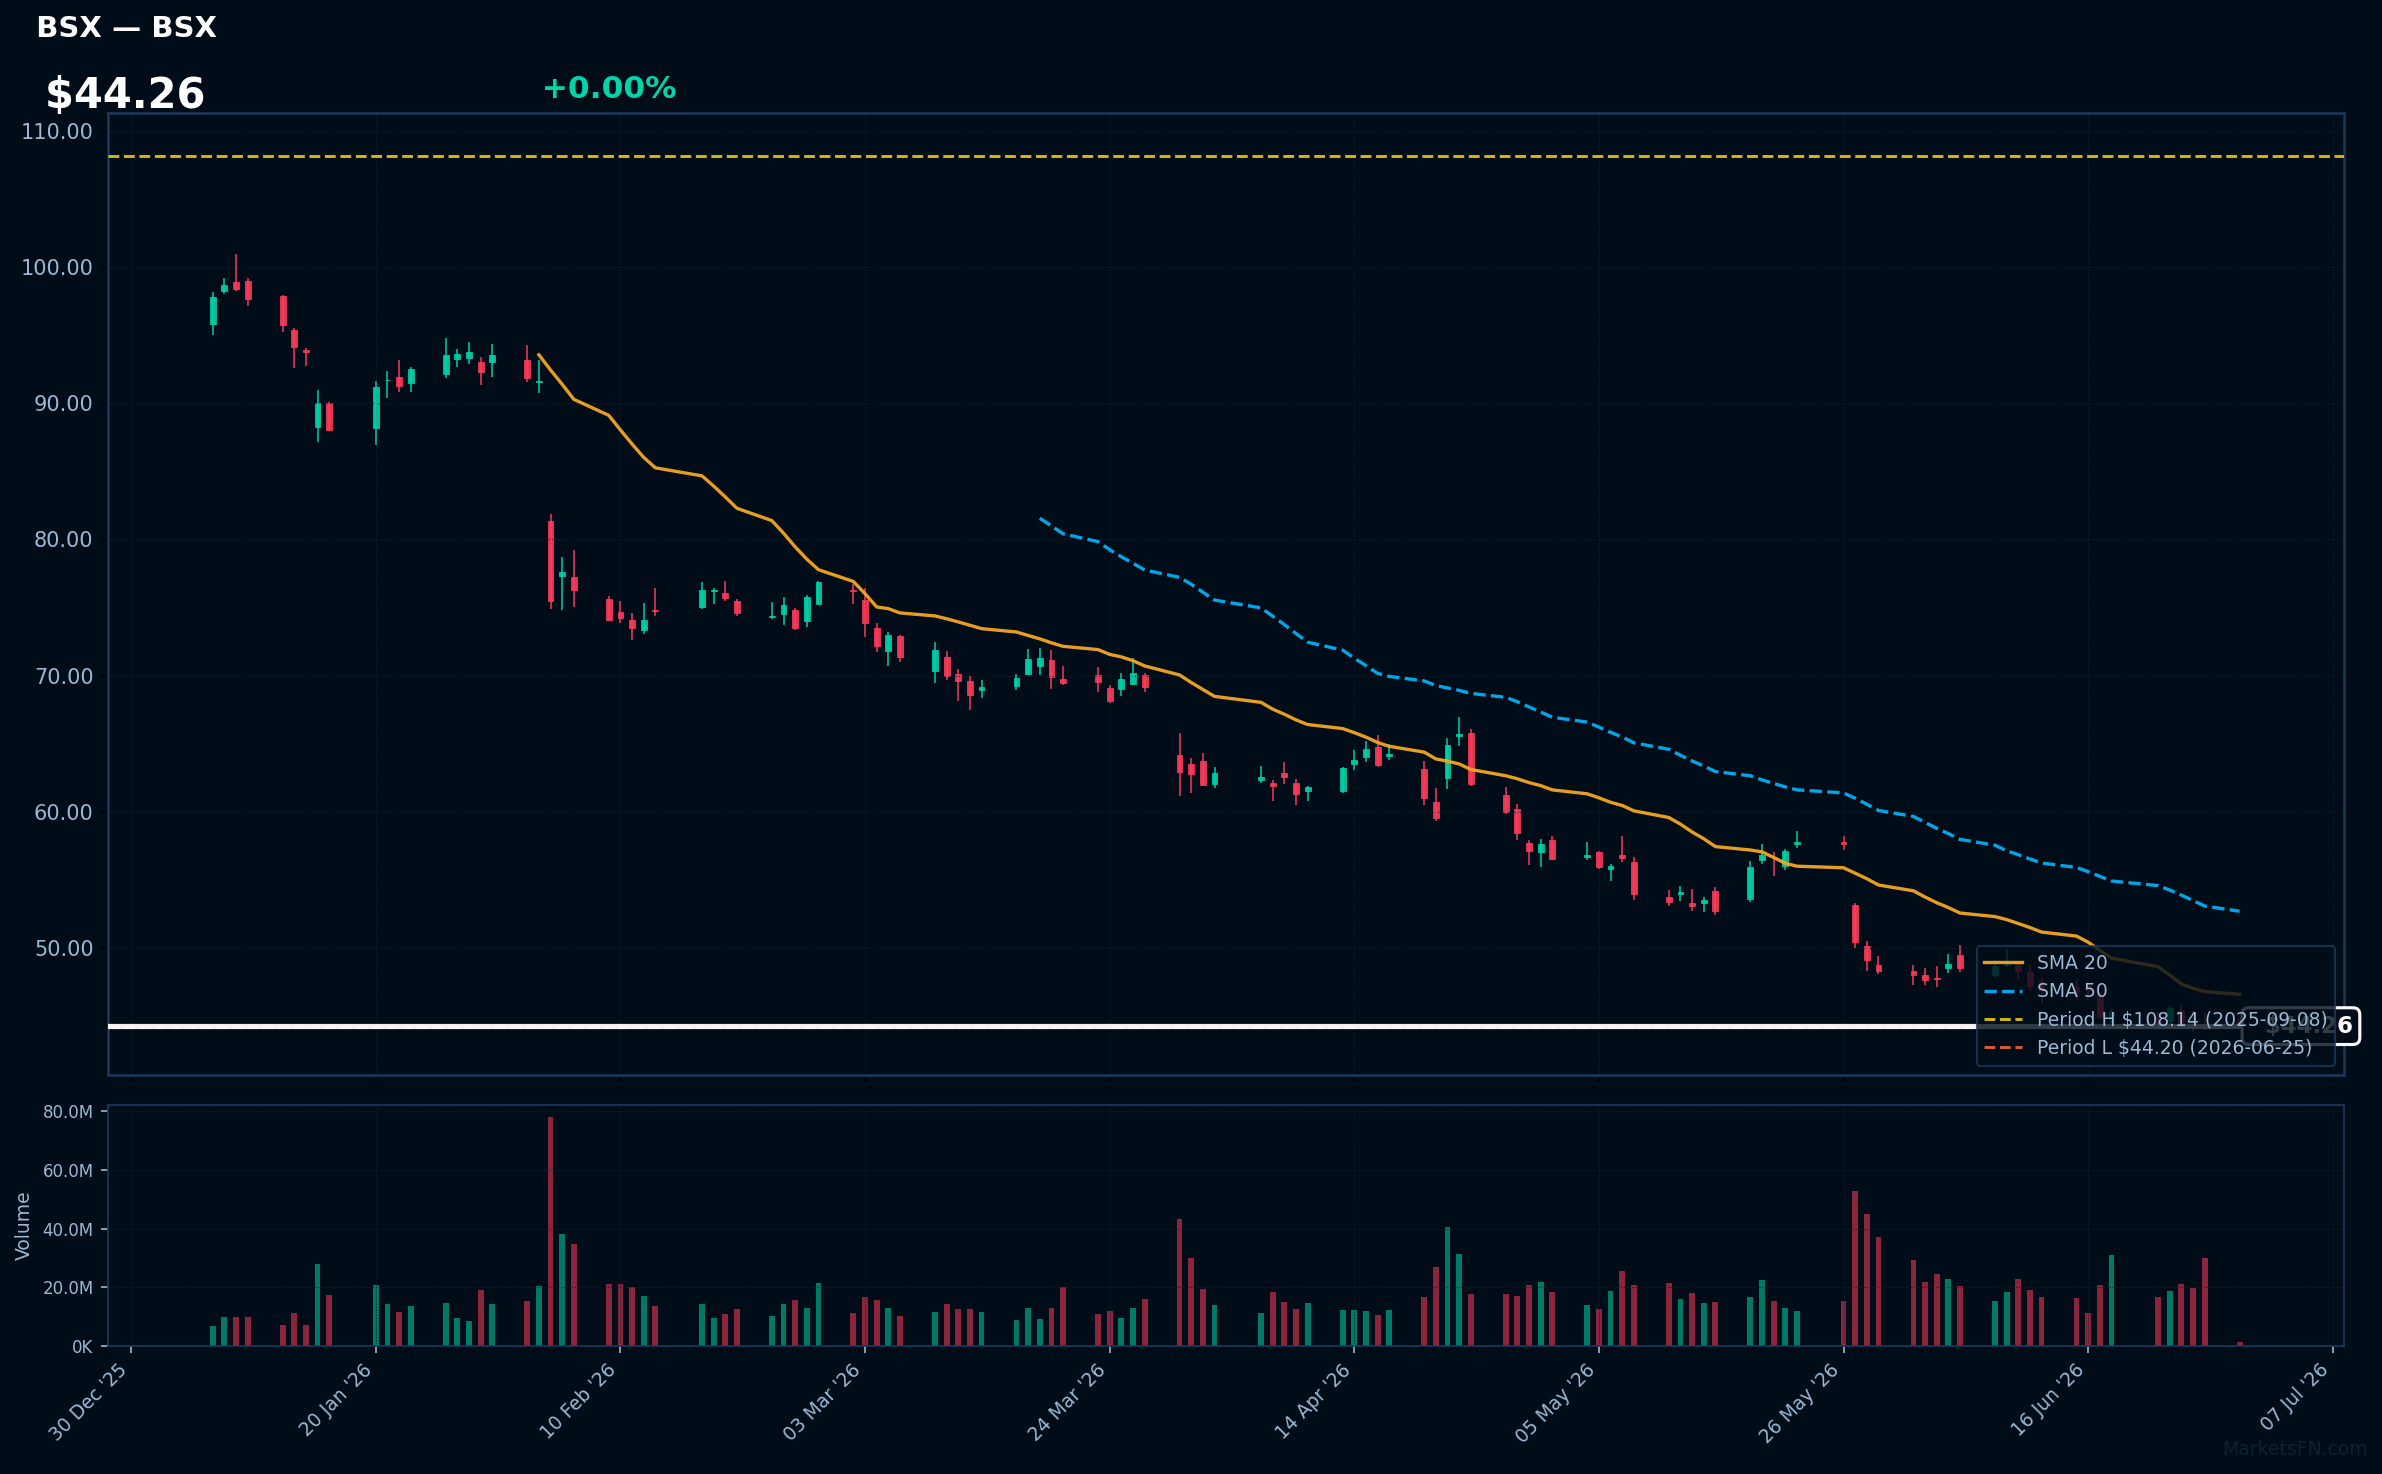
BSX | Boston Scientific Corp | Healthcare | Price Last: $44.24 | % Realized: -58.81% | RSI: 29.5 | % above MA200: -44.2% | Trend: Below MA20, MA50, MA200
Boston Scientific Corp (BSX) develops and manufactures medical devices, including stents, pacemakers, and neurostimulation devices, treating conditions like cardiovascular disease and chronic pain. Investors should care about its innovation pipeline and market share in the medical device industry.
BSX's technical situation is bearish, with an RSI(14) of 29.5 indicating oversold conditions, and a sustained downtrend as price ($44.26) remains below MA20, MA50, and MA200. The stock is 0.1% above its 52-Week low, testing major support.
Related headlines
Market Commentary
The S&P 500 stocks listed near 52-week extremes indicate a significant price movement, with some stocks reaching new highs and others hitting lows. Stocks like LLY, JNJ, GE, PANW, and PNC are at their 52-week highs, while TMUS, T, ICE, NOC, and BSX are near their 52-week lows.
The stocks at 52-week highs are from diverse sectors, including healthcare (LLY, JNJ), industrials (GE), information technology (PANW), and financials (PNC), suggesting a broad-based market movement. In contrast, the stocks near 52-week lows are from the communication services (TMUS, T), financials (ICE), industrials (NOC), and healthcare (BSX) sectors. This sector rotation may be driven by various macro themes, such as changes in interest rates, regulatory environments, or economic growth expectations.
Key levels to watch include the current prices of these stocks, as a break above or below their 52-week extremes could signal further price movements. Potential catalysts for these stocks include earnings announcements, mergers and acquisitions, and macroeconomic data releases, which could impact their respective sectors and the broader market.
Methodology: All 503 S&P 500 constituents screened. 52-week high = highest daily close over the past 252 trading days (approx. 1 year). 52-week low = lowest daily close over the same period. Distance = (current price / extreme − 1) × 100. Technical indicators computed on up to 1 year of daily OHLCV data.
Disclaimer: For informational purposes only. Not investment advice. Past performance is not indicative of future results.