Nasdaq 100 Bull & Bear Radar — June 29, 2026
· Stocks · QuoteReporter
Nasdaq 100 Bull & Bear Radar — June 29, 2026
A daily technical sweep of 101 Nasdaq 100 constituents ranked by session performance, enriched with RSI, MA20/MA50/MA200 trend signals, Bloomberg-style charts, and recent news.
Index-Wide Breadth
| Constituents tracked | 101 |
| Advancing | 66 (65.3%) |
| Declining | 35 (34.7%) |
| Average daily change | +0.66% |
| Above MA200 | 12 (11.9%) |
Top 10 Gainers
Today's strongest Nasdaq 100 performers. Sector leadership: Technology (6), Communication Services (2), Healthcare (1), Real Estate (1).
| Ticker | Company | Sector | Price | Day % | 1W % | 1M % | RSI | vs MA200 | Trend |
|---|---|---|---|---|---|---|---|---|---|
| WDAY | Workday Inc | Technology | $124.21 | +9.18% | +6.23% | -0.23% | 47.4 | -29.7% | Below MA20, MA50, MA200 |
| DDOG | Datadog Inc | Technology | $239.77 | +8.52% | +7.52% | +8.10% | 62.2 | +56.0% | Above MA20, MA50, MA200 |
| APP | Applovin Corp | Communication Services | $477.08 | +6.99% | +1.57% | -15.98% | 45.2 | -11.8% | Below MA20, MA50, MA200 |
| BIIB | Biogen Inc | Healthcare | $216.03 | +6.97% | +9.89% | +9.68% | 69.4 | +22.6% | Above MA20, MA50, MA200 |
| ZS | Zscaler Inc | Technology | $132.26 | +6.83% | +5.94% | +4.63% | 48.4 | -36.4% | Above MA20 · Below MA50, MA200 |
| TTD | Trade Desk Inc | Communication Services | $18.37 | +6.00% | -0.76% | -17.59% | 41.2 | -44.1% | Below MA20, MA50, MA200 |
| MSFT | Microsoft Corporation | Technology | $372.97 | +5.71% | -1.69% | -9.62% | 40.4 | -16.7% | Below MA20, MA50, MA200 |
| CSGP | Costar Group, Inc | Real Estate | $30.25 | +5.62% | +0.43% | -6.40% | 40.2 | -45.4% | Below MA20, MA50, MA200 |
| TEAM | Atlassian Corporation | Technology | $78.74 | +5.44% | -4.81% | -11.60% | 40.8 | -33.0% | Below MA20, MA50, MA200 |
| PLTR | Palantir Technologies Inc | Technology | $112.93 | +5.28% | -12.10% | -14.78% | 34.5 | -28.9% | Below MA20, MA50, MA200 |
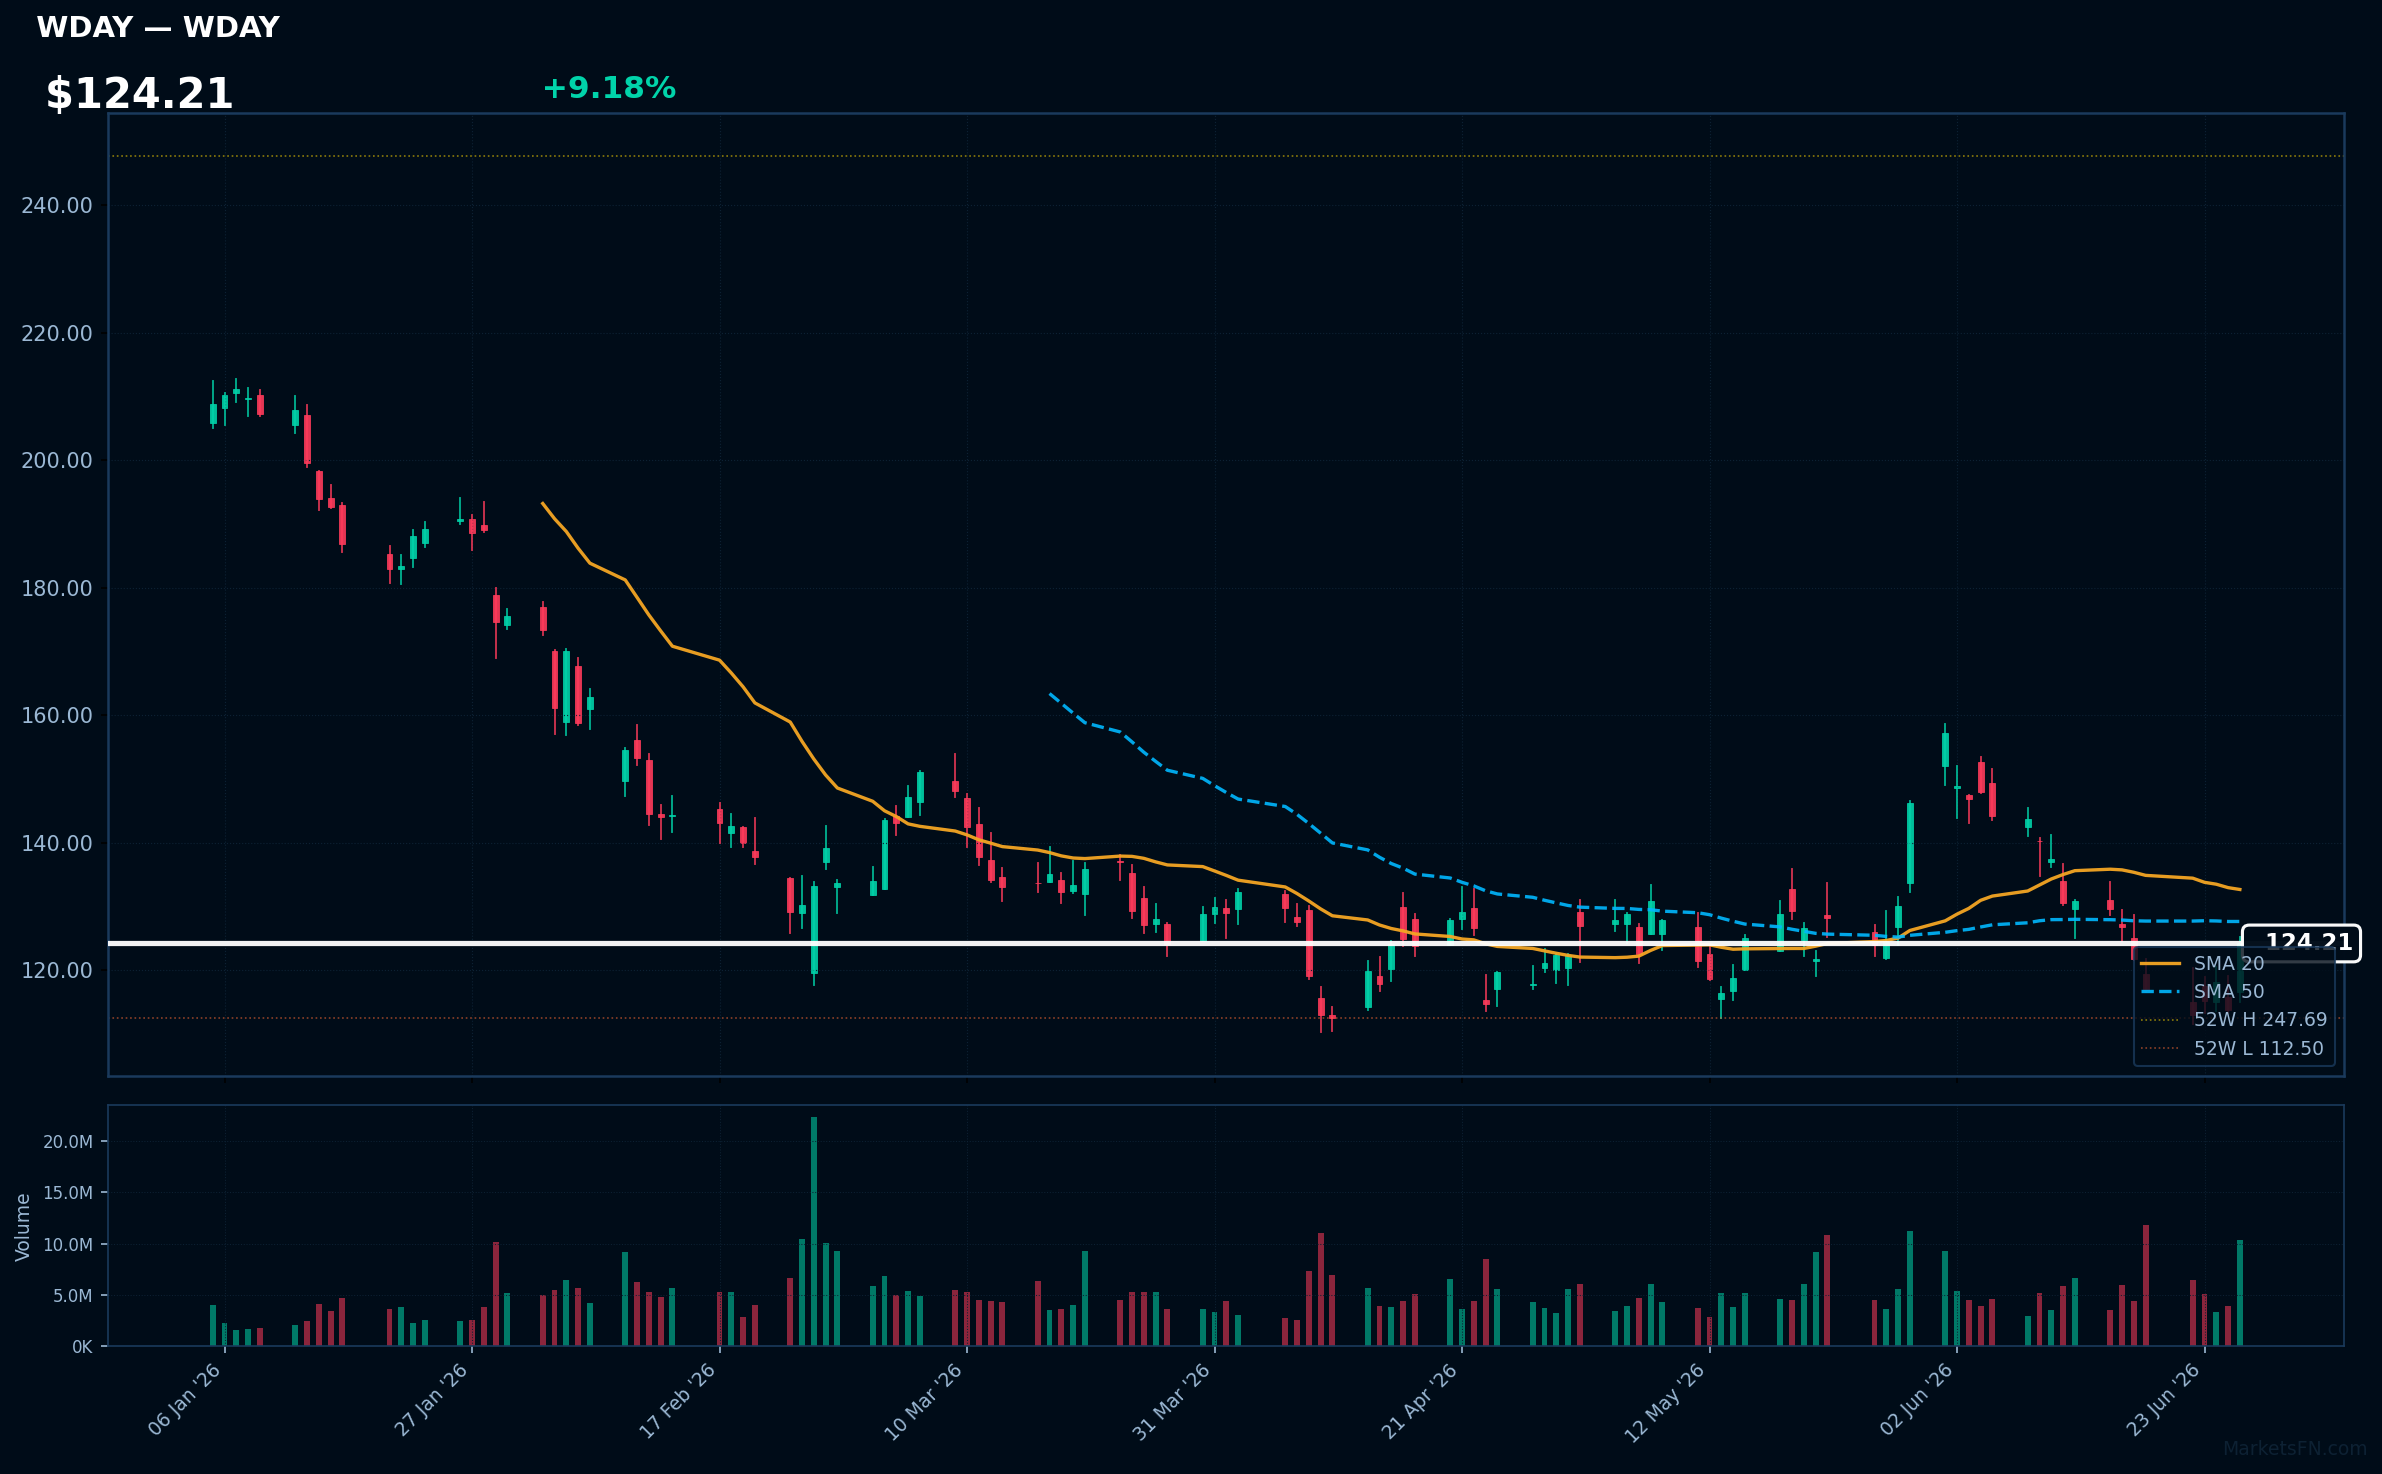
WDAY | Workday Inc | Technology | Price: $124.21 | Day: +9.18% | 1W: +6.23% | 1M: -0.23% | RSI: 47.4 | vs MA200: -29.7% | Trend: Below MA20, MA50, MA200
Recent headlines (last 12h)
- NOW, WDAY, ADBE, CRM: Software Stocks On The Rebound As OpenAI Threat Weakens
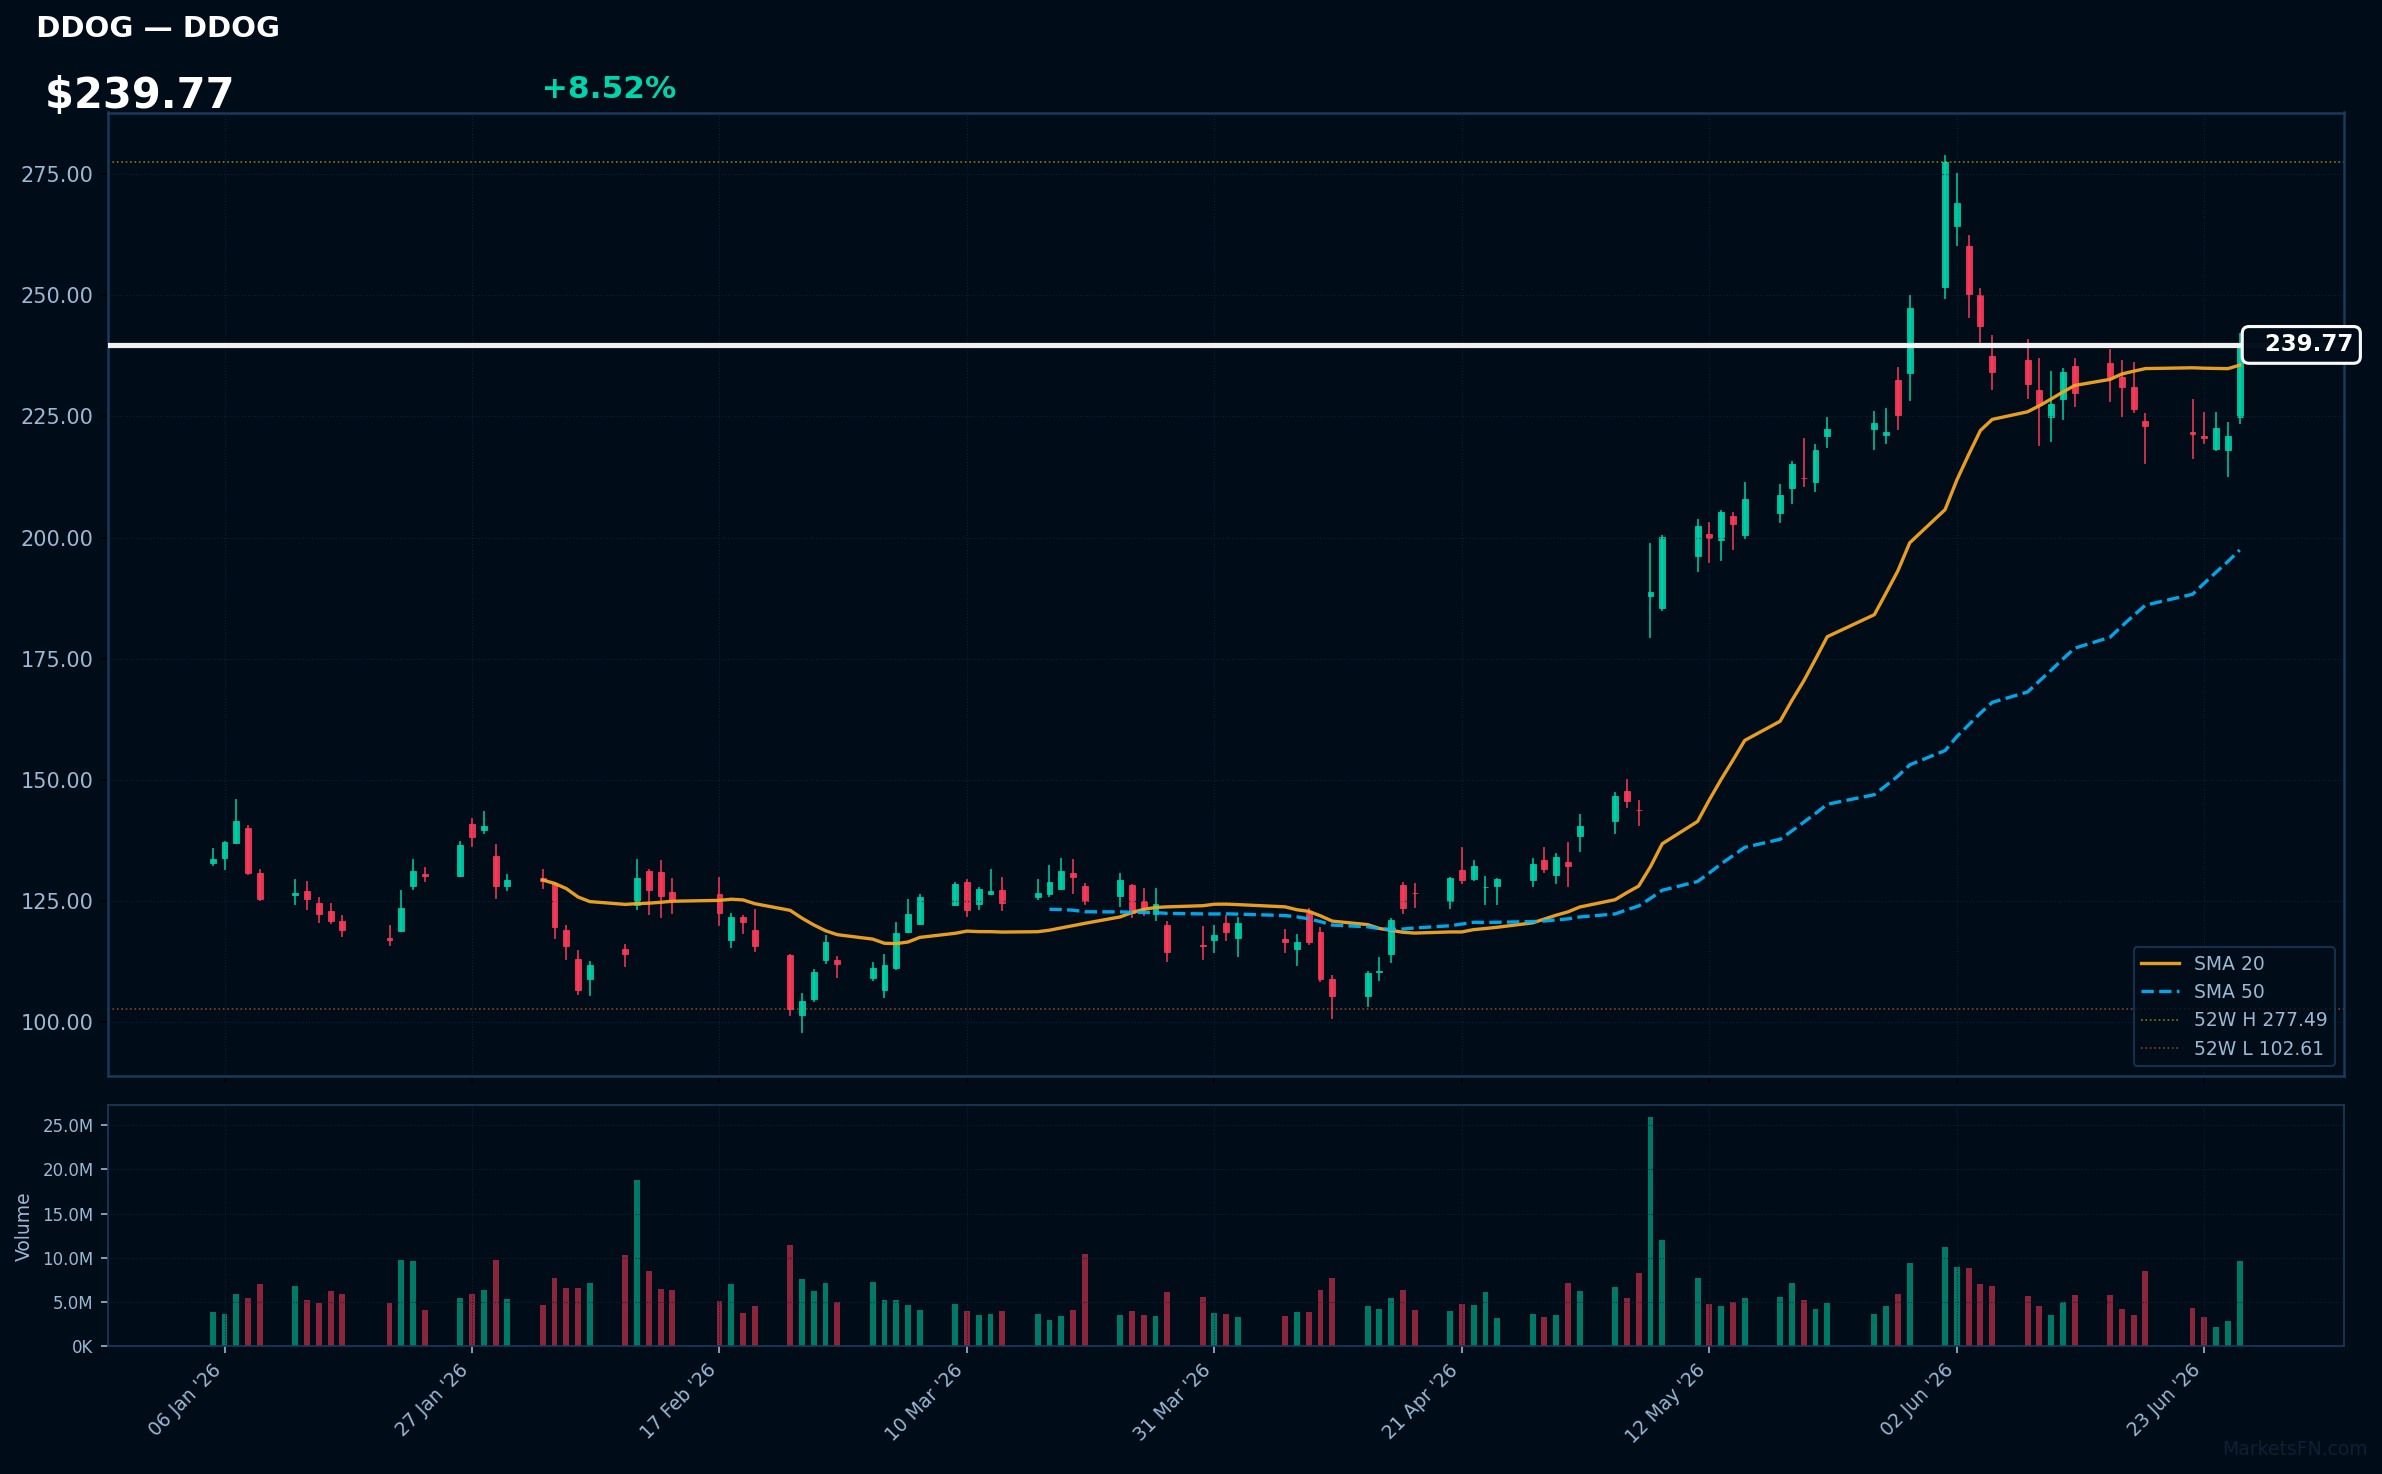
DDOG | Datadog Inc | Technology | Price: $239.77 | Day: +8.52% | 1W: +7.52% | 1M: +8.10% | RSI: 62.2 | vs MA200: +56.0% | Trend: Above MA20, MA50, MA200
Recent headlines (last 12h)
- NOW, WDAY, ADBE, CRM: Software Stocks On The Rebound As OpenAI Threat Weakens
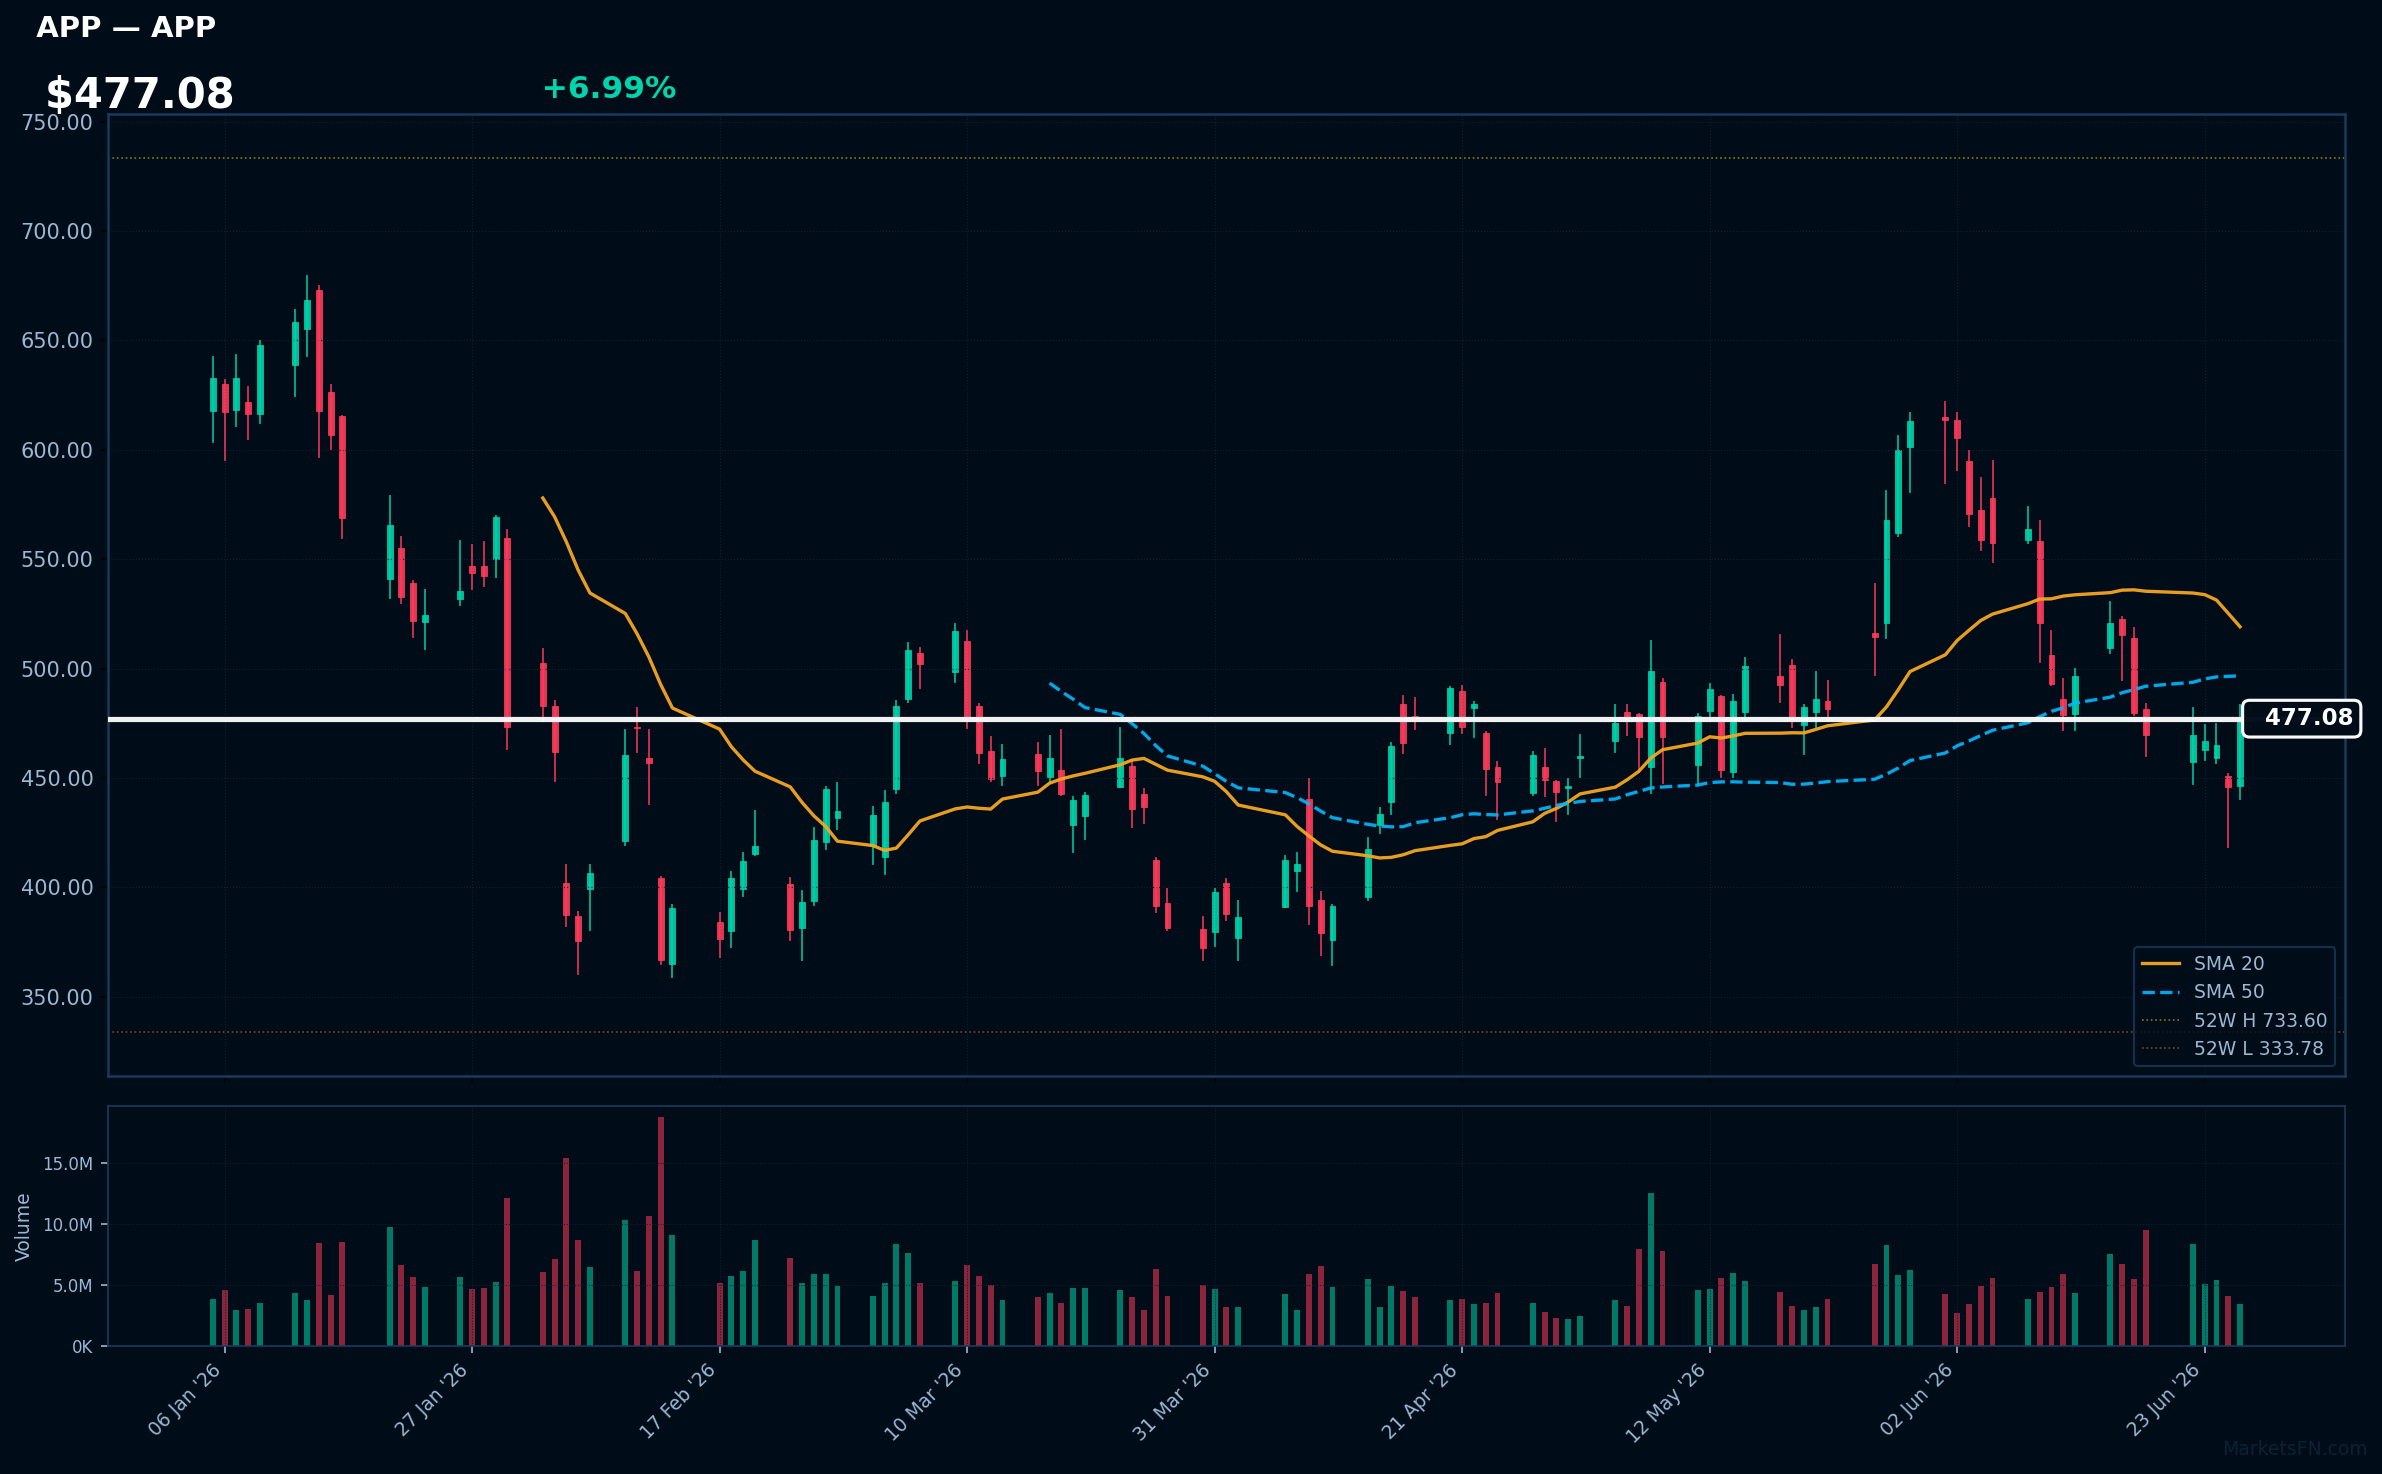
APP | Applovin Corp | Communication Services | Price: $477.08 | Day: +6.99% | 1W: +1.57% | 1M: -15.98% | RSI: 45.2 | vs MA200: -11.8% | Trend: Below MA20, MA50, MA200
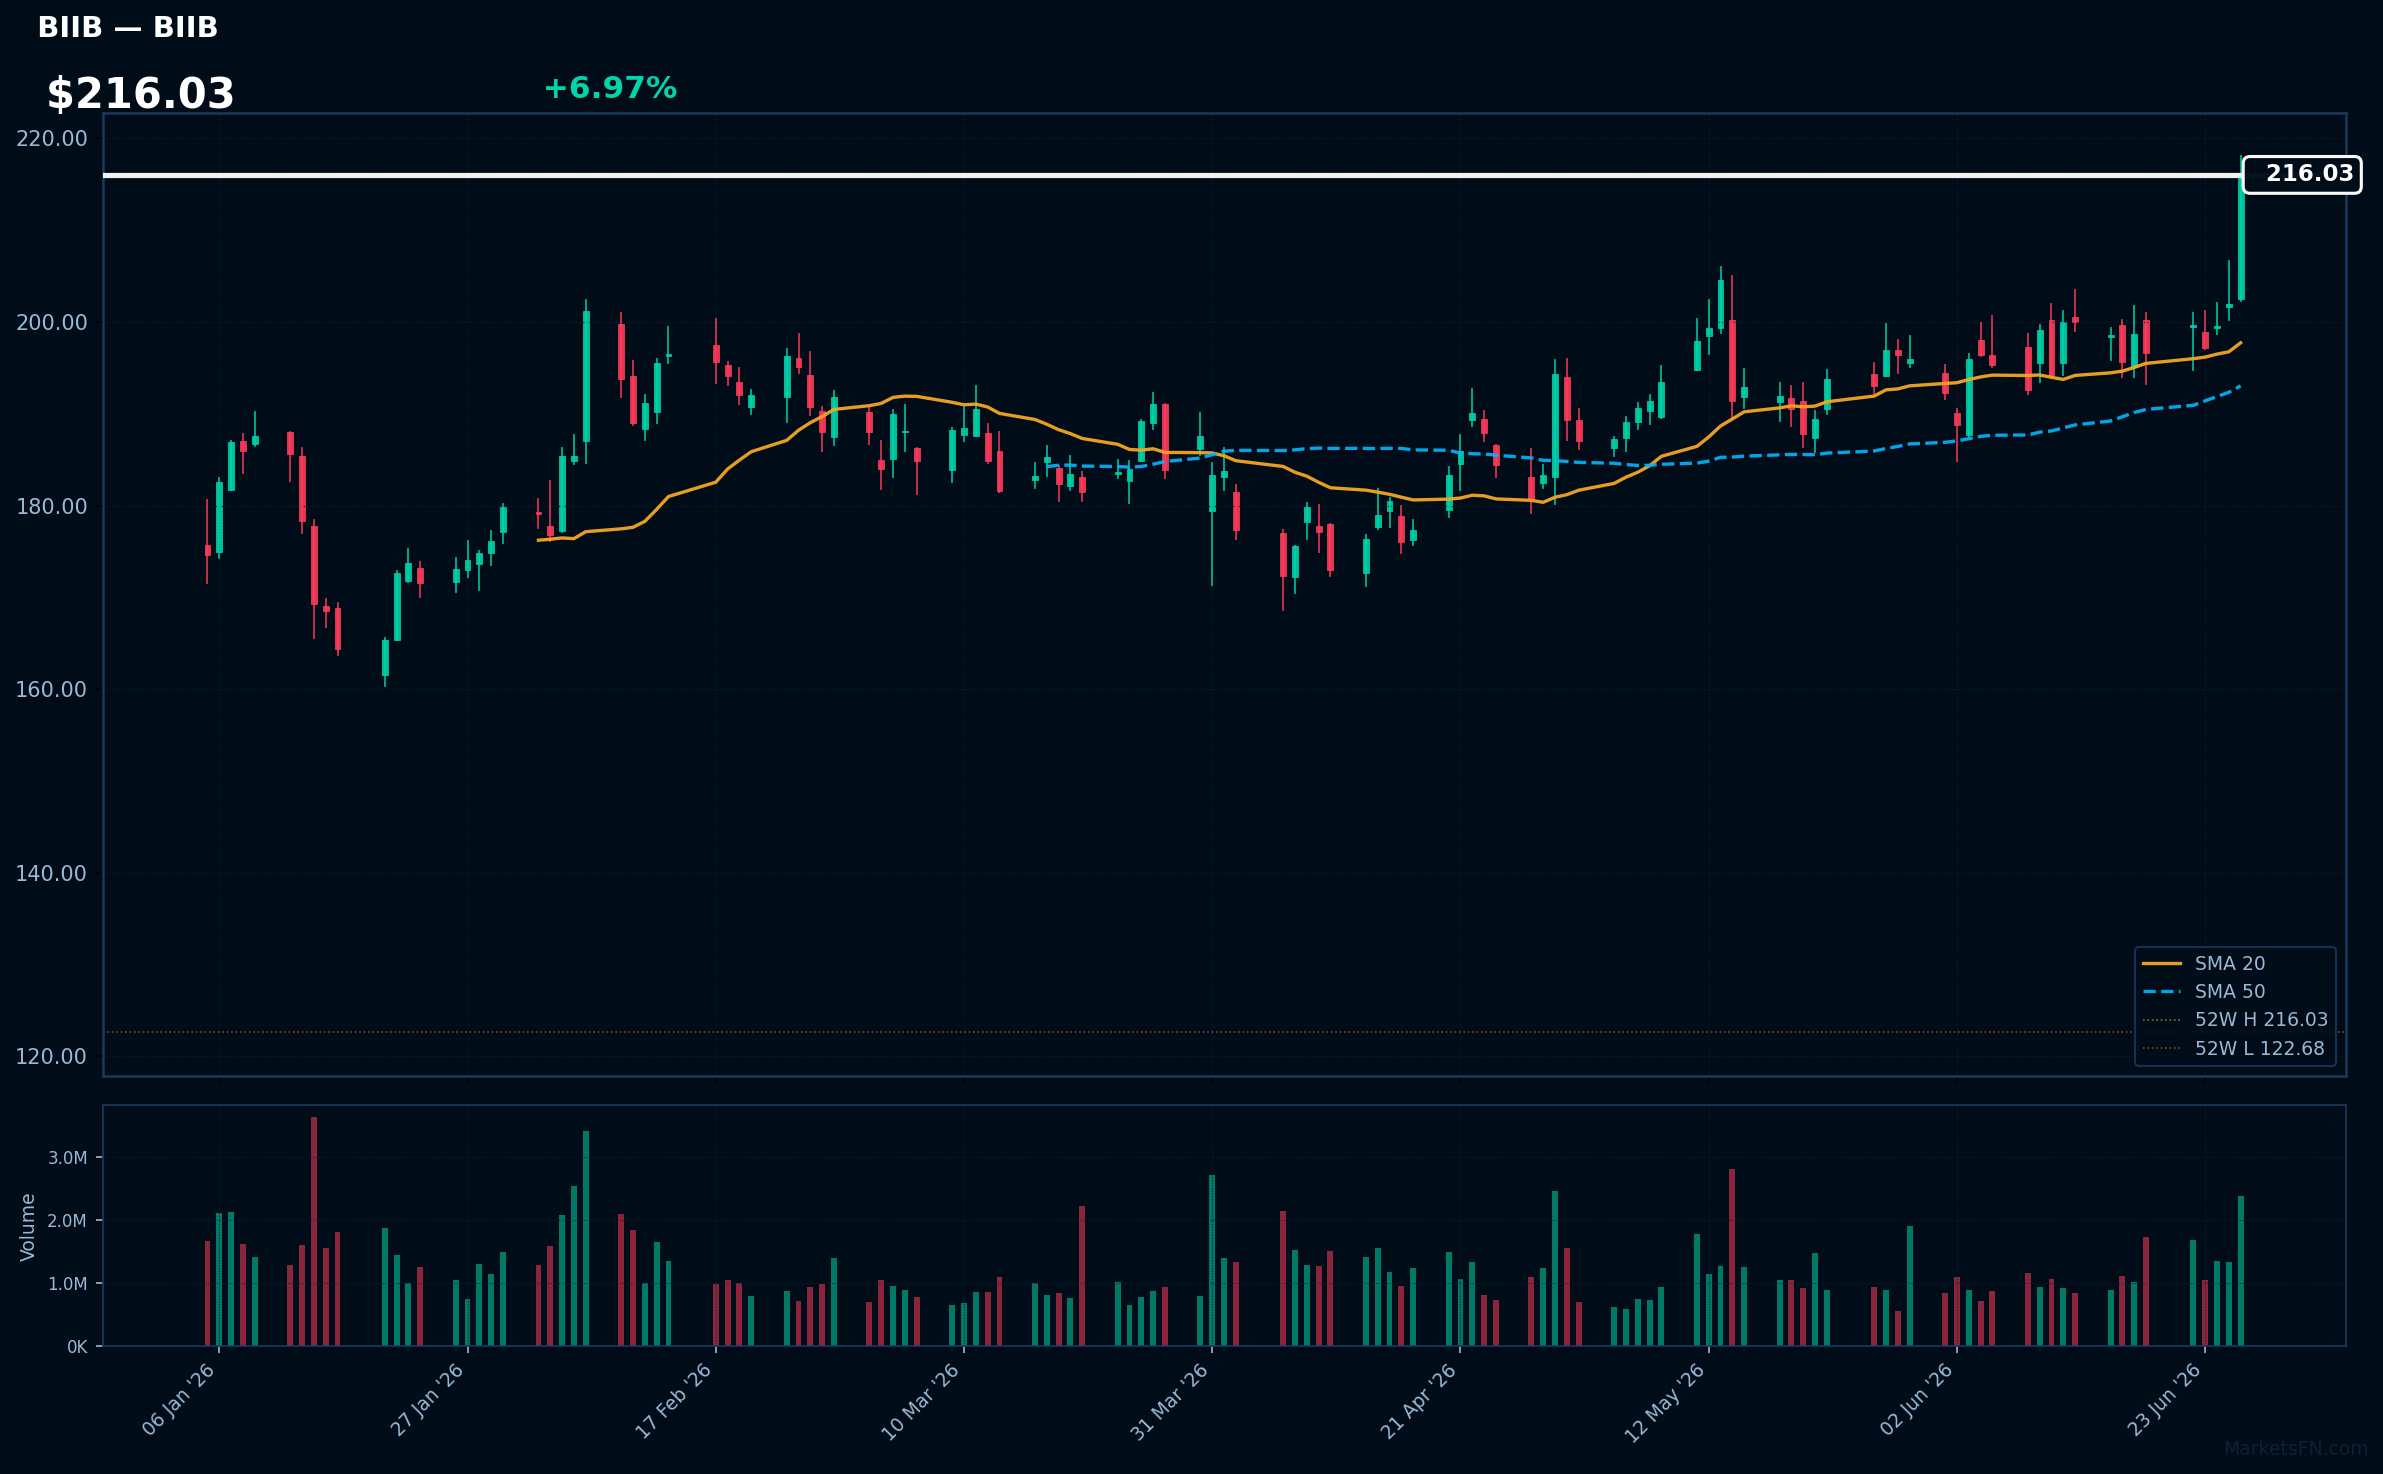
BIIB | Biogen Inc | Healthcare | Price: $216.03 | Day: +6.97% | 1W: +9.89% | 1M: +9.68% | RSI: 69.4 | vs MA200: +22.6% | Trend: Above MA20, MA50, MA200
Recent headlines (last 12h)
- Biogen trims Apellis pipeline and R&D team after $5.6bn takeover
- Biogen to Highlight Breadth of Alzheimer's Disease Portfolio at AAIC 2026, Including Phase 2 CELIA Data for Diranersen
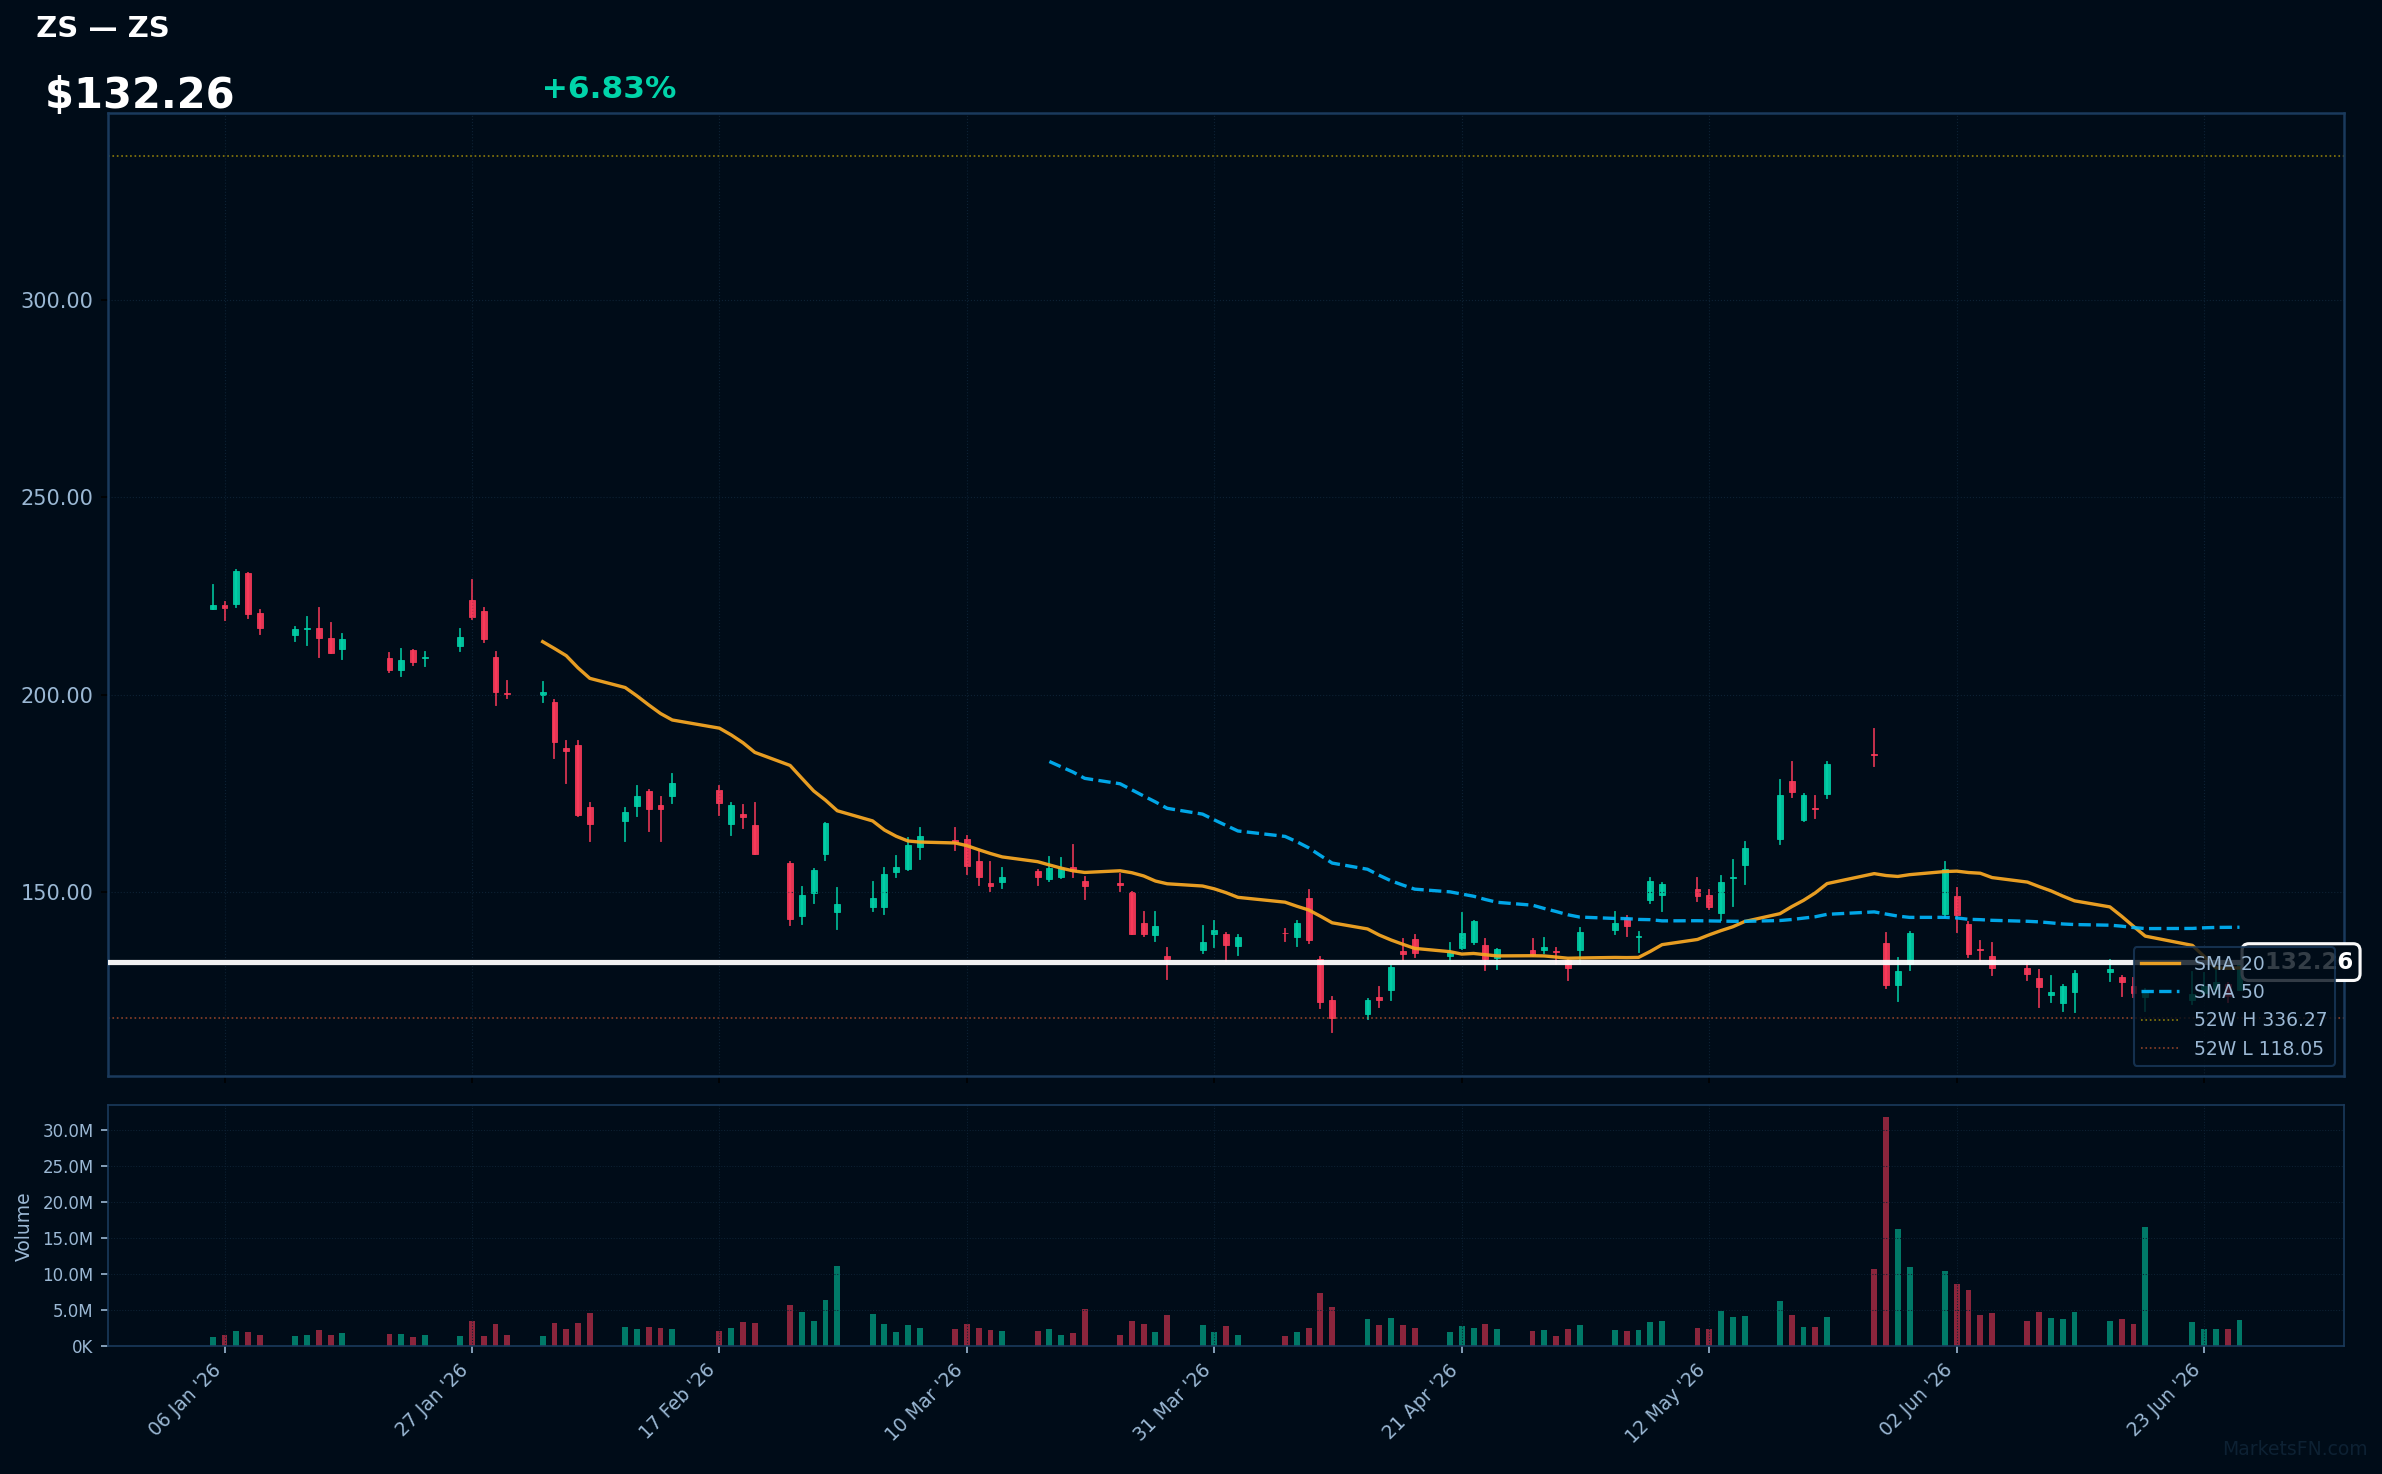
ZS | Zscaler Inc | Technology | Price: $132.26 | Day: +6.83% | 1W: +5.94% | 1M: +4.63% | RSI: 48.4 | vs MA200: -36.4% | Trend: Above MA20 · Below MA50, MA200
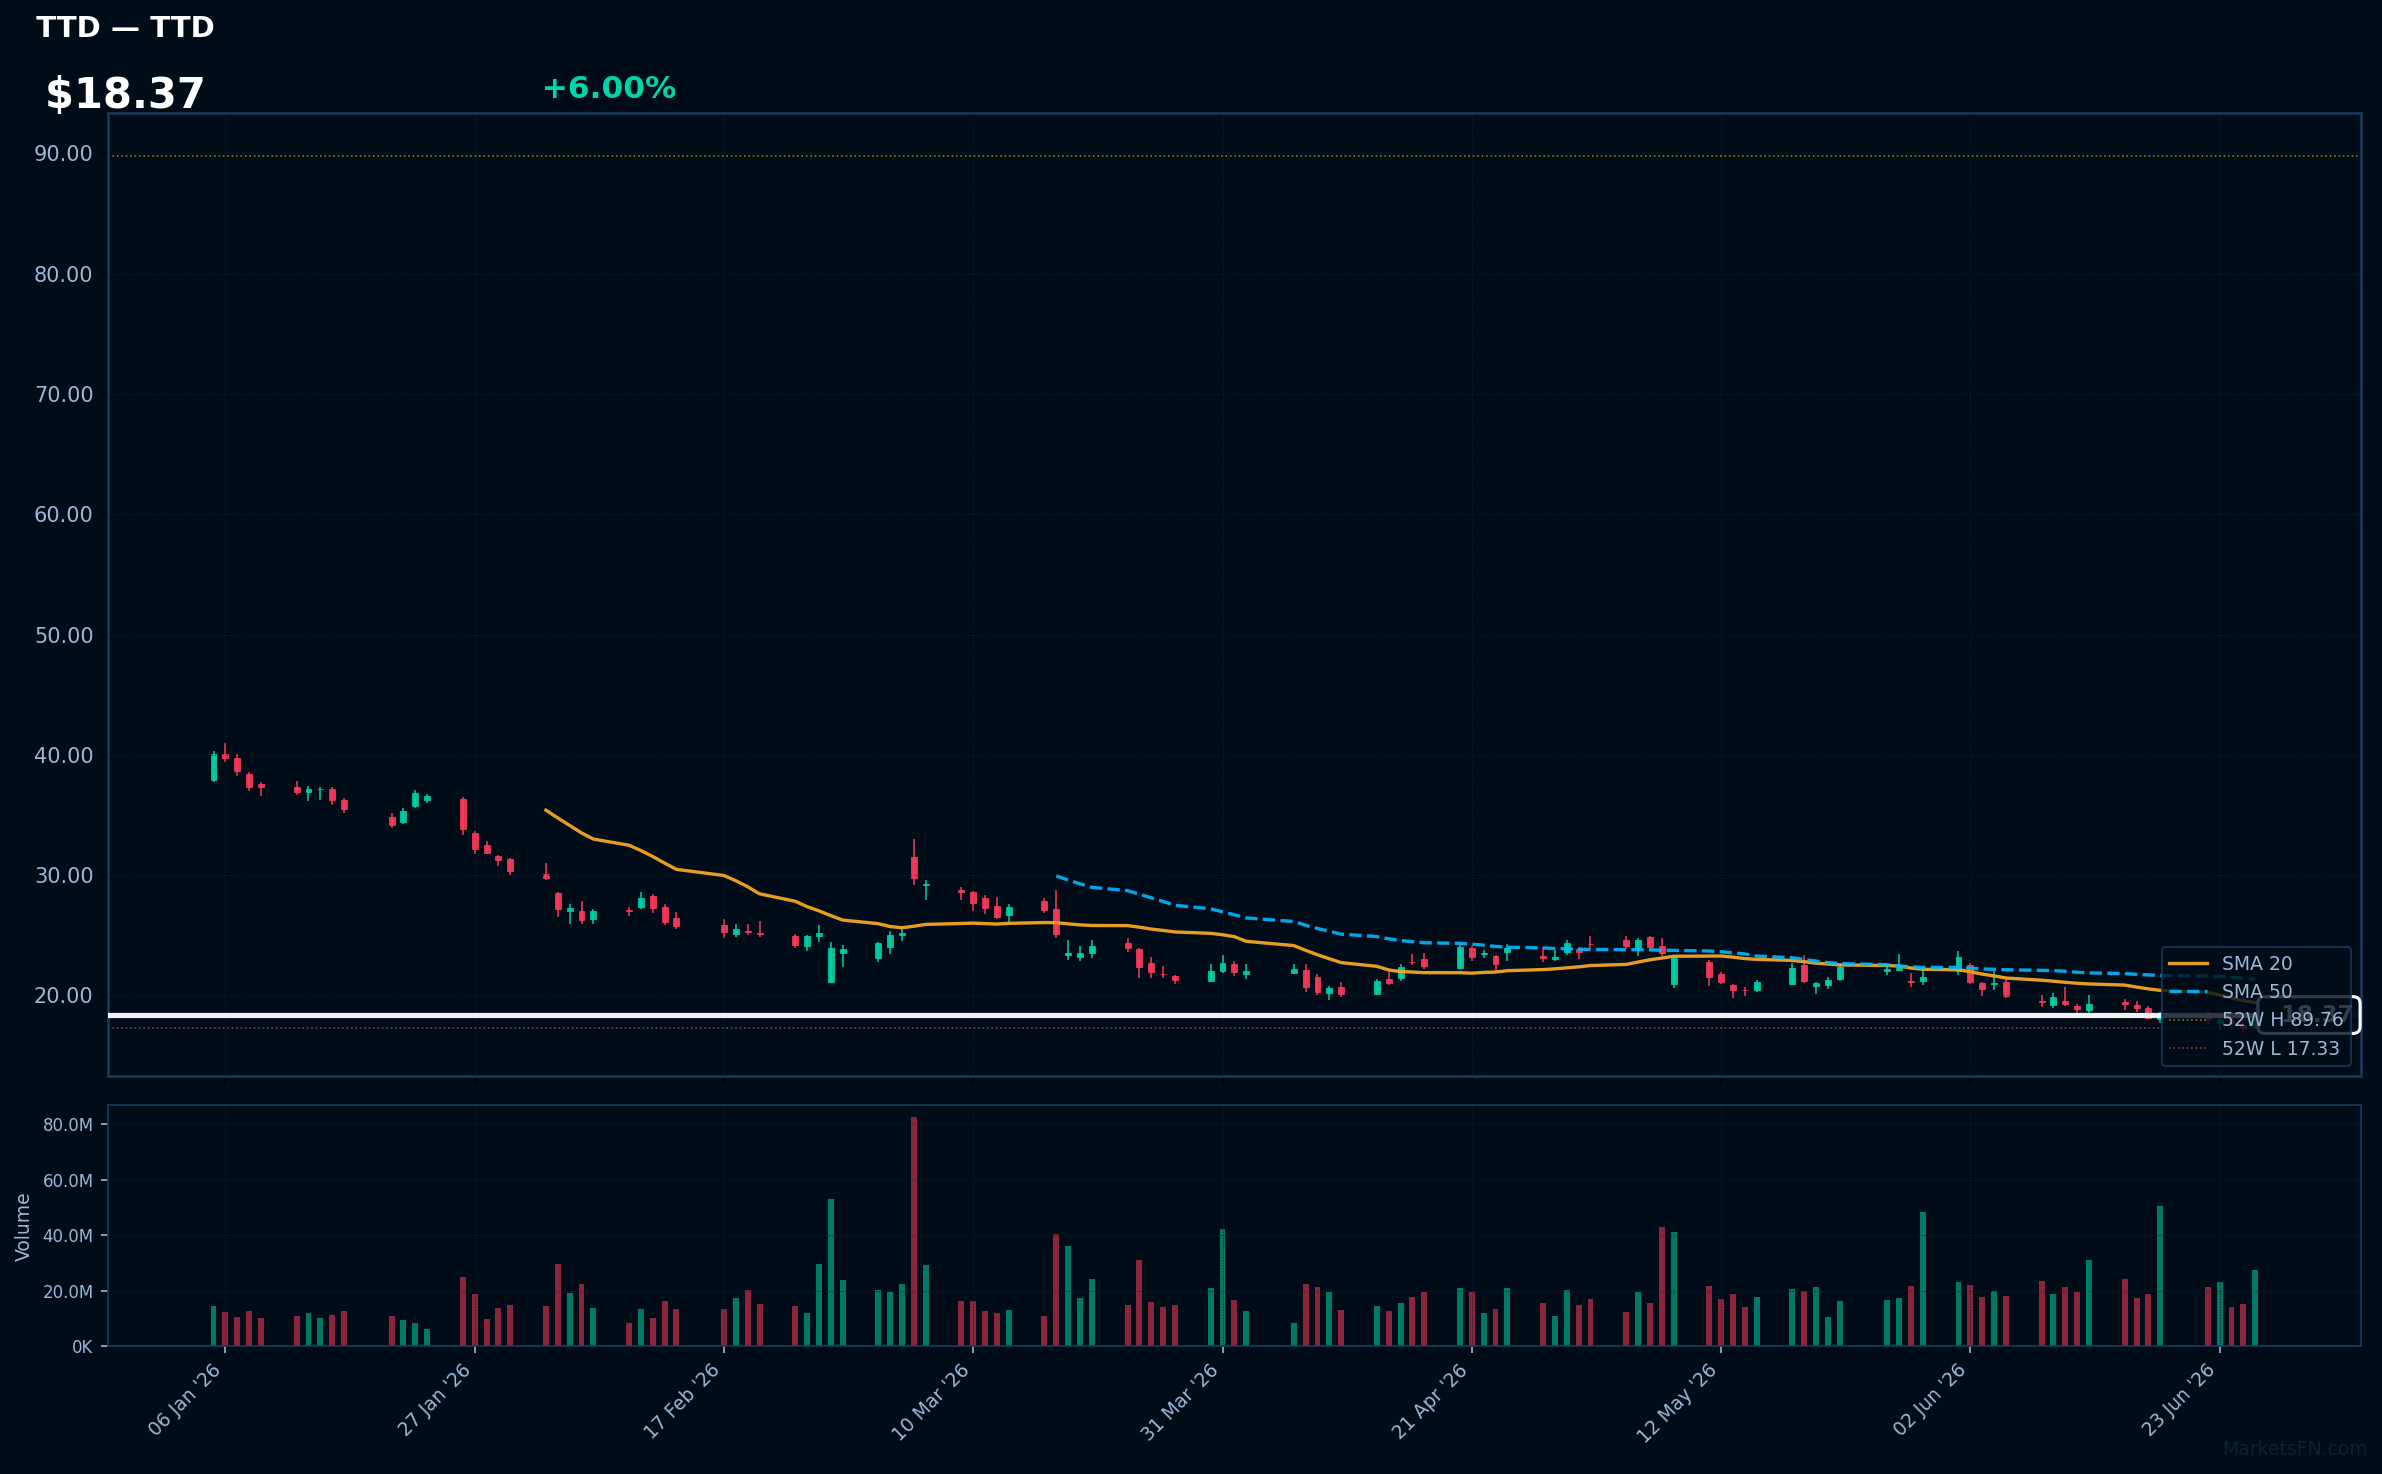
TTD | Trade Desk Inc | Communication Services | Price: $18.37 | Day: +6.00% | 1W: -0.76% | 1M: -17.59% | RSI: 41.2 | vs MA200: -44.1% | Trend: Below MA20, MA50, MA200
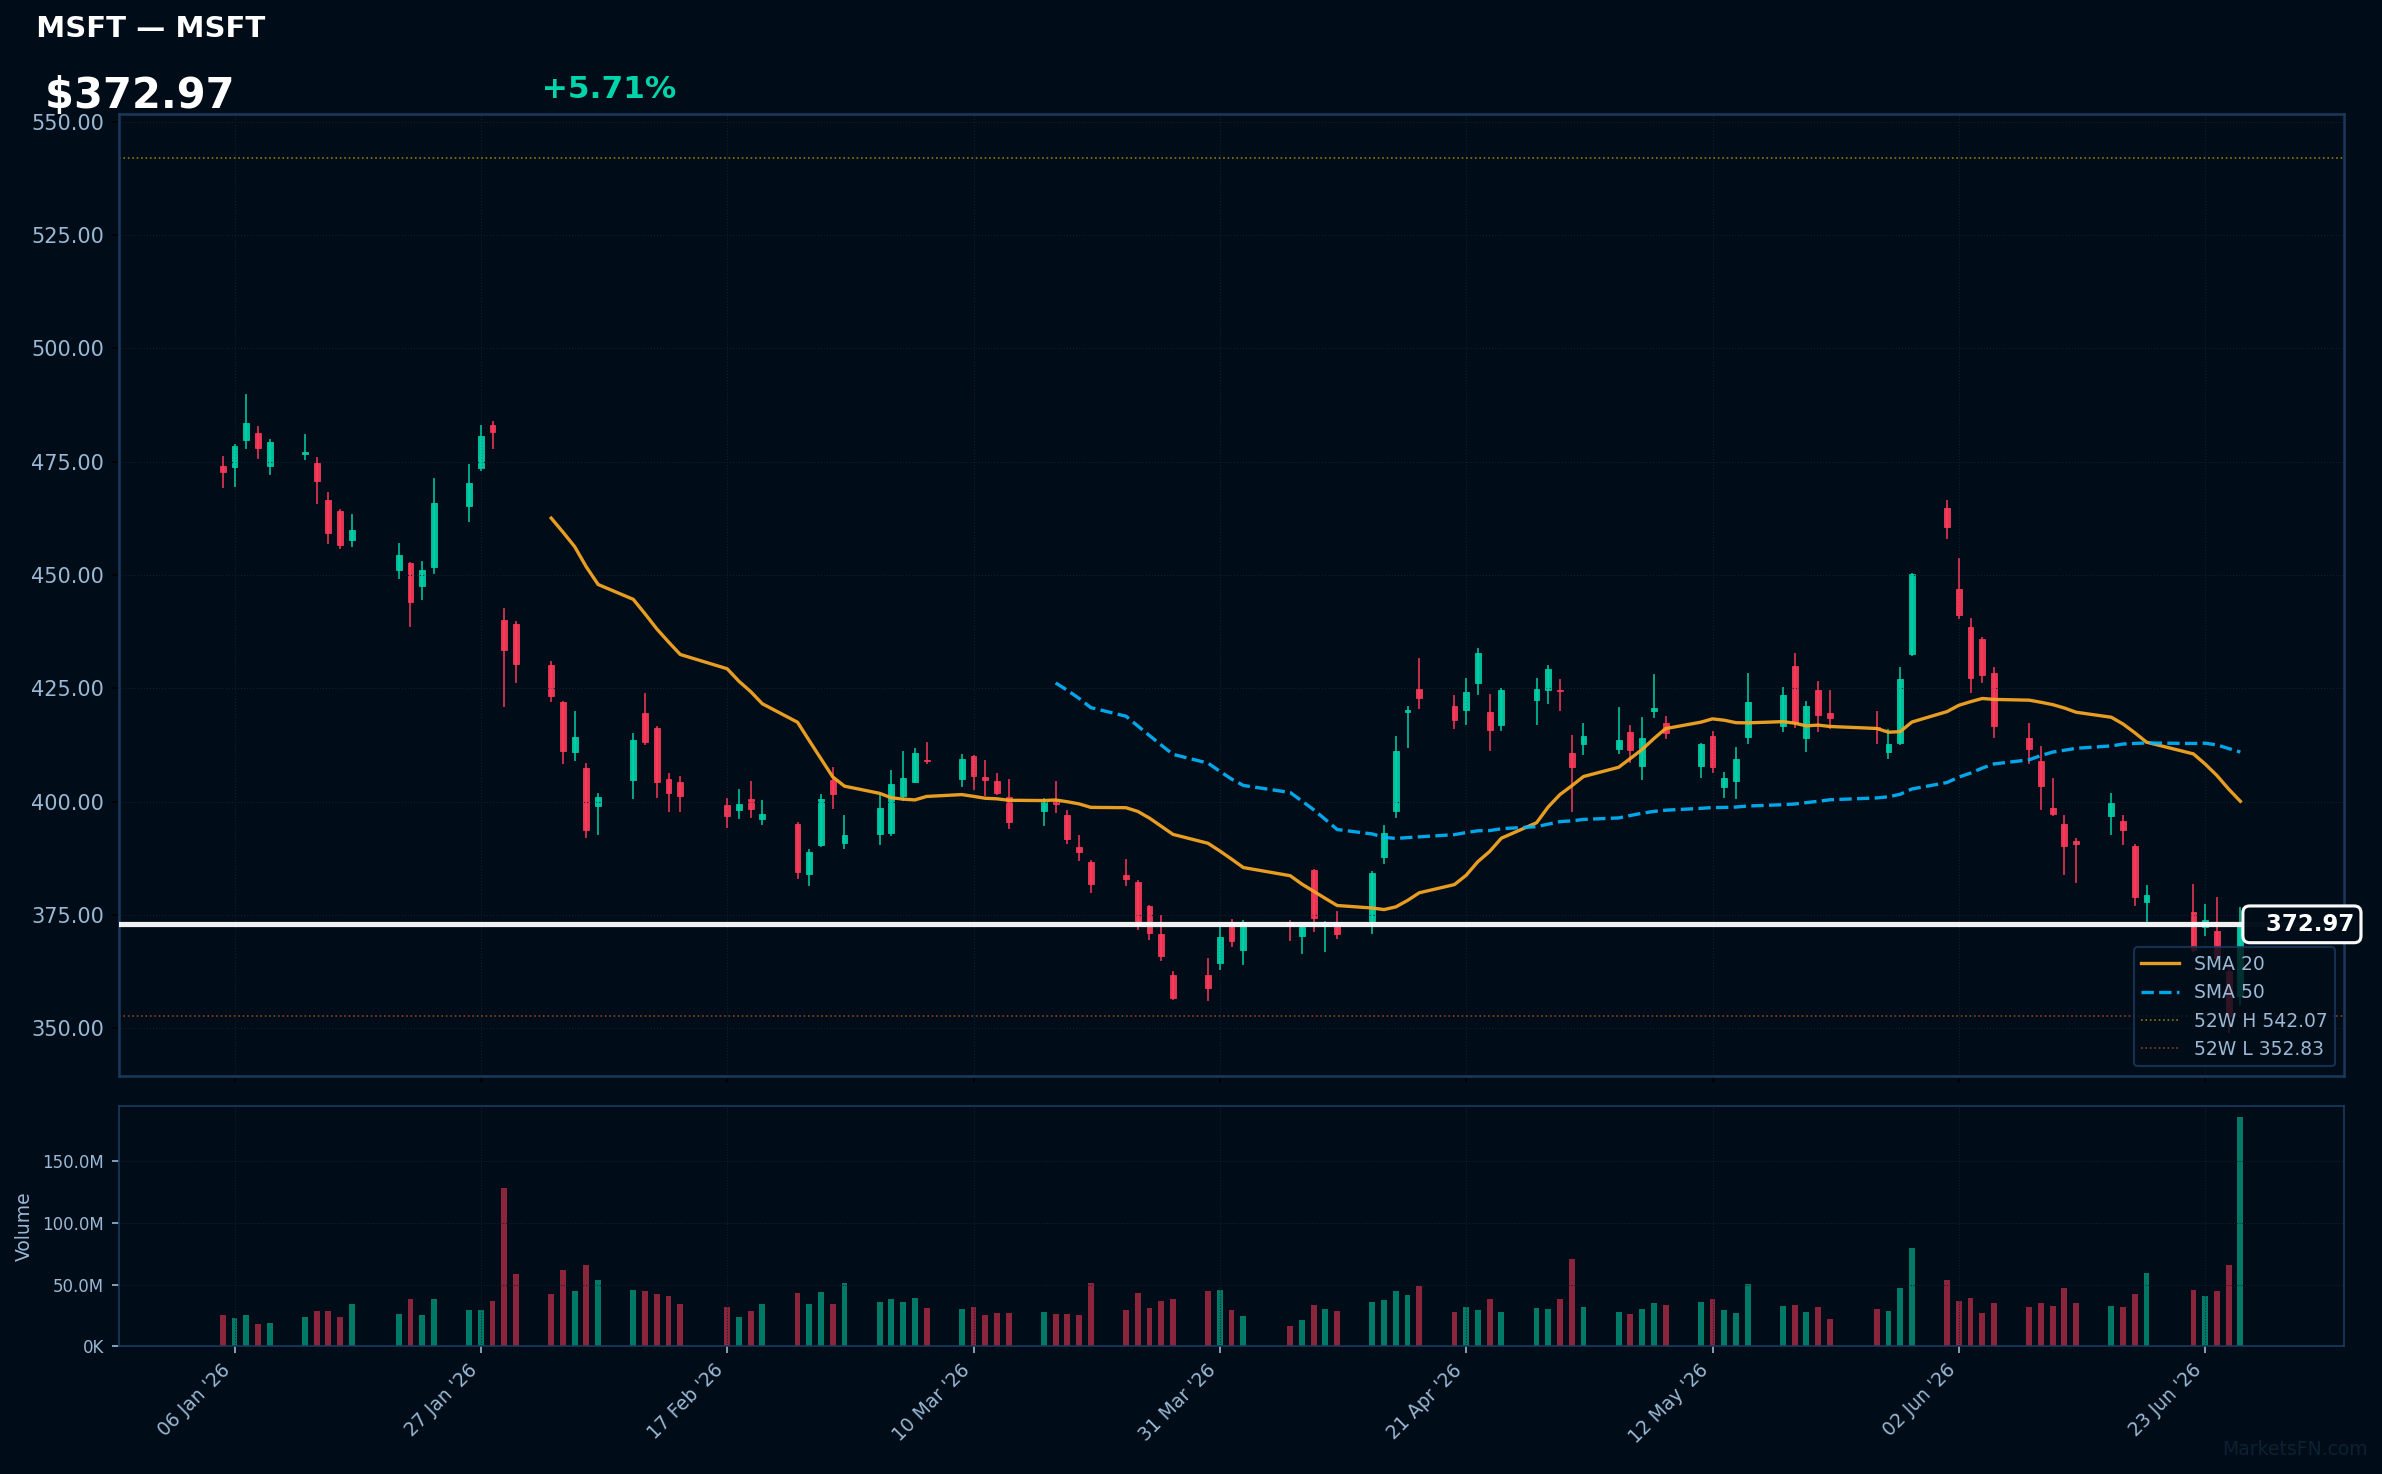
MSFT | Microsoft Corporation | Technology | Price: $372.97 | Day: +5.71% | 1W: -1.69% | 1M: -9.62% | RSI: 40.4 | vs MA200: -16.7% | Trend: Below MA20, MA50, MA200
Recent headlines (last 12h)
- Nvidia, Micron, and Broadcom hold the stock market's fate in the palm of their hands
- AI Memory Crunch Hits Hardware Makers
- Why Chinese AI Models Should Worry Nvidia, Micron Stock Investors
- Shares of the so-called 'hyperscalers' are bouncing back after a difficult week
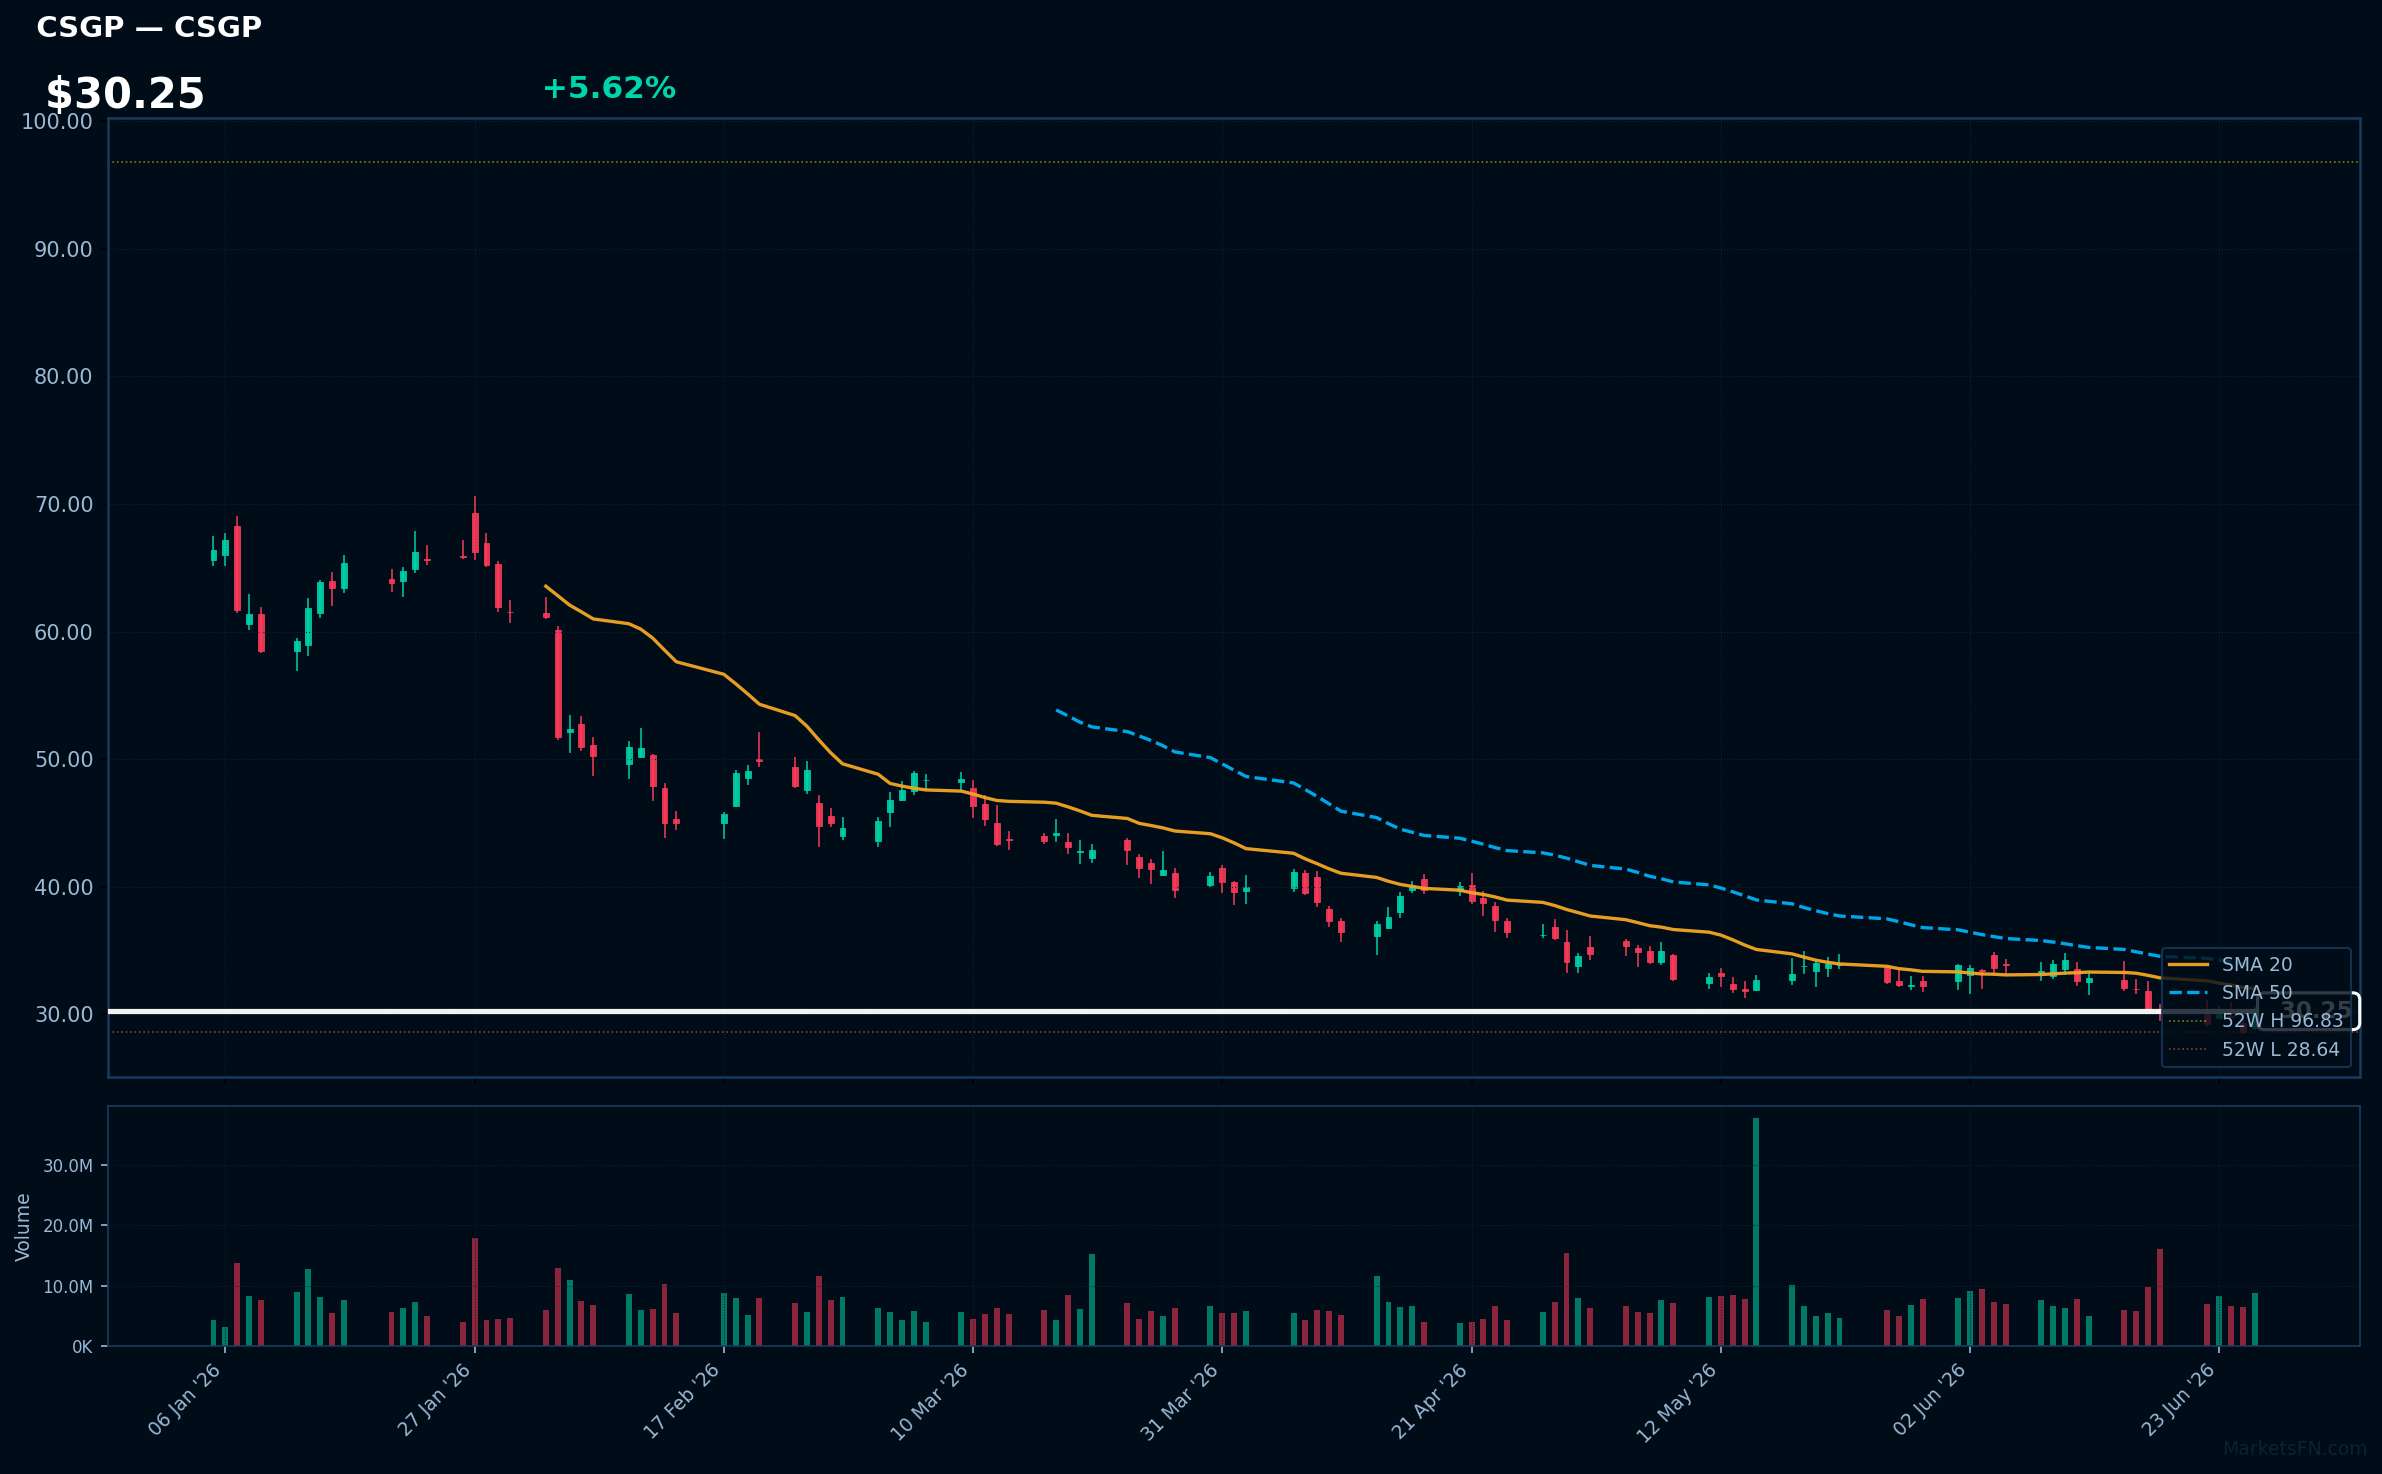
CSGP | Costar Group, Inc | Real Estate | Price: $30.25 | Day: +5.62% | 1W: +0.43% | 1M: -6.40% | RSI: 40.2 | vs MA200: -45.4% | Trend: Below MA20, MA50, MA200
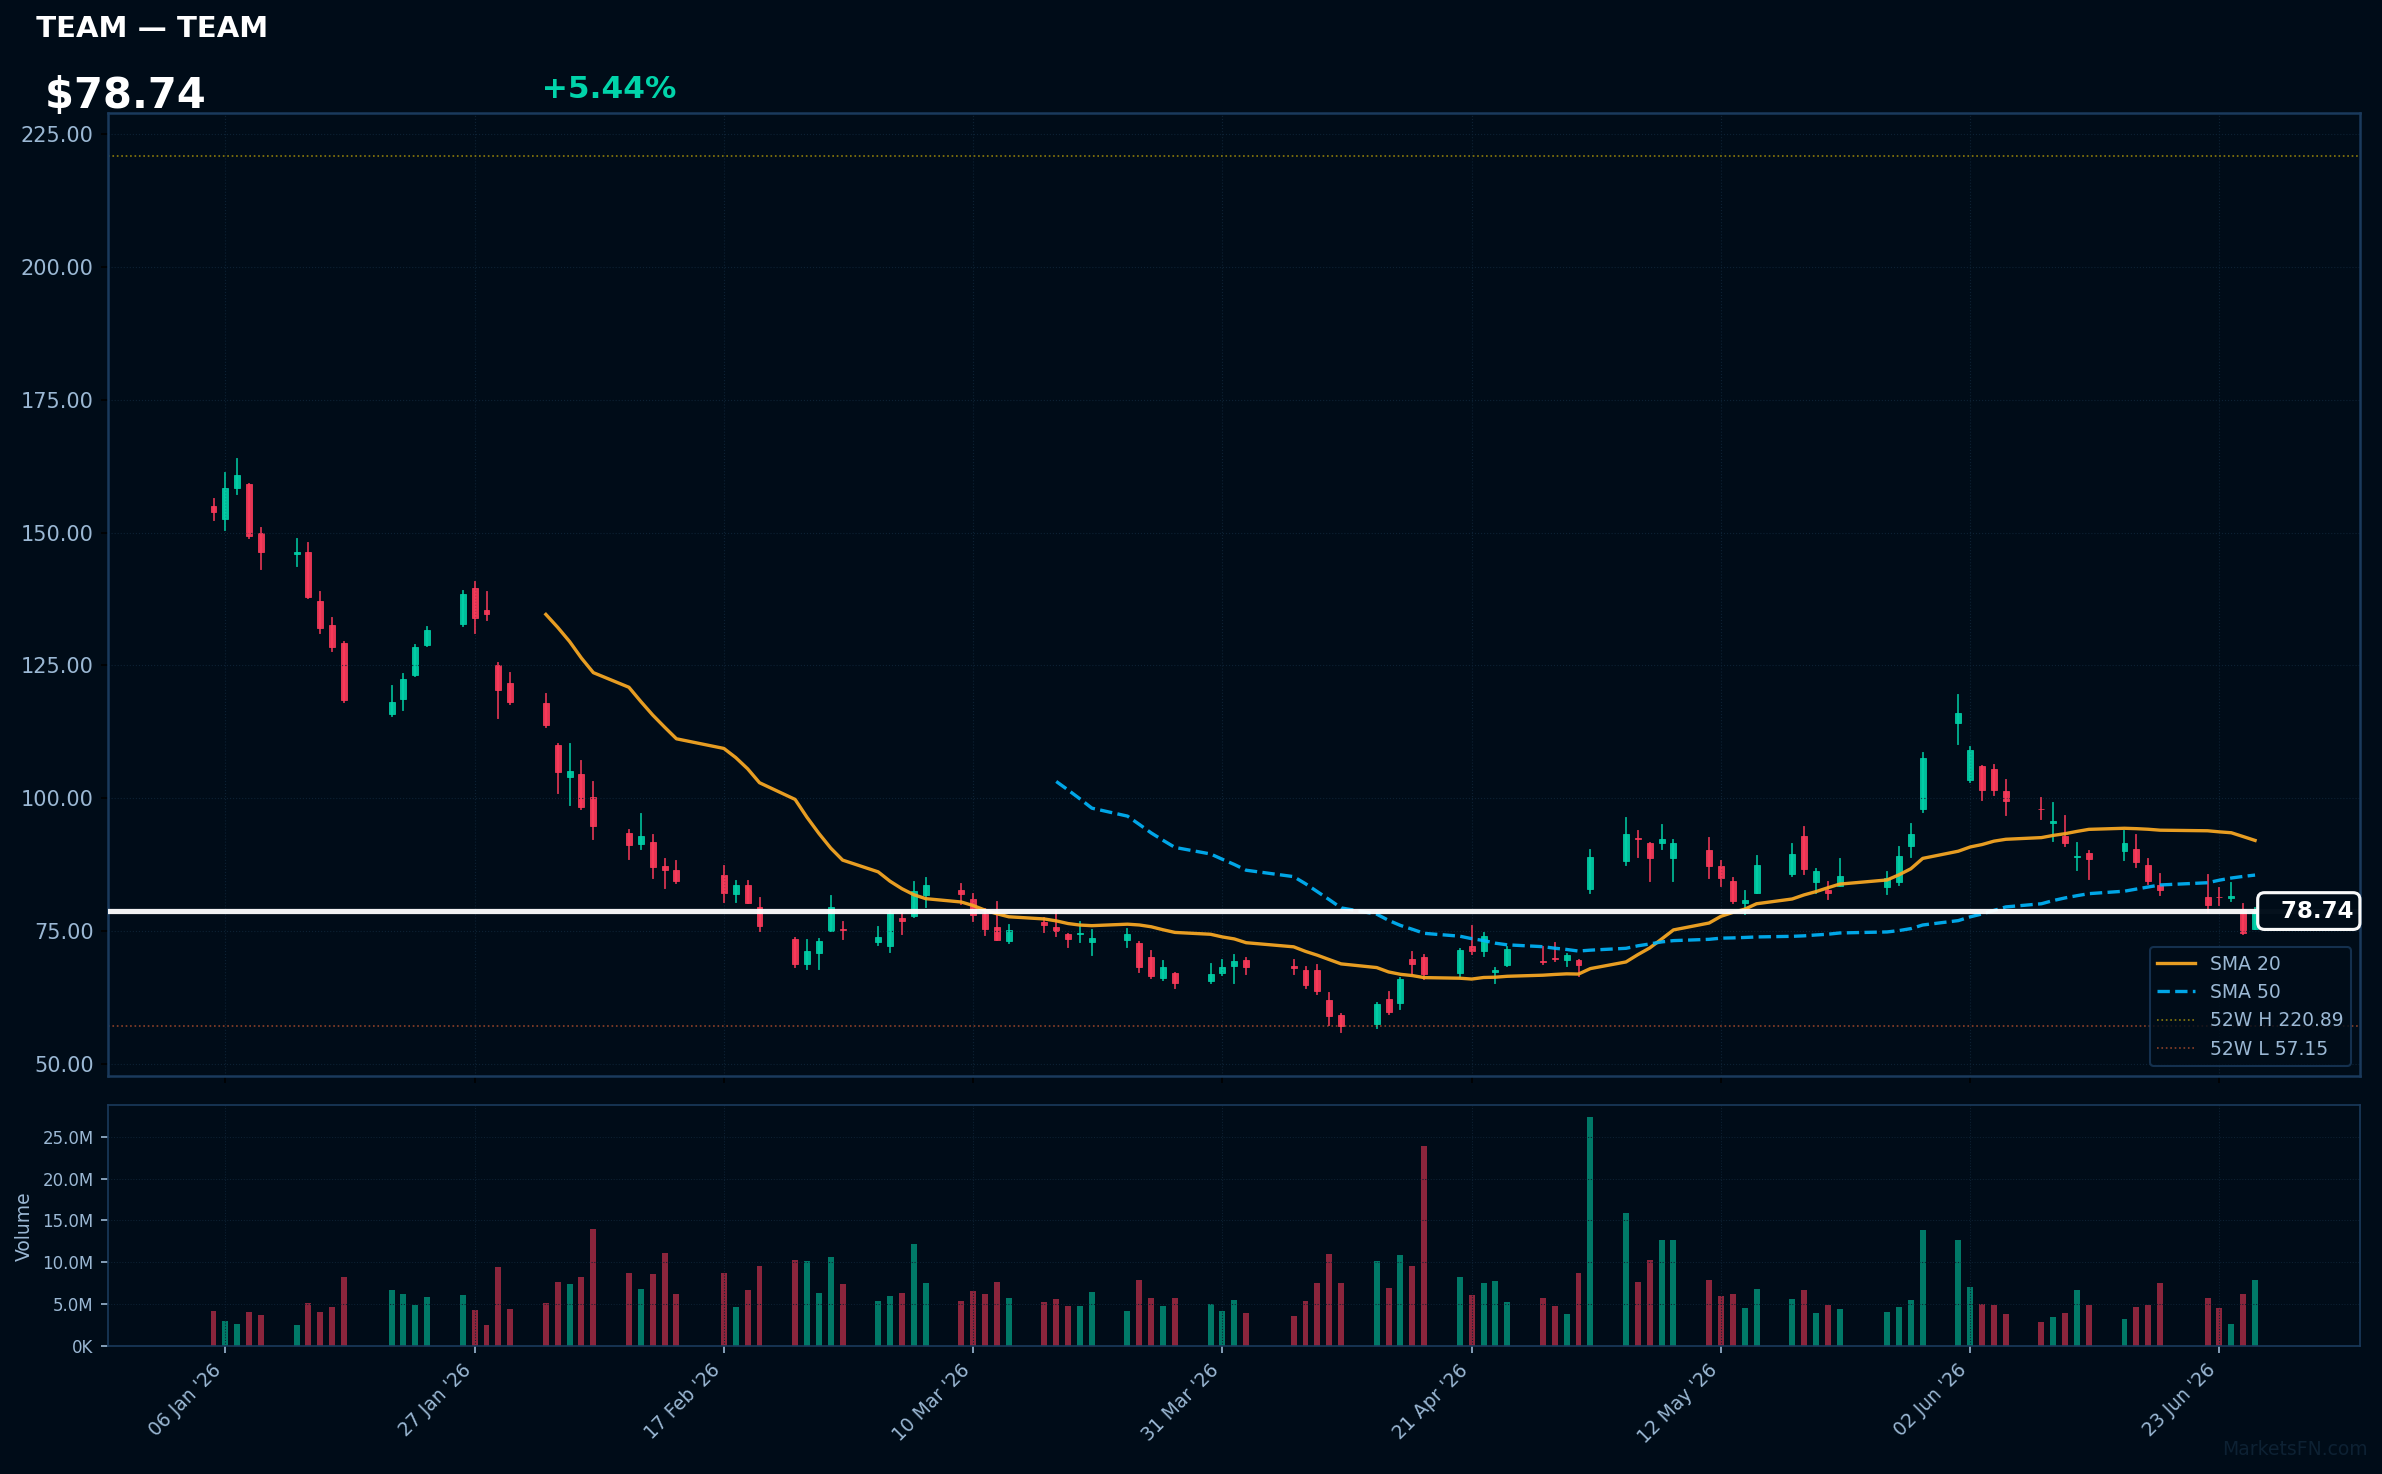
TEAM | Atlassian Corporation | Technology | Price: $78.74 | Day: +5.44% | 1W: -4.81% | 1M: -11.60% | RSI: 40.8 | vs MA200: -33.0% | Trend: Below MA20, MA50, MA200
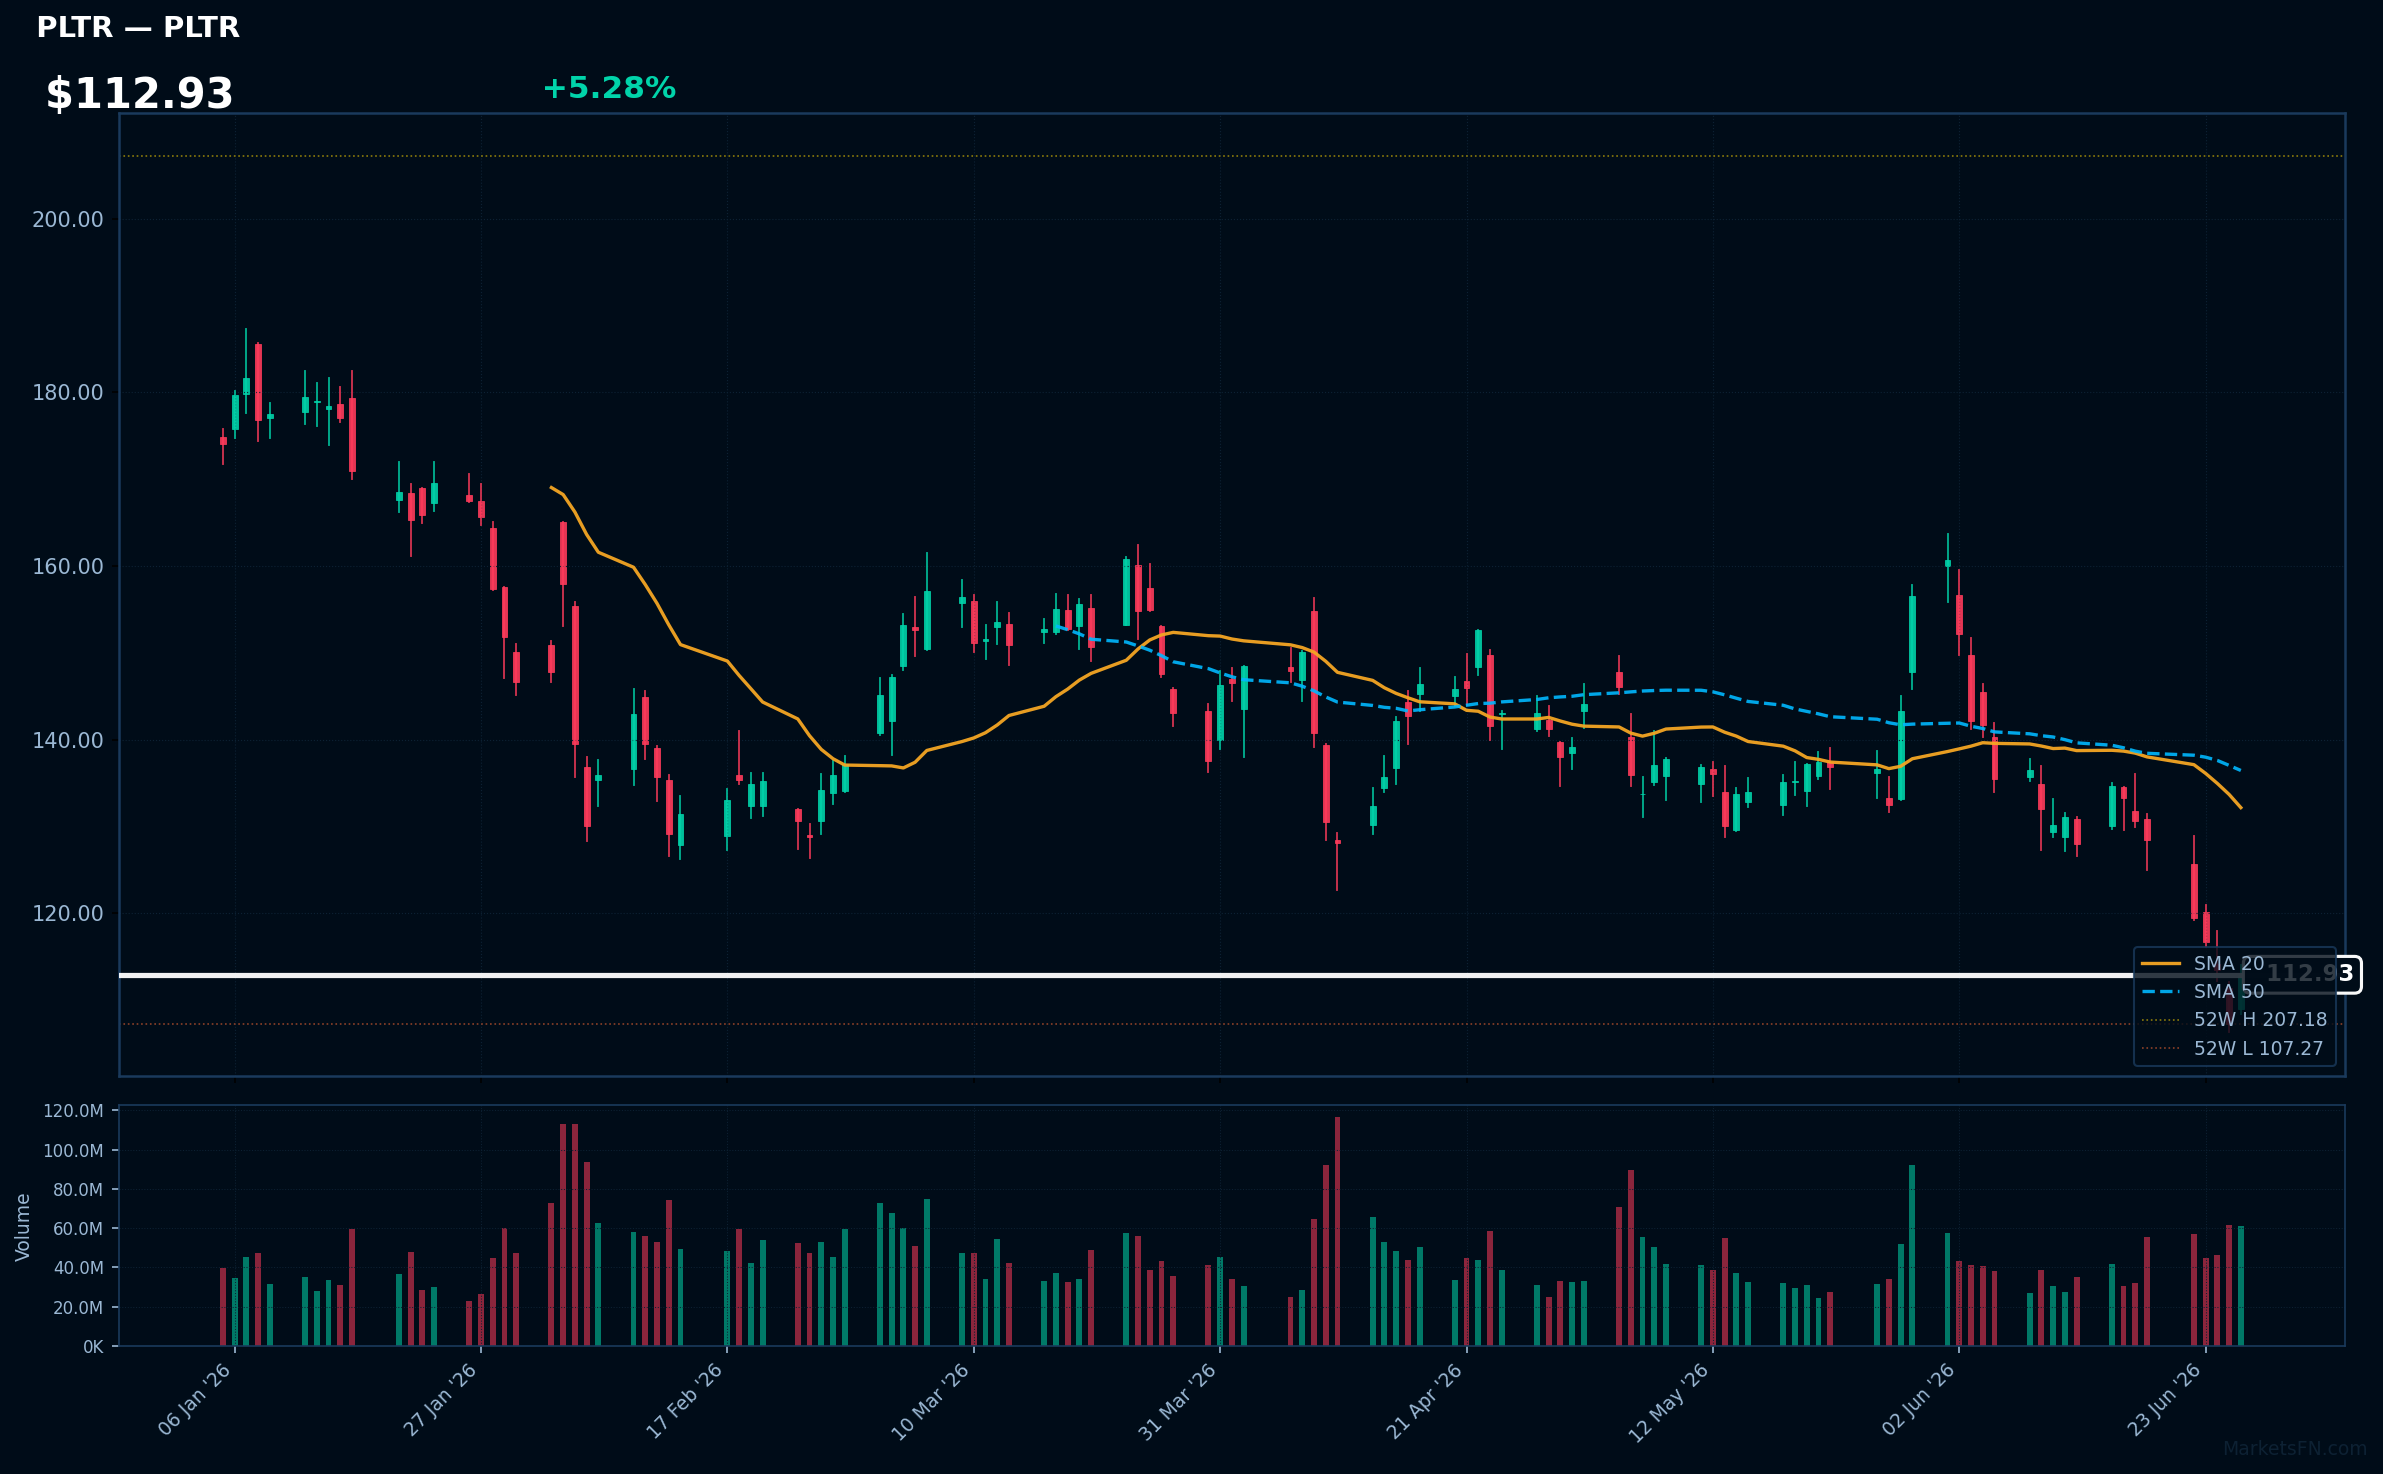
PLTR | Palantir Technologies Inc | Technology | Price: $112.93 | Day: +5.28% | 1W: -12.10% | 1M: -14.78% | RSI: 34.5 | vs MA200: -28.9% | Trend: Below MA20, MA50, MA200
Recent headlines (last 12h)
- SRFM Stock Heads Toward Best Day In A Year Whats The Palantir Connection?
- Palantir Stock Is Rising Again and This Nvidia Partnership Could Help the Recovery
- Palantir Has Lost Its AI Moat. UBS Says Investors Are Missing the Bigger Story.
- Palantir Launches Engine for Deploying NVIDIA Nemotron Open Models in Sovereign Environments
Top 10 Losers
Today's weakest Nasdaq 100 performers. Sector drag: Technology (10).
| Ticker | Company | Sector | Price | Day % | 1W % | 1M % | RSI | vs MA200 | Trend |
|---|---|---|---|---|---|---|---|---|---|
| LRCX | Lam Research Corp | Technology | $379.09 | -5.66% | -2.56% | +18.86% | 57.9 | +74.5% | Above MA20, MA50, MA200 |
| AMAT | Applied Materials Inc | Technology | $626.84 | -6.16% | +1.58% | +39.84% | 63.9 | +90.3% | Above MA20, MA50, MA200 |
| MCHP | Microchip Technology, Inc | Technology | $87.93 | -6.58% | -11.87% | -9.21% | 43.5 | +20.0% | Above MA200 · Below MA20, MA50 |
| MU | Micron Technology Inc | Technology | $1132.33 | -6.69% | -0.15% | +21.96% | 59.0 | +165.9% | Above MA20, MA50, MA200 |
| NXPI | NXP Semiconductors NV | Technology | $277.02 | -7.24% | -11.57% | -15.86% | 41.7 | +17.6% | Above MA200 · Below MA20, MA50 |
| GFS | GlobalFoundries Inc | Technology | $79.78 | -7.36% | -7.05% | -1.64% | 50.2 | +65.6% | Above MA50, MA200 · Below MA20 |
| ADI | Analog Devices Inc | Technology | $386.91 | -7.42% | -10.94% | -7.19% | 42.6 | +22.9% | Above MA200 · Below MA20, MA50 |
| QCOM | Qualcomm, Inc | Technology | $189.39 | -7.57% | -16.24% | -18.86% | 42.5 | +12.8% | Above MA200 · Below MA20, MA50 |
| TXN | Texas Instruments Inc | Technology | $285.43 | -8.46% | -11.59% | -10.09% | 44.7 | +33.8% | Above MA200 · Below MA20, MA50 |
| ON | ON Semiconductor Corp | Technology | $90.65 | -23.66% | -25.46% | -27.42% | 37.2 | +29.2% | Above MA200 · Below MA20, MA50 |
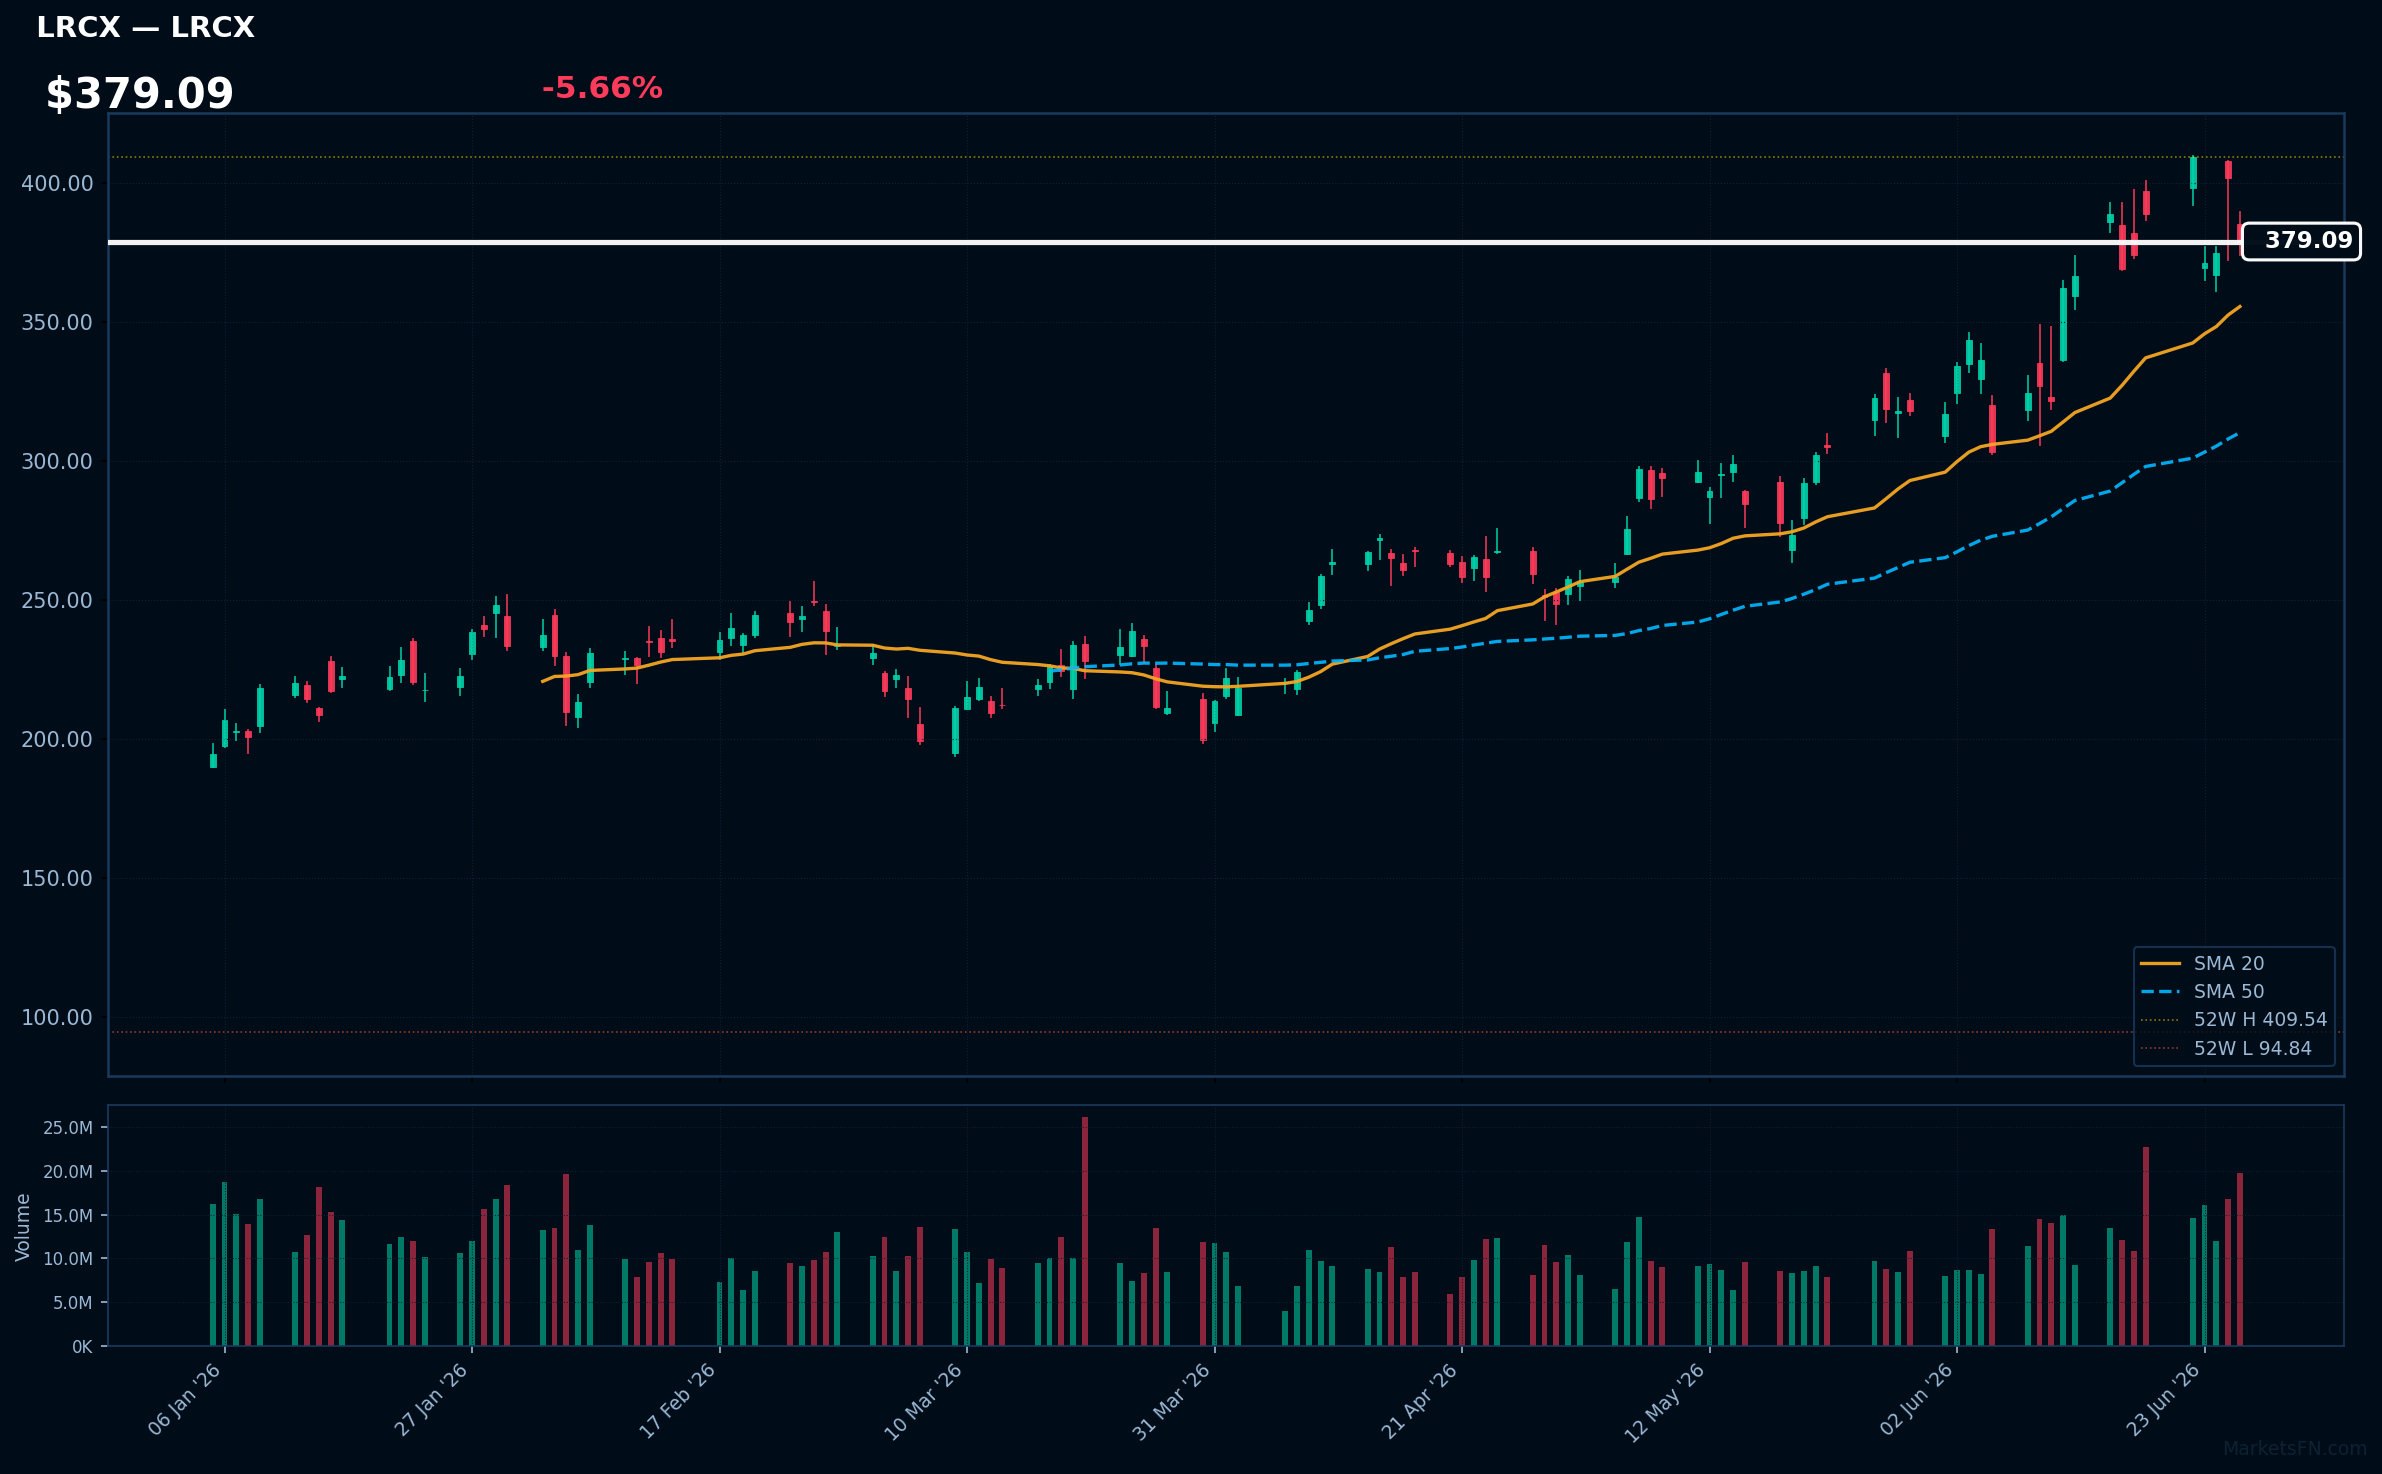
LRCX | Lam Research Corp | Technology | Price: $379.09 | Day: -5.66% | 1W: -2.56% | 1M: +18.86% | RSI: 57.9 | vs MA200: +74.5% | Trend: Above MA20, MA50, MA200
Recent headlines (last 12h)
- Premarket movers: Comcast soars, semicap equipment firms rise
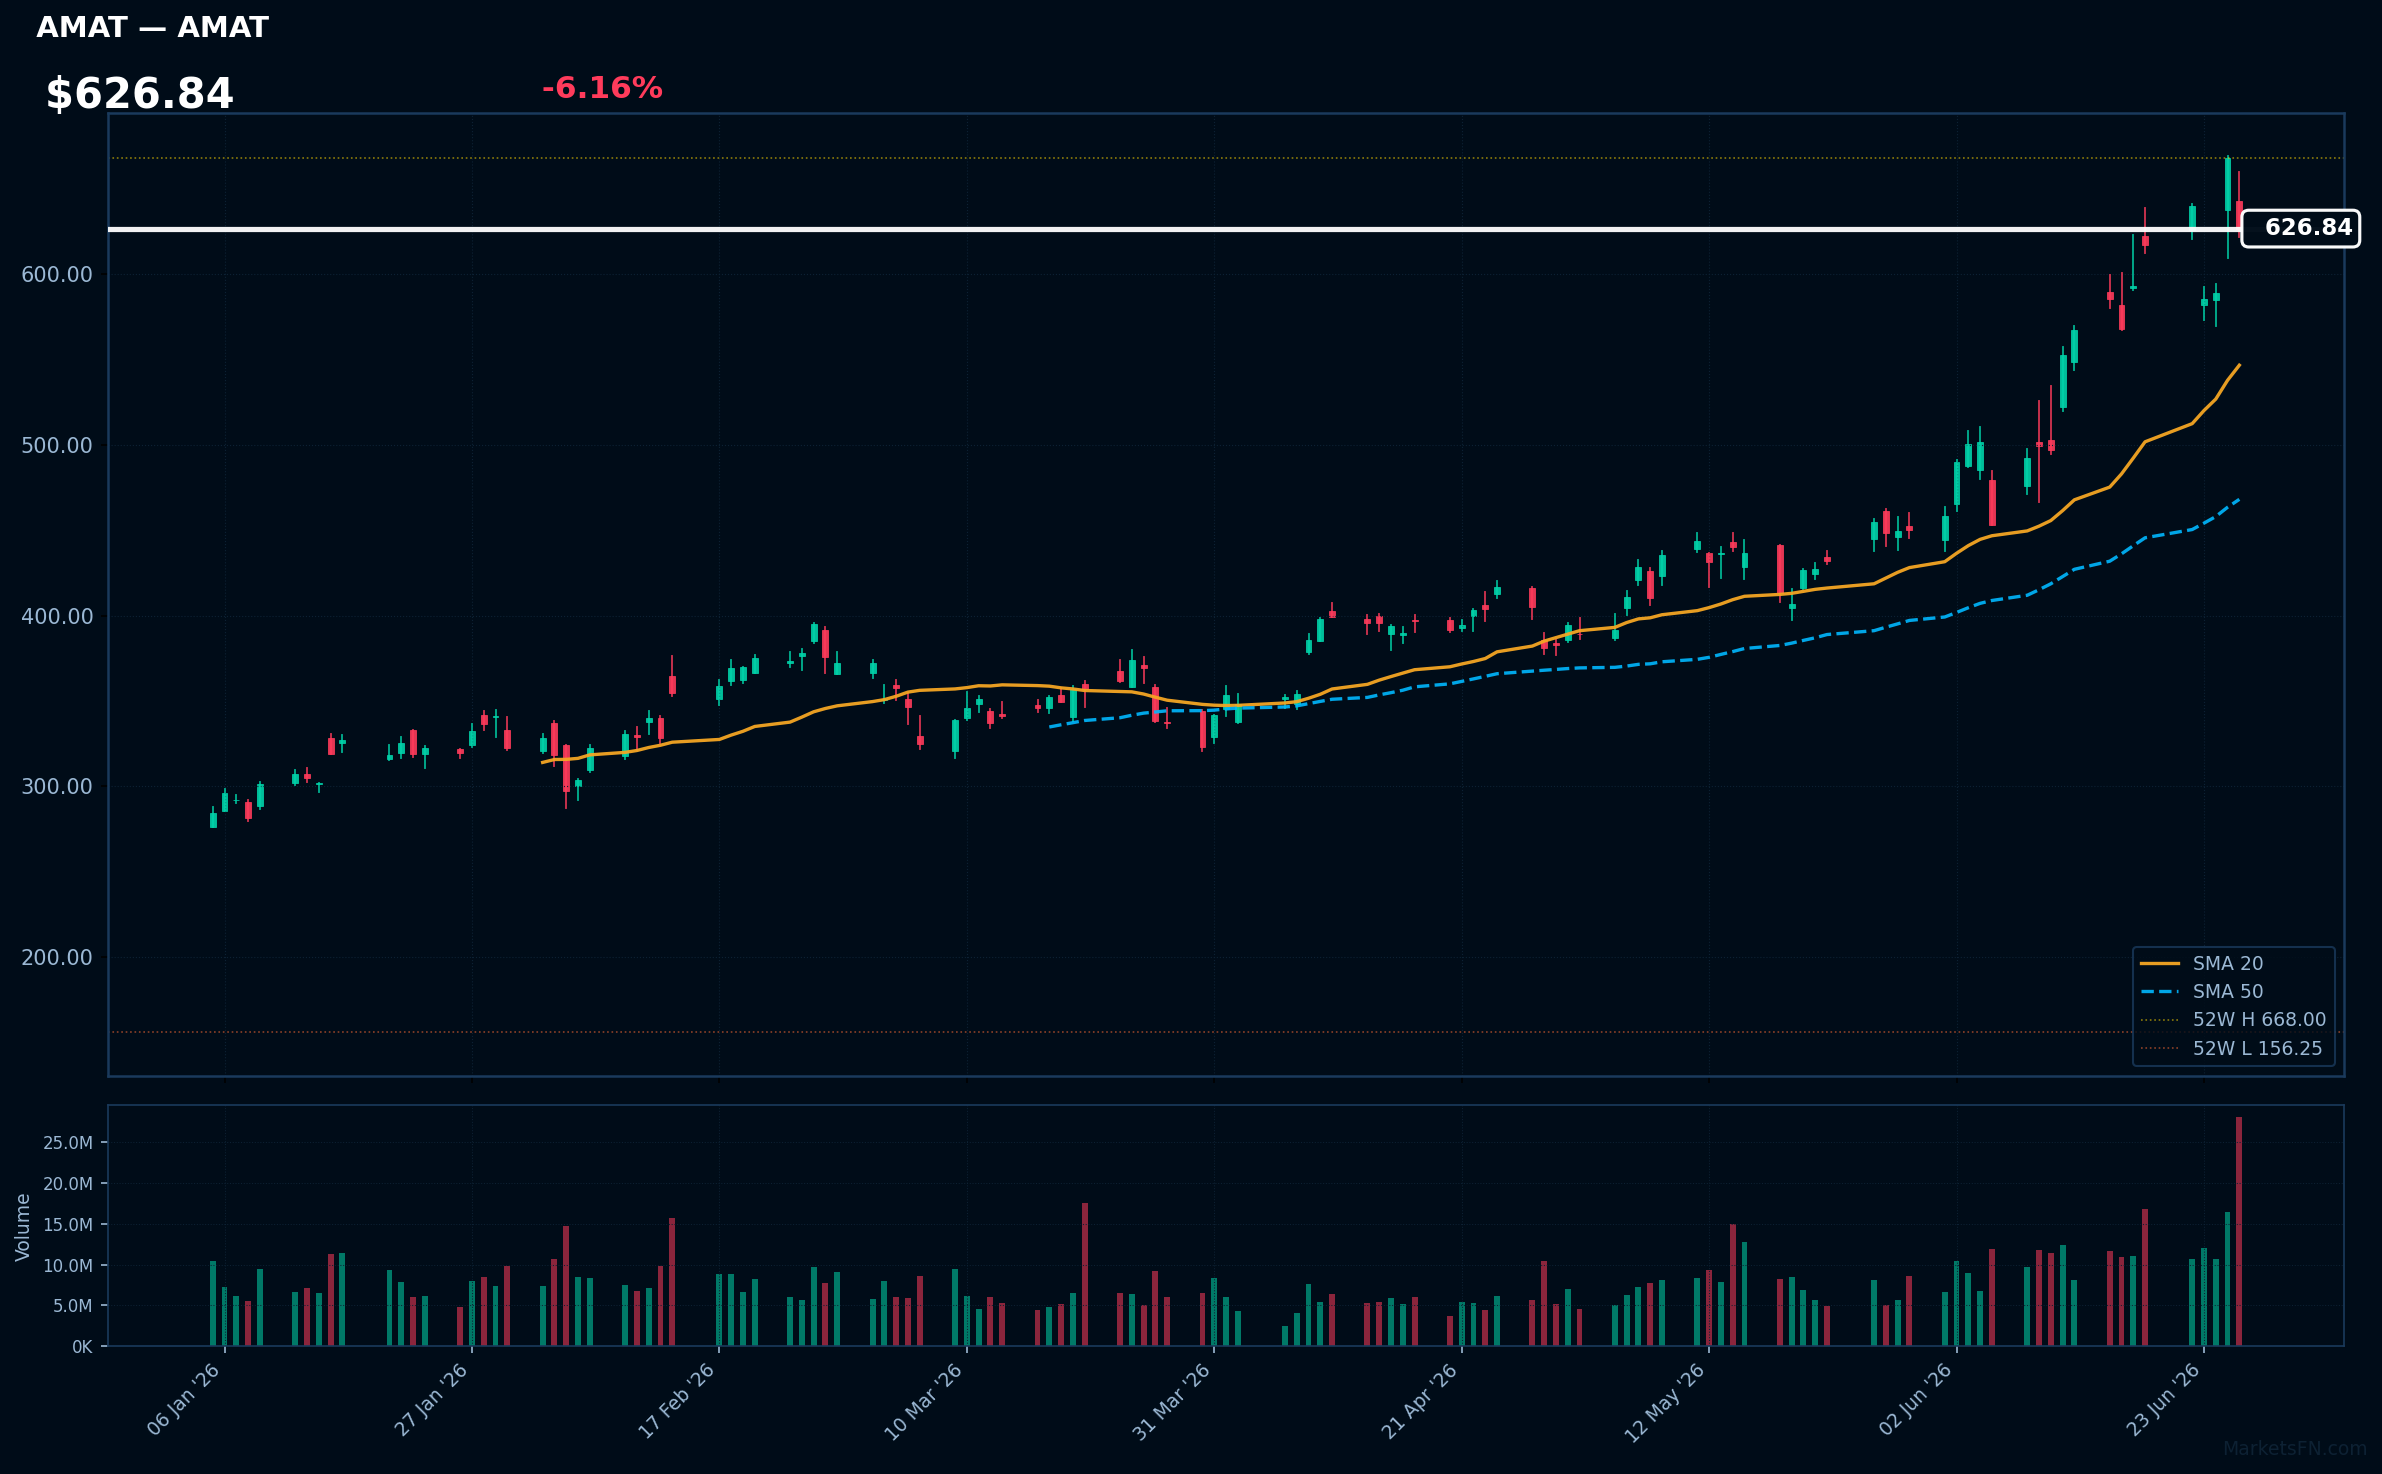
AMAT | Applied Materials Inc | Technology | Price: $626.84 | Day: -6.16% | 1W: +1.58% | 1M: +39.84% | RSI: 63.9 | vs MA200: +90.3% | Trend: Above MA20, MA50, MA200
Recent headlines (last 12h)
- Premarket movers: Comcast soars, semicap equipment firms rise
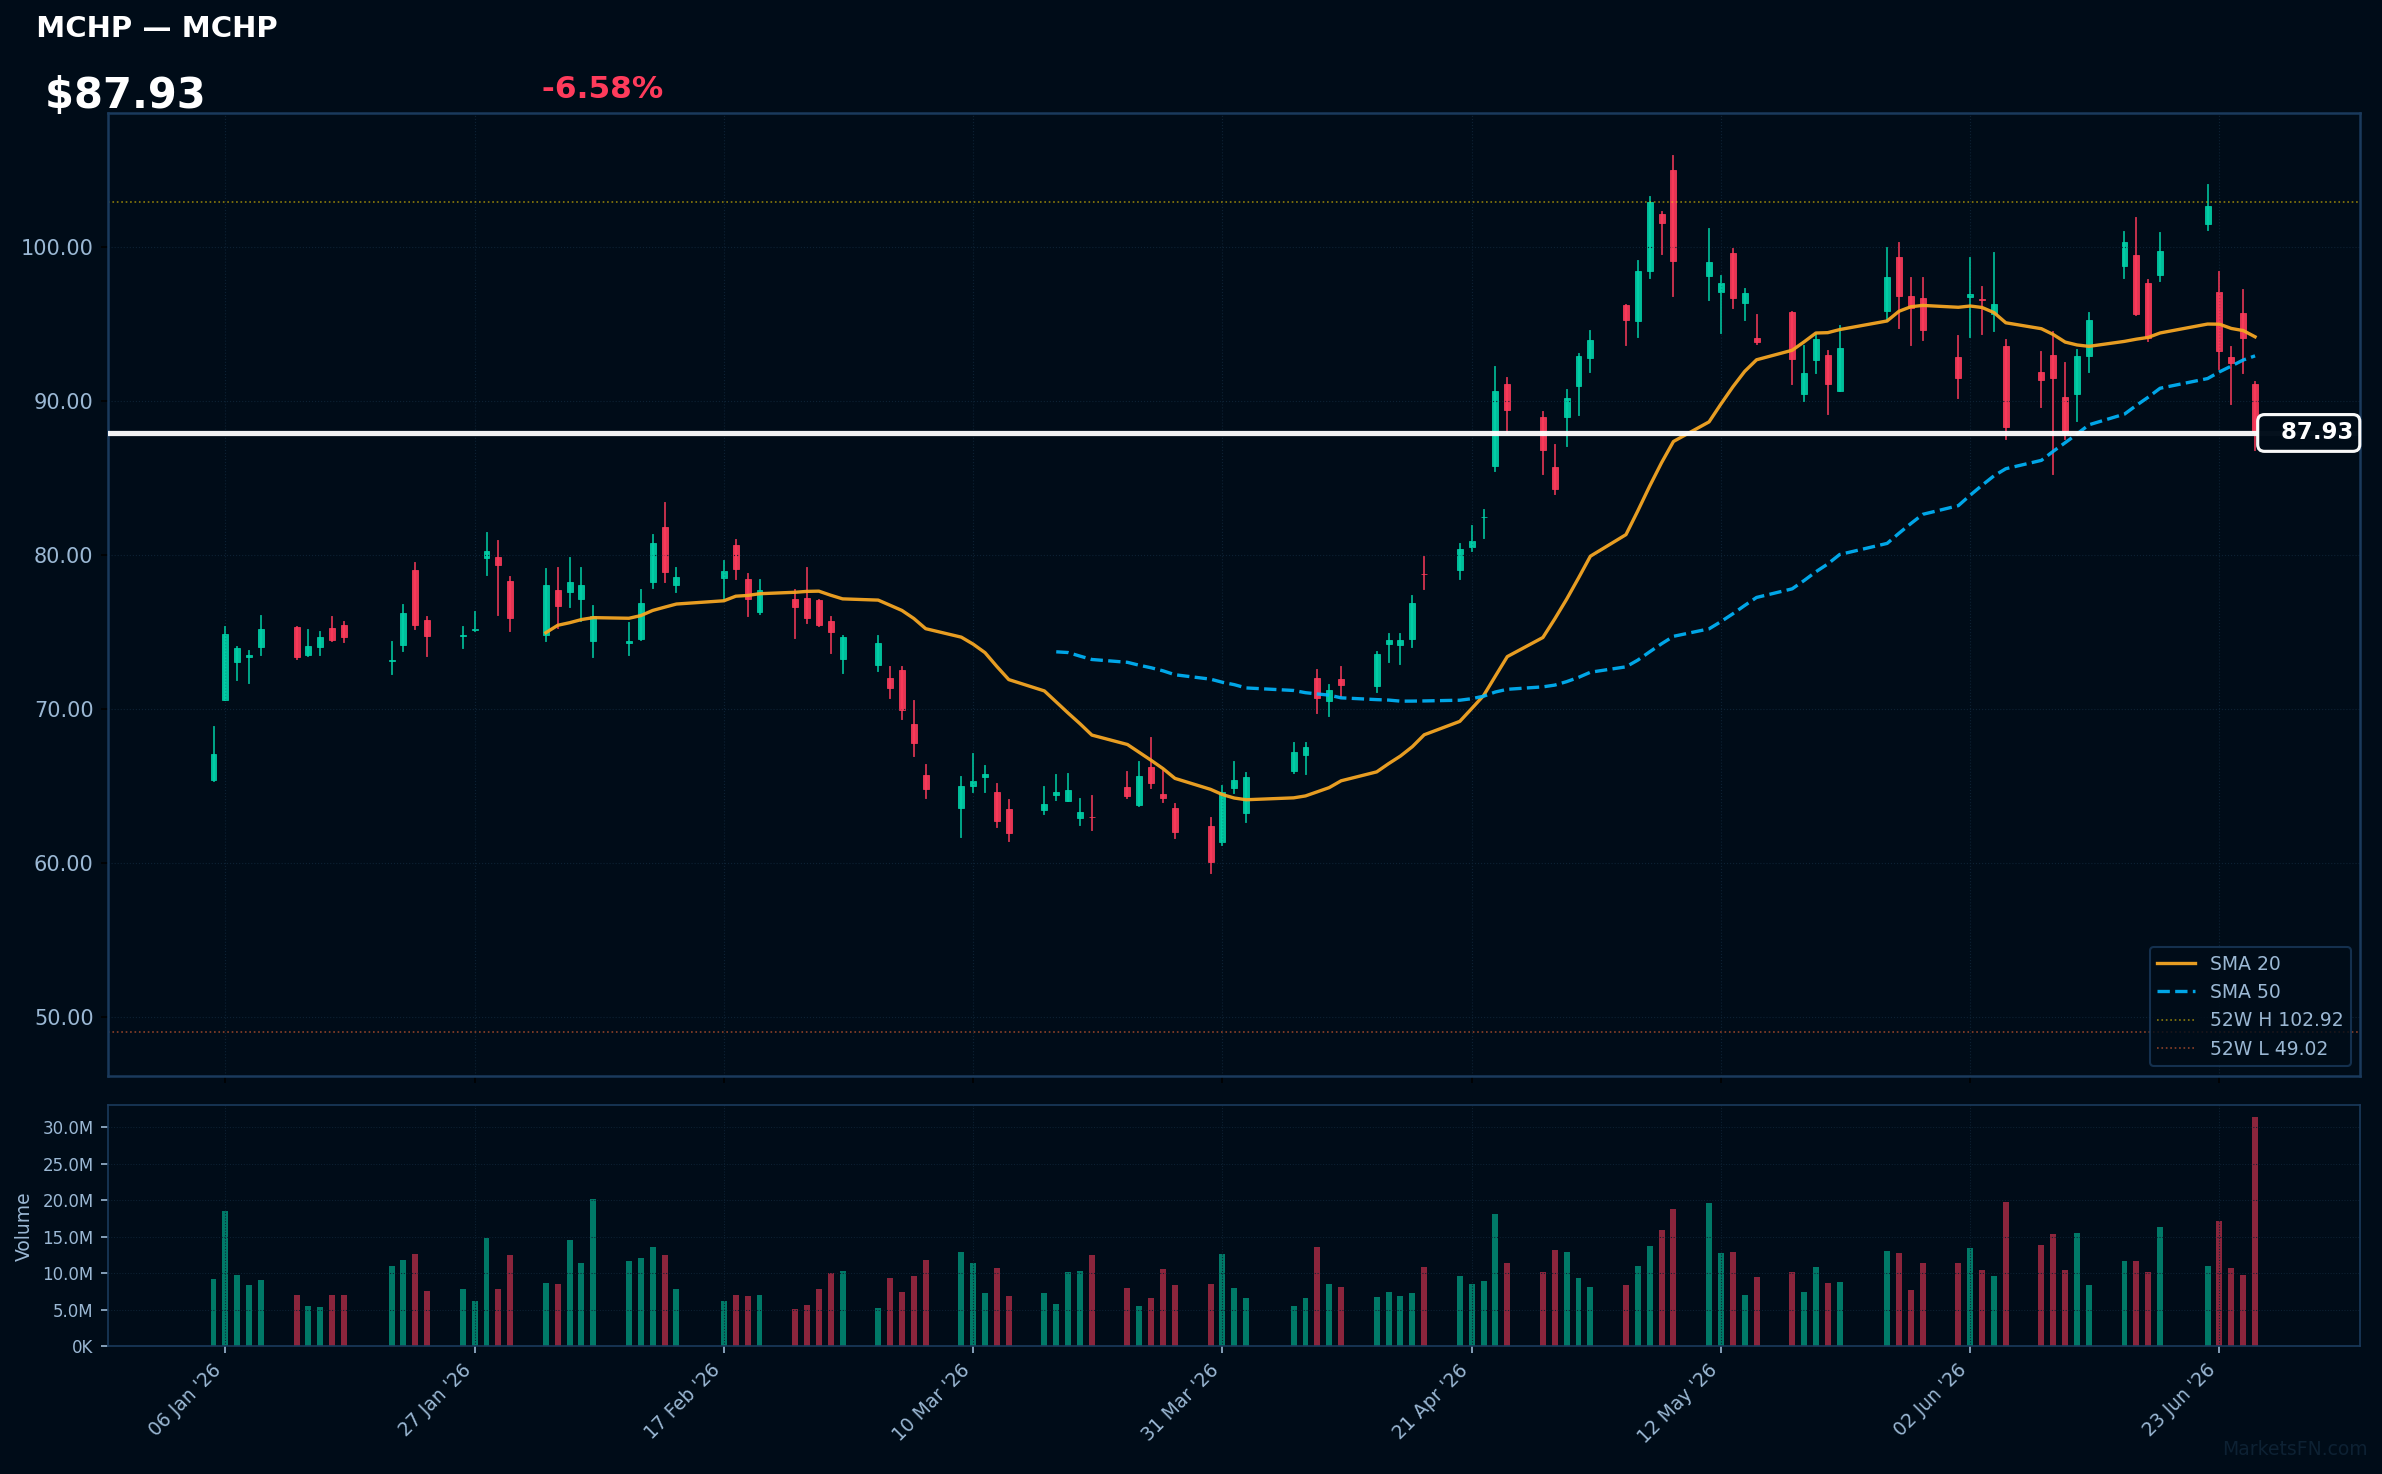
MCHP | Microchip Technology, Inc | Technology | Price: $87.93 | Day: -6.58% | 1W: -11.87% | 1M: -9.21% | RSI: 43.5 | vs MA200: +20.0% | Trend: Above MA200 · Below MA20, MA50
MU | Micron Technology Inc | Technology | Price: $1132.33 | Day: -6.69% | 1W: -0.15% | 1M: +21.96% | RSI: 59.0 | vs MA200: +165.9% | Trend: Above MA20, MA50, MA200
Recent headlines (last 12h)
- Nvidia, Micron, and Broadcom hold the stock market's fate in the palm of their hands
- AI Memory Crunch Hits Hardware Makers
- Why Chinese AI Models Should Worry Nvidia, Micron Stock Investors
- Wall Street Weans Itself From Tech in Early Summer Rotation
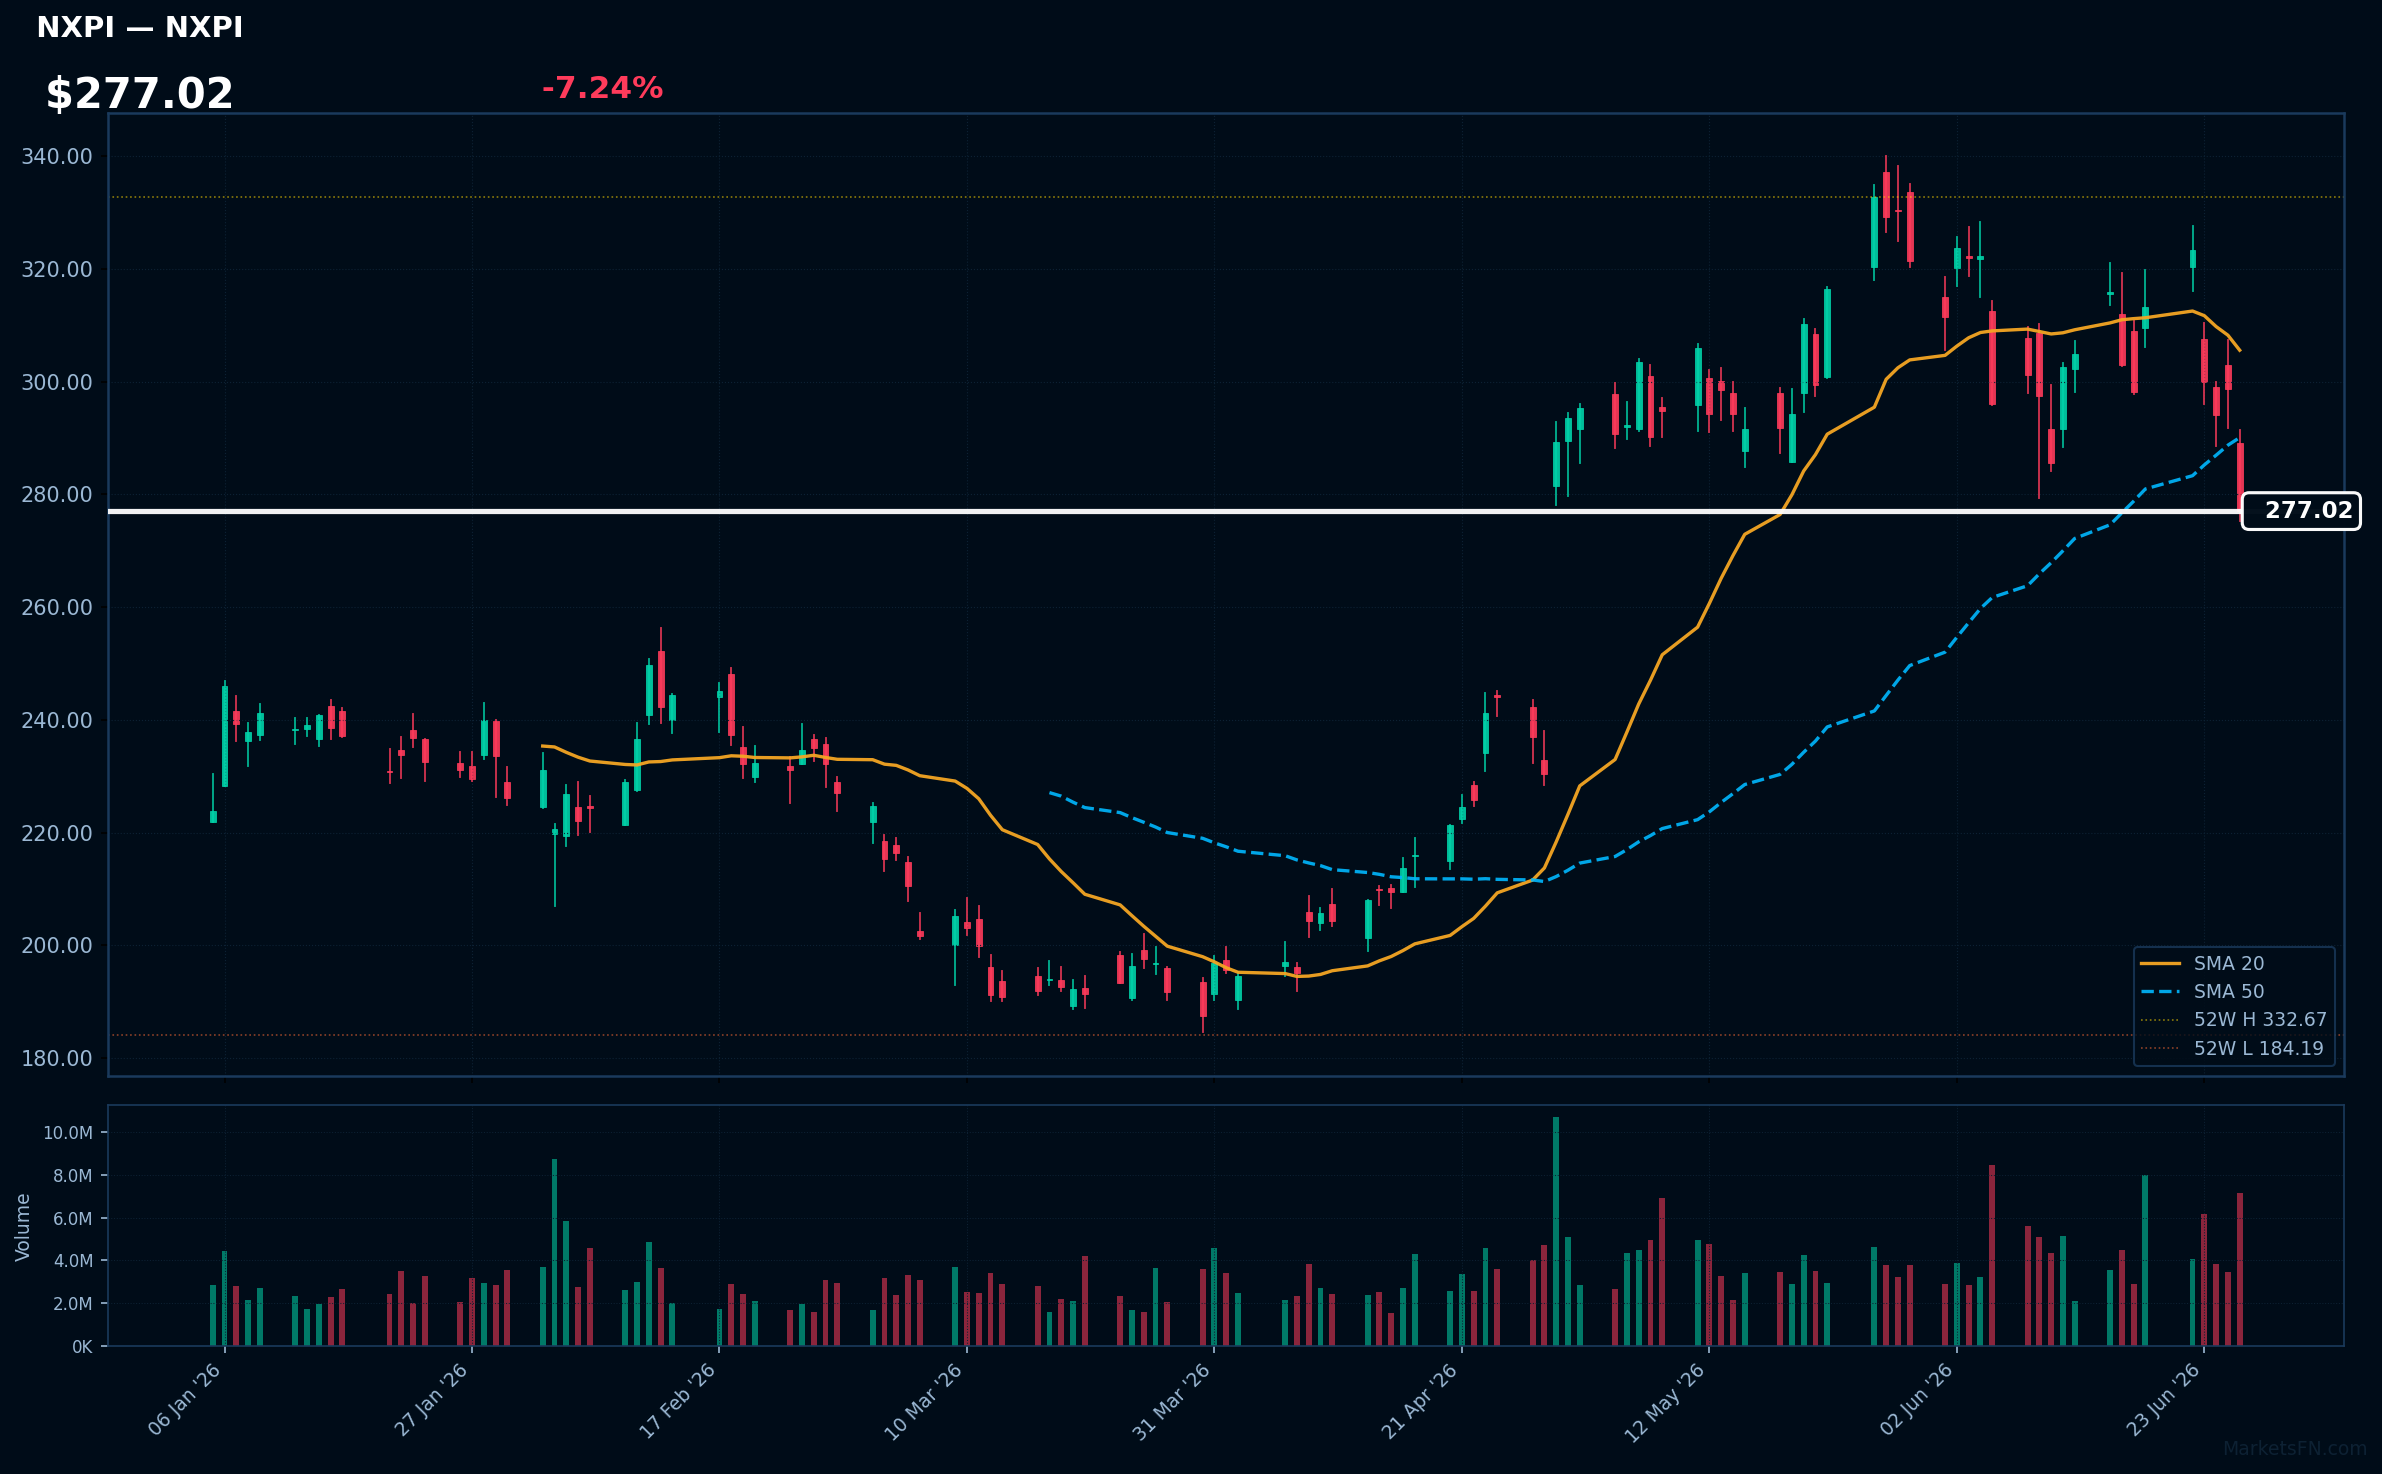
NXPI | NXP Semiconductors NV | Technology | Price: $277.02 | Day: -7.24% | 1W: -11.57% | 1M: -15.86% | RSI: 41.7 | vs MA200: +17.6% | Trend: Above MA200 · Below MA20, MA50
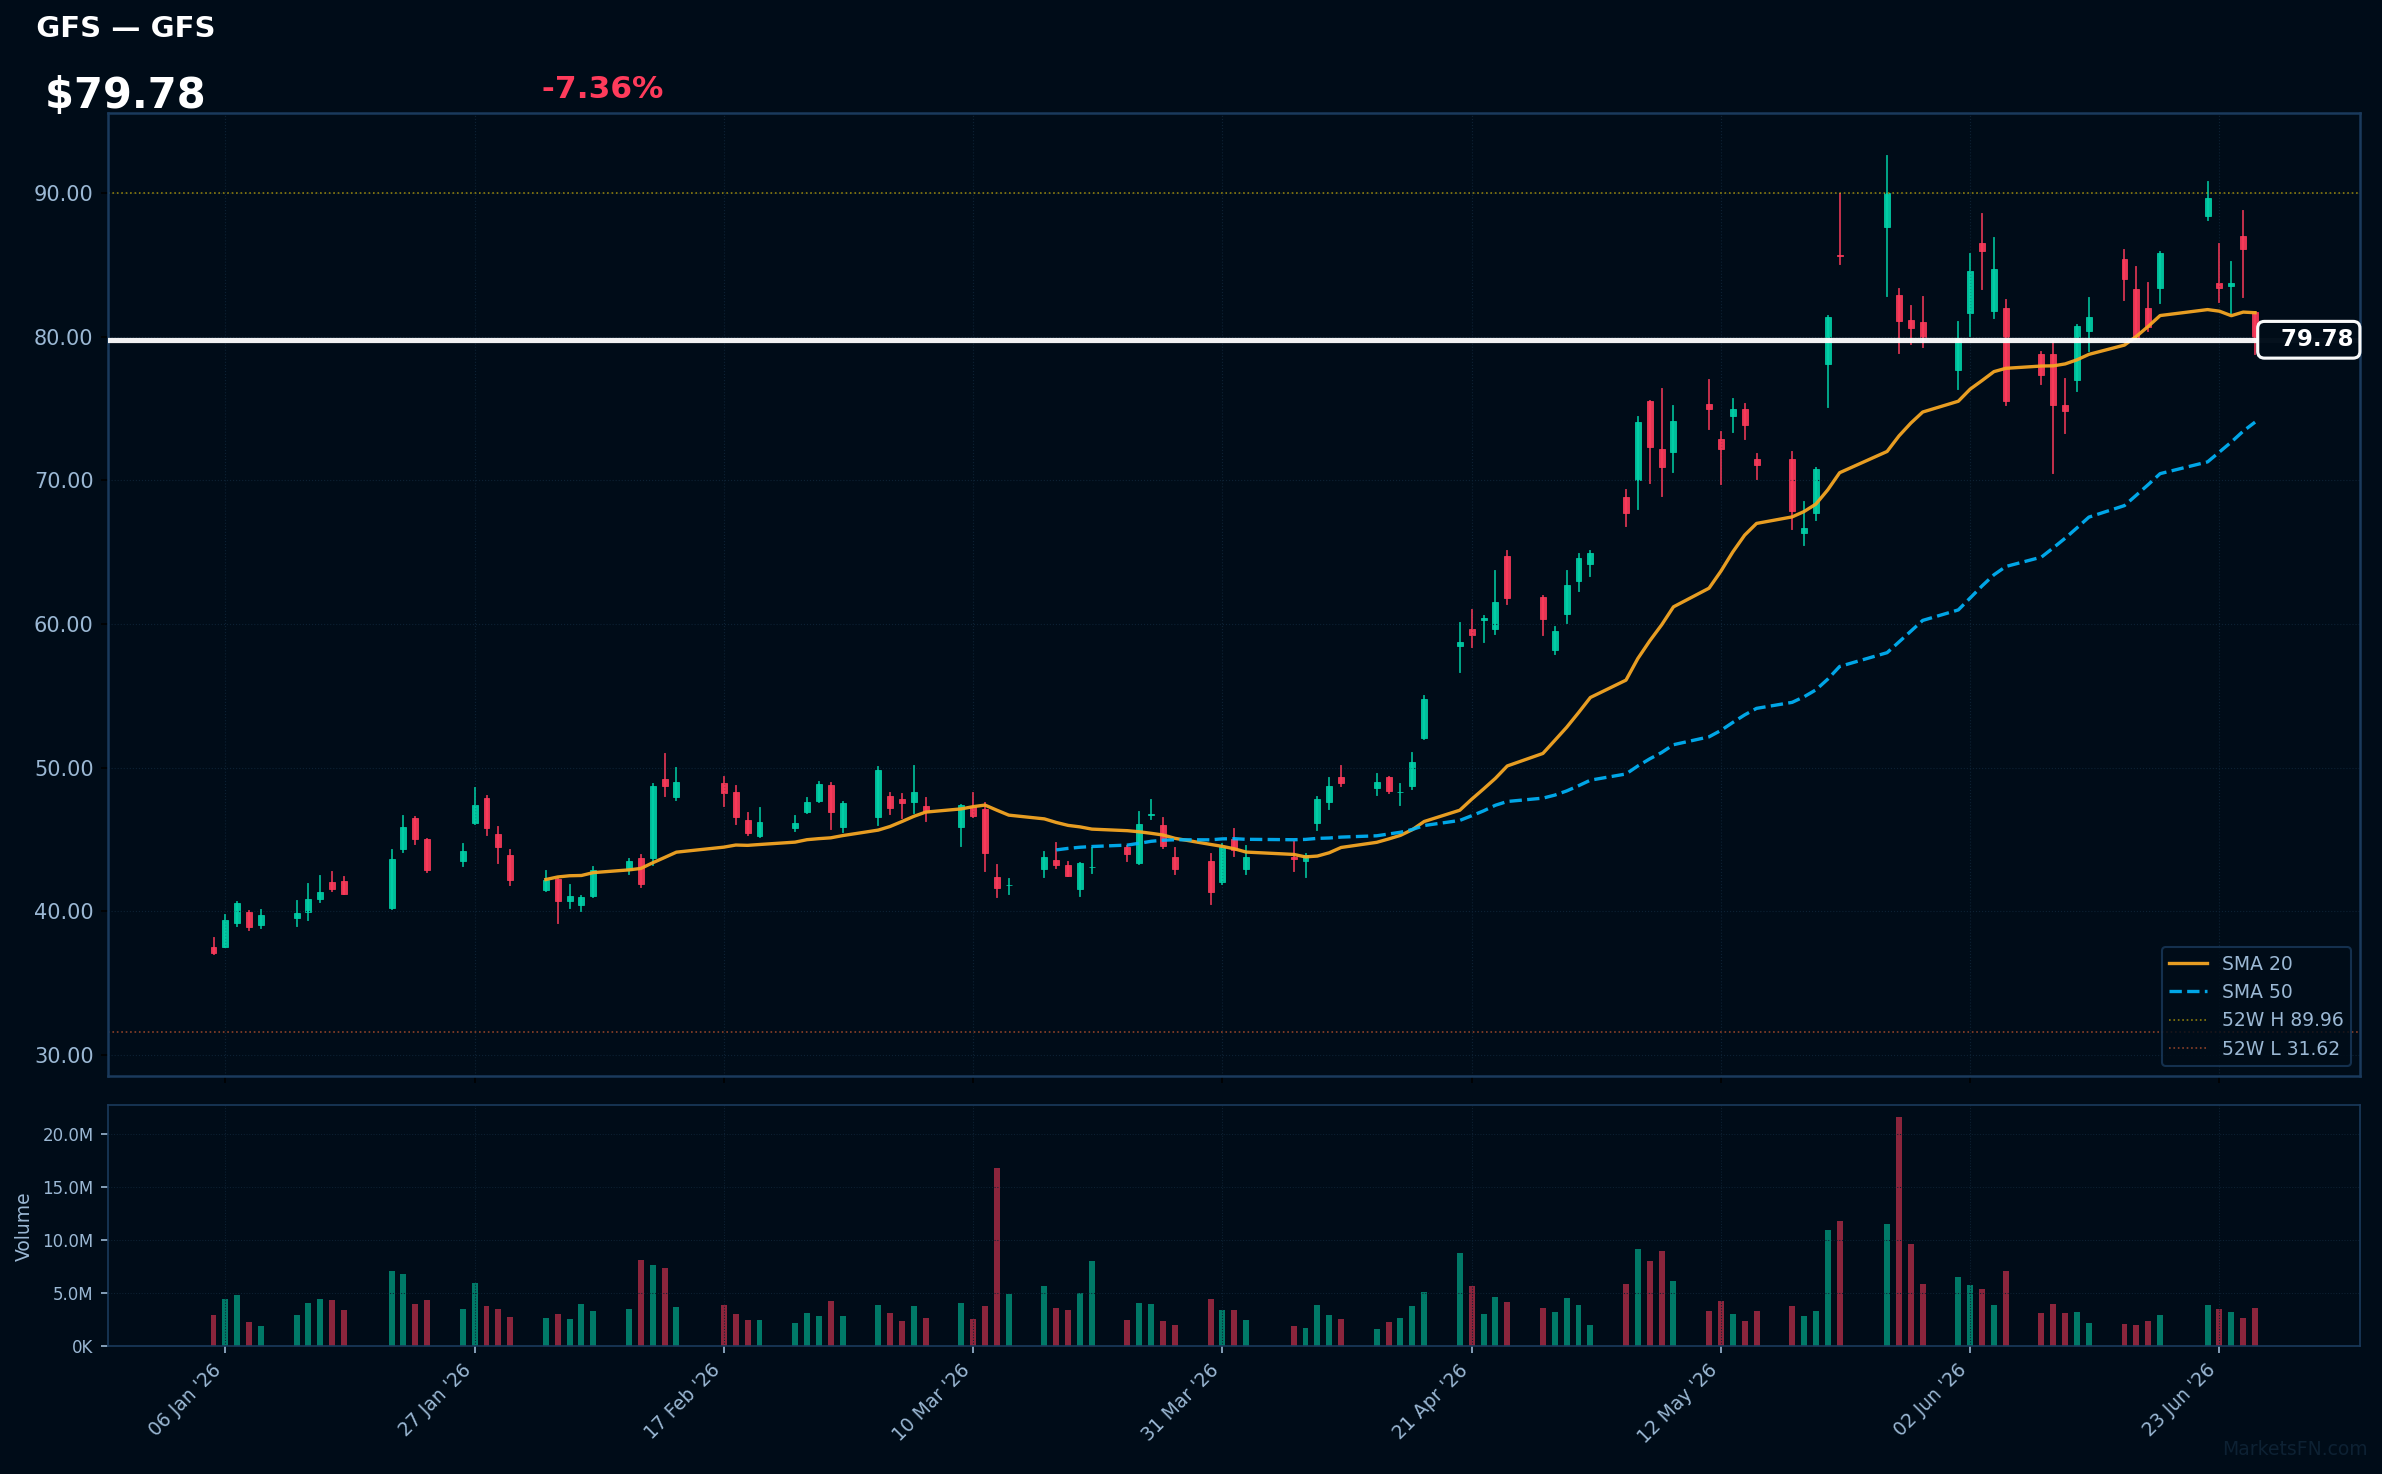
GFS | GlobalFoundries Inc | Technology | Price: $79.78 | Day: -7.36% | 1W: -7.05% | 1M: -1.64% | RSI: 50.2 | vs MA200: +65.6% | Trend: Above MA50, MA200 · Below MA20
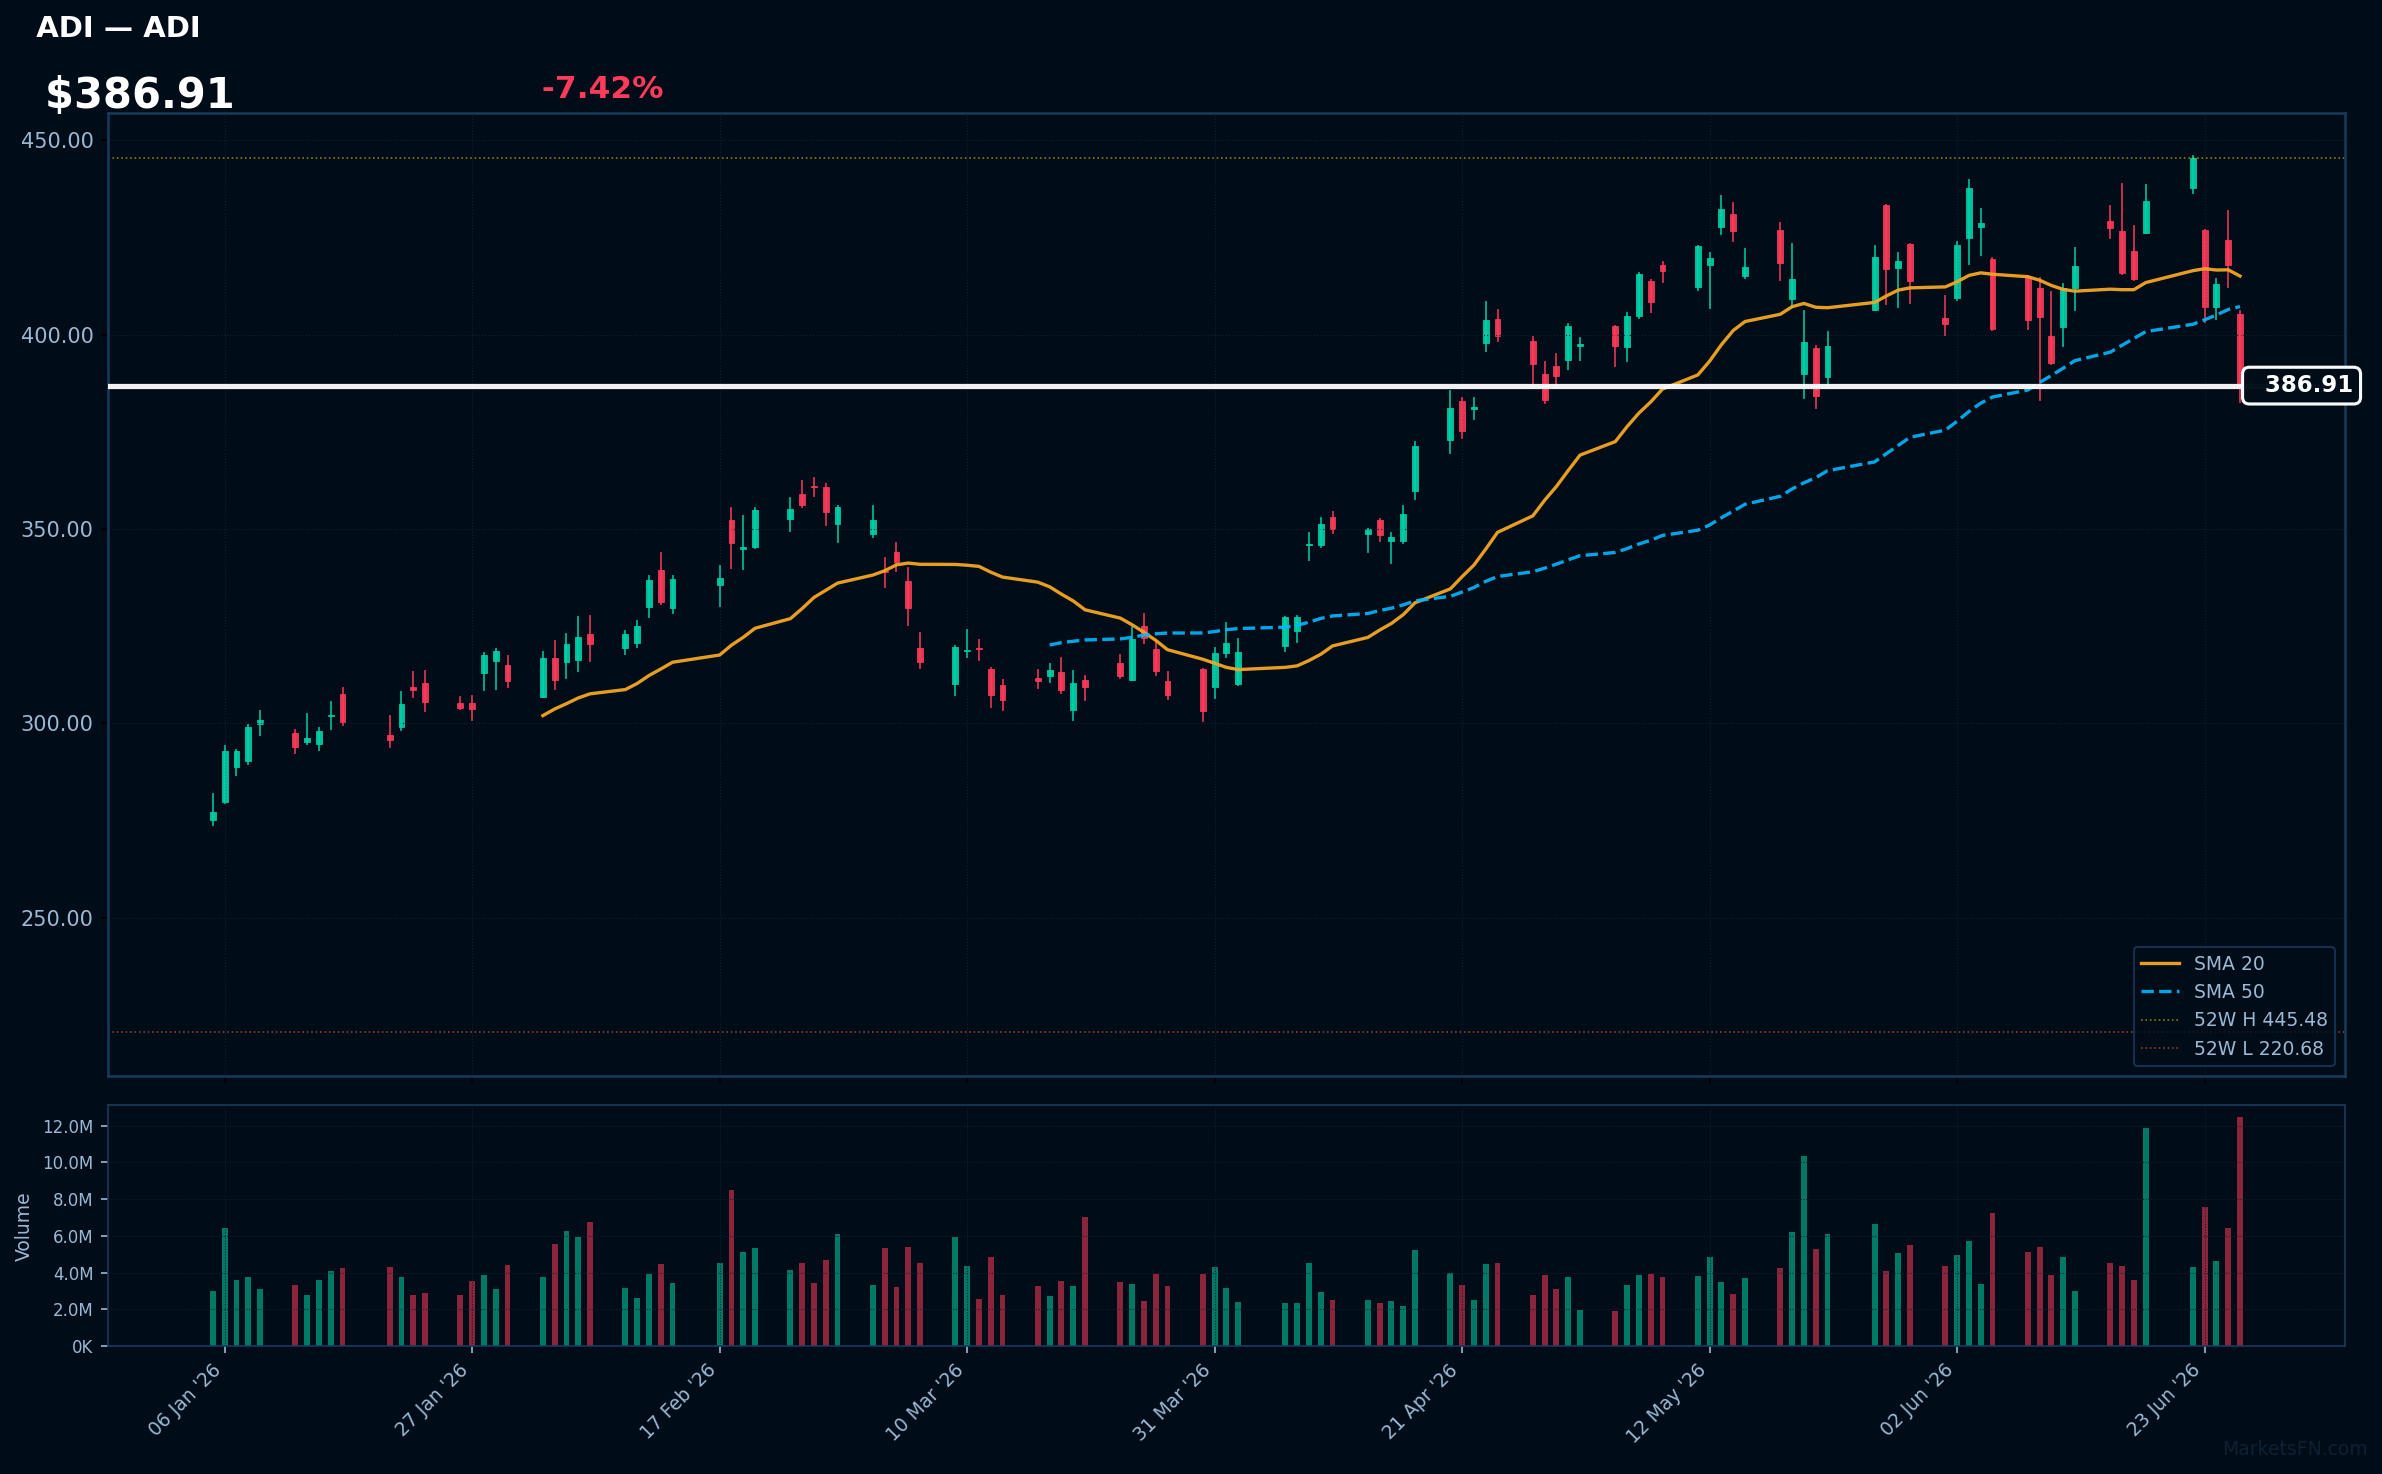
ADI | Analog Devices Inc | Technology | Price: $386.91 | Day: -7.42% | 1W: -10.94% | 1M: -7.19% | RSI: 42.6 | vs MA200: +22.9% | Trend: Above MA200 · Below MA20, MA50
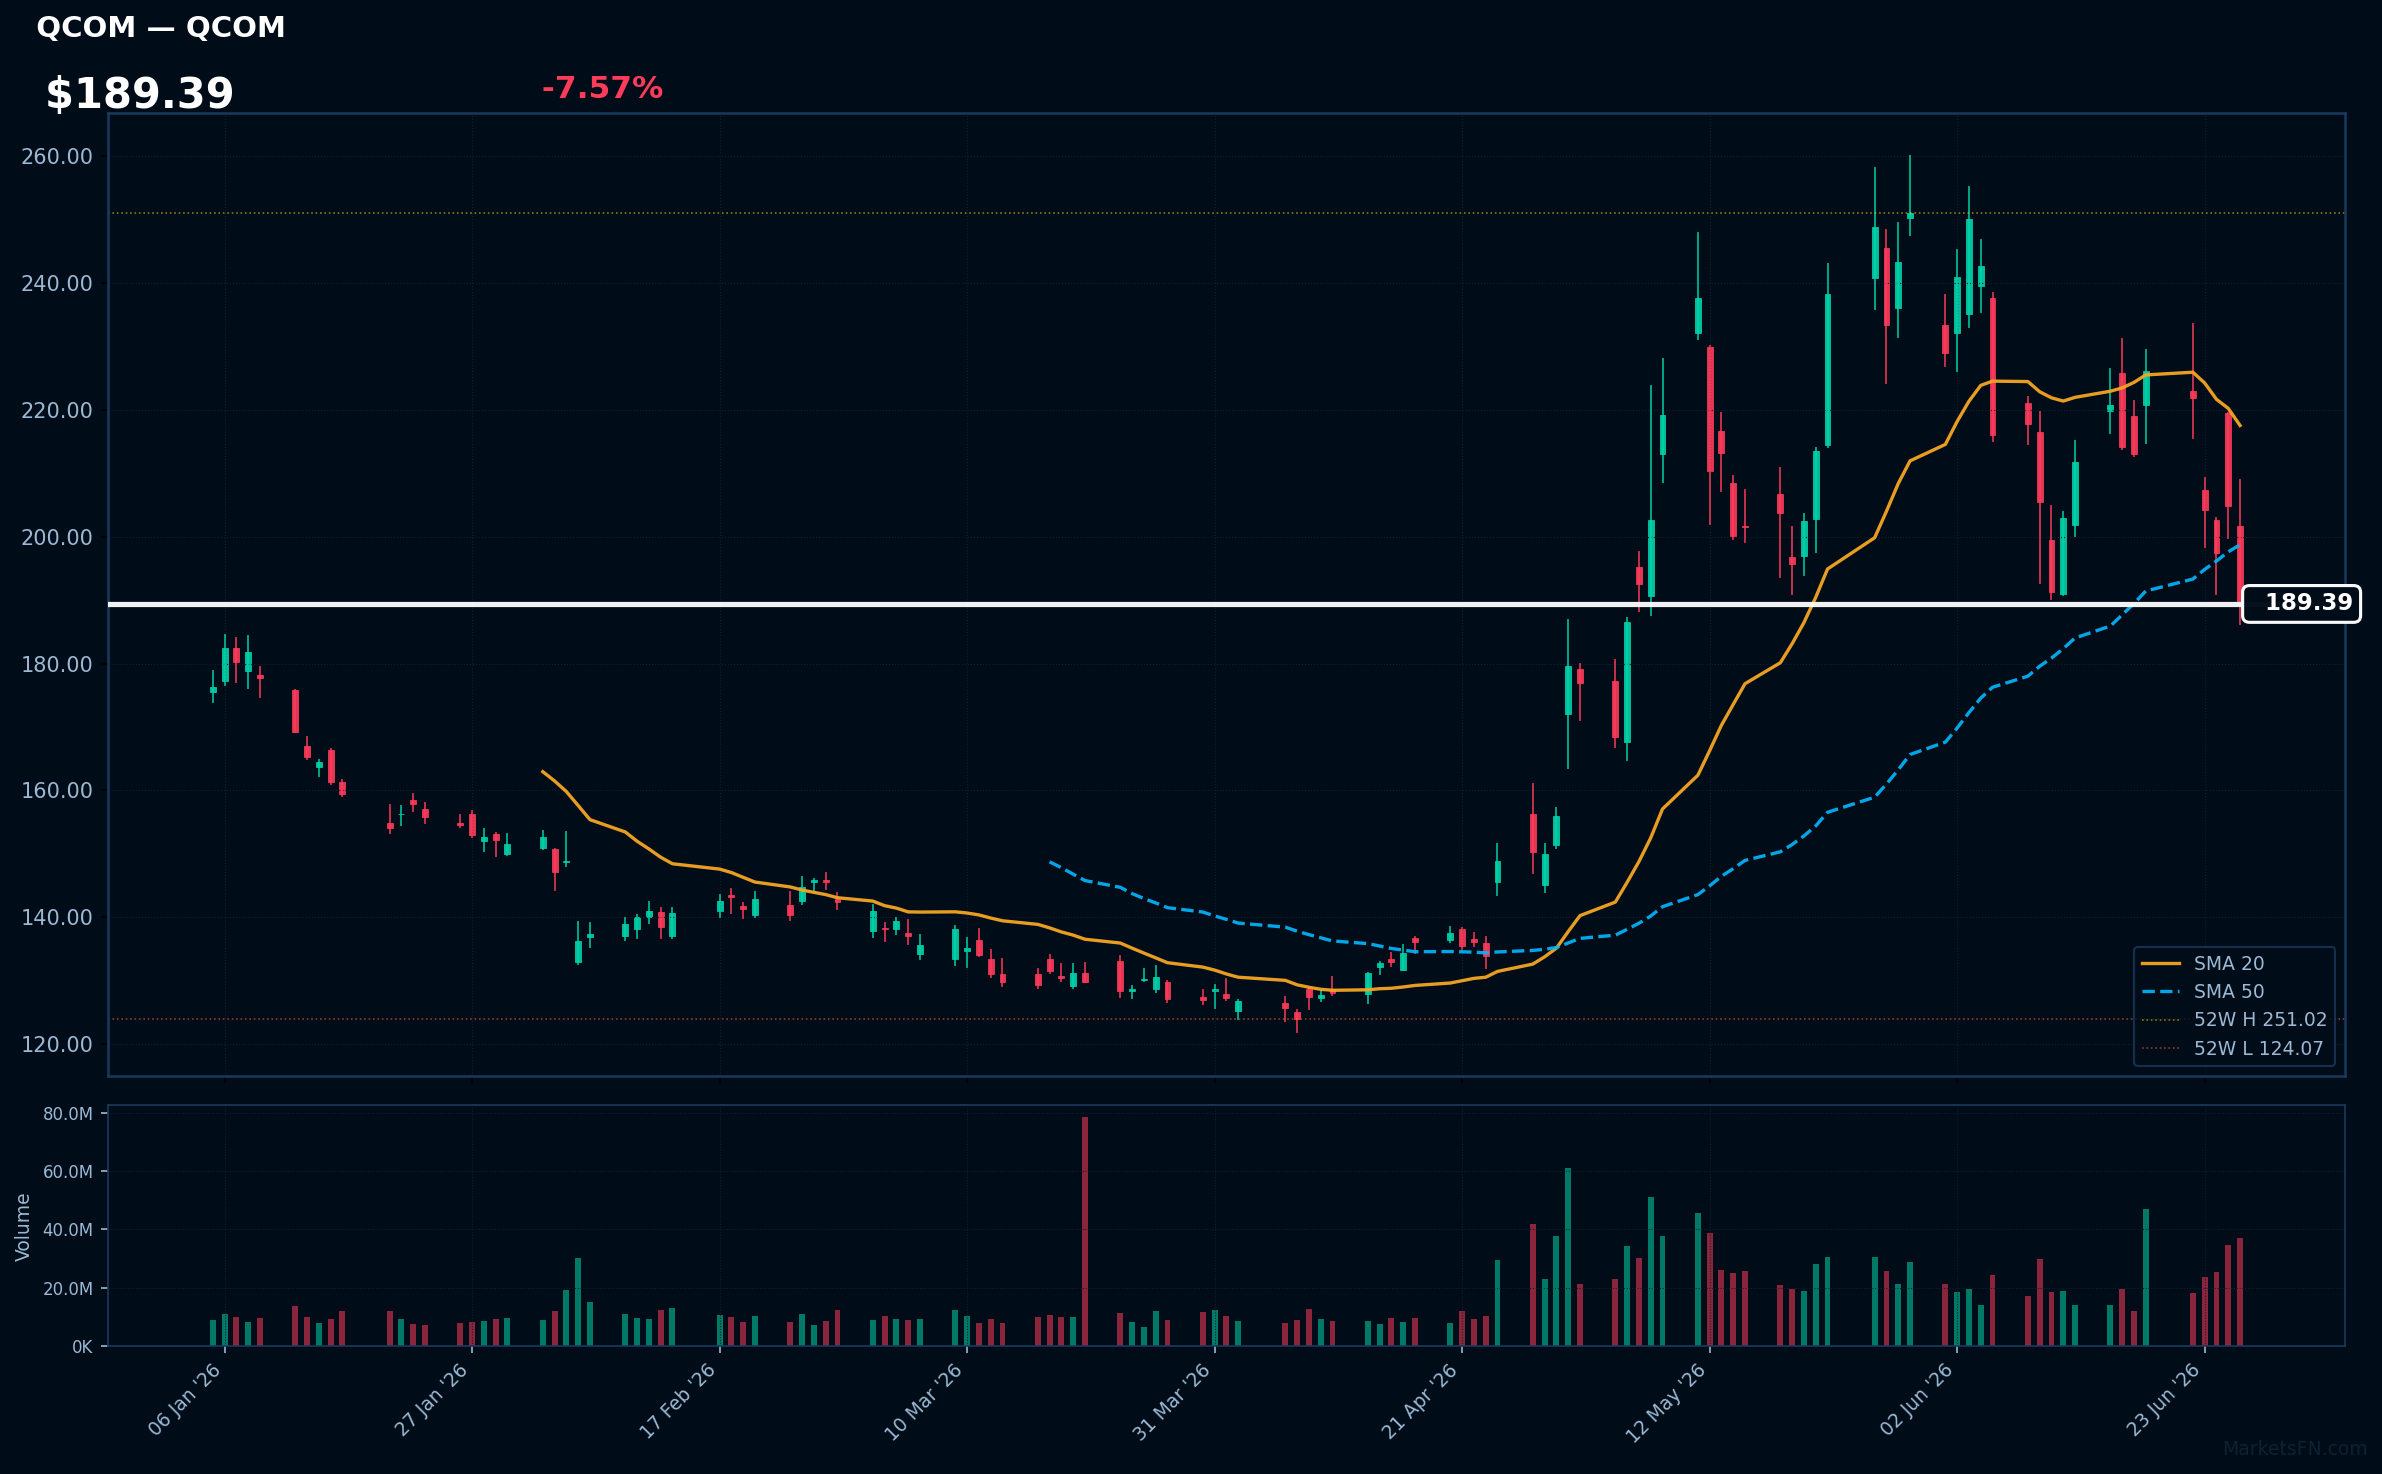
QCOM | Qualcomm, Inc | Technology | Price: $189.39 | Day: -7.57% | 1W: -16.24% | 1M: -18.86% | RSI: 42.5 | vs MA200: +12.8% | Trend: Above MA200 · Below MA20, MA50
Recent headlines (last 12h)
- Stock Market's Risk Appetite Is Shifting as AI, Iran, and Fed Fears Linger
- New leader board: Citi refreshes AI compute semiconductor picks
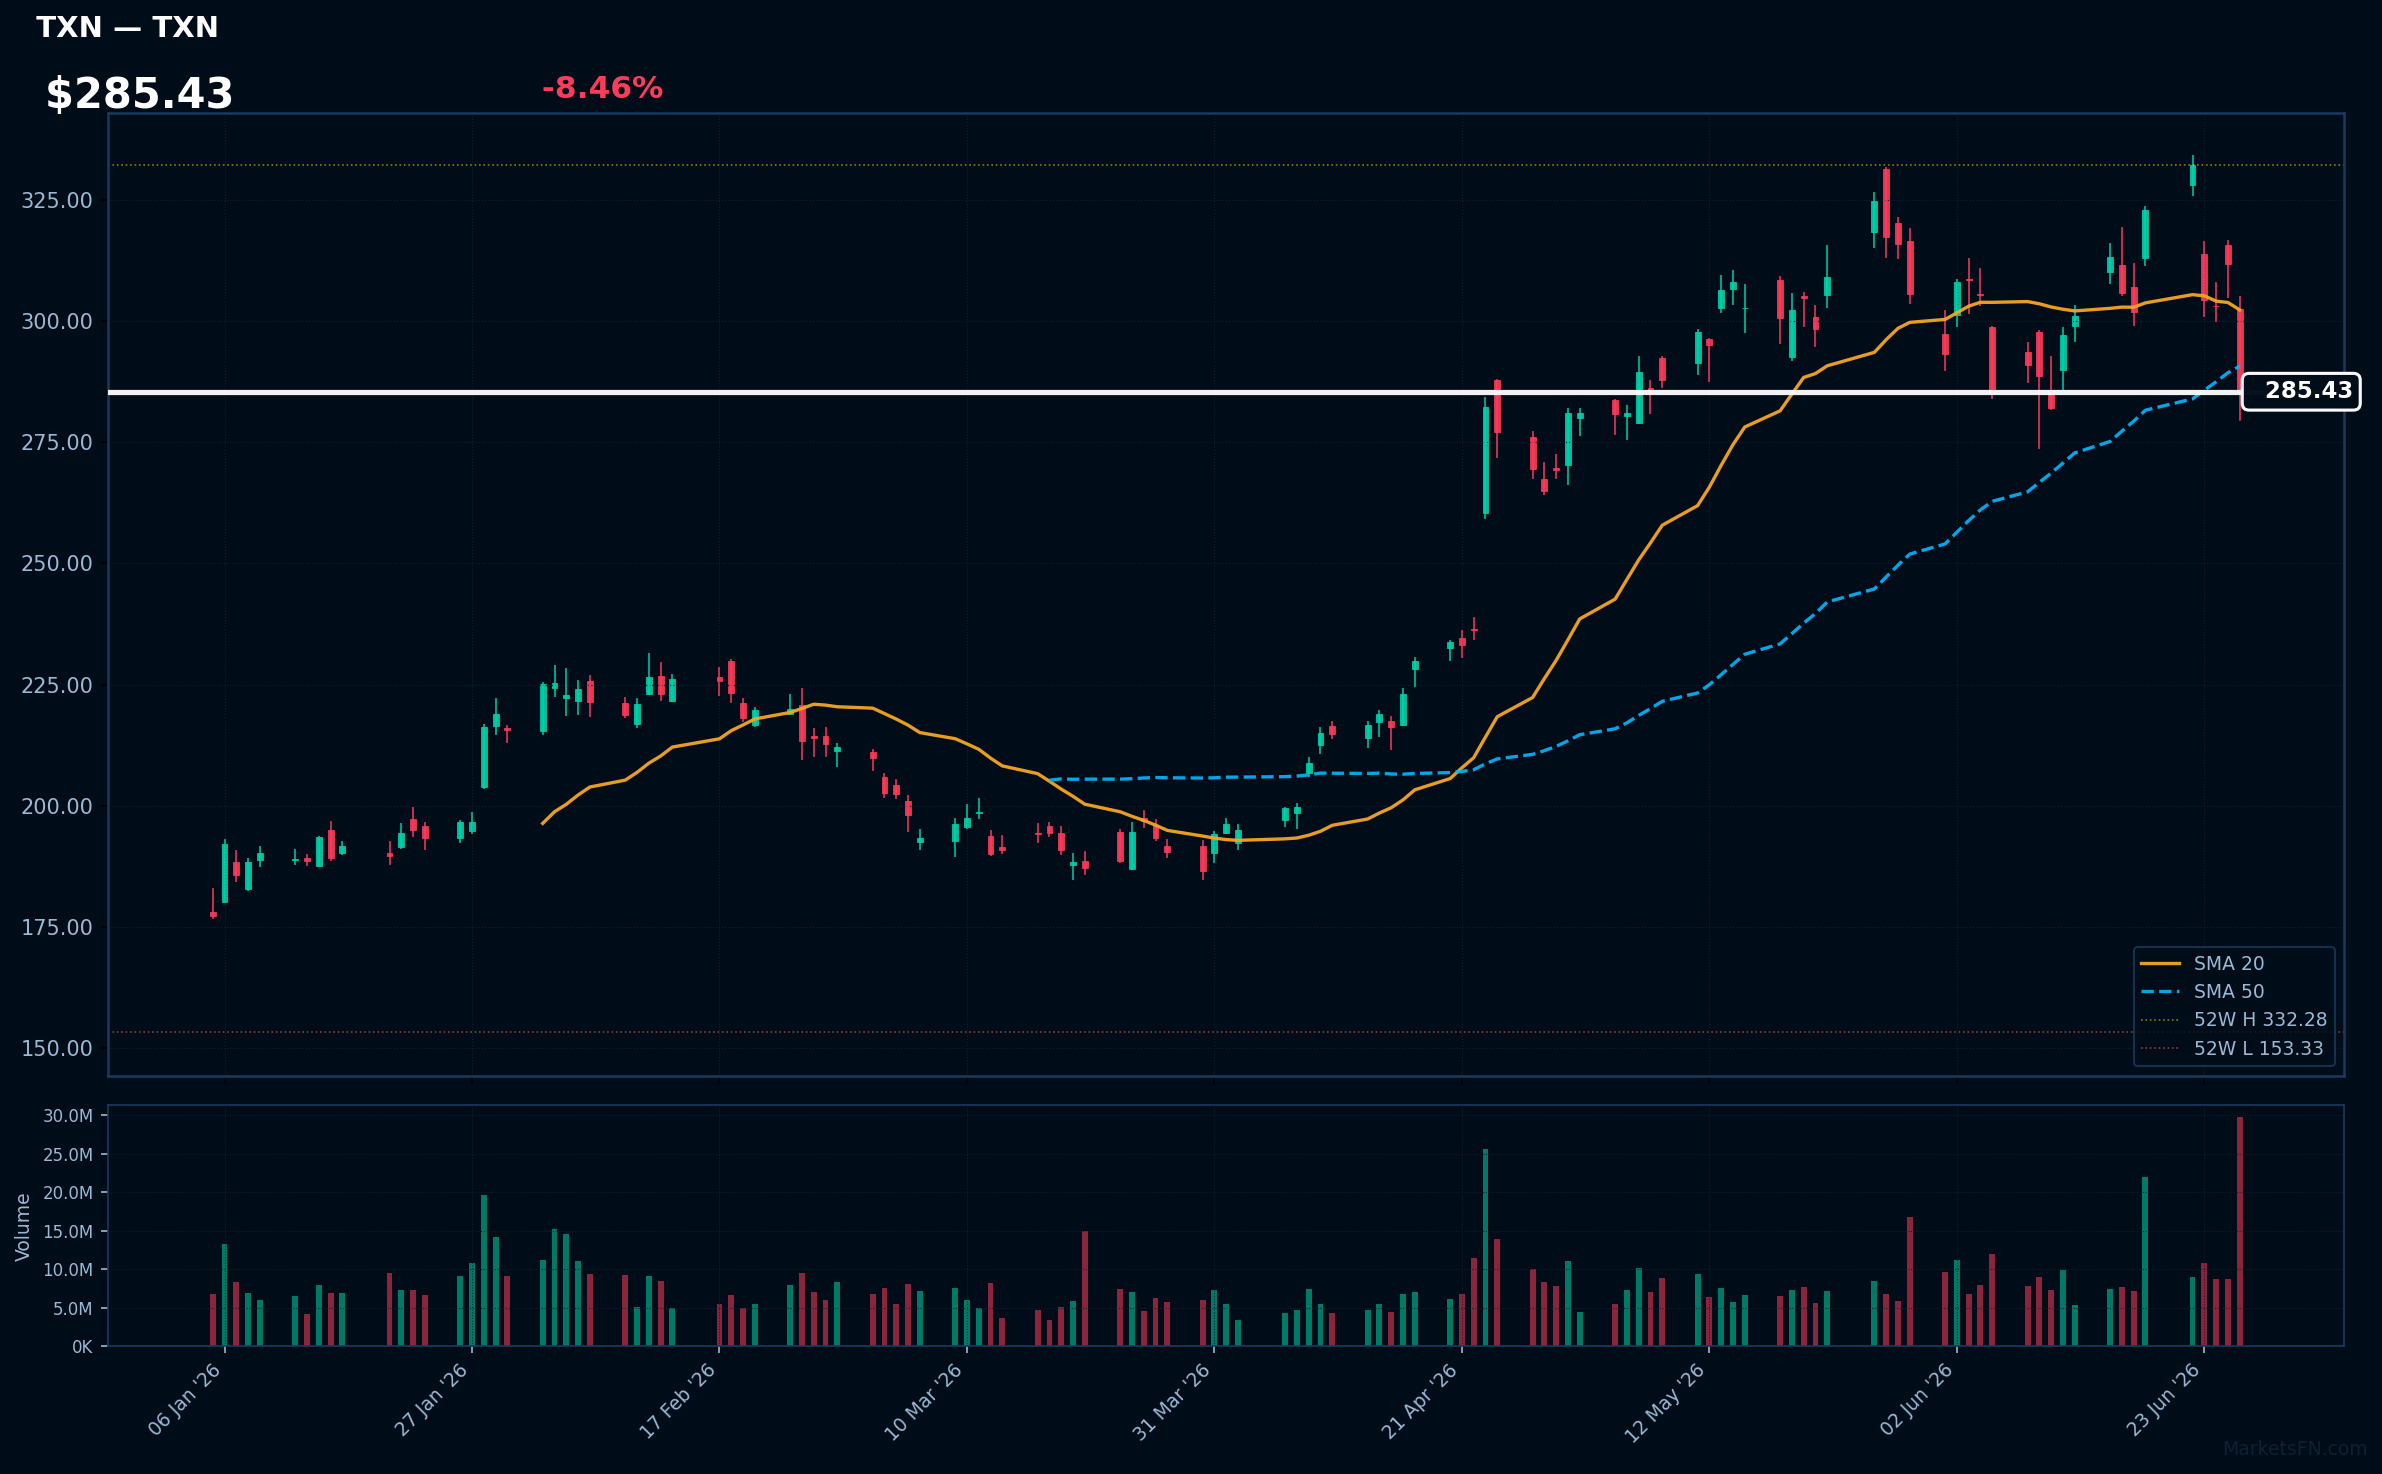
TXN | Texas Instruments Inc | Technology | Price: $285.43 | Day: -8.46% | 1W: -11.59% | 1M: -10.09% | RSI: 44.7 | vs MA200: +33.8% | Trend: Above MA200 · Below MA20, MA50
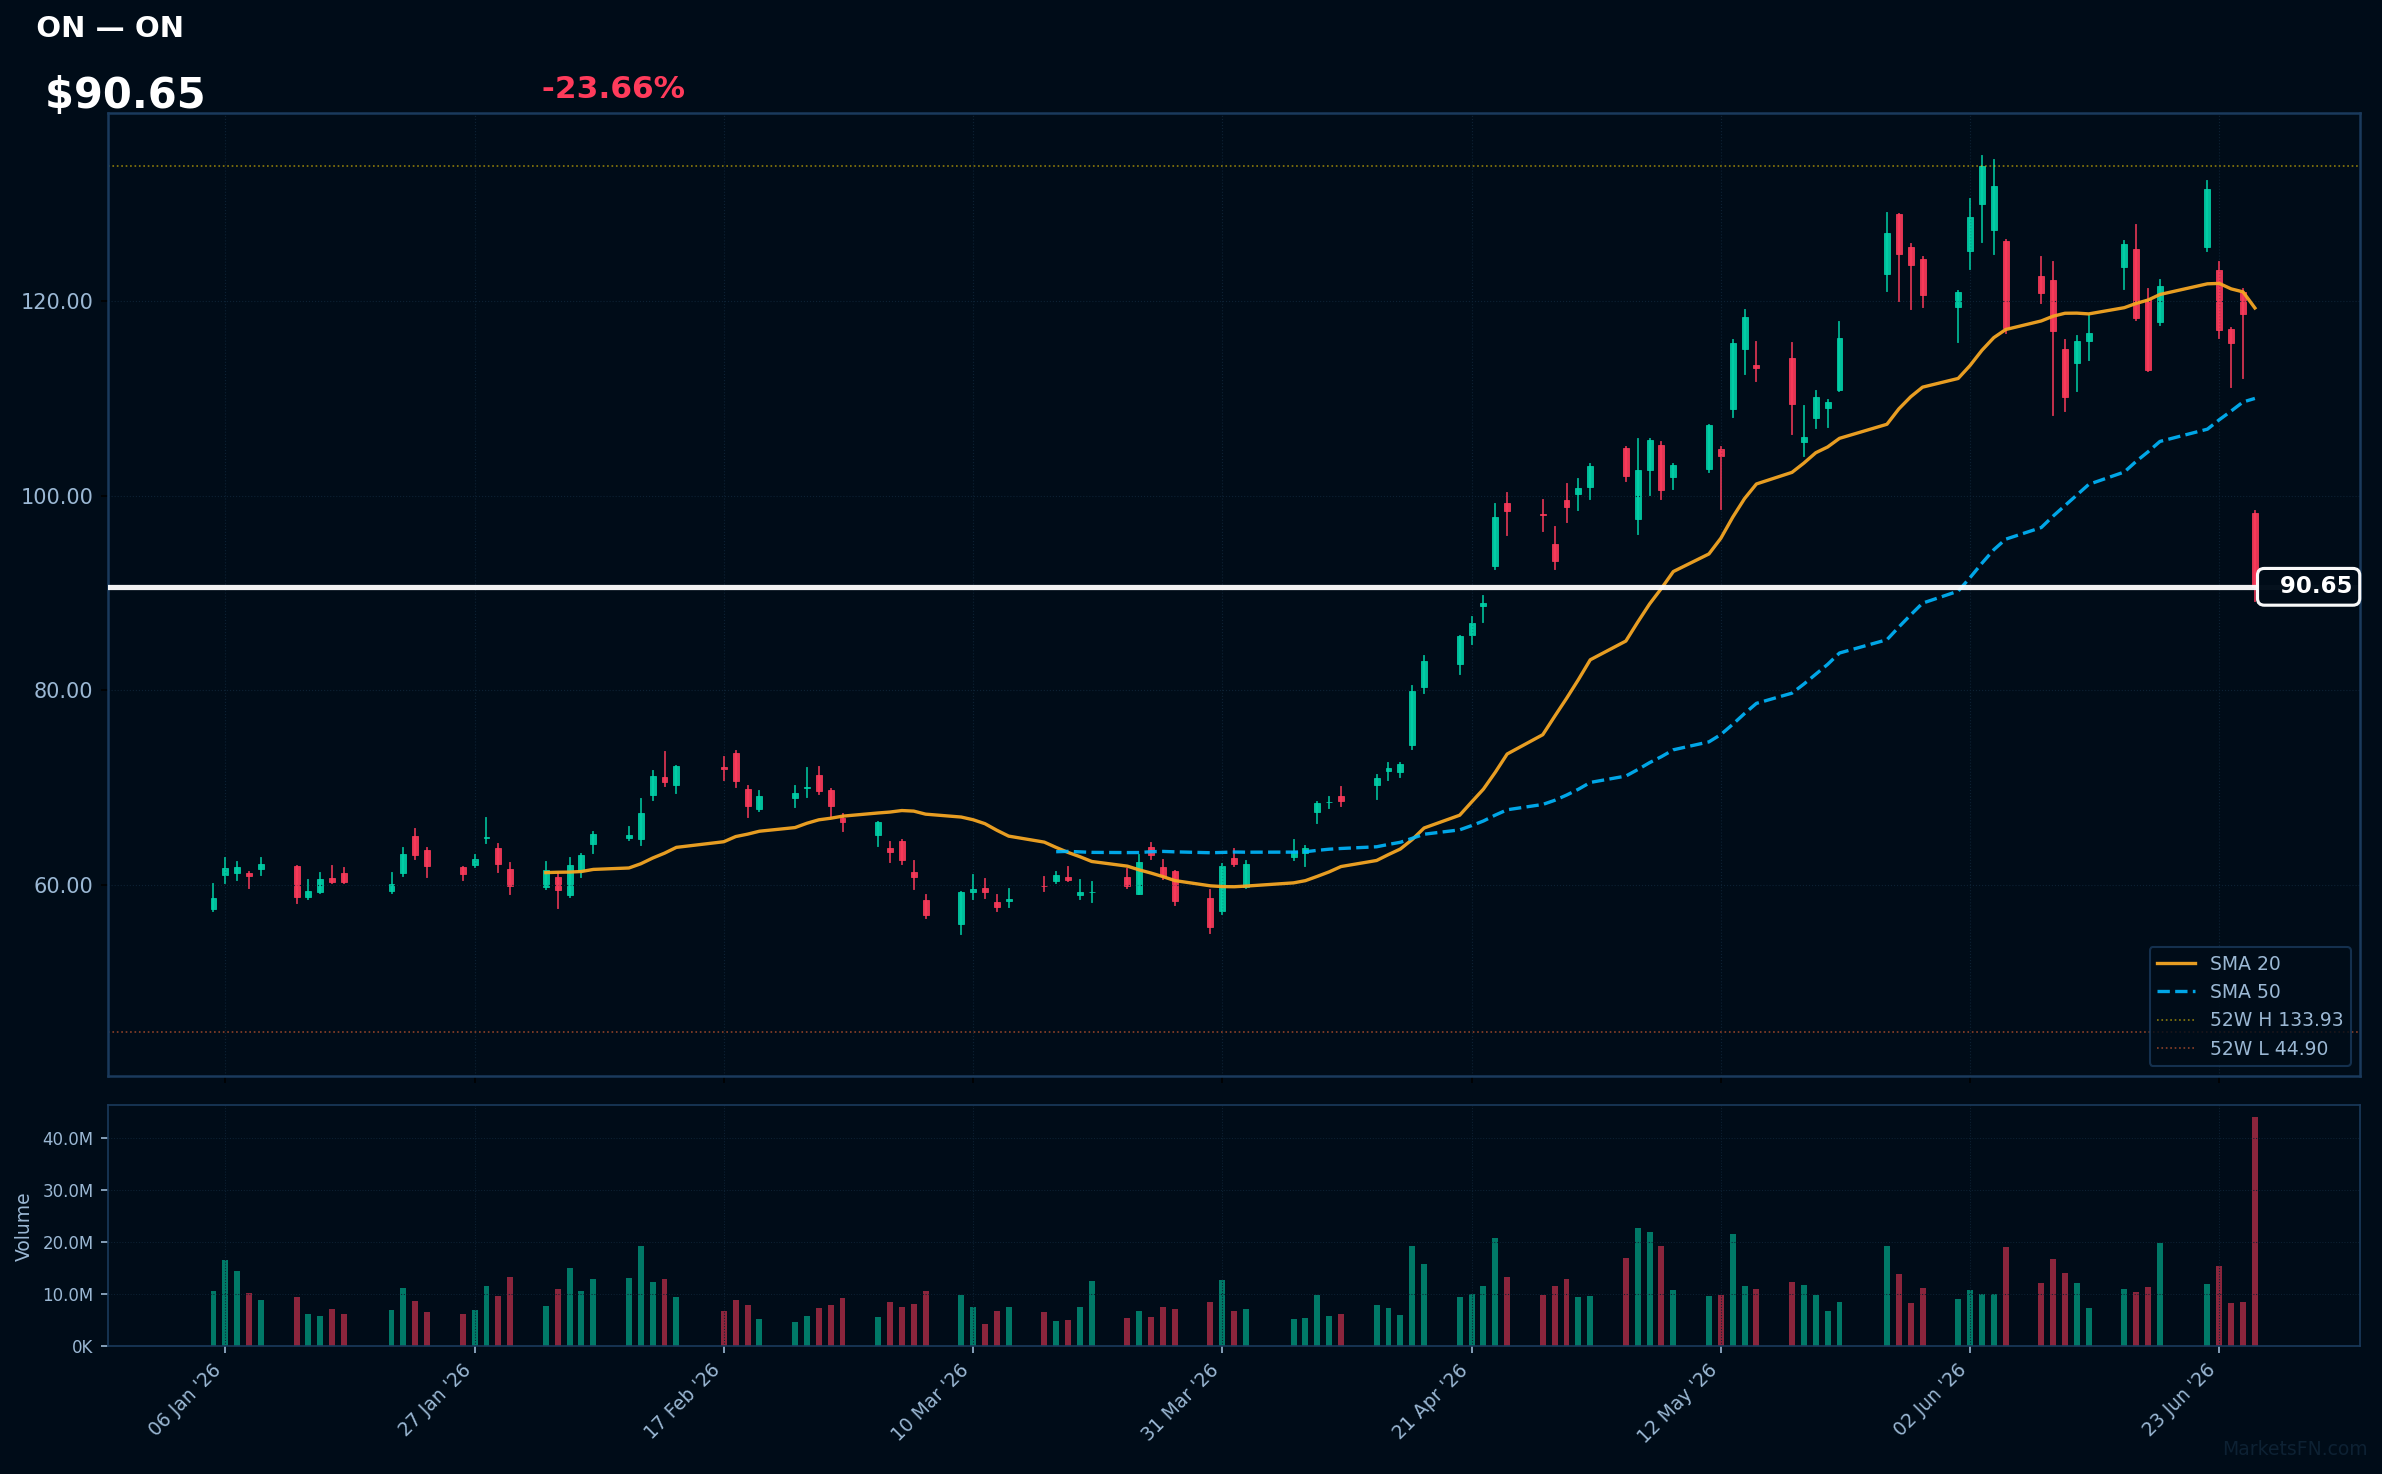
ON | ON Semiconductor Corp | Technology | Price: $90.65 | Day: -23.66% | 1W: -25.46% | 1M: -27.42% | RSI: 37.2 | vs MA200: +29.2% | Trend: Above MA200 · Below MA20, MA50
Market Commentary
The Nasdaq 100 session on June 29, 2026, showed a positive tone with 66 out of 101 constituents advancing, representing a 65.3% gain ratio, and an average daily change of +0.66%. This indicates a relatively broad-based rally, despite only 12 stocks (11.9%) trading above their MA200, suggesting the uptrend may be led by a subset of strong performers.
The technology sector exhibited a clear rotation, with stocks like MSFT among the top gainers, while others such as LRCX, AMAT, and QCOM were among the top losers. This dichotomy within the tech sector suggests a nuanced market environment where certain tech names are favored over others, potentially driven by earnings or sector-specific news. The presence of non-tech sectors like Healthcare (BIIB) and Real Estate (CSGP) among the top gainers adds to the complexity.
Traders should monitor the MA200 level, as only 11.9% of stocks are currently trading above it, indicating a potential risk of a broader correction if this support fails. The next catalyst to watch would be the upcoming earnings reports from key constituents, particularly those that were among today's top movers, to gauge if the current rotation and sector dynamics continue or reverse.
Methodology
Daily ranking uses the latest session close versus the prior close. RSI (14-day EWM), MA20, MA50, and MA200 are computed from 12 months of daily OHLCV data sourced from Yahoo Finance. Charts show the last 120 trading sessions with SMA 20/50, 52-week H/L markers, and volume. Recent news (last 12 h) is sourced from FinViz. Updated every trading day.
Disclaimer
The content on MarketsFN.com is provided for educational and informational purposes only. It does not constitute financial advice, investment recommendations, or trading guidance. All investments involve risks, and past performance does not guarantee future results. You are solely responsible for your investment decisions and should conduct independent research and consult a qualified financial advisor before acting. MarketsFN.com and its authors are not liable for any losses or damages arising from your use of this information.
Related Articles
- Concentrix Corporation (CNXC) Q2 2026 Financial Results Summary — Concentrix (CNXC) Q2 2026: Revenue Decline — Disappointing Quarter for Shareholders In the second quarter of 2026,…
- AeroVironment (AVAV) Q2 2026 Financial Results Summary — AeroVironment (AVAV) Q2 2026: Strategic Board Appointment — Positive Outlook AeroVironment, Inc. (NASDAQ: AVAV) has…
- S&P 500 Bull & Bear Radar — June 29, 2026 — S&P 500 Bull & Bear Radar — June 29, 2026 A daily technical sweep of 496 S&P 500 constituents ranked by session…
- S&P 500 Bull & Bear Radar — June 26, 2026 — S&P 500 Bull & Bear Radar — June 26, 2026 A daily technical sweep of 495 S&P 500 constituents ranked by session…
- Beyond Air Inc. (XAIR) Rises 3.67% After Earnings — Post Earning Analysis Beyond Air Inc. (XAIR) Rises 3.67% After Earnings Beyond Air, Inc. specializes in developing…