S&P 500 Bull & Bear Radar — June 26, 2026
· Stocks · QuoteReporter
S&P 500 Bull & Bear Radar — June 26, 2026
A daily technical sweep of 495 S&P 500 constituents ranked by session performance, enriched with RSI, MA20/MA50/MA200 trend signals, Bloomberg-style charts, and recent news.
Index-Wide Breadth
| Constituents tracked | 495 |
| Advancing | 336 (67.9%) |
| Declining | 159 (32.1%) |
| Average daily change | +0.65% |
| Above MA200 | 16 (3.2%) |
Top 10 Gainers
Today's strongest S&P 500 performers. Sector leadership: Healthcare (4), Technology (3), Financial (1), Industrials (1), Communication Services (1).
| Ticker | Company | Sector | Price | Day % | 1W % | 1M % | RSI | vs MA200 | Trend |
|---|---|---|---|---|---|---|---|---|---|
| MRNA | Moderna Inc | Healthcare | $66.47 | +11.25% | +3.89% | +39.57% | 70.5 | +65.6% | Above MA20, MA50, MA200 |
| FDS | Factset Research Systems Inc | Financial | $228.55 | +9.44% | +3.28% | -3.04% | 48.8 | -9.9% | Below MA20, MA50, MA200 |
| NOW | ServiceNow Inc | Technology | $96.84 | +8.18% | +2.02% | -5.05% | 45.9 | -28.0% | Below MA20, MA50, MA200 |
| WDAY | Workday Inc | Technology | $121.80 | +7.06% | +4.13% | -2.20% | 45.2 | -31.1% | Below MA20, MA50, MA200 |
| AXON | Axon Enterprise Inc | Industrials | $475.73 | +6.97% | +12.36% | +21.57% | 60.1 | -11.5% | Above MA20, MA50 · Below MA200 |
| LLY | Lilly(Eli) & Co | Healthcare | $1202.72 | +6.65% | +9.51% | +11.09% | 71.8 | +23.2% | Above MA20, MA50, MA200 |
| TKO | TKO Group Holdings Inc | Communication Services | $216.13 | +6.05% | +8.73% | +15.18% | 65.5 | +9.2% | Above MA20, MA50, MA200 |
| BIIB | Biogen Inc | Healthcare | $213.71 | +5.82% | +8.71% | +8.50% | 68.0 | +21.3% | Above MA20, MA50, MA200 |
| DDOG | Datadog Inc | Technology | $233.72 | +5.78% | +4.82% | +5.38% | 59.2 | +52.1% | Above MA50, MA200 · Below MA20 |
| INCY | Incyte Corp | Healthcare | $113.52 | +5.57% | +15.58% | +16.62% | 68.4 | +16.6% | Above MA20, MA50, MA200 |
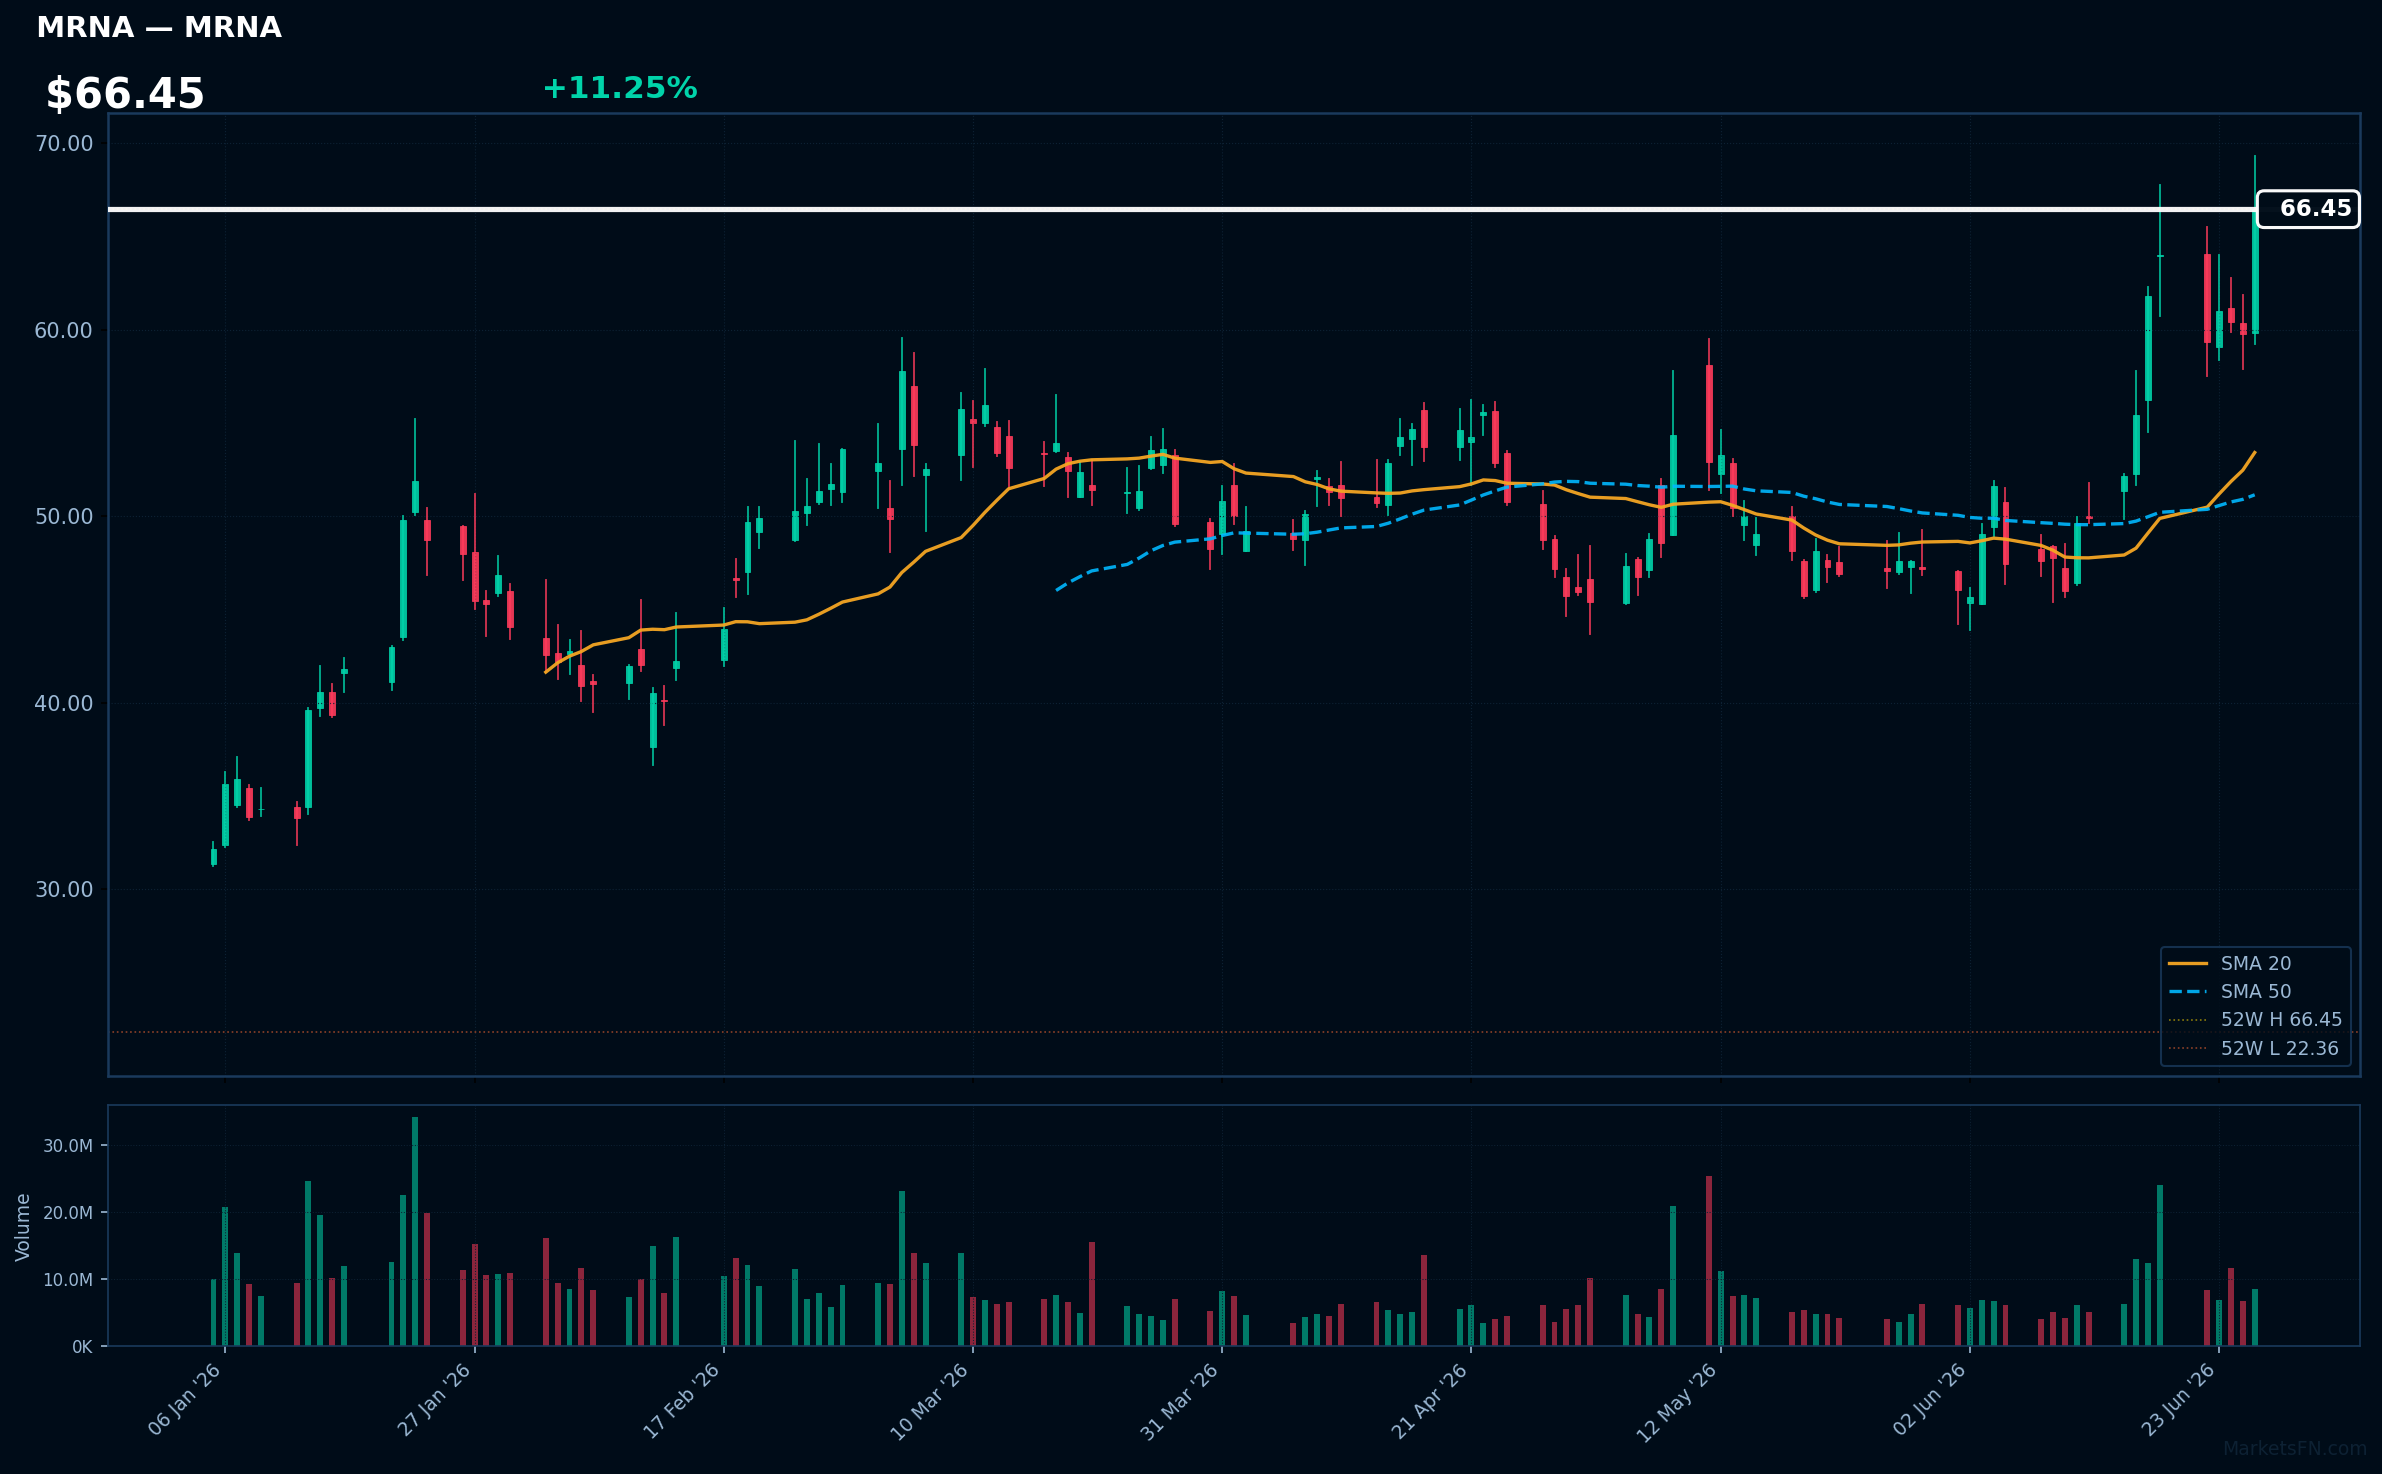
MRNA | Moderna Inc | Healthcare | Price: $66.47 | Day: +11.25% | 1W: +3.89% | 1M: +39.57% | RSI: 70.5 | vs MA200: +65.6% | Trend: Above MA20, MA50, MA200
Recent headlines (last 12h)
- Why Moderna Stock Is Soaring and Leading the S&P 500 Today
- From Vaccines to Therapeutics; How Biotech Is Addressing the Ebola Outbreak
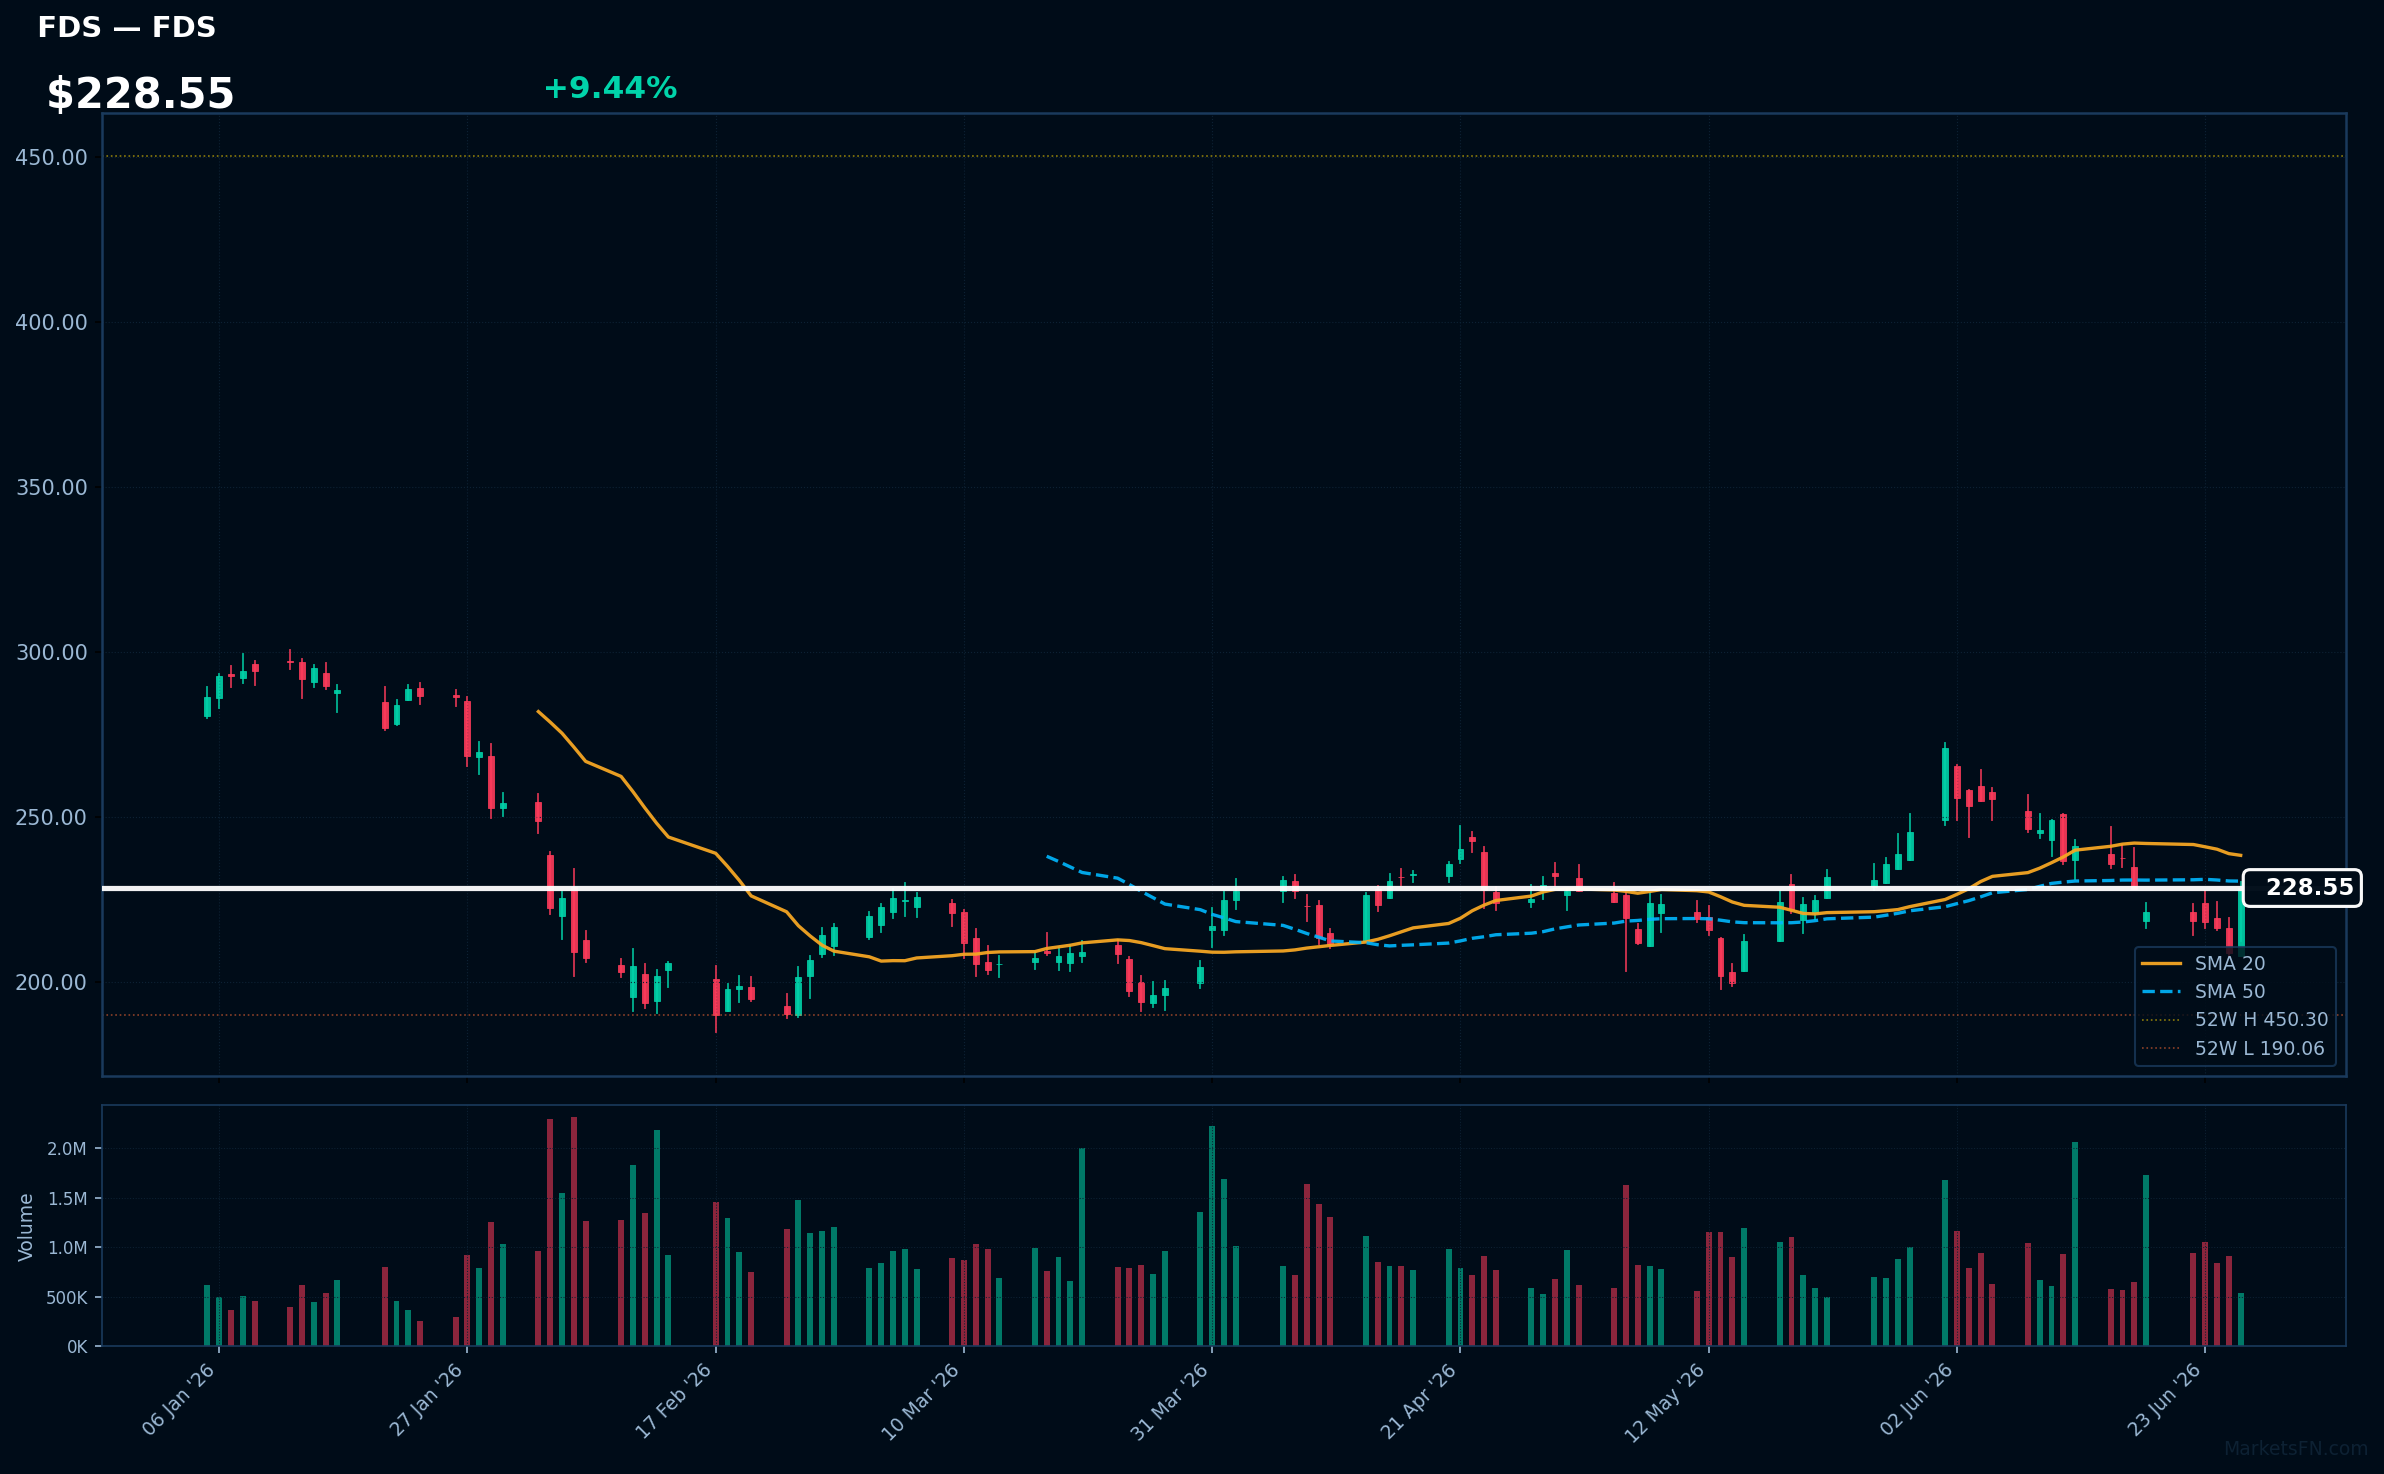
FDS | Factset Research Systems Inc | Financial | Price: $228.55 | Day: +9.44% | 1W: +3.28% | 1M: -3.04% | RSI: 48.8 | vs MA200: -9.9% | Trend: Below MA20, MA50, MA200
Recent headlines (last 12h)
- FactSet Expands Model Context Protocol Suite to Portfolio Analytics
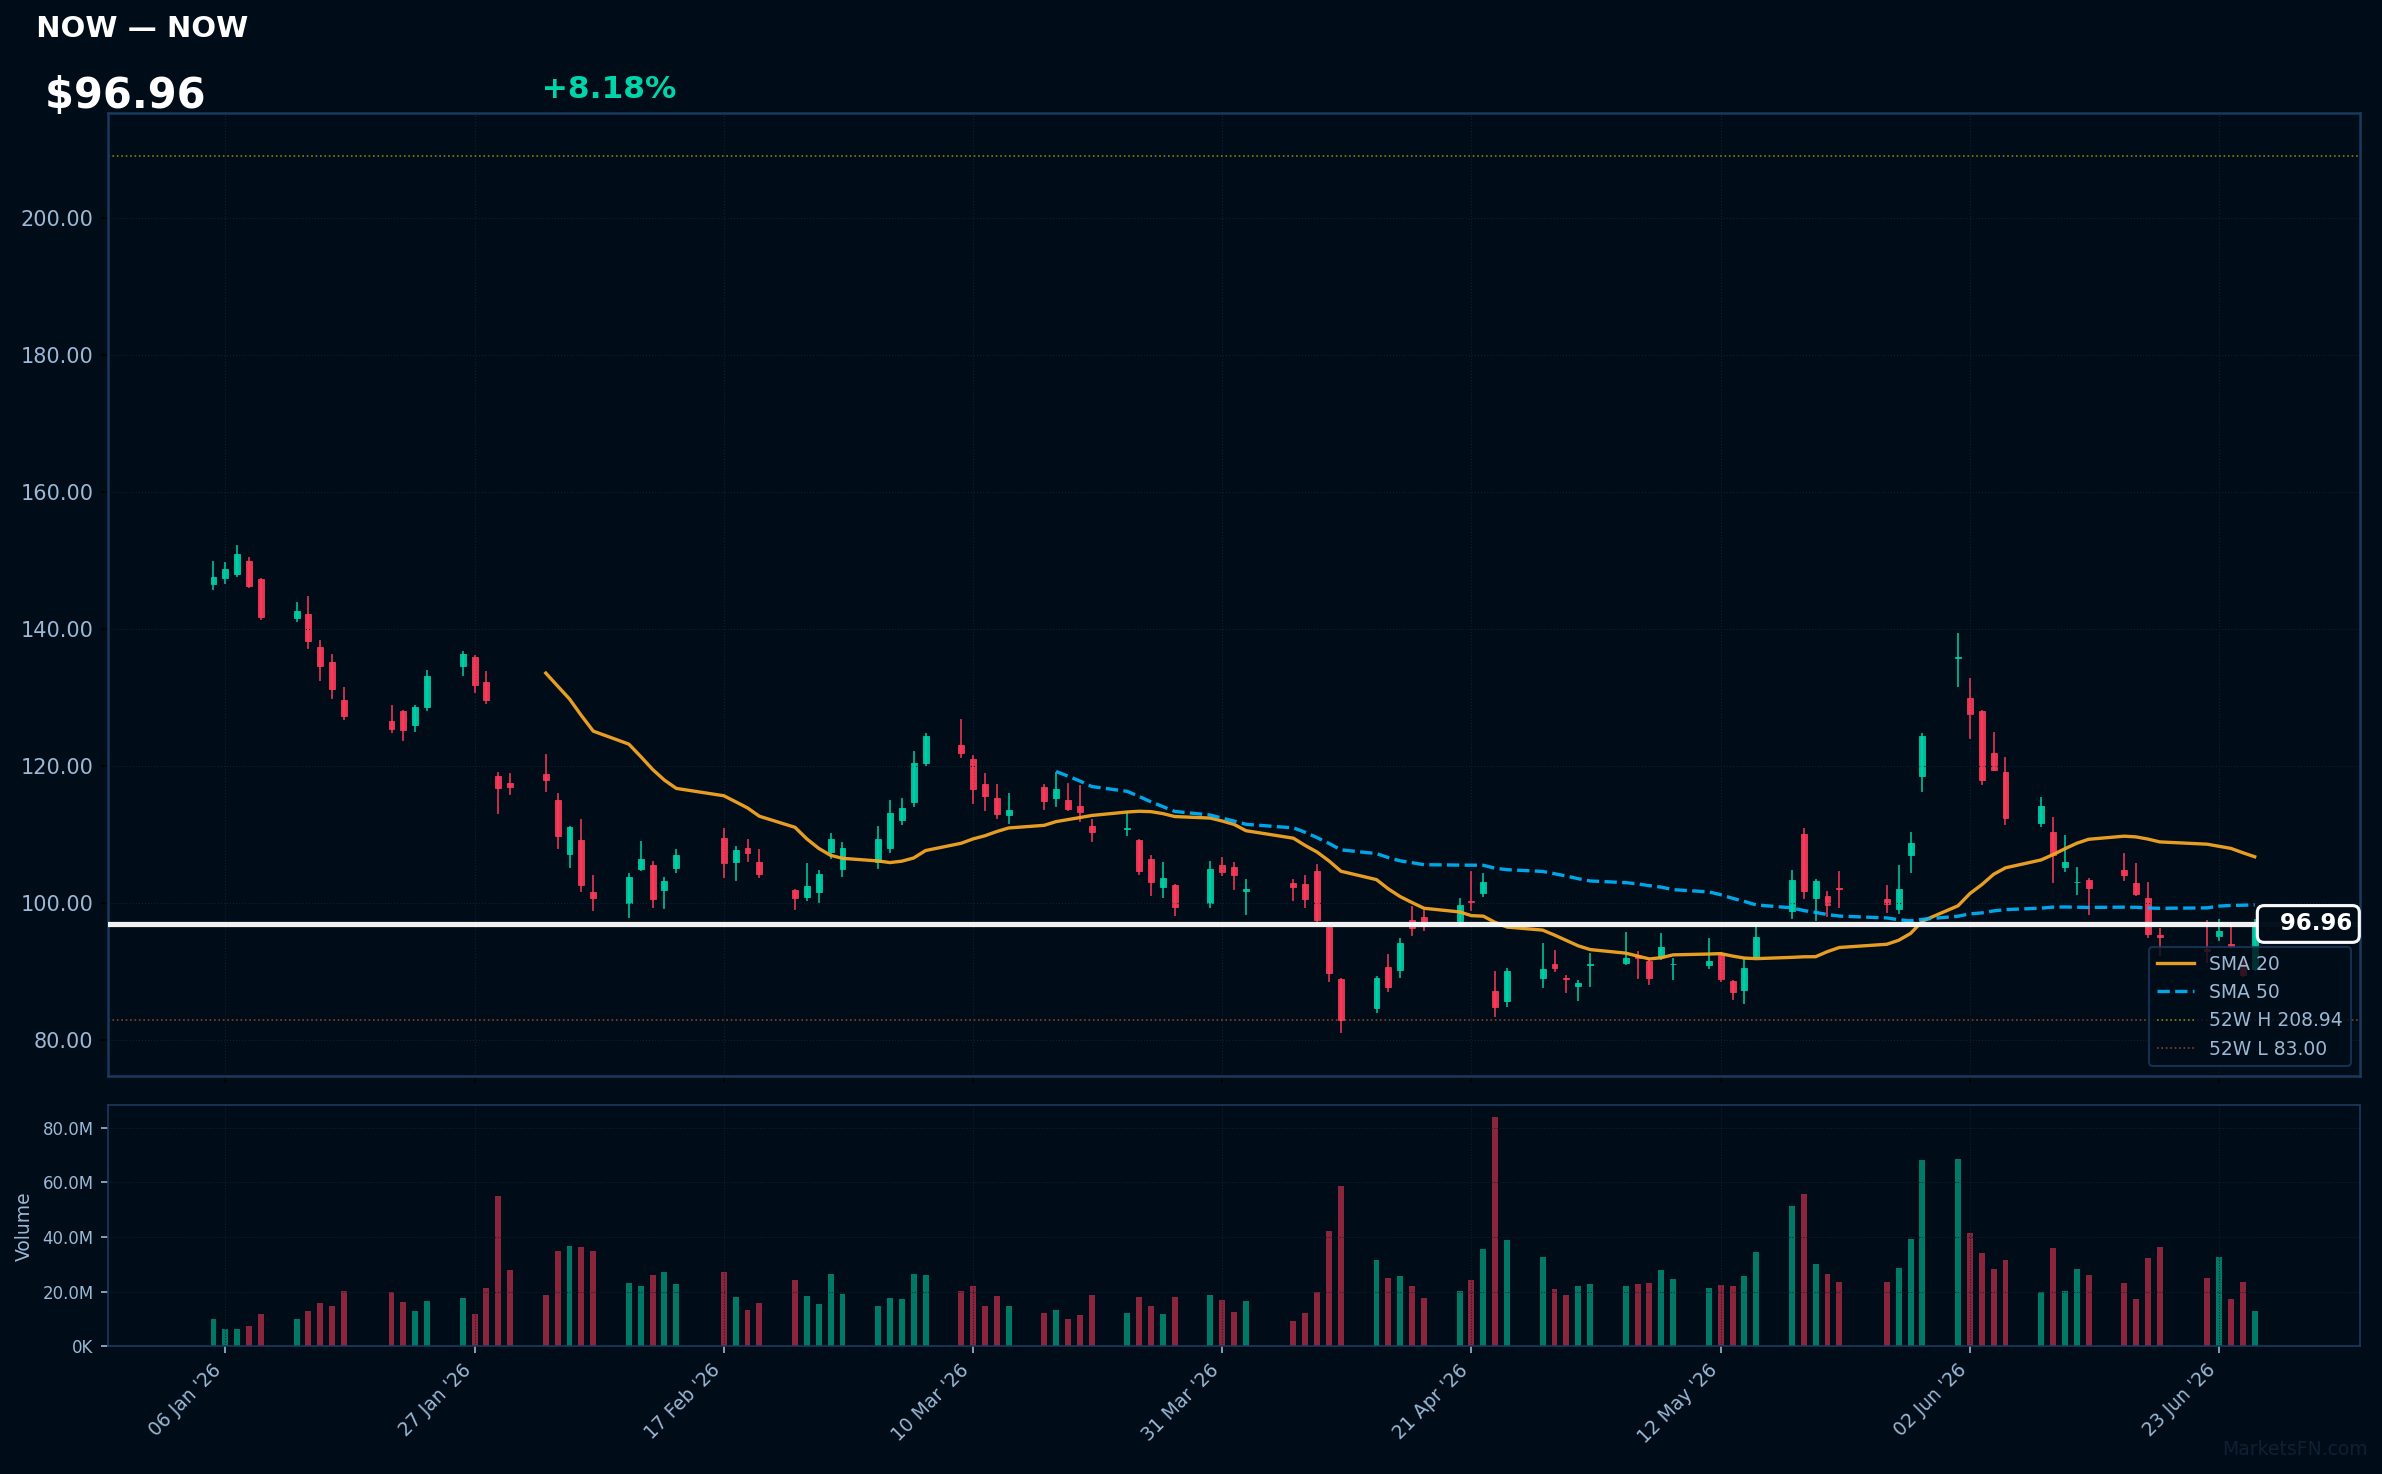
NOW | ServiceNow Inc | Technology | Price: $96.84 | Day: +8.18% | 1W: +2.02% | 1M: -5.05% | RSI: 45.9 | vs MA200: -28.0% | Trend: Below MA20, MA50, MA200
Recent headlines (last 12h)
- The Market Rotation Is On. ServiceNow, Workday, and AppLovin Rise as Software Tops Chips.
- Jefferies says these 4 software stocks screen well in IT exec survey
- Human-led Management of Autonomous Digital Workers: Pax8Global Sr Director Renee McCloden, Halo CCO Tim Barton-Wines, Live from Pax8 Beyond 2026
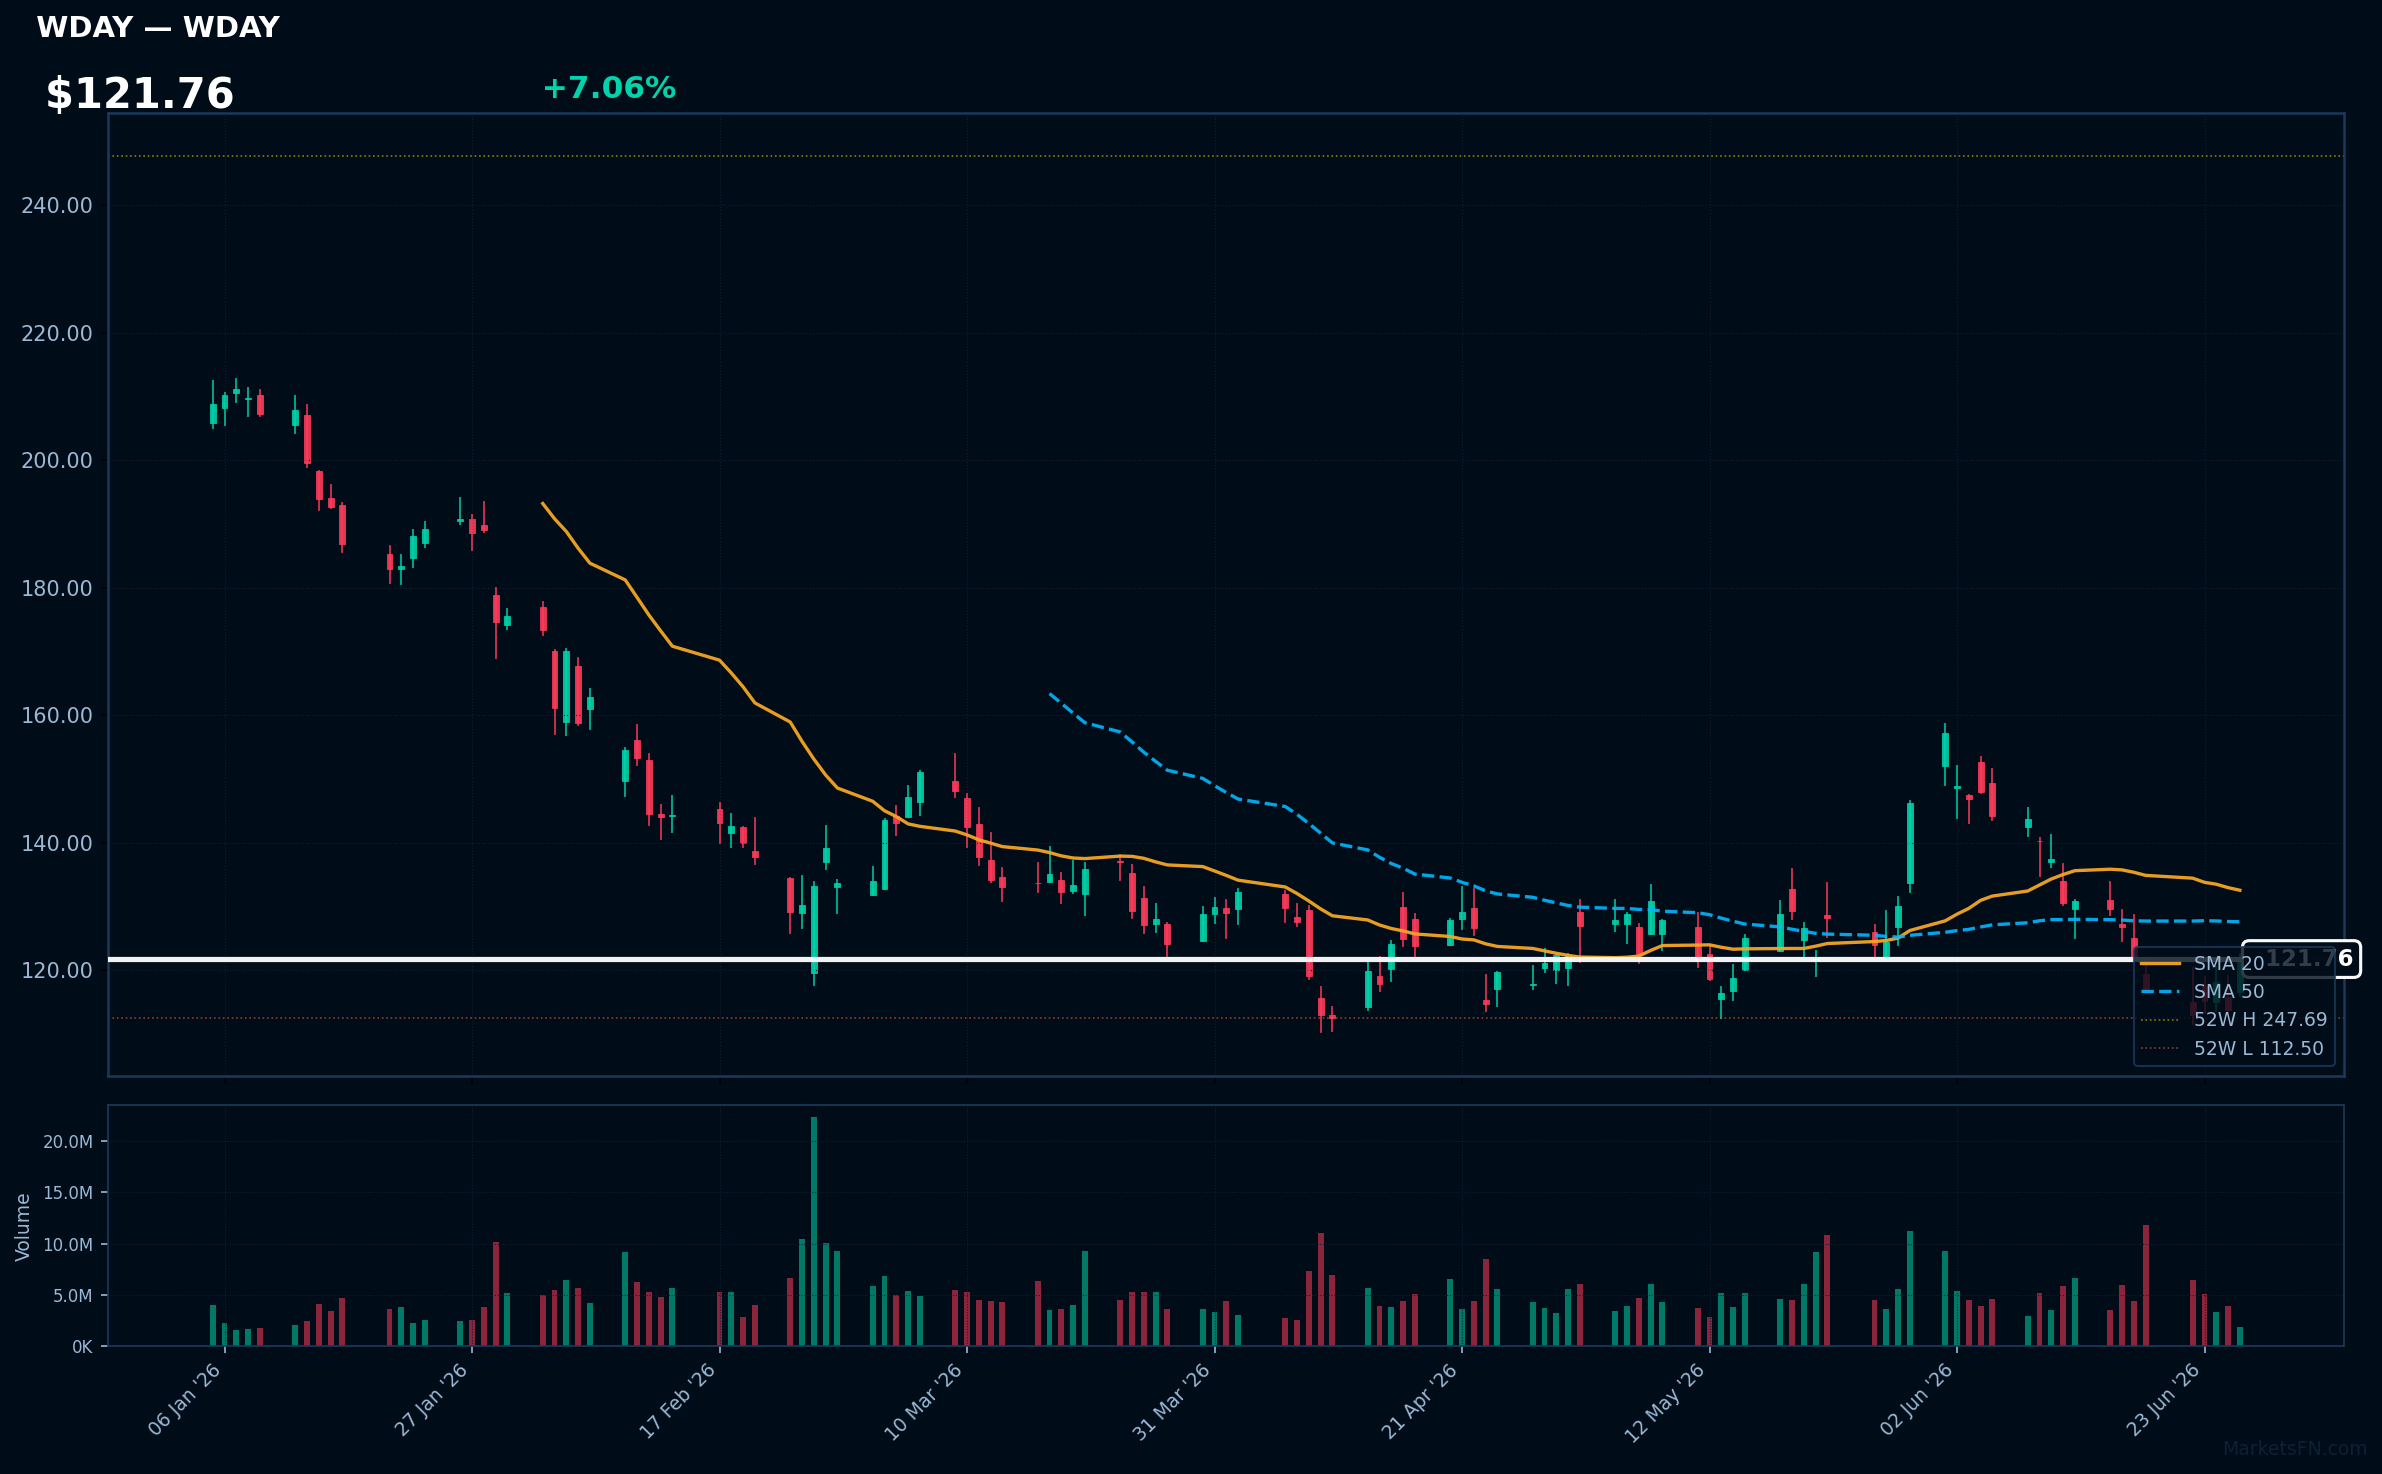
WDAY | Workday Inc | Technology | Price: $121.80 | Day: +7.06% | 1W: +4.13% | 1M: -2.20% | RSI: 45.2 | vs MA200: -31.1% | Trend: Below MA20, MA50, MA200
Recent headlines (last 12h)
- The Market Rotation Is On. ServiceNow, Workday, and AppLovin Rise as Software Tops Chips.
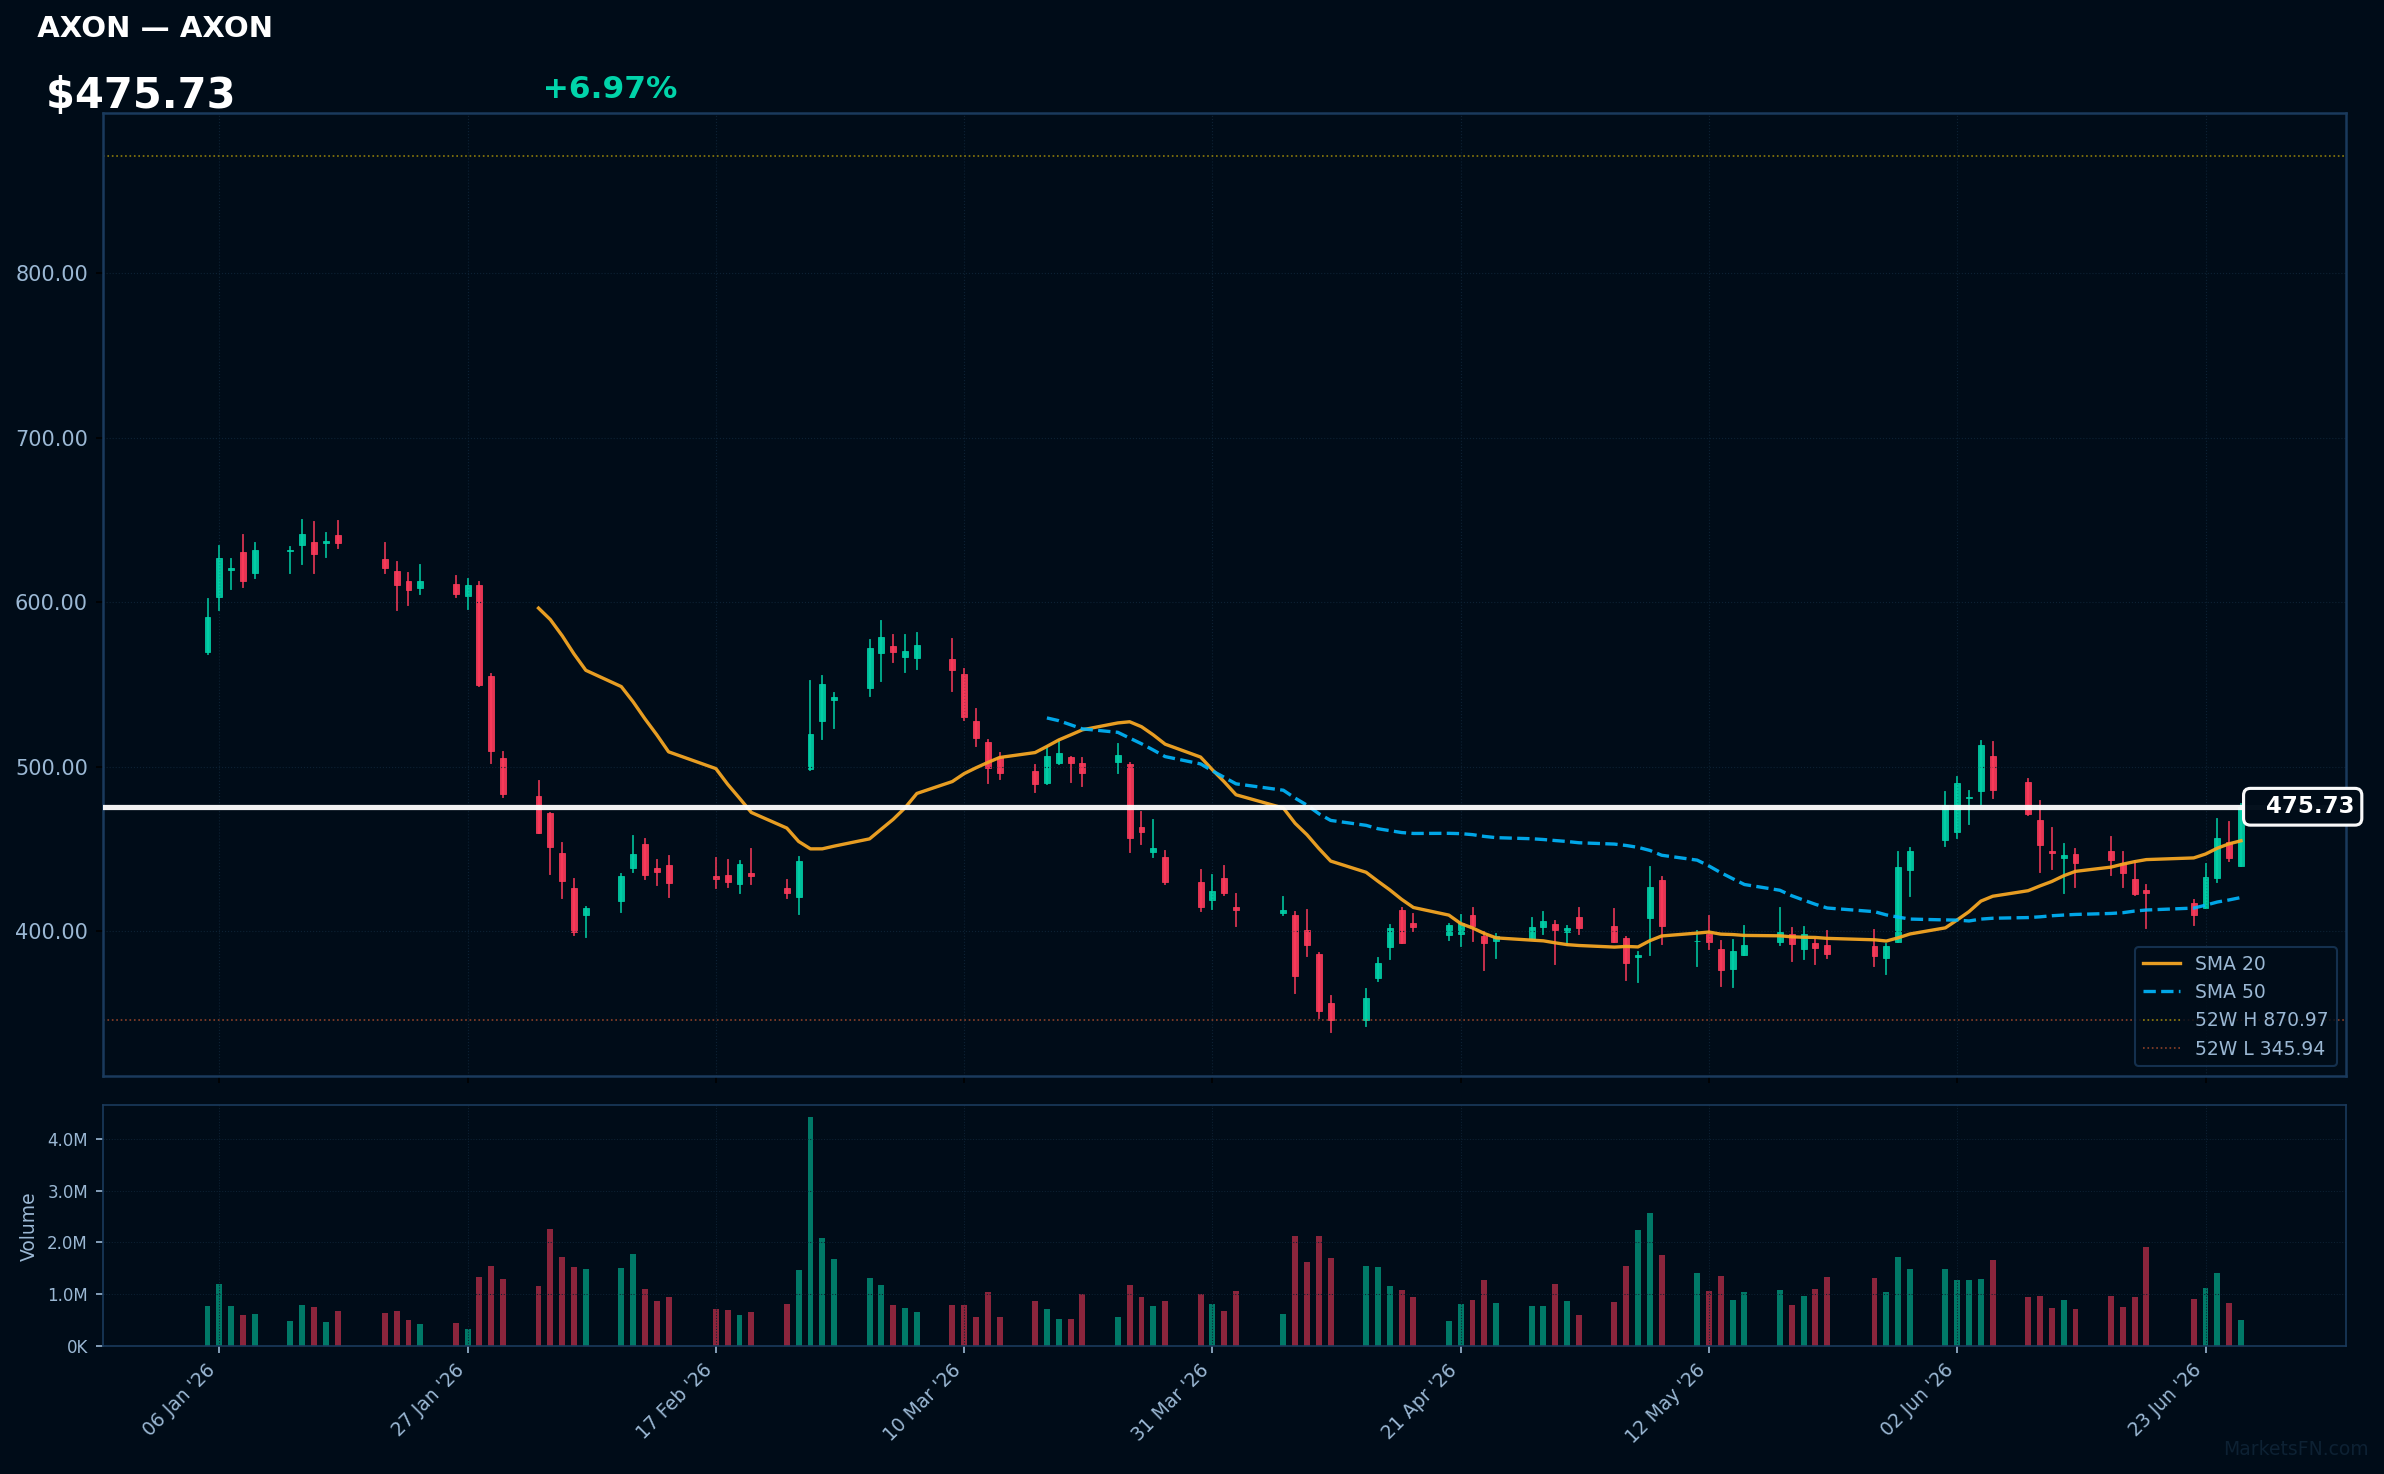
AXON | Axon Enterprise Inc | Industrials | Price: $475.73 | Day: +6.97% | 1W: +12.36% | 1M: +21.57% | RSI: 60.1 | vs MA200: -11.5% | Trend: Above MA20, MA50 · Below MA200
LLY | Lilly(Eli) & Co | Healthcare | Price: $1202.72 | Day: +6.65% | 1W: +9.51% | 1M: +11.09% | RSI: 71.8 | vs MA200: +23.2% | Trend: Above MA20, MA50, MA200
Recent headlines (last 12h)
- How Micron aims to break through the risk cycle that has spooked investors for decades
- AbbVie Stock's Growth Story Has One Question Mark
- Why Moderna Stock Is Soaring and Leading the S&P 500 Today
- Trump name-dropped Nokia and Eli Lilly in a Pennsylvania speech. Here's what happened to 5 other stocks he singled out
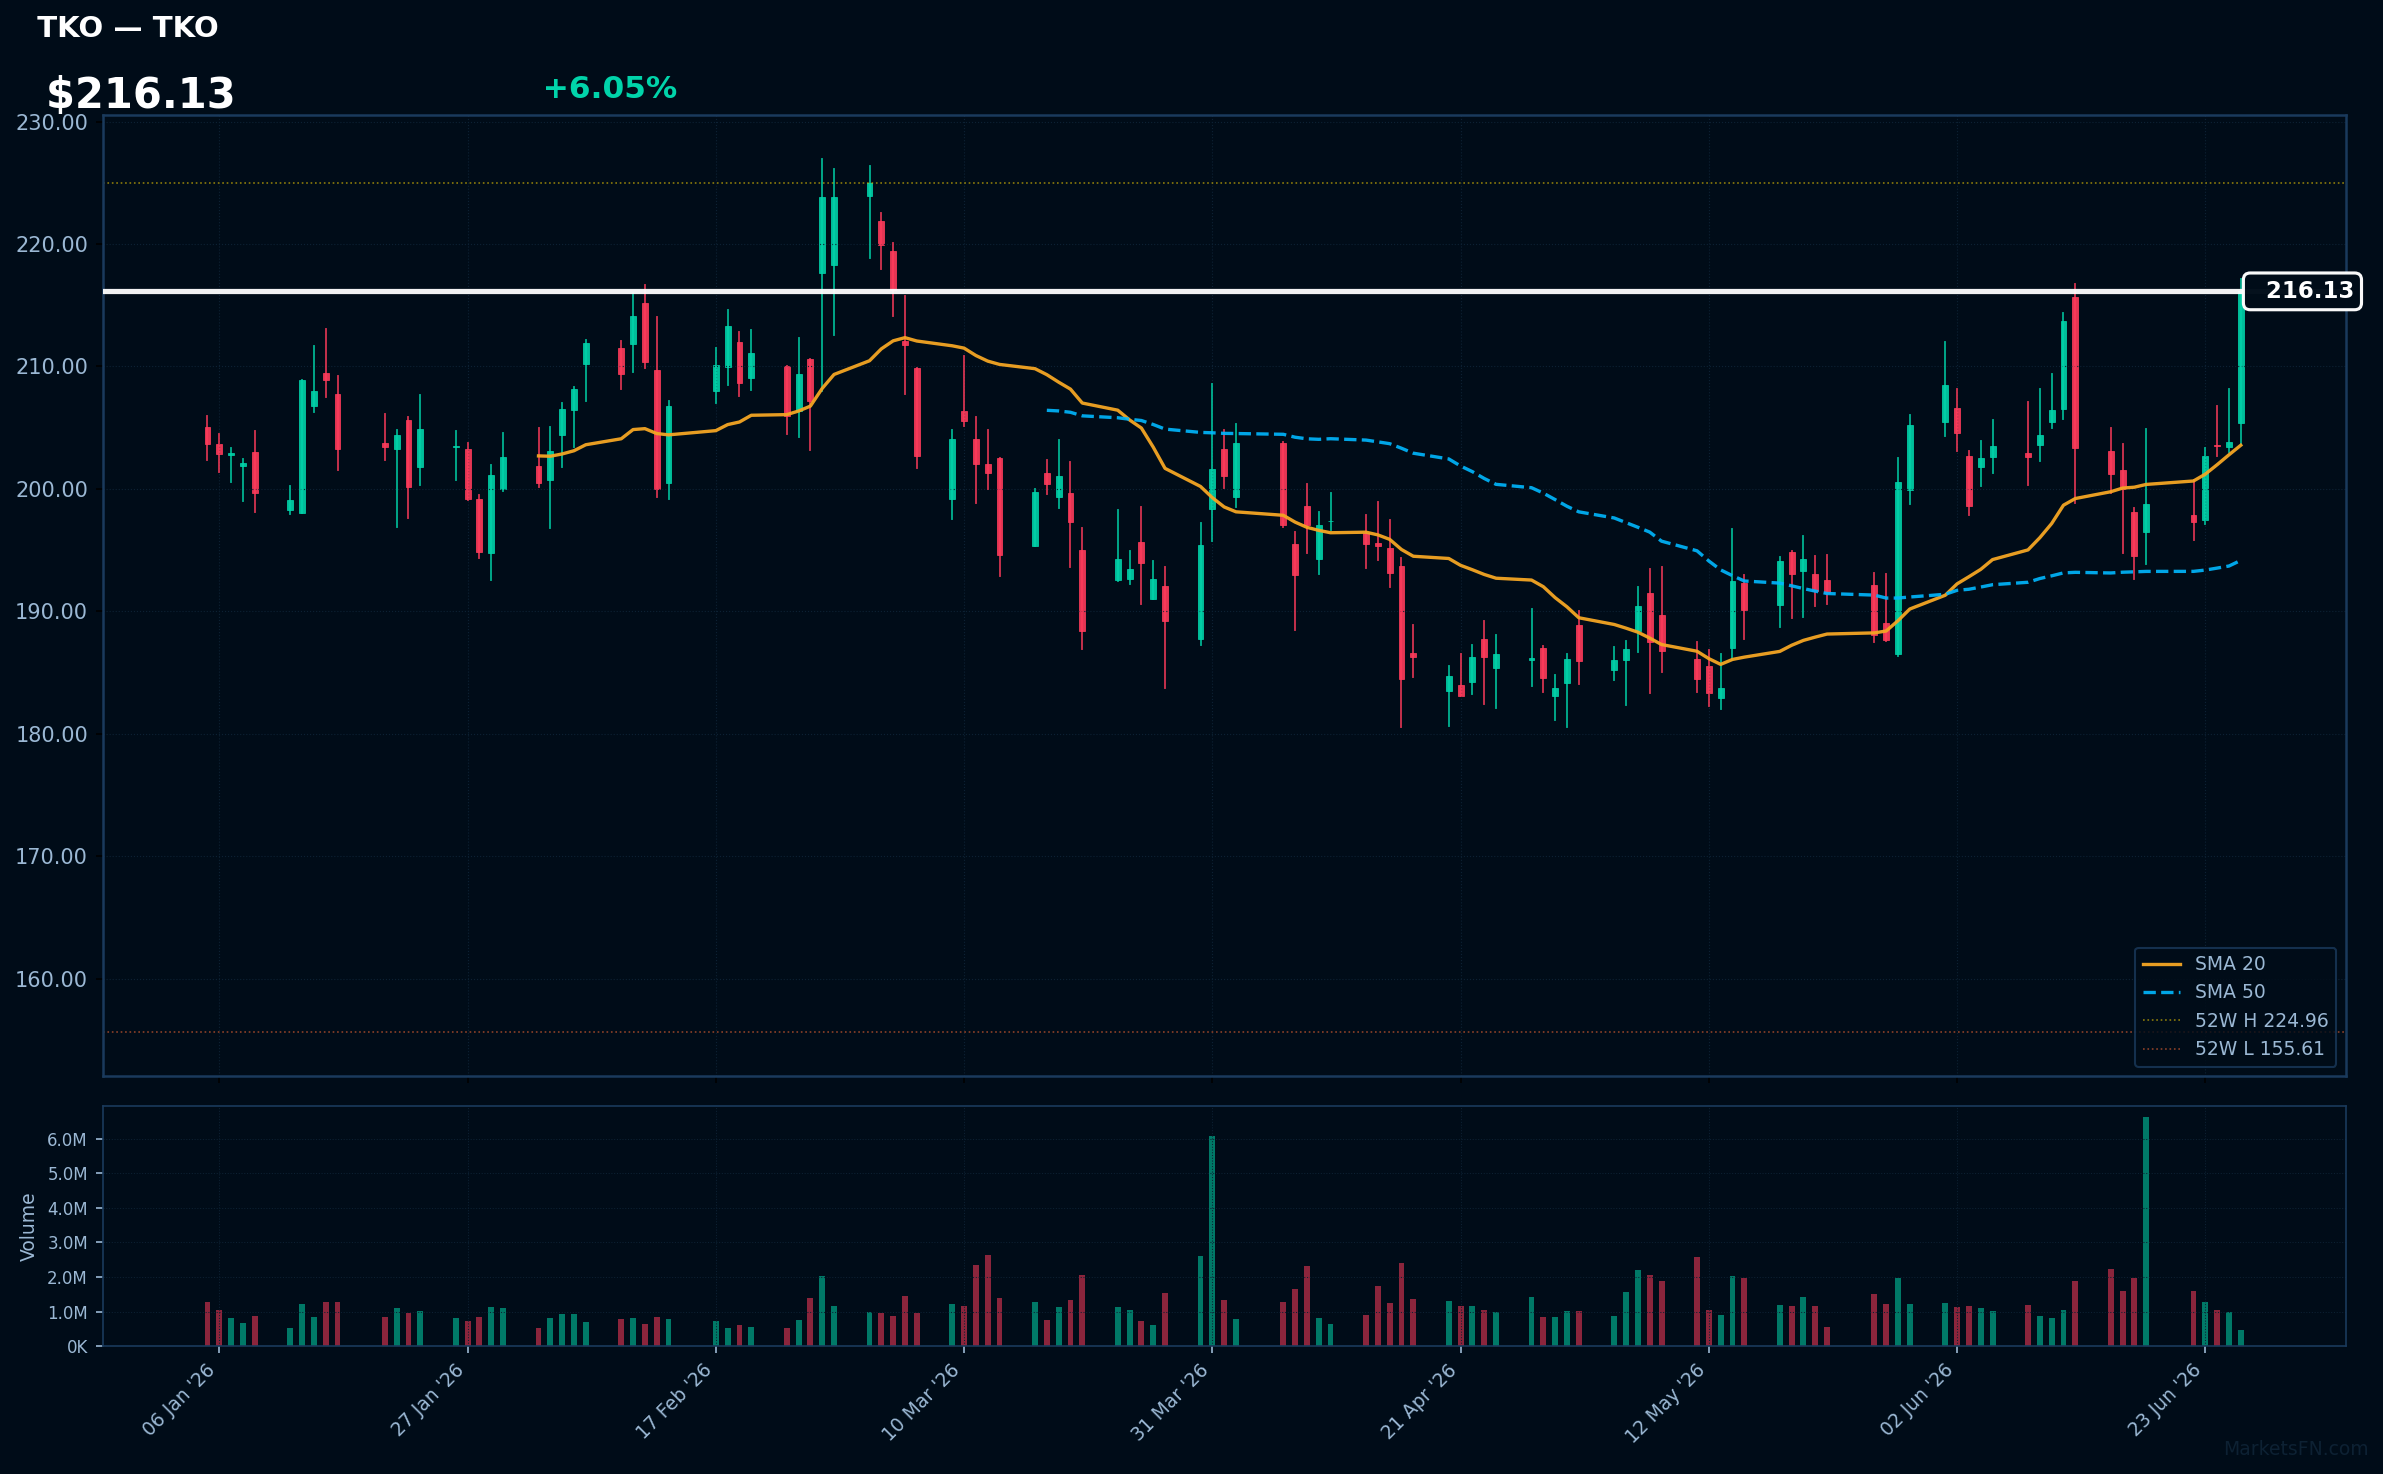
TKO | TKO Group Holdings Inc | Communication Services | Price: $216.13 | Day: +6.05% | 1W: +8.73% | 1M: +15.18% | RSI: 65.5 | vs MA200: +9.2% | Trend: Above MA20, MA50, MA200
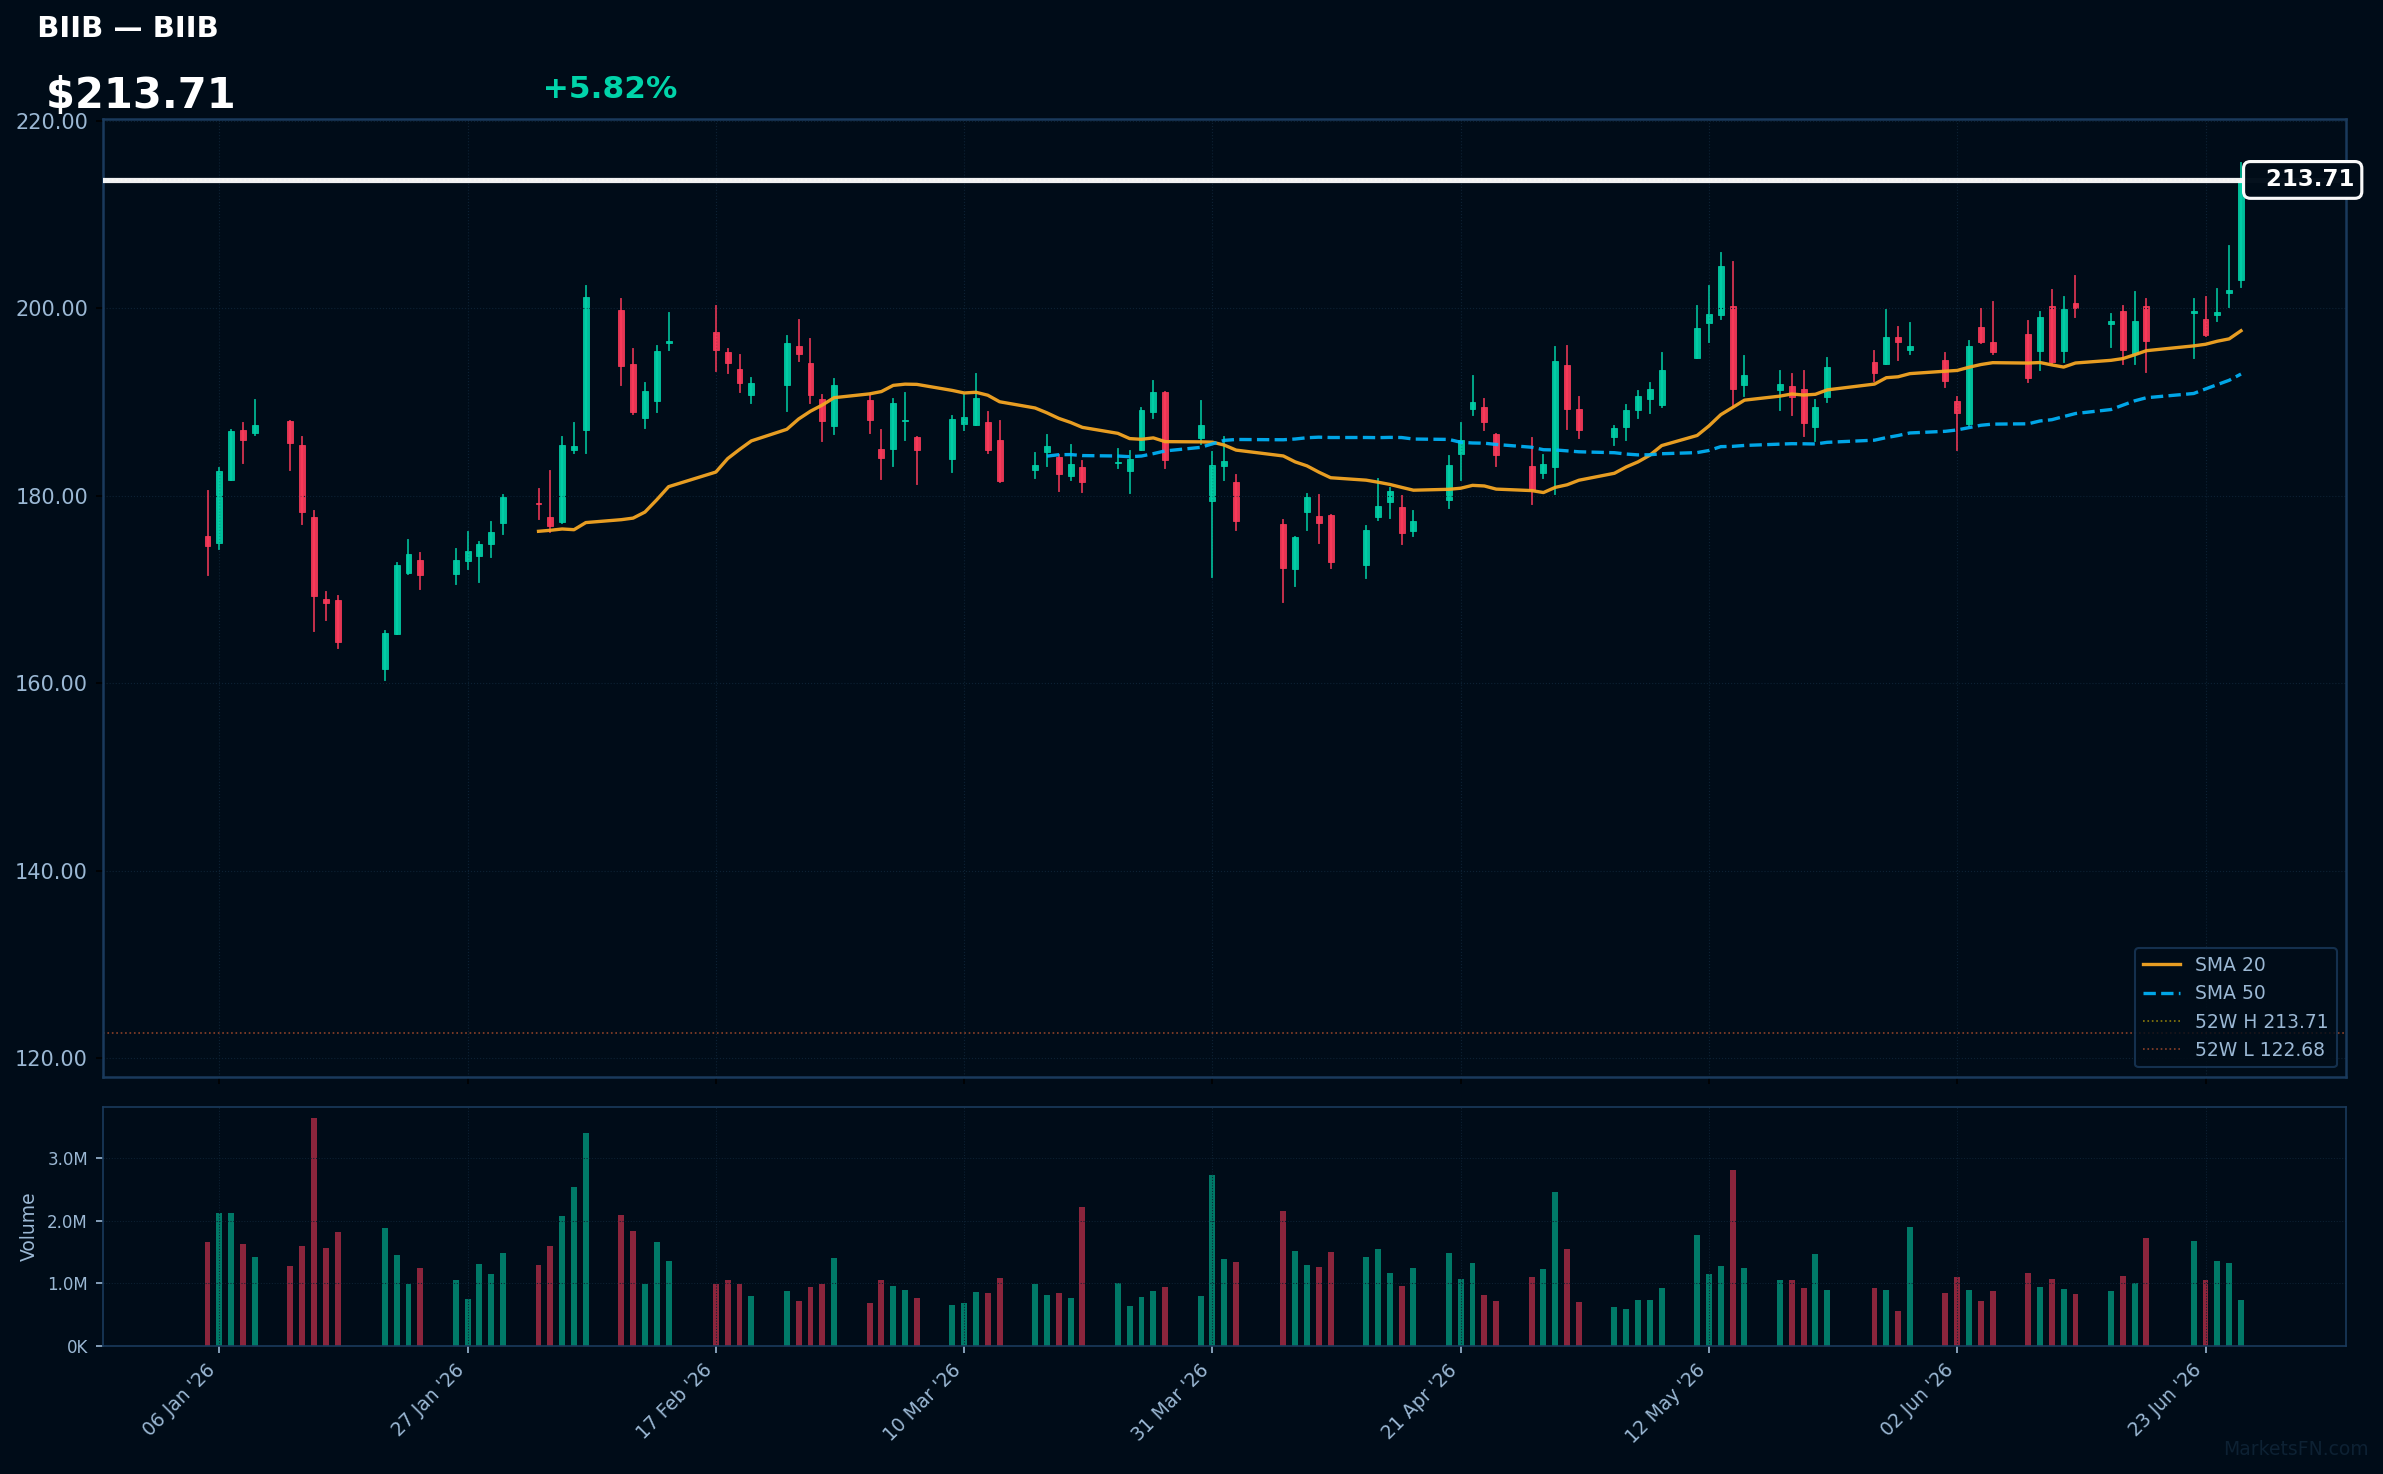
BIIB | Biogen Inc | Healthcare | Price: $213.71 | Day: +5.82% | 1W: +8.71% | 1M: +8.50% | RSI: 68.0 | vs MA200: +21.3% | Trend: Above MA20, MA50, MA200
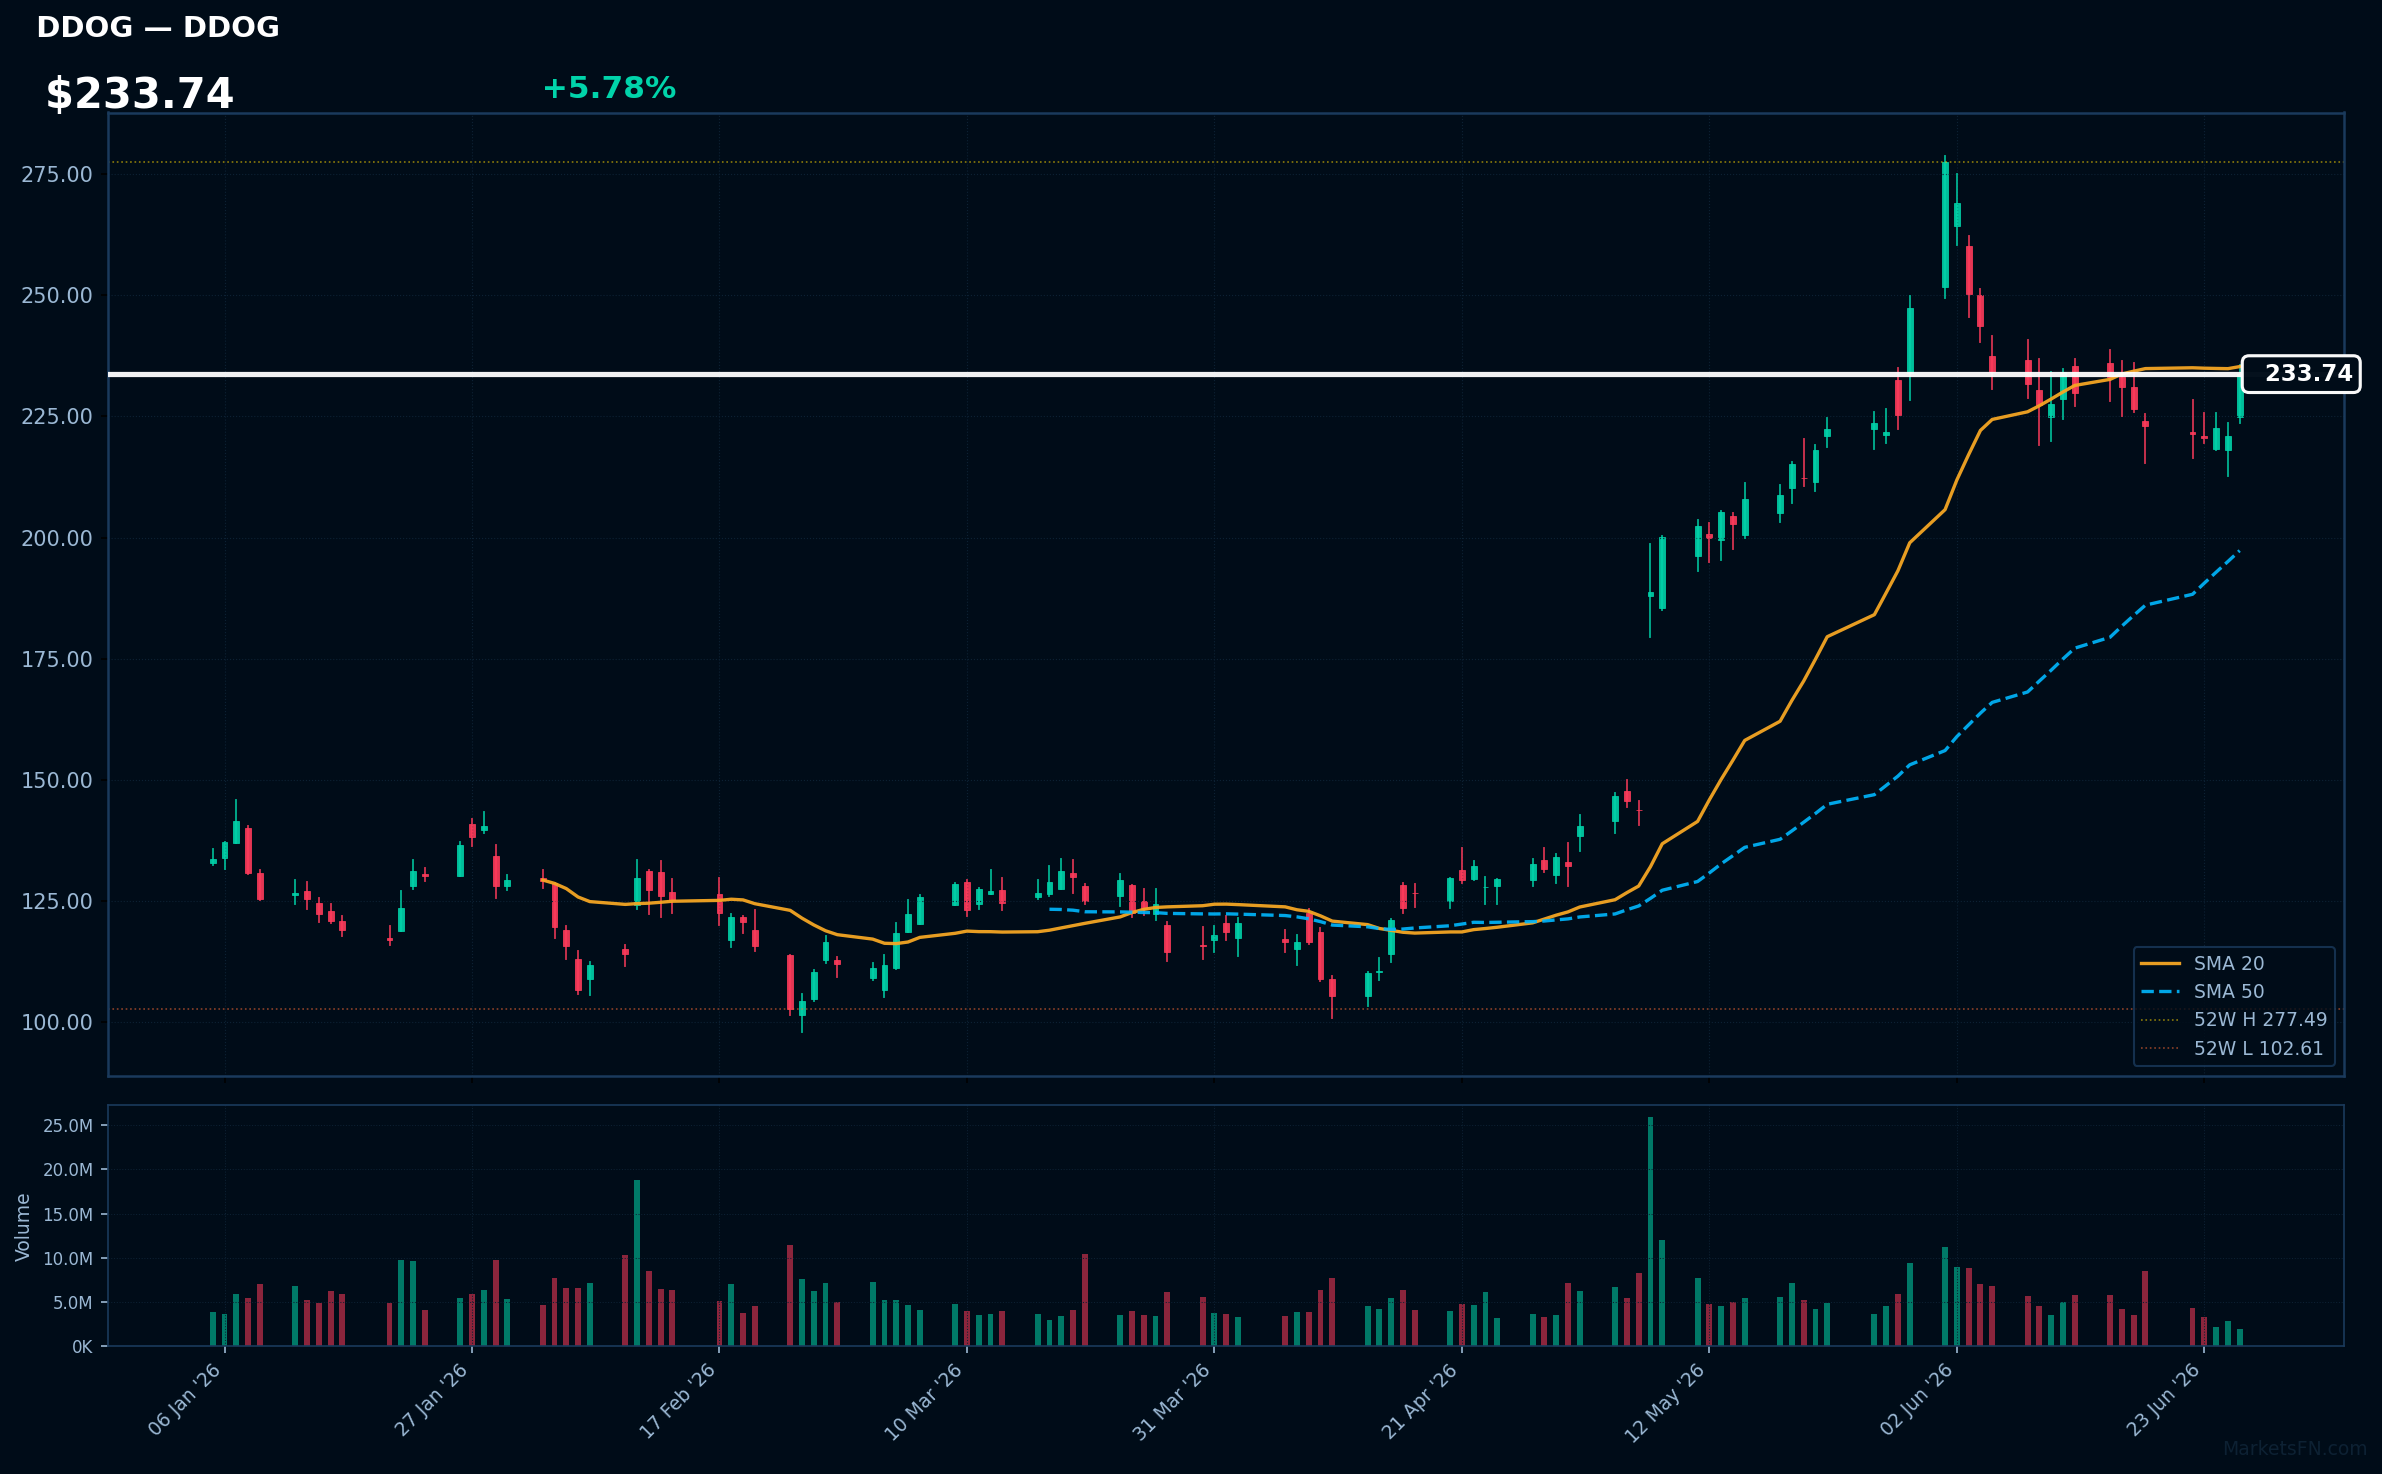
DDOG | Datadog Inc | Technology | Price: $233.72 | Day: +5.78% | 1W: +4.82% | 1M: +5.38% | RSI: 59.2 | vs MA200: +52.1% | Trend: Above MA50, MA200 · Below MA20
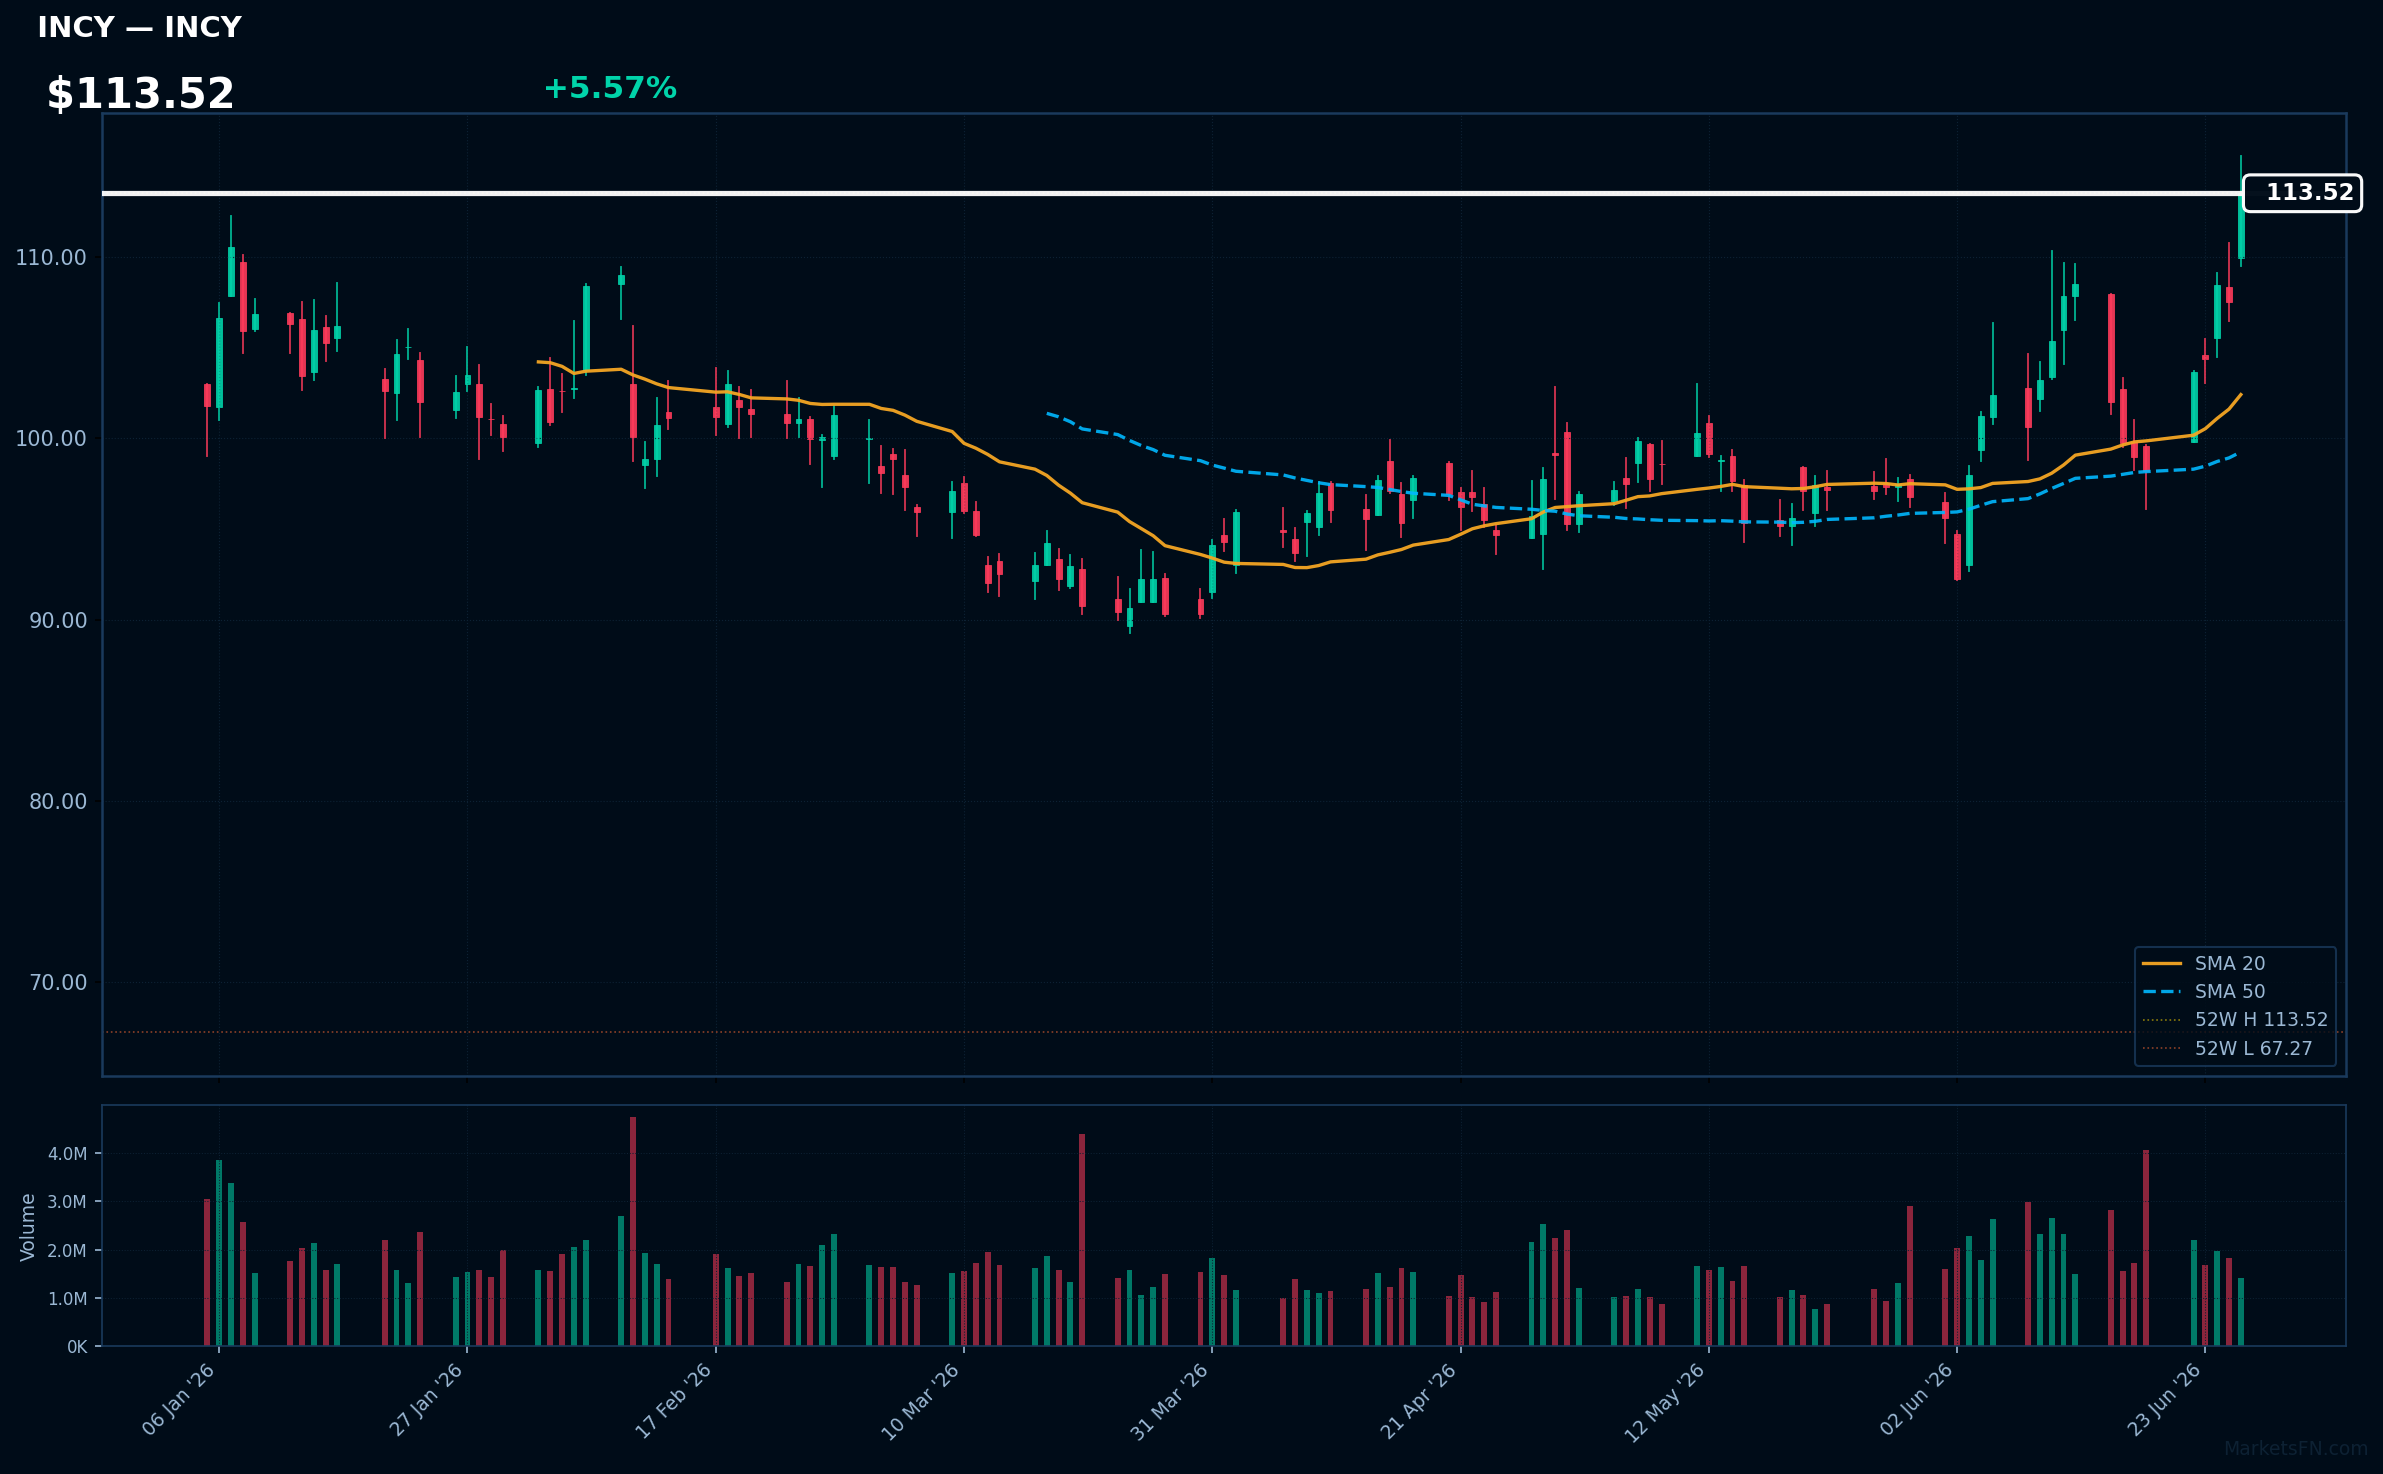
INCY | Incyte Corp | Healthcare | Price: $113.52 | Day: +5.57% | 1W: +15.58% | 1M: +16.62% | RSI: 68.4 | vs MA200: +16.6% | Trend: Above MA20, MA50, MA200
Top 10 Losers
Today's weakest S&P 500 performers. Sector drag: Technology (10).
| Ticker | Company | Sector | Price | Day % | 1W % | 1M % | RSI | vs MA200 | Trend |
|---|---|---|---|---|---|---|---|---|---|
| NXPI | NXP Semiconductors NV | Technology | $282.04 | -5.56% | -10.02% | -14.38% | 43.1 | +19.7% | Above MA200 · Below MA20, MA50 |
| KEYS | Keysight Technologies Inc | Technology | $339.71 | -5.65% | -6.59% | -2.28% | 46.7 | +35.3% | Above MA200 · Below MA20, MA50 |
| MPWR | Monolithic Power System Inc | Technology | $1353.16 | -5.92% | -13.56% | -16.58% | 39.8 | +16.7% | Above MA200 · Below MA20, MA50 |
| MCHP | Microchip Technology, Inc | Technology | $87.78 | -6.74% | -12.02% | -9.36% | 43.4 | +19.8% | Above MA200 · Below MA20, MA50 |
| HPE | Hewlett Packard Enterprise Co | Technology | $43.52 | -6.85% | -8.02% | +17.23% | 47.9 | +61.8% | Above MA50, MA200 · Below MA20 |
| ADI | Analog Devices Inc | Technology | $387.85 | -7.20% | -10.77% | -7.00% | 42.8 | +23.2% | Above MA200 · Below MA20, MA50 |
| TER | Teradyne, Inc | Technology | $437.86 | -7.23% | -0.01% | +16.50% | 56.5 | +67.4% | Above MA20, MA50, MA200 |
| STX | Seagate Technology Holdings Plc | Technology | $934.77 | -8.84% | -12.65% | +7.37% | 51.6 | +111.2% | Above MA50, MA200 · Below MA20 |
| WDC | Western Digital Corp | Technology | $595.42 | -11.84% | -20.24% | +12.17% | 51.1 | +112.3% | Above MA50, MA200 · Below MA20 |
| ON | ON Semiconductor Corp | Technology | $91.23 | -23.17% | -24.97% | -26.94% | 37.5 | +30.0% | Above MA200 · Below MA20, MA50 |
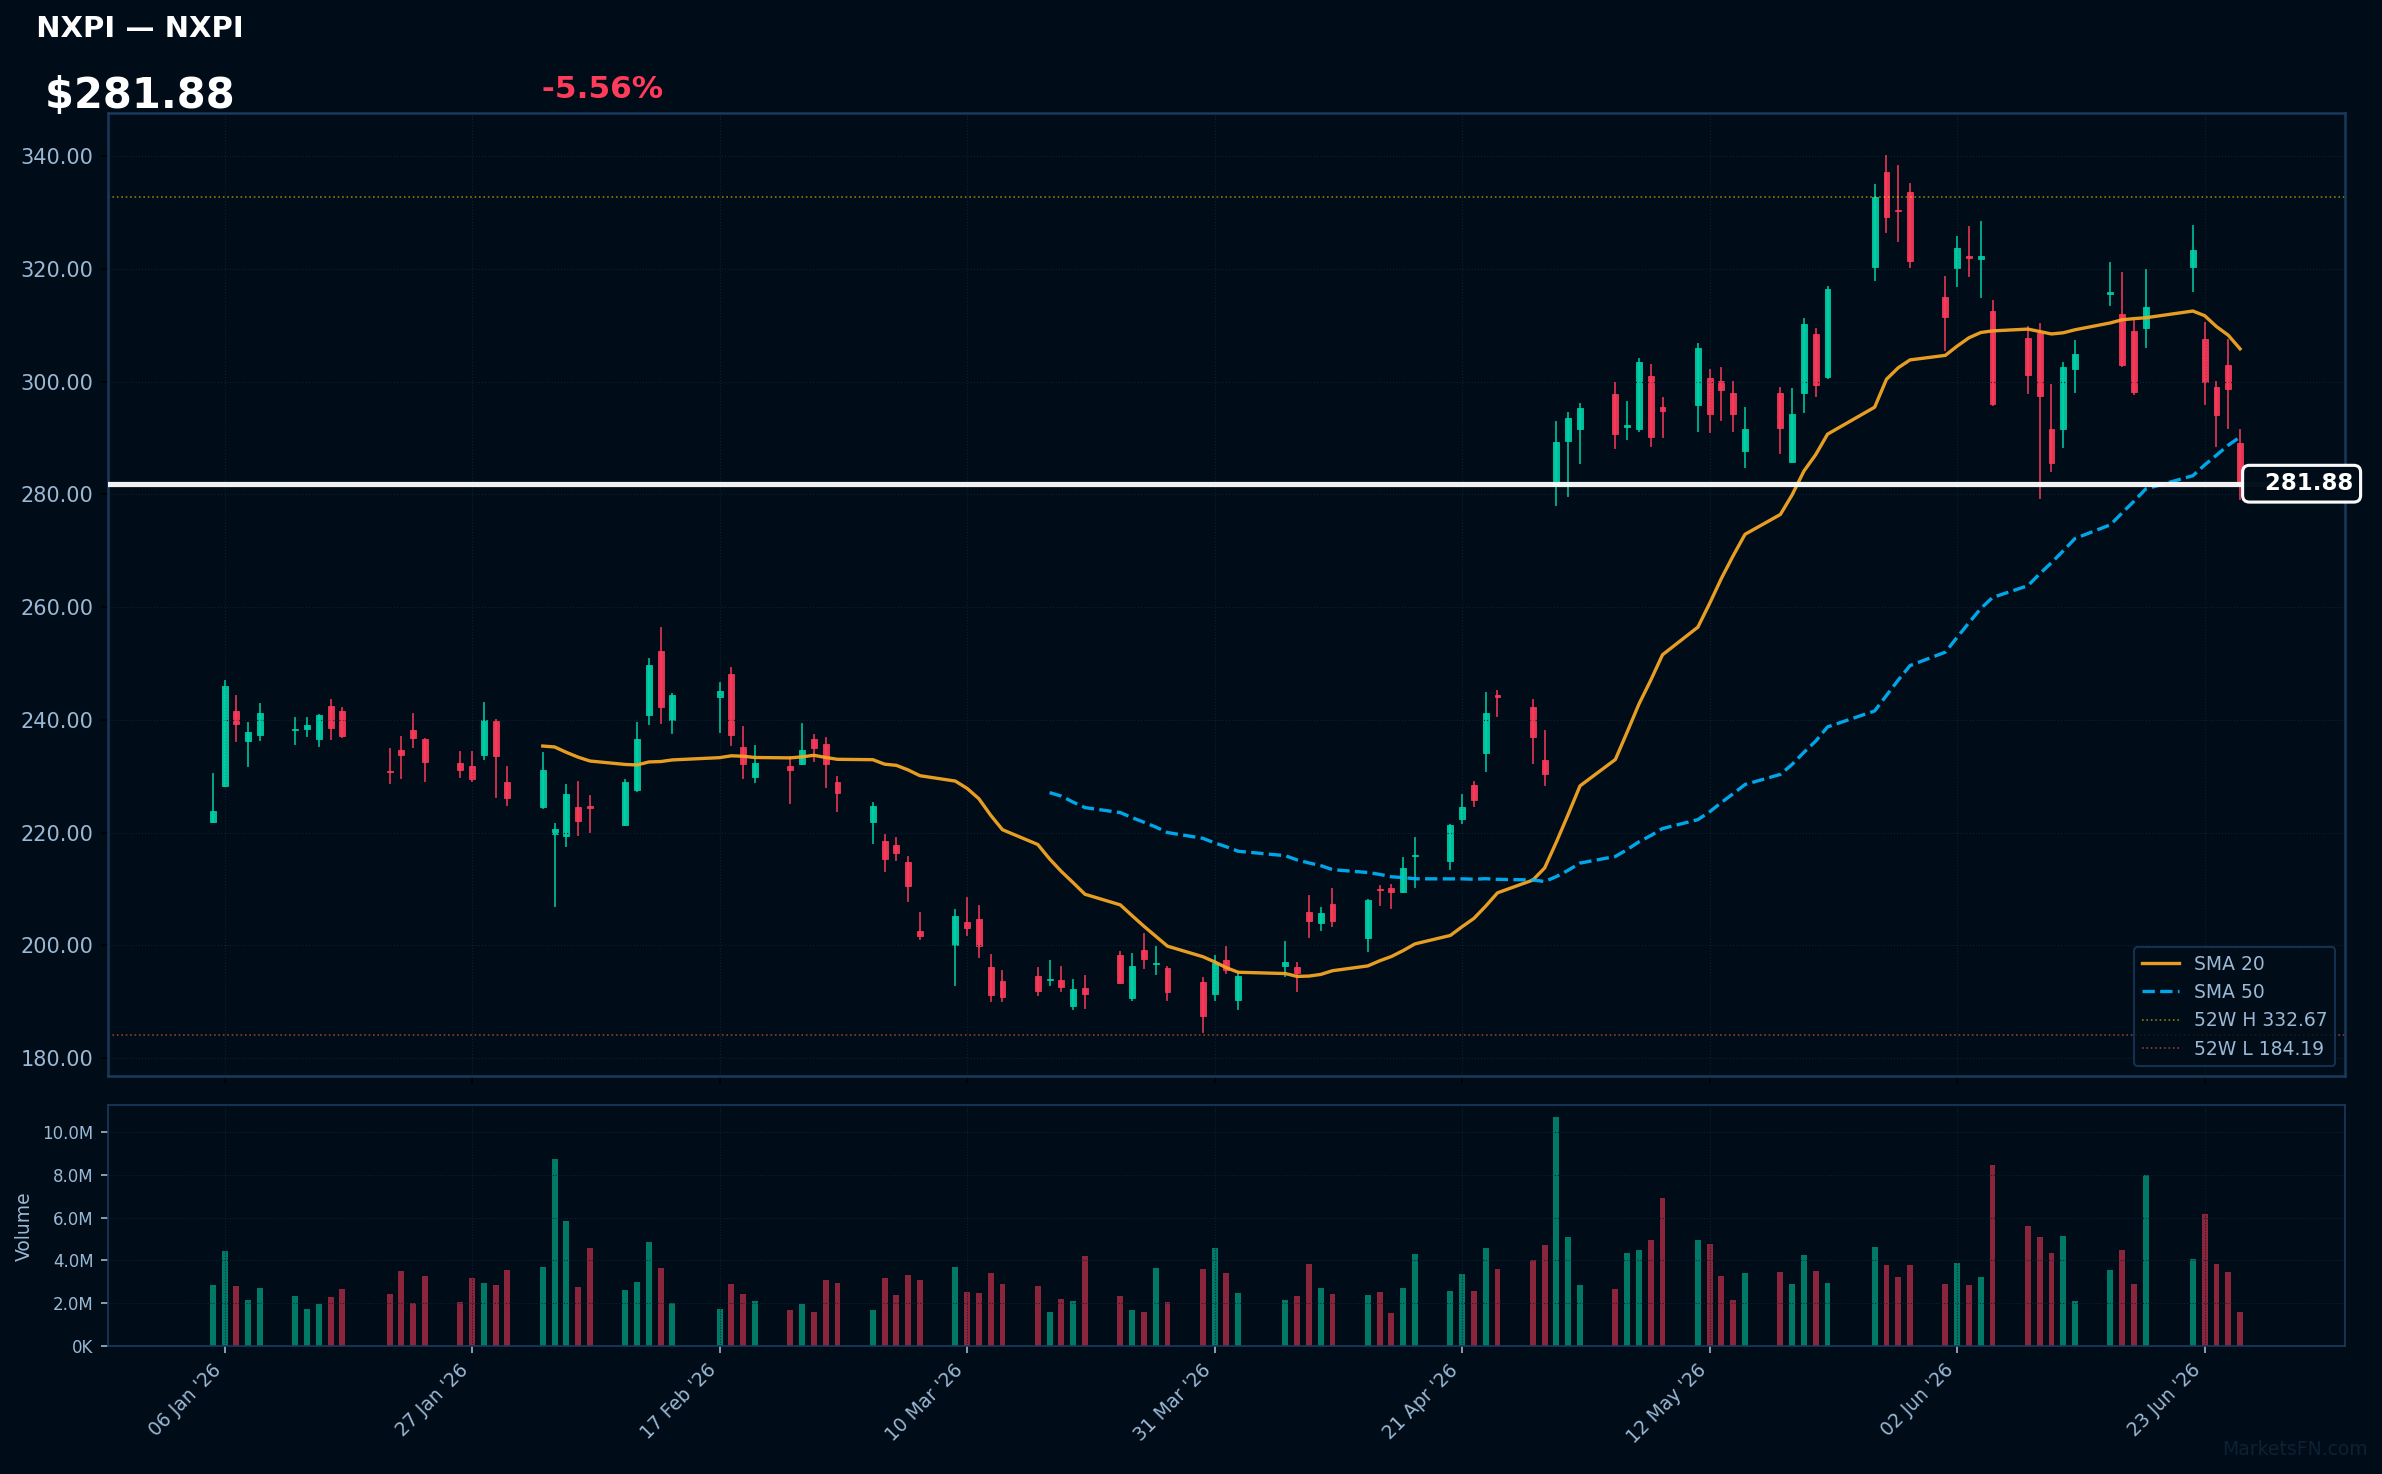
NXPI | NXP Semiconductors NV | Technology | Price: $282.04 | Day: -5.56% | 1W: -10.02% | 1M: -14.38% | RSI: 43.1 | vs MA200: +19.7% | Trend: Above MA200 · Below MA20, MA50
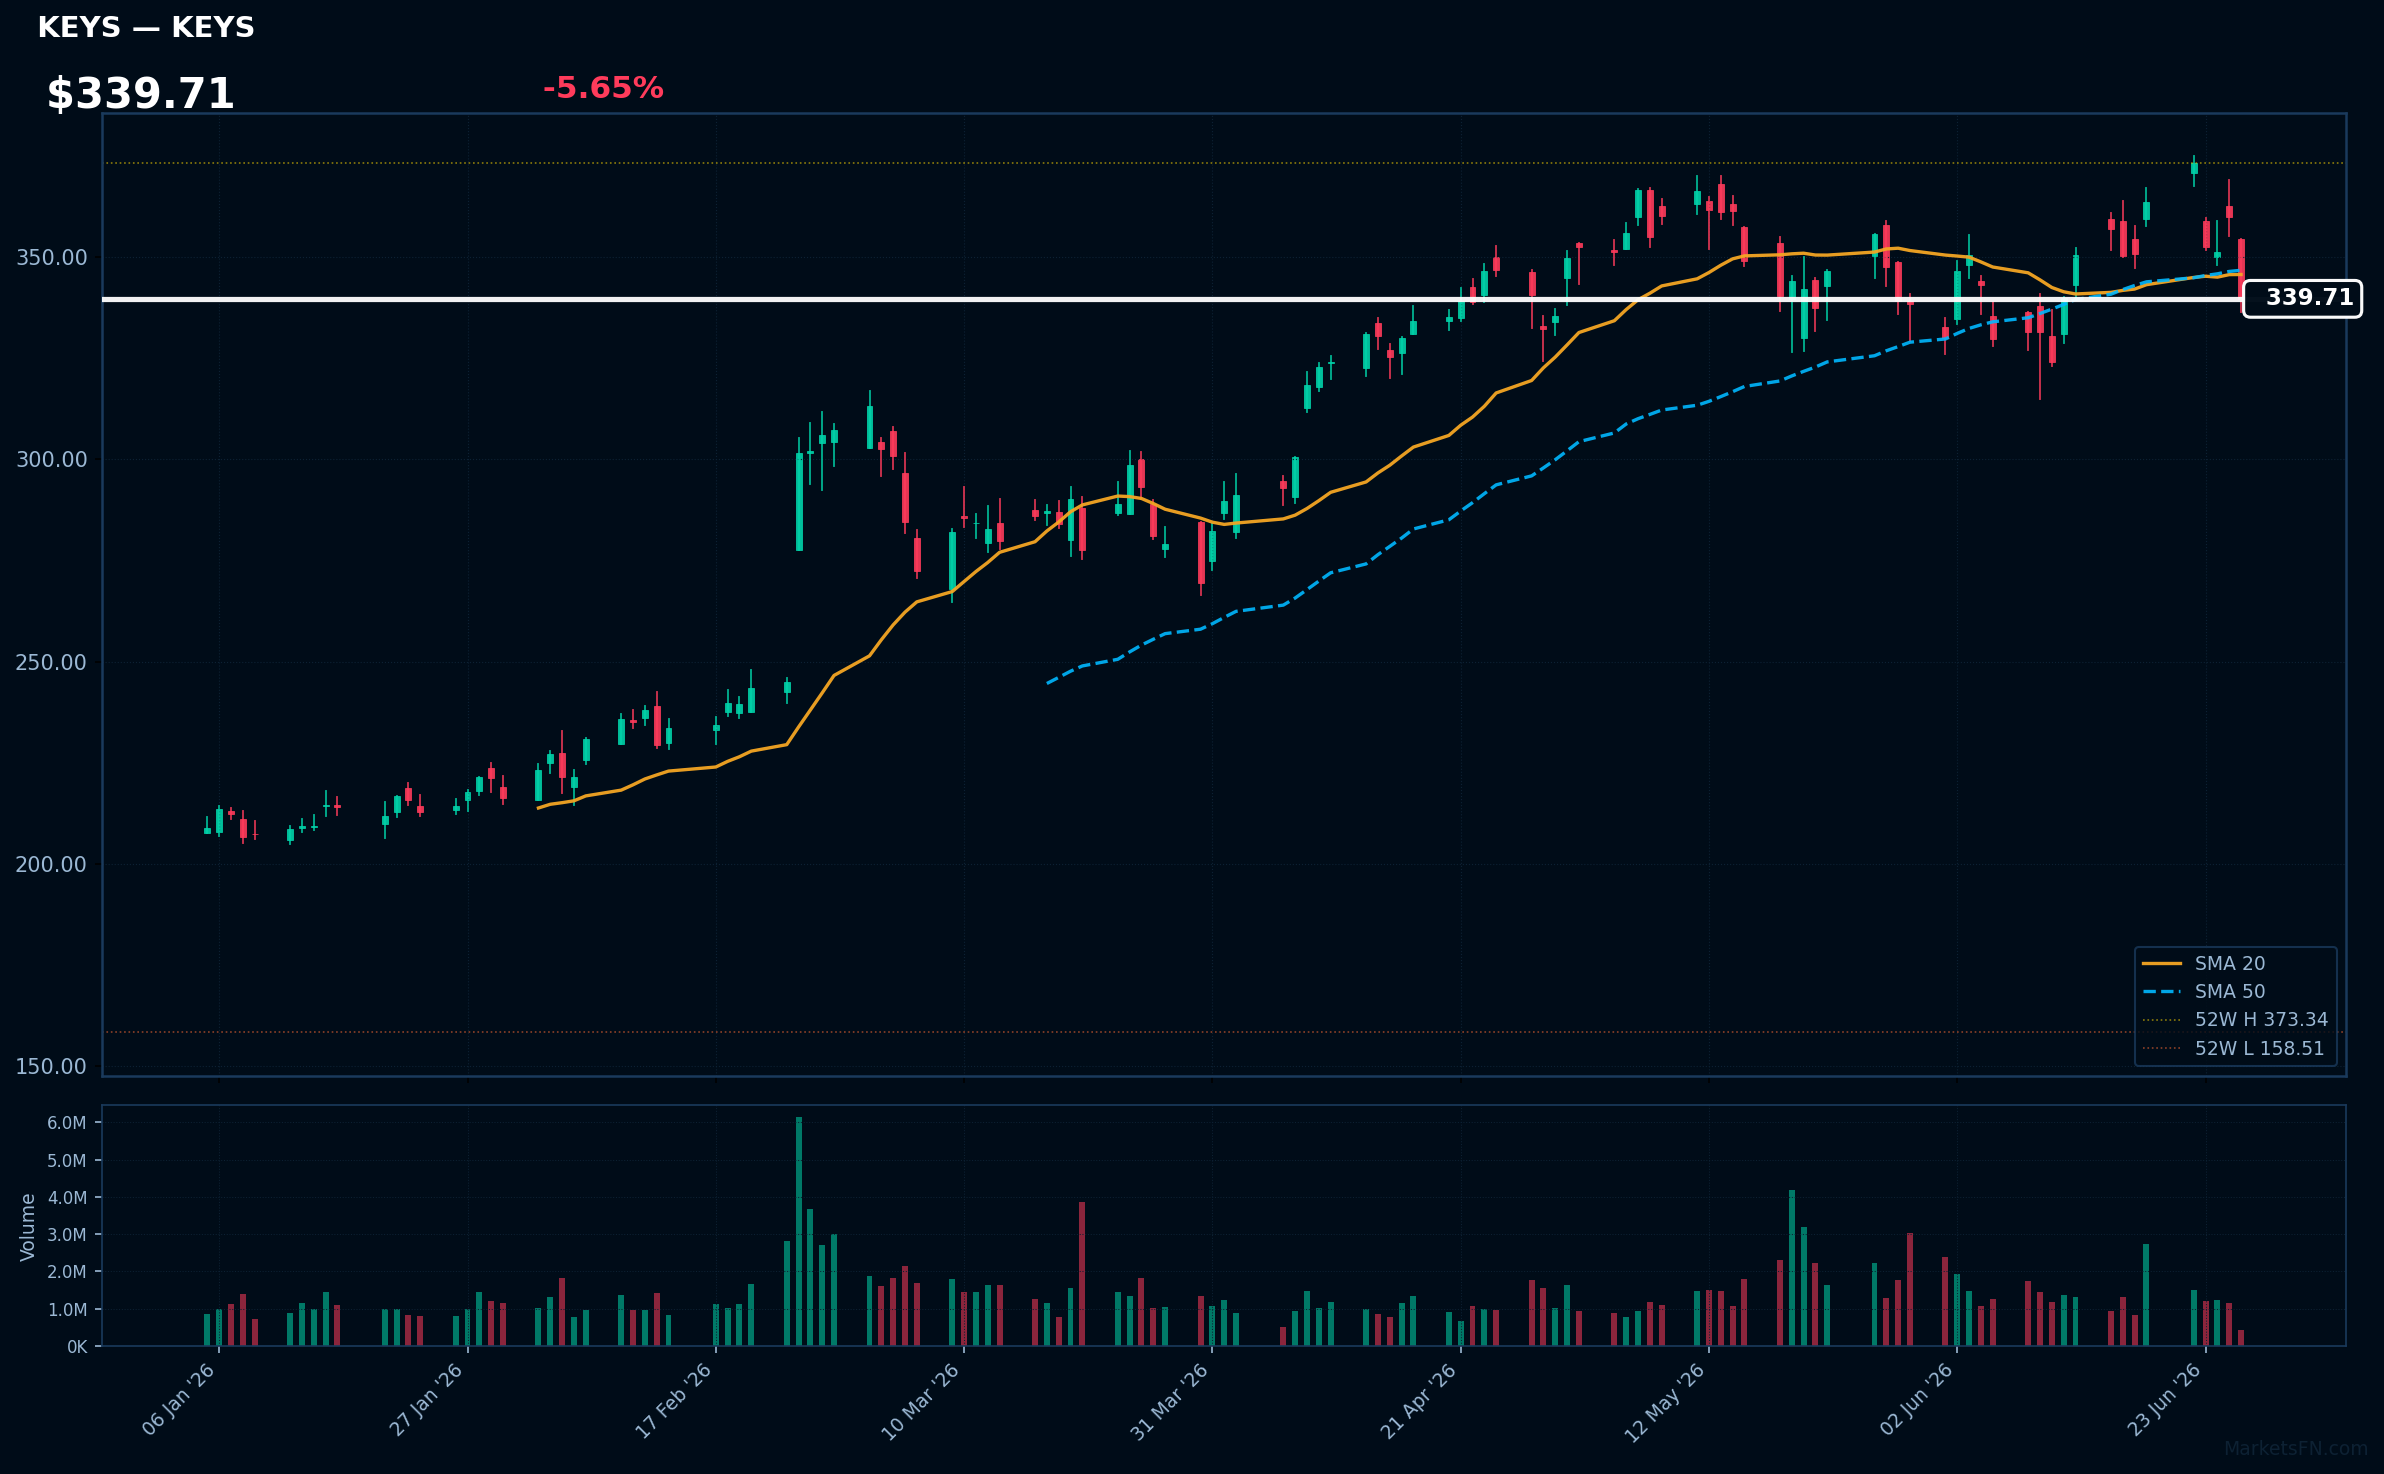
KEYS | Keysight Technologies Inc | Technology | Price: $339.71 | Day: -5.65% | 1W: -6.59% | 1M: -2.28% | RSI: 46.7 | vs MA200: +35.3% | Trend: Above MA200 · Below MA20, MA50
MPWR | Monolithic Power System Inc | Technology | Price: $1353.16 | Day: -5.92% | 1W: -13.56% | 1M: -16.58% | RSI: 39.8 | vs MA200: +16.7% | Trend: Above MA200 · Below MA20, MA50
Recent headlines (last 12h)
- FTSE 100 Live: London banks and miners, US tech stocks lead falls
- FTSE 100 Live: Blue-chips cut losses, Downing Street pushes defence plan
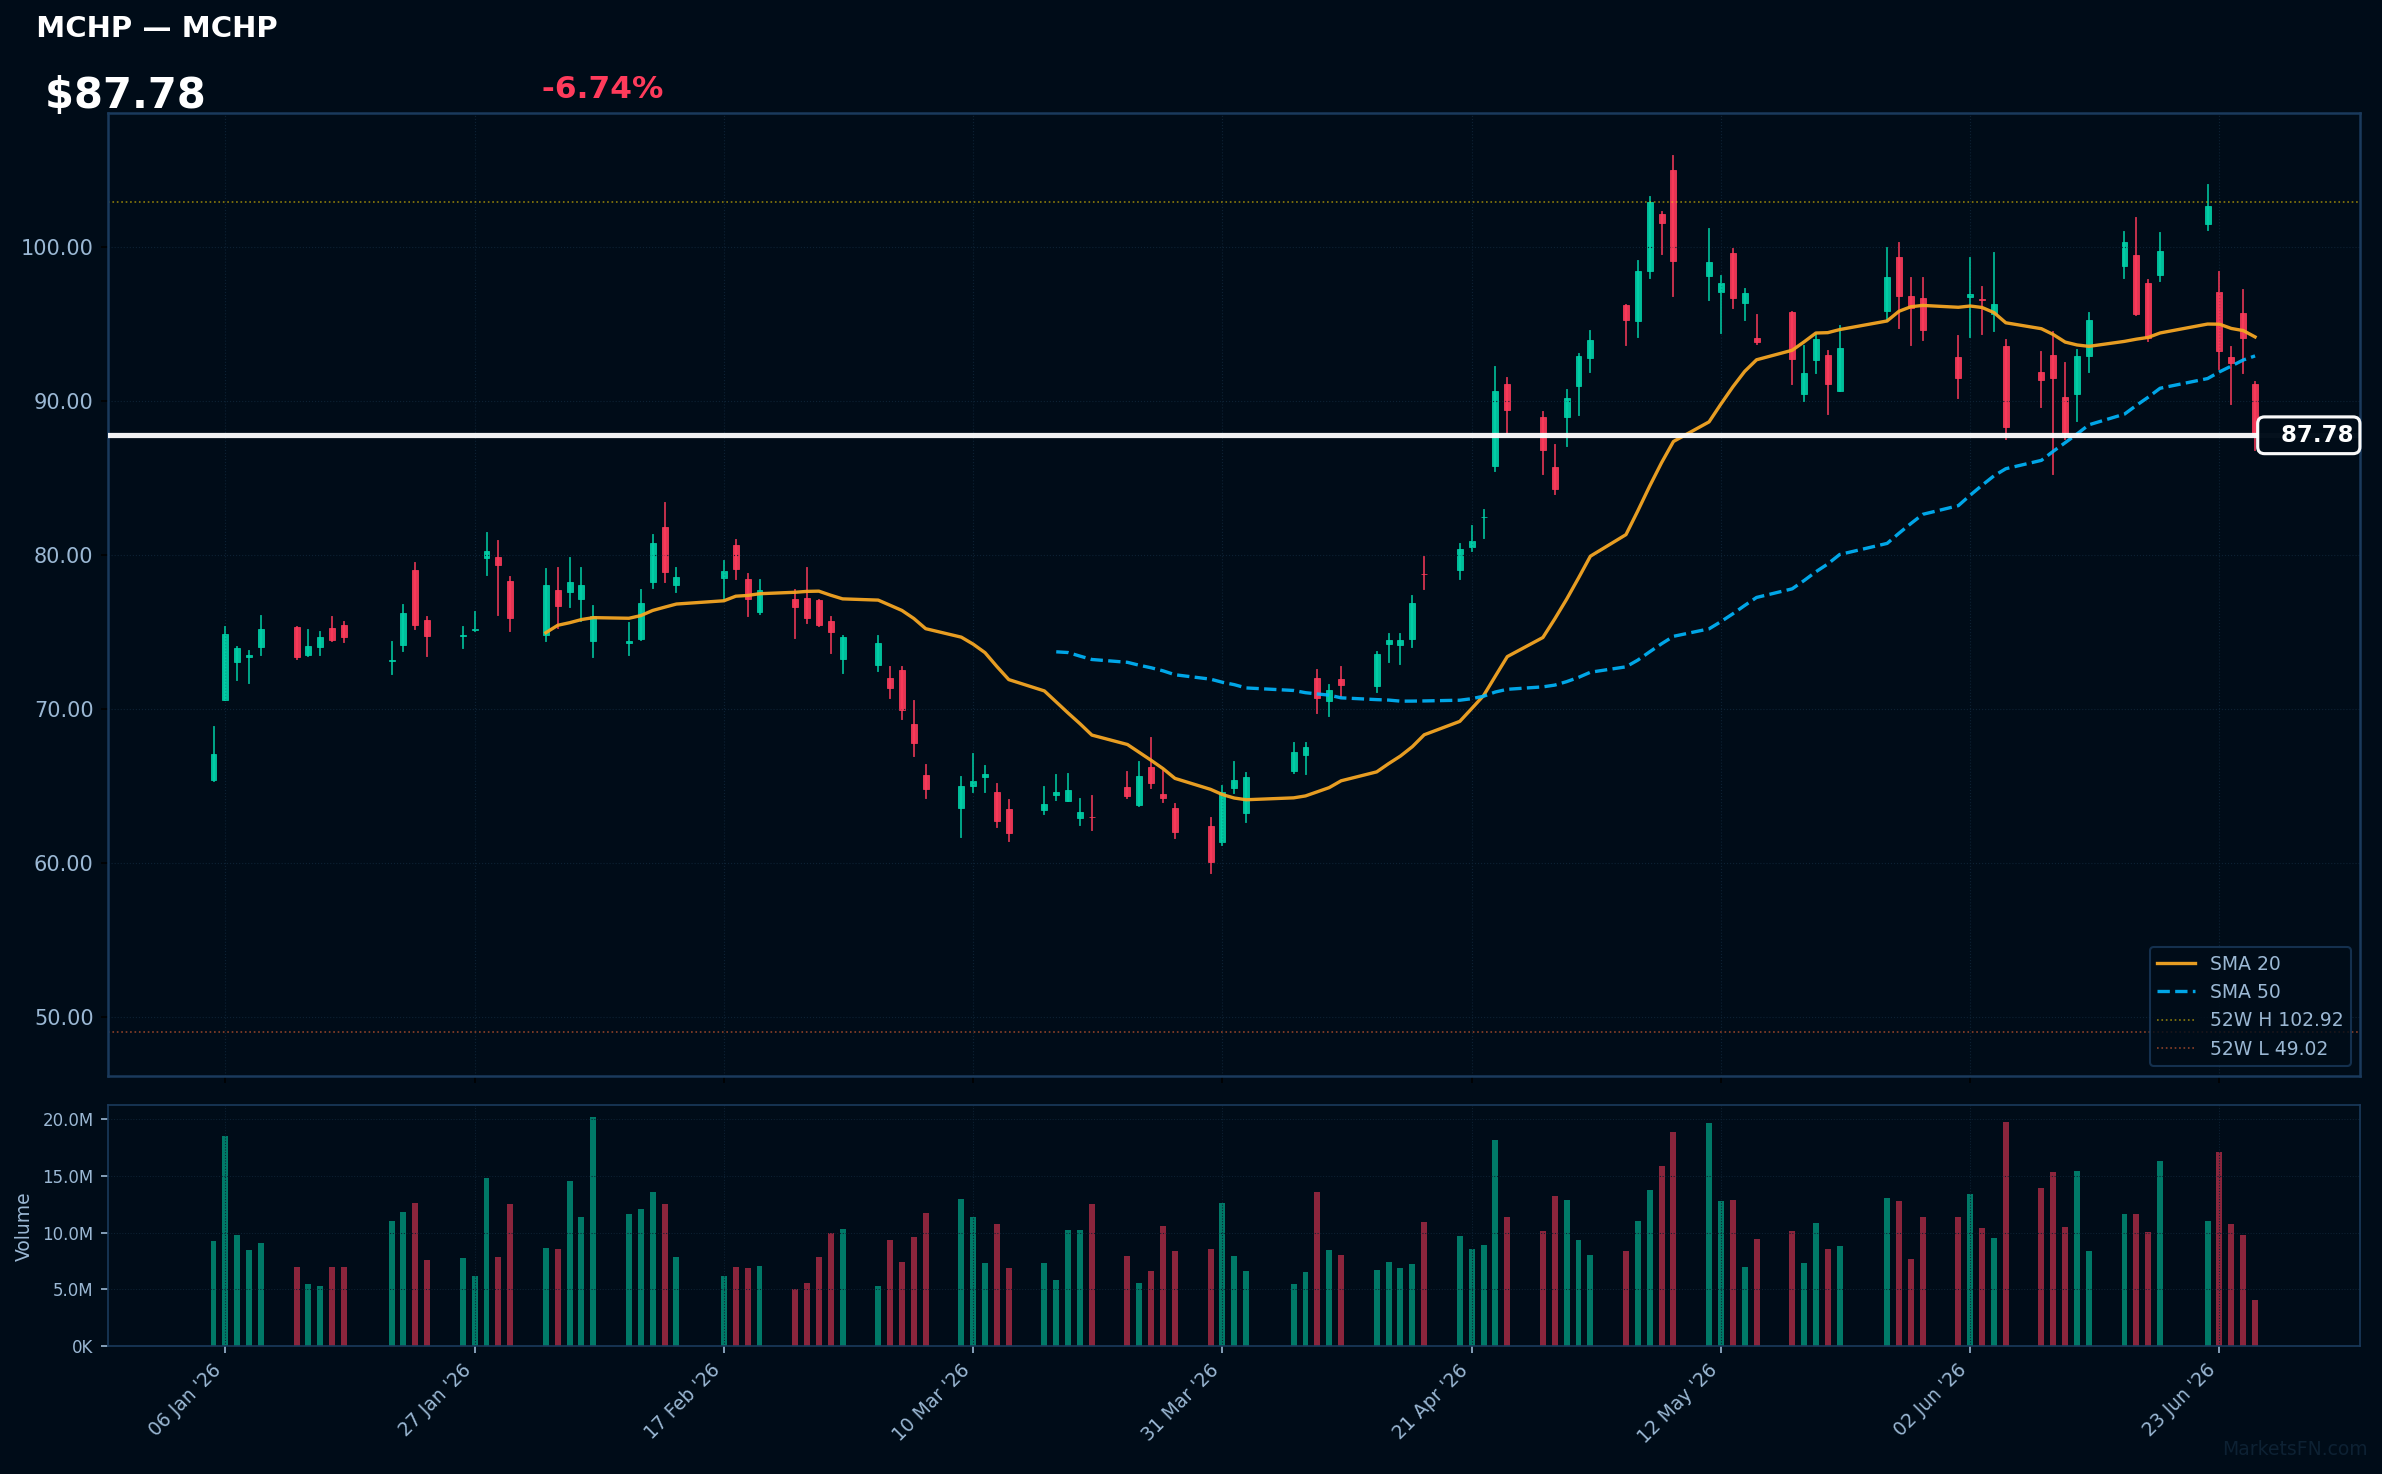
MCHP | Microchip Technology, Inc | Technology | Price: $87.78 | Day: -6.74% | 1W: -12.02% | 1M: -9.36% | RSI: 43.4 | vs MA200: +19.8% | Trend: Above MA200 · Below MA20, MA50
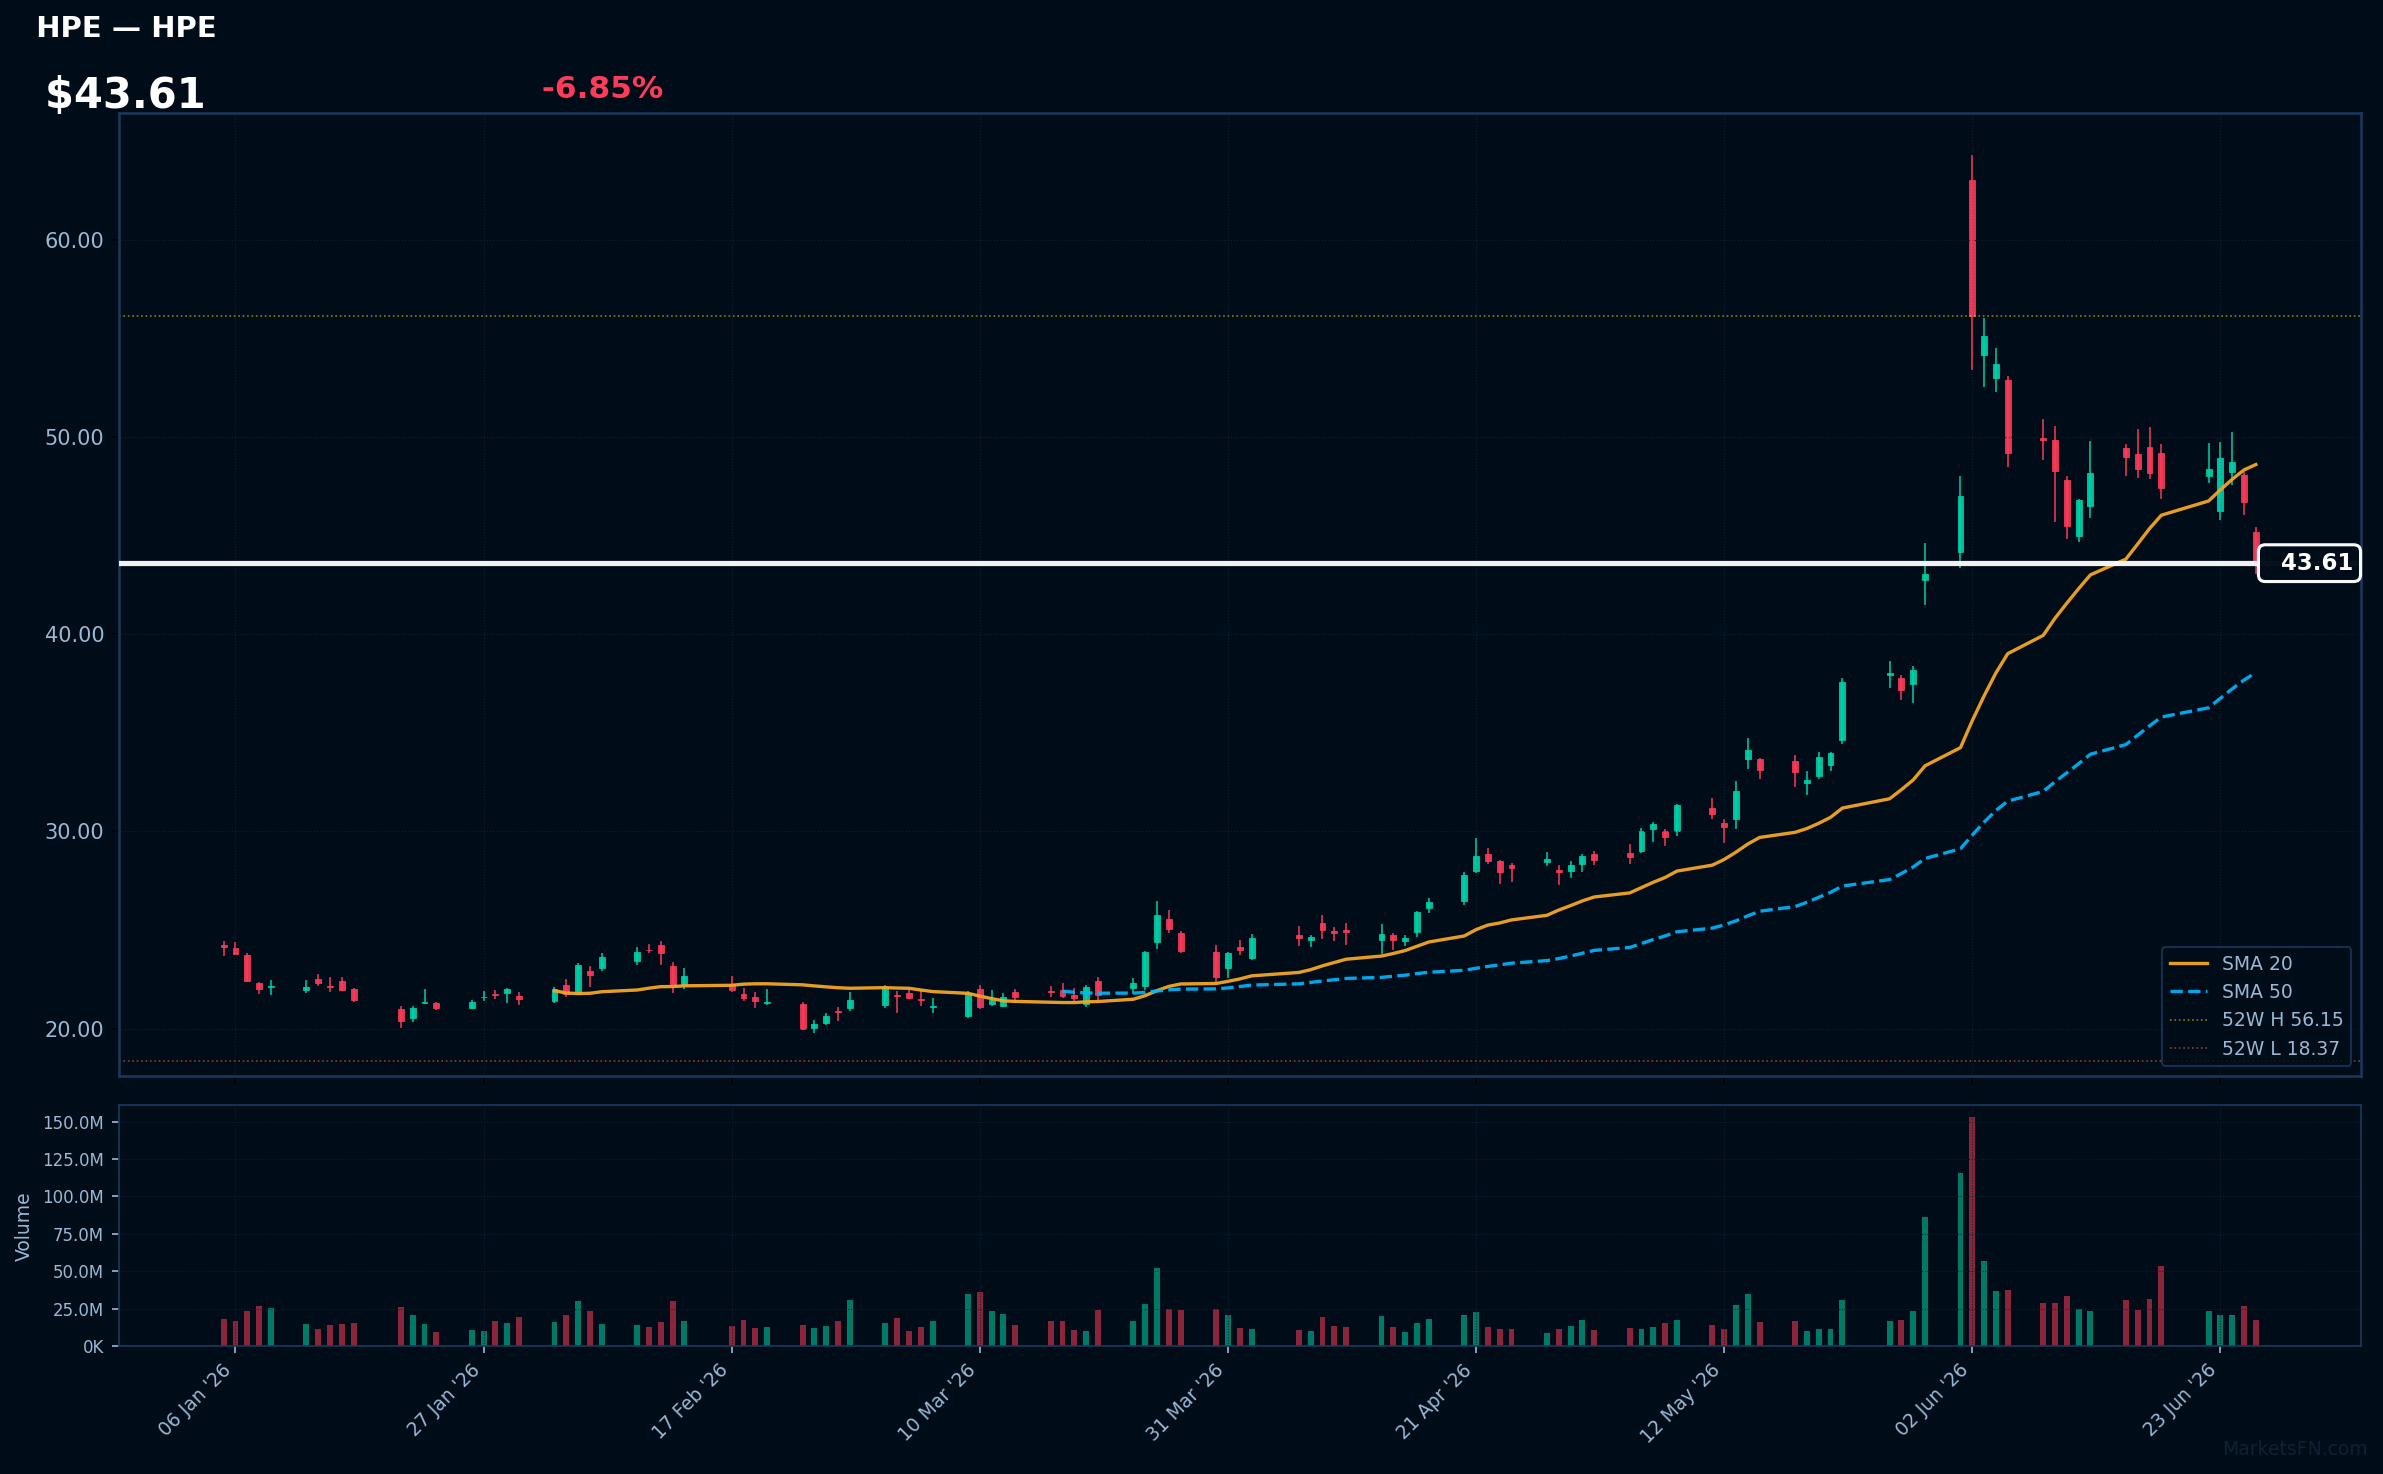
HPE | Hewlett Packard Enterprise Co | Technology | Price: $43.52 | Day: -6.85% | 1W: -8.02% | 1M: +17.23% | RSI: 47.9 | vs MA200: +61.8% | Trend: Above MA50, MA200 · Below MA20
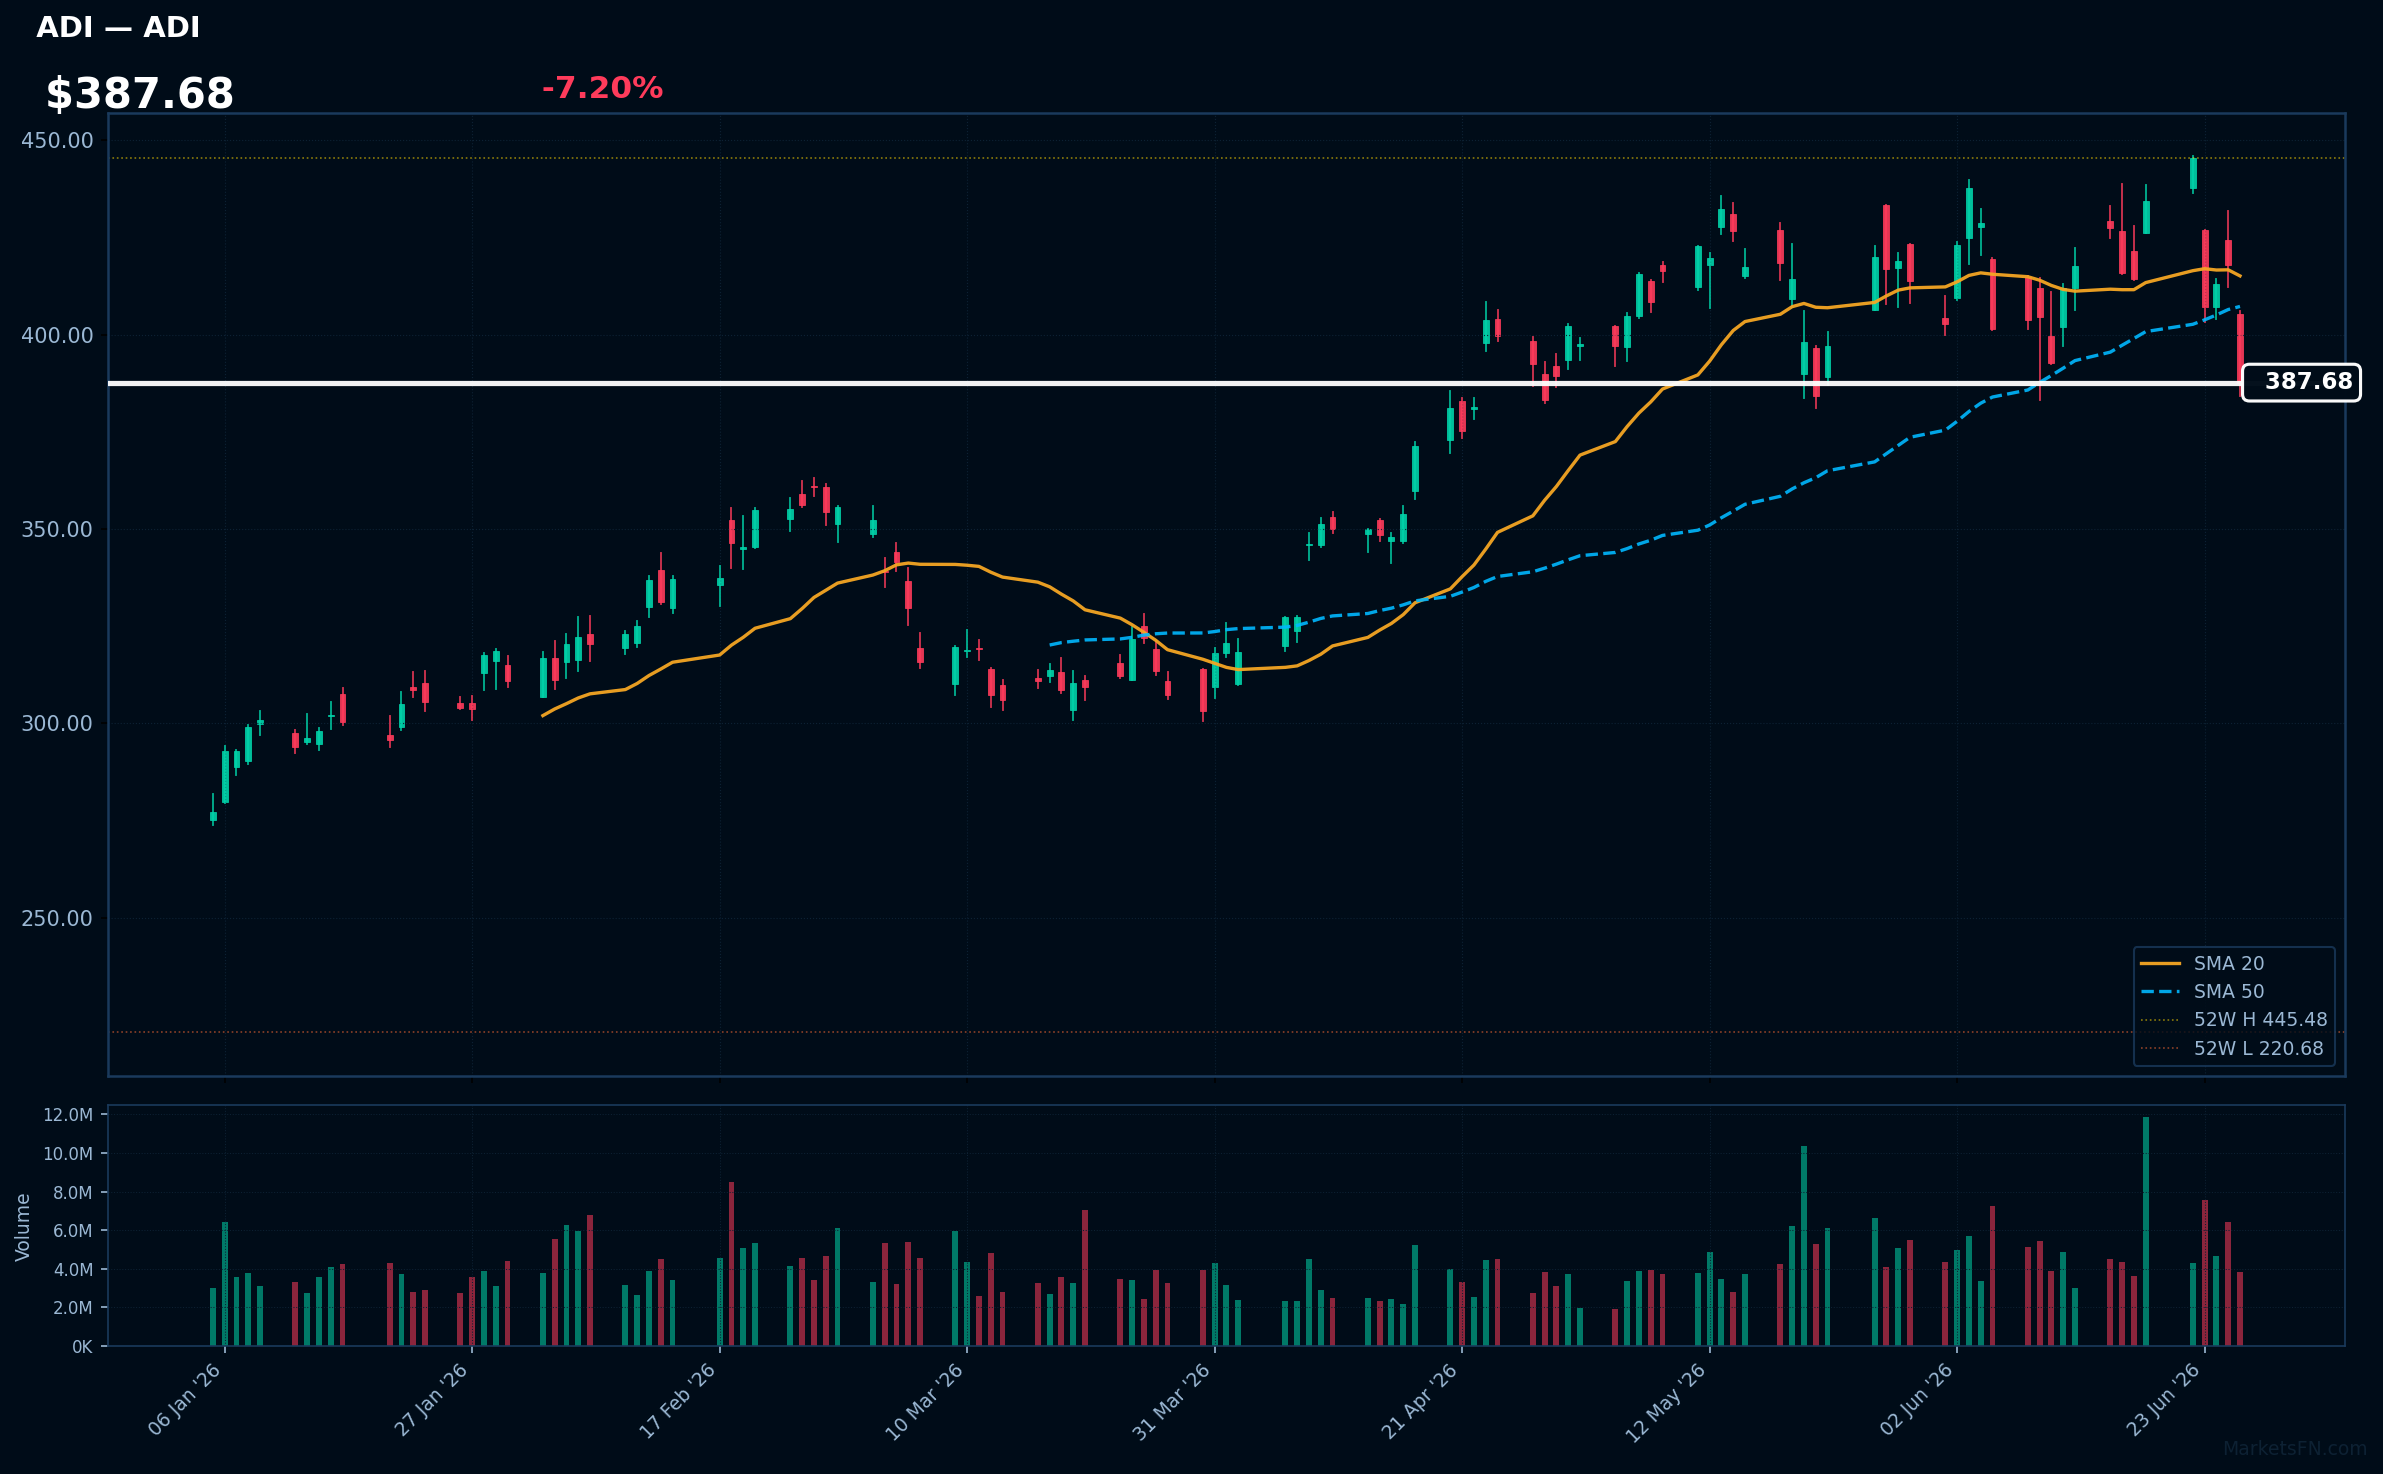
ADI | Analog Devices Inc | Technology | Price: $387.85 | Day: -7.20% | 1W: -10.77% | 1M: -7.00% | RSI: 42.8 | vs MA200: +23.2% | Trend: Above MA200 · Below MA20, MA50
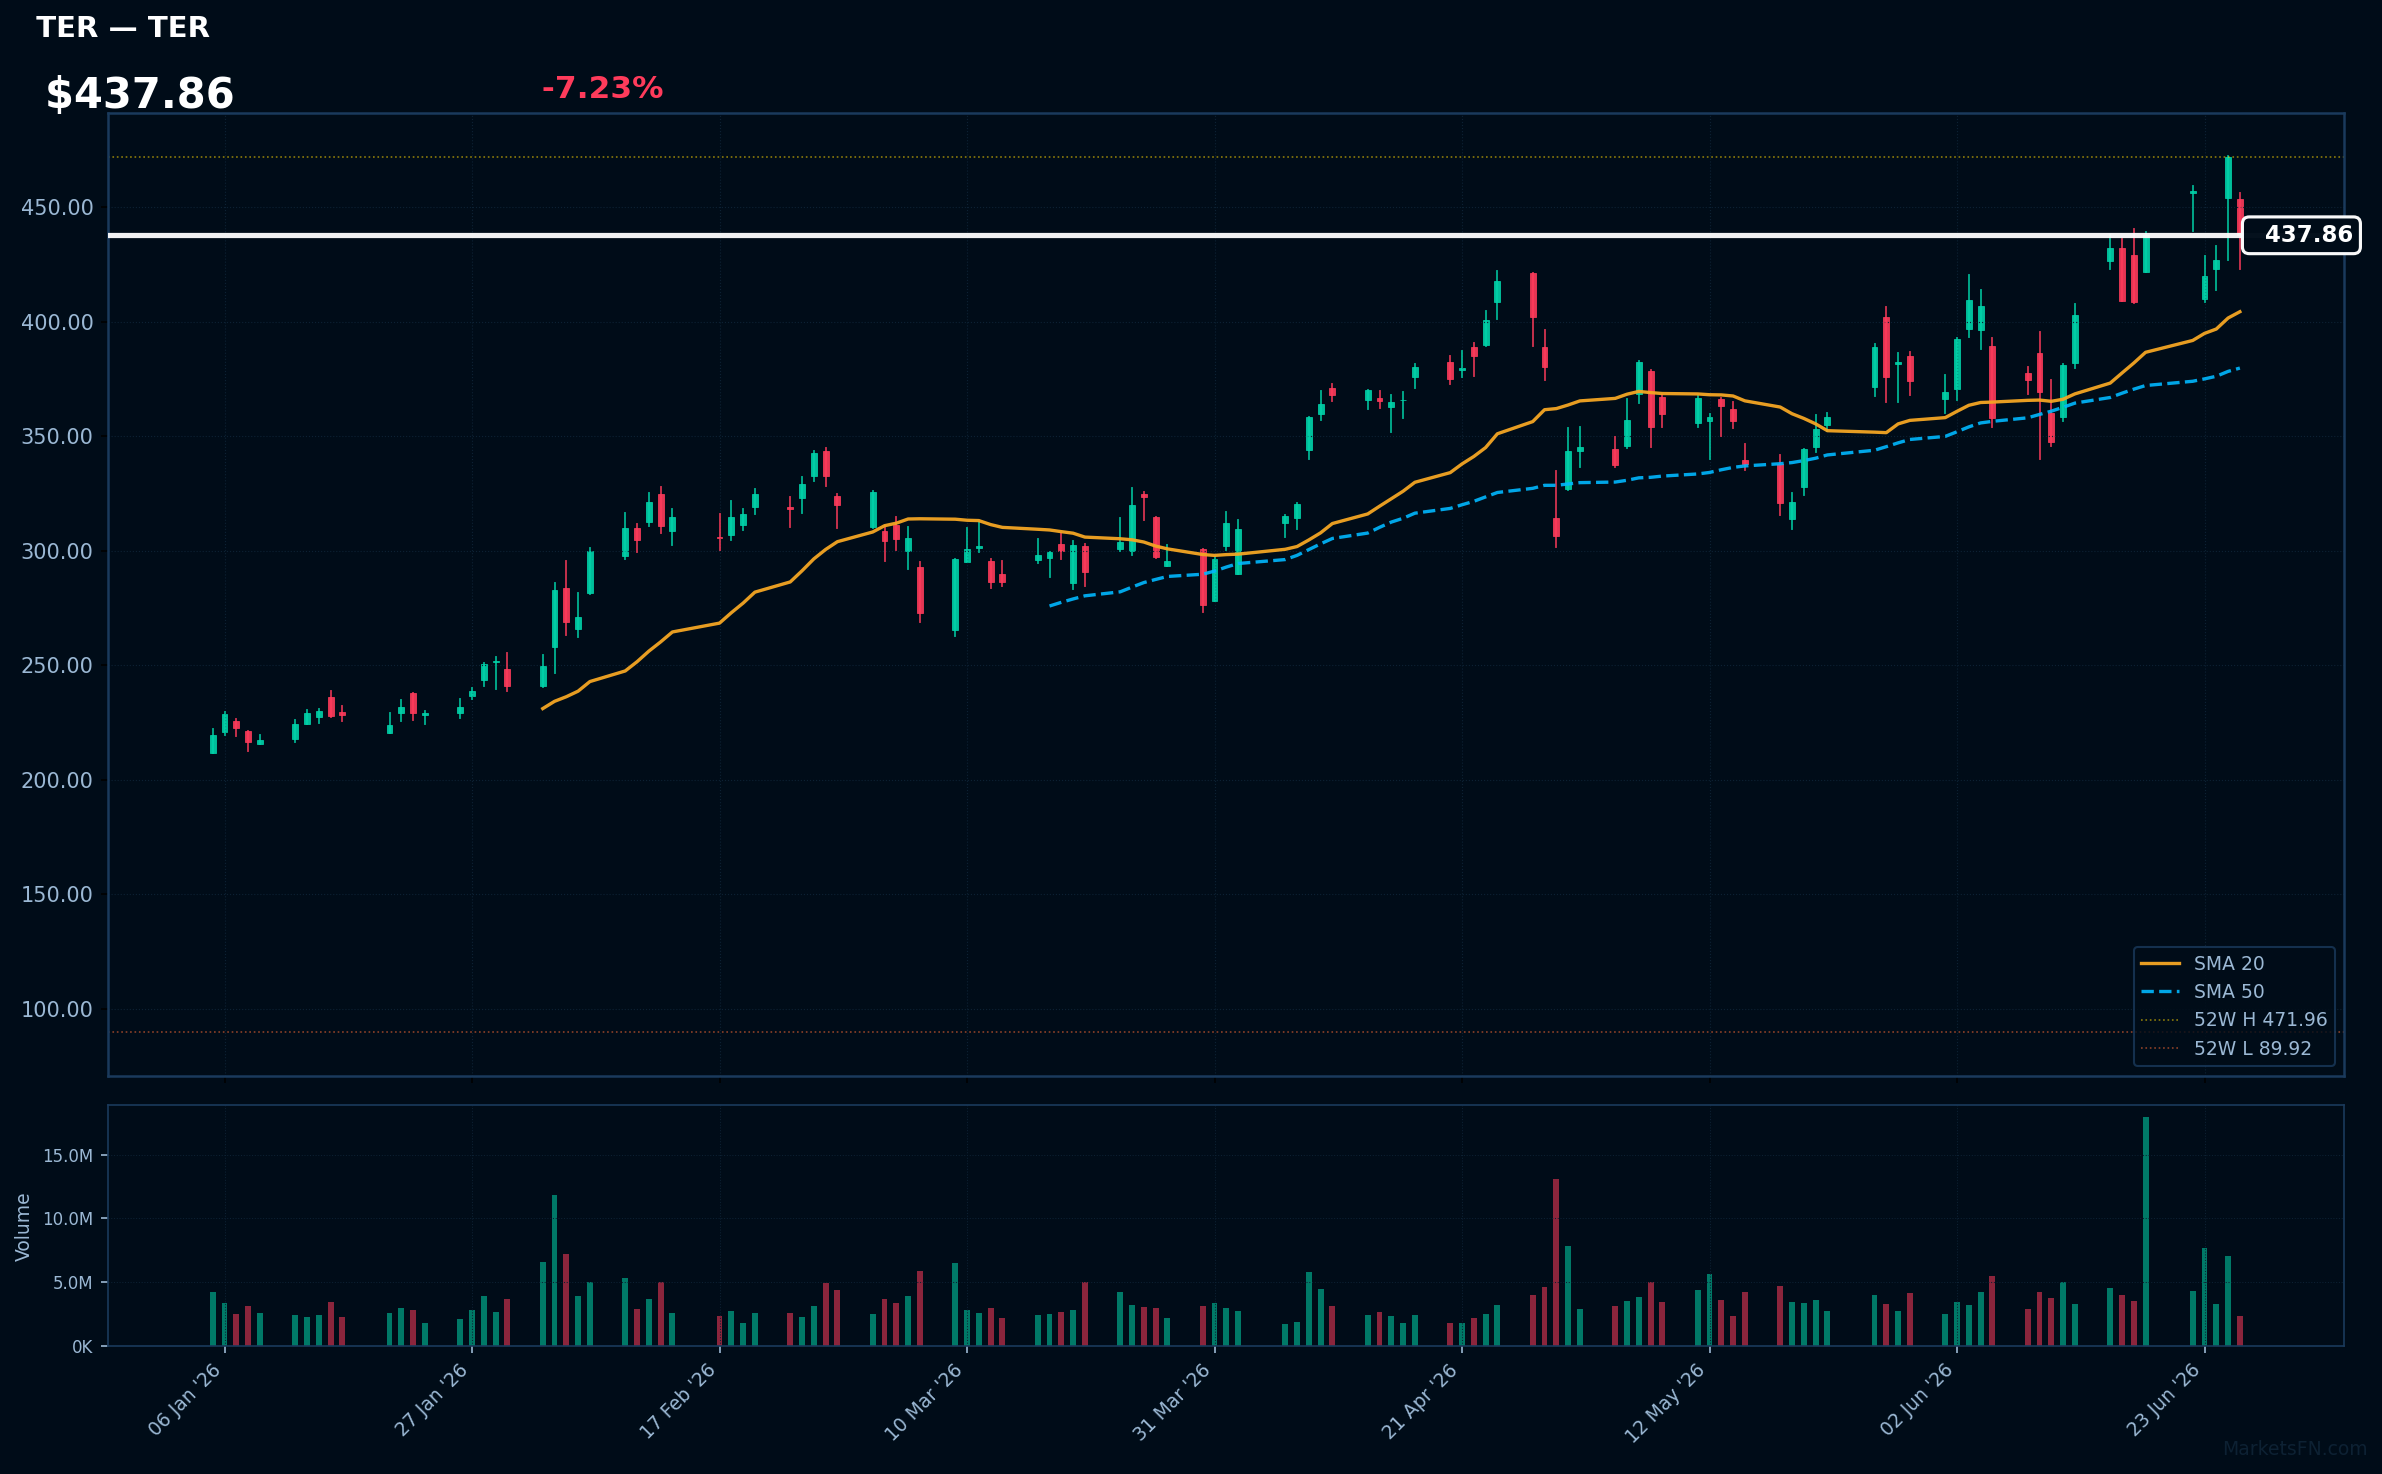
TER | Teradyne, Inc | Technology | Price: $437.86 | Day: -7.23% | 1W: -0.01% | 1M: +16.50% | RSI: 56.5 | vs MA200: +67.4% | Trend: Above MA20, MA50, MA200
STX | Seagate Technology Holdings Plc | Technology | Price: $934.77 | Day: -8.84% | 1W: -12.65% | 1M: +7.37% | RSI: 51.6 | vs MA200: +111.2% | Trend: Above MA50, MA200 · Below MA20
Recent headlines (last 12h)
- Sandisk Stock Limps Along. The Micron Earnings Afterglow Is Gone.
- Nvidia, Micron, AMD Lead Chip Selloff on OpenAI IPO Delay Report Rattles Tech
- Apple, Sandisk, Marvell, and More Stocks That Explain Today's Market
- Micron Leads Tech Stocks Rally on Blowout Earnings
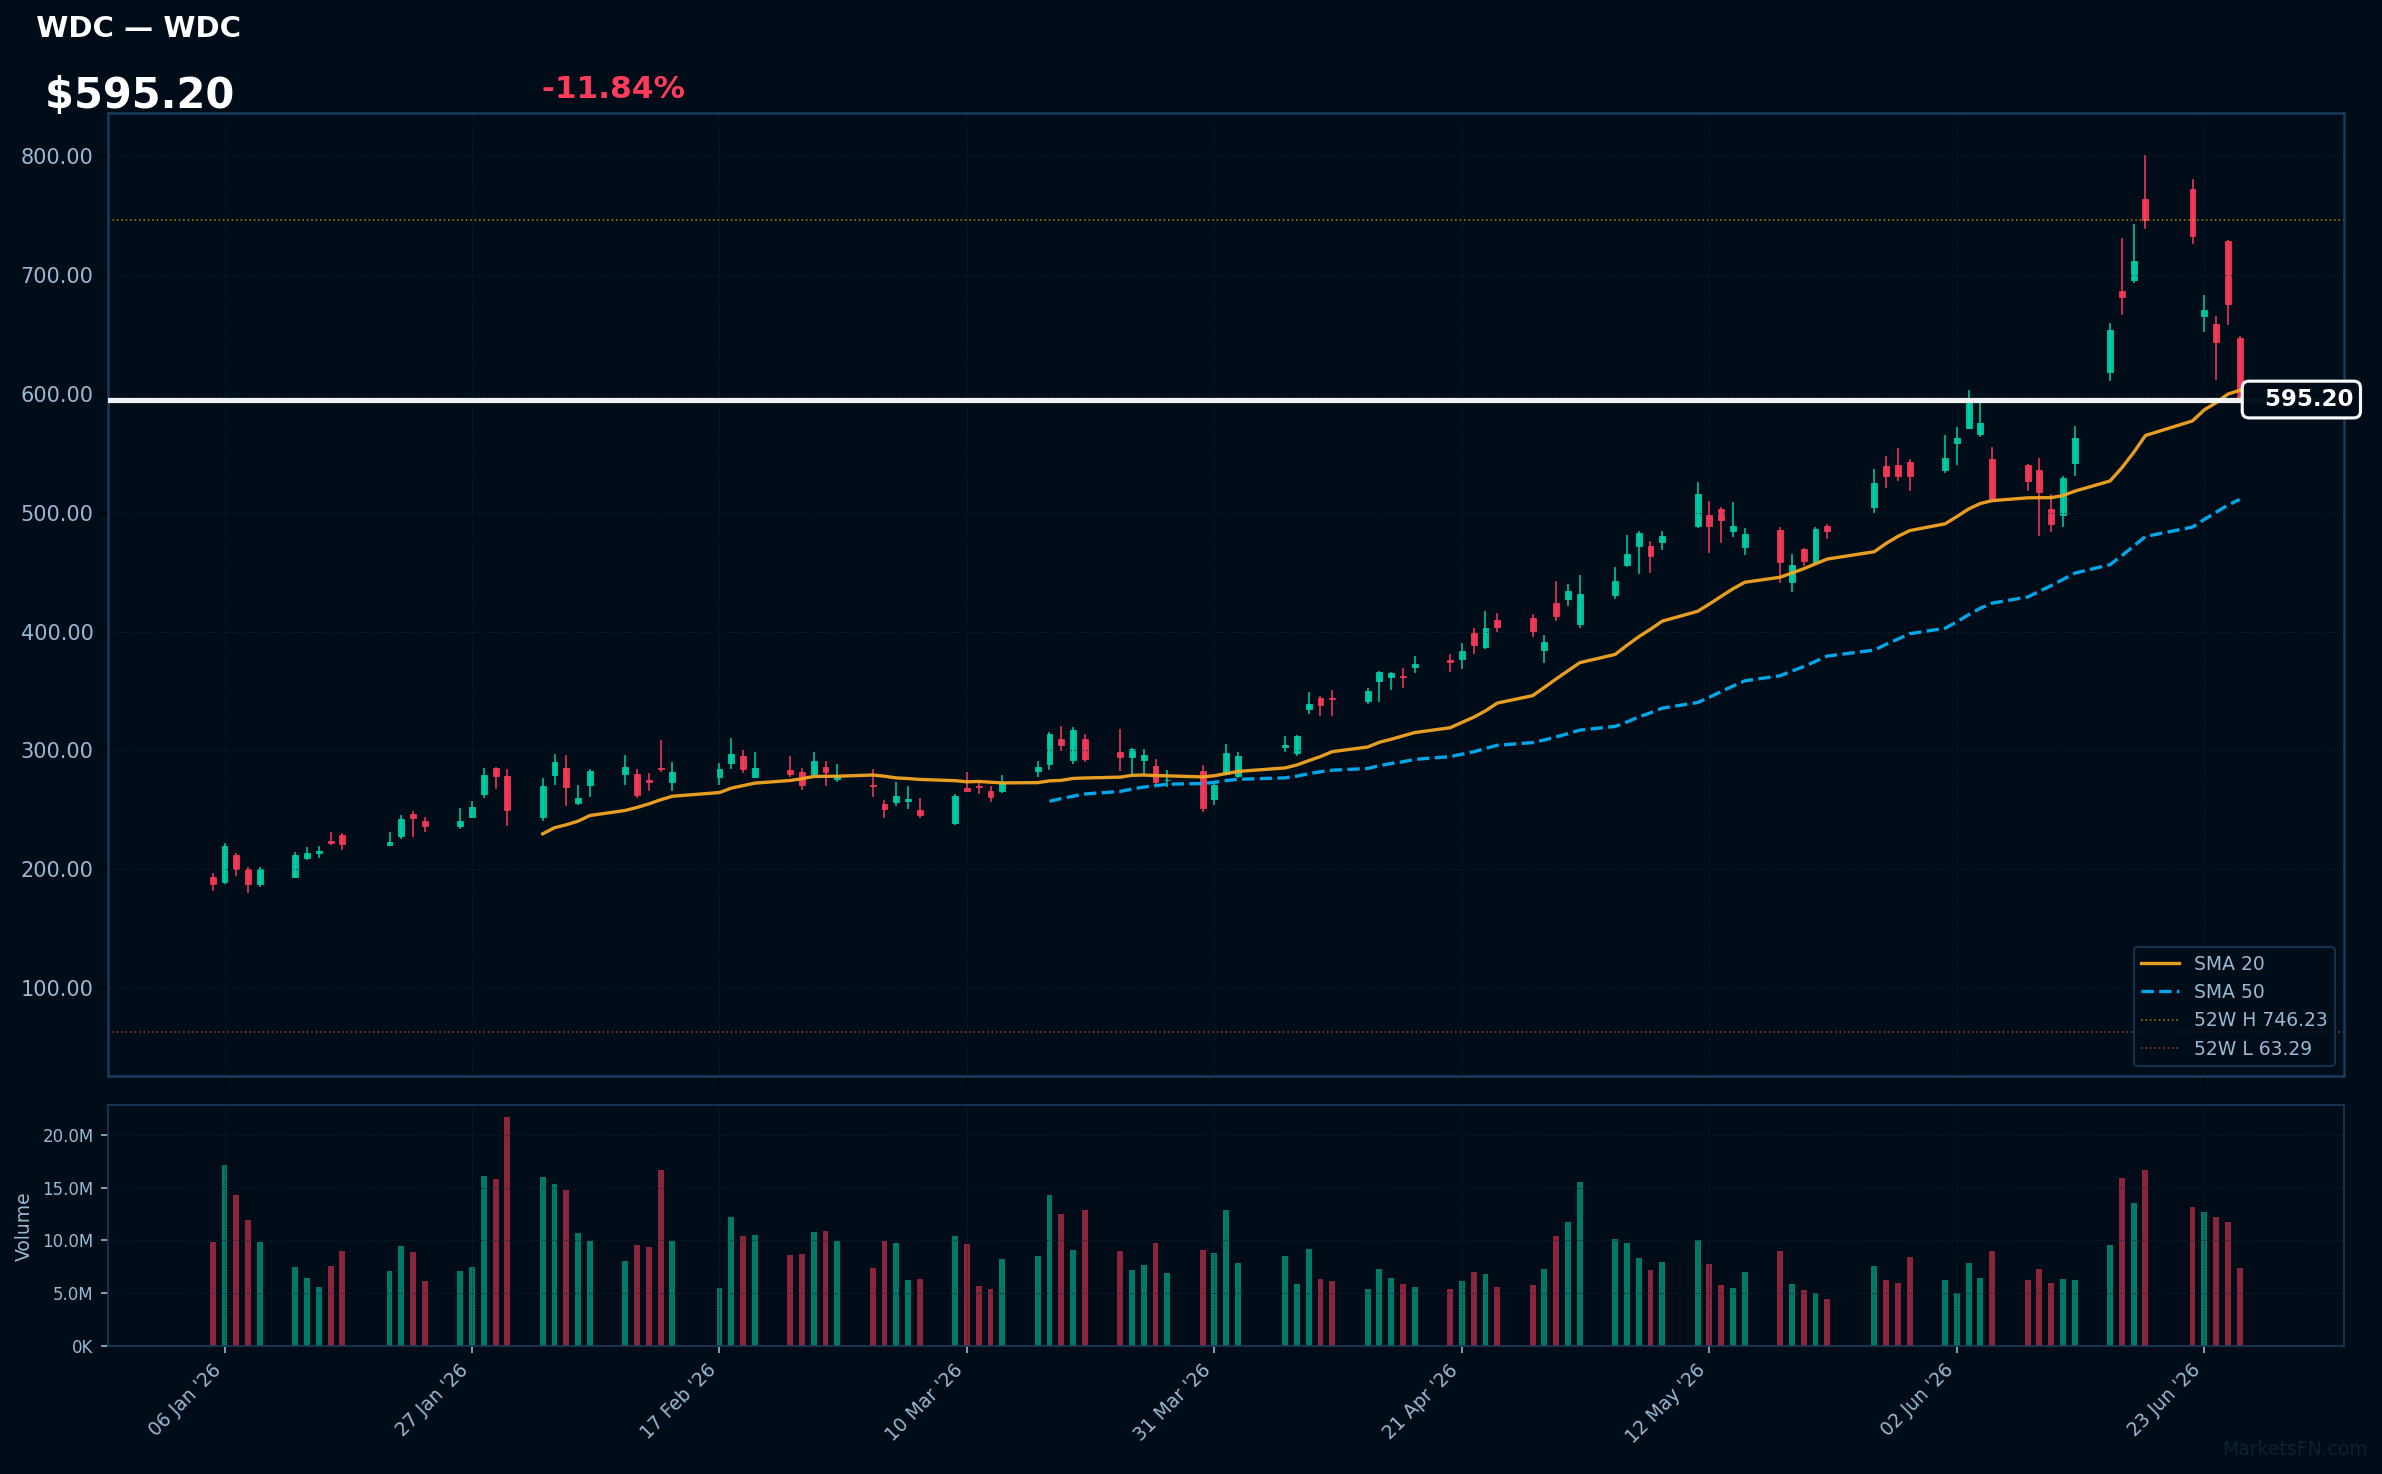
WDC | Western Digital Corp | Technology | Price: $595.42 | Day: -11.84% | 1W: -20.24% | 1M: +12.17% | RSI: 51.1 | vs MA200: +112.3% | Trend: Above MA50, MA200 · Below MA20
Recent headlines (last 12h)
- Sandisk Stock Limps Along. The Micron Earnings Afterglow Is Gone.
- Nvidia, Micron, AMD Lead Chip Selloff on OpenAI IPO Delay Report Rattles Tech
- Semiconductor stocks retreat over worries about memory costs
- Micron's stock is still dirt cheap. Some analysts say that's about to change.
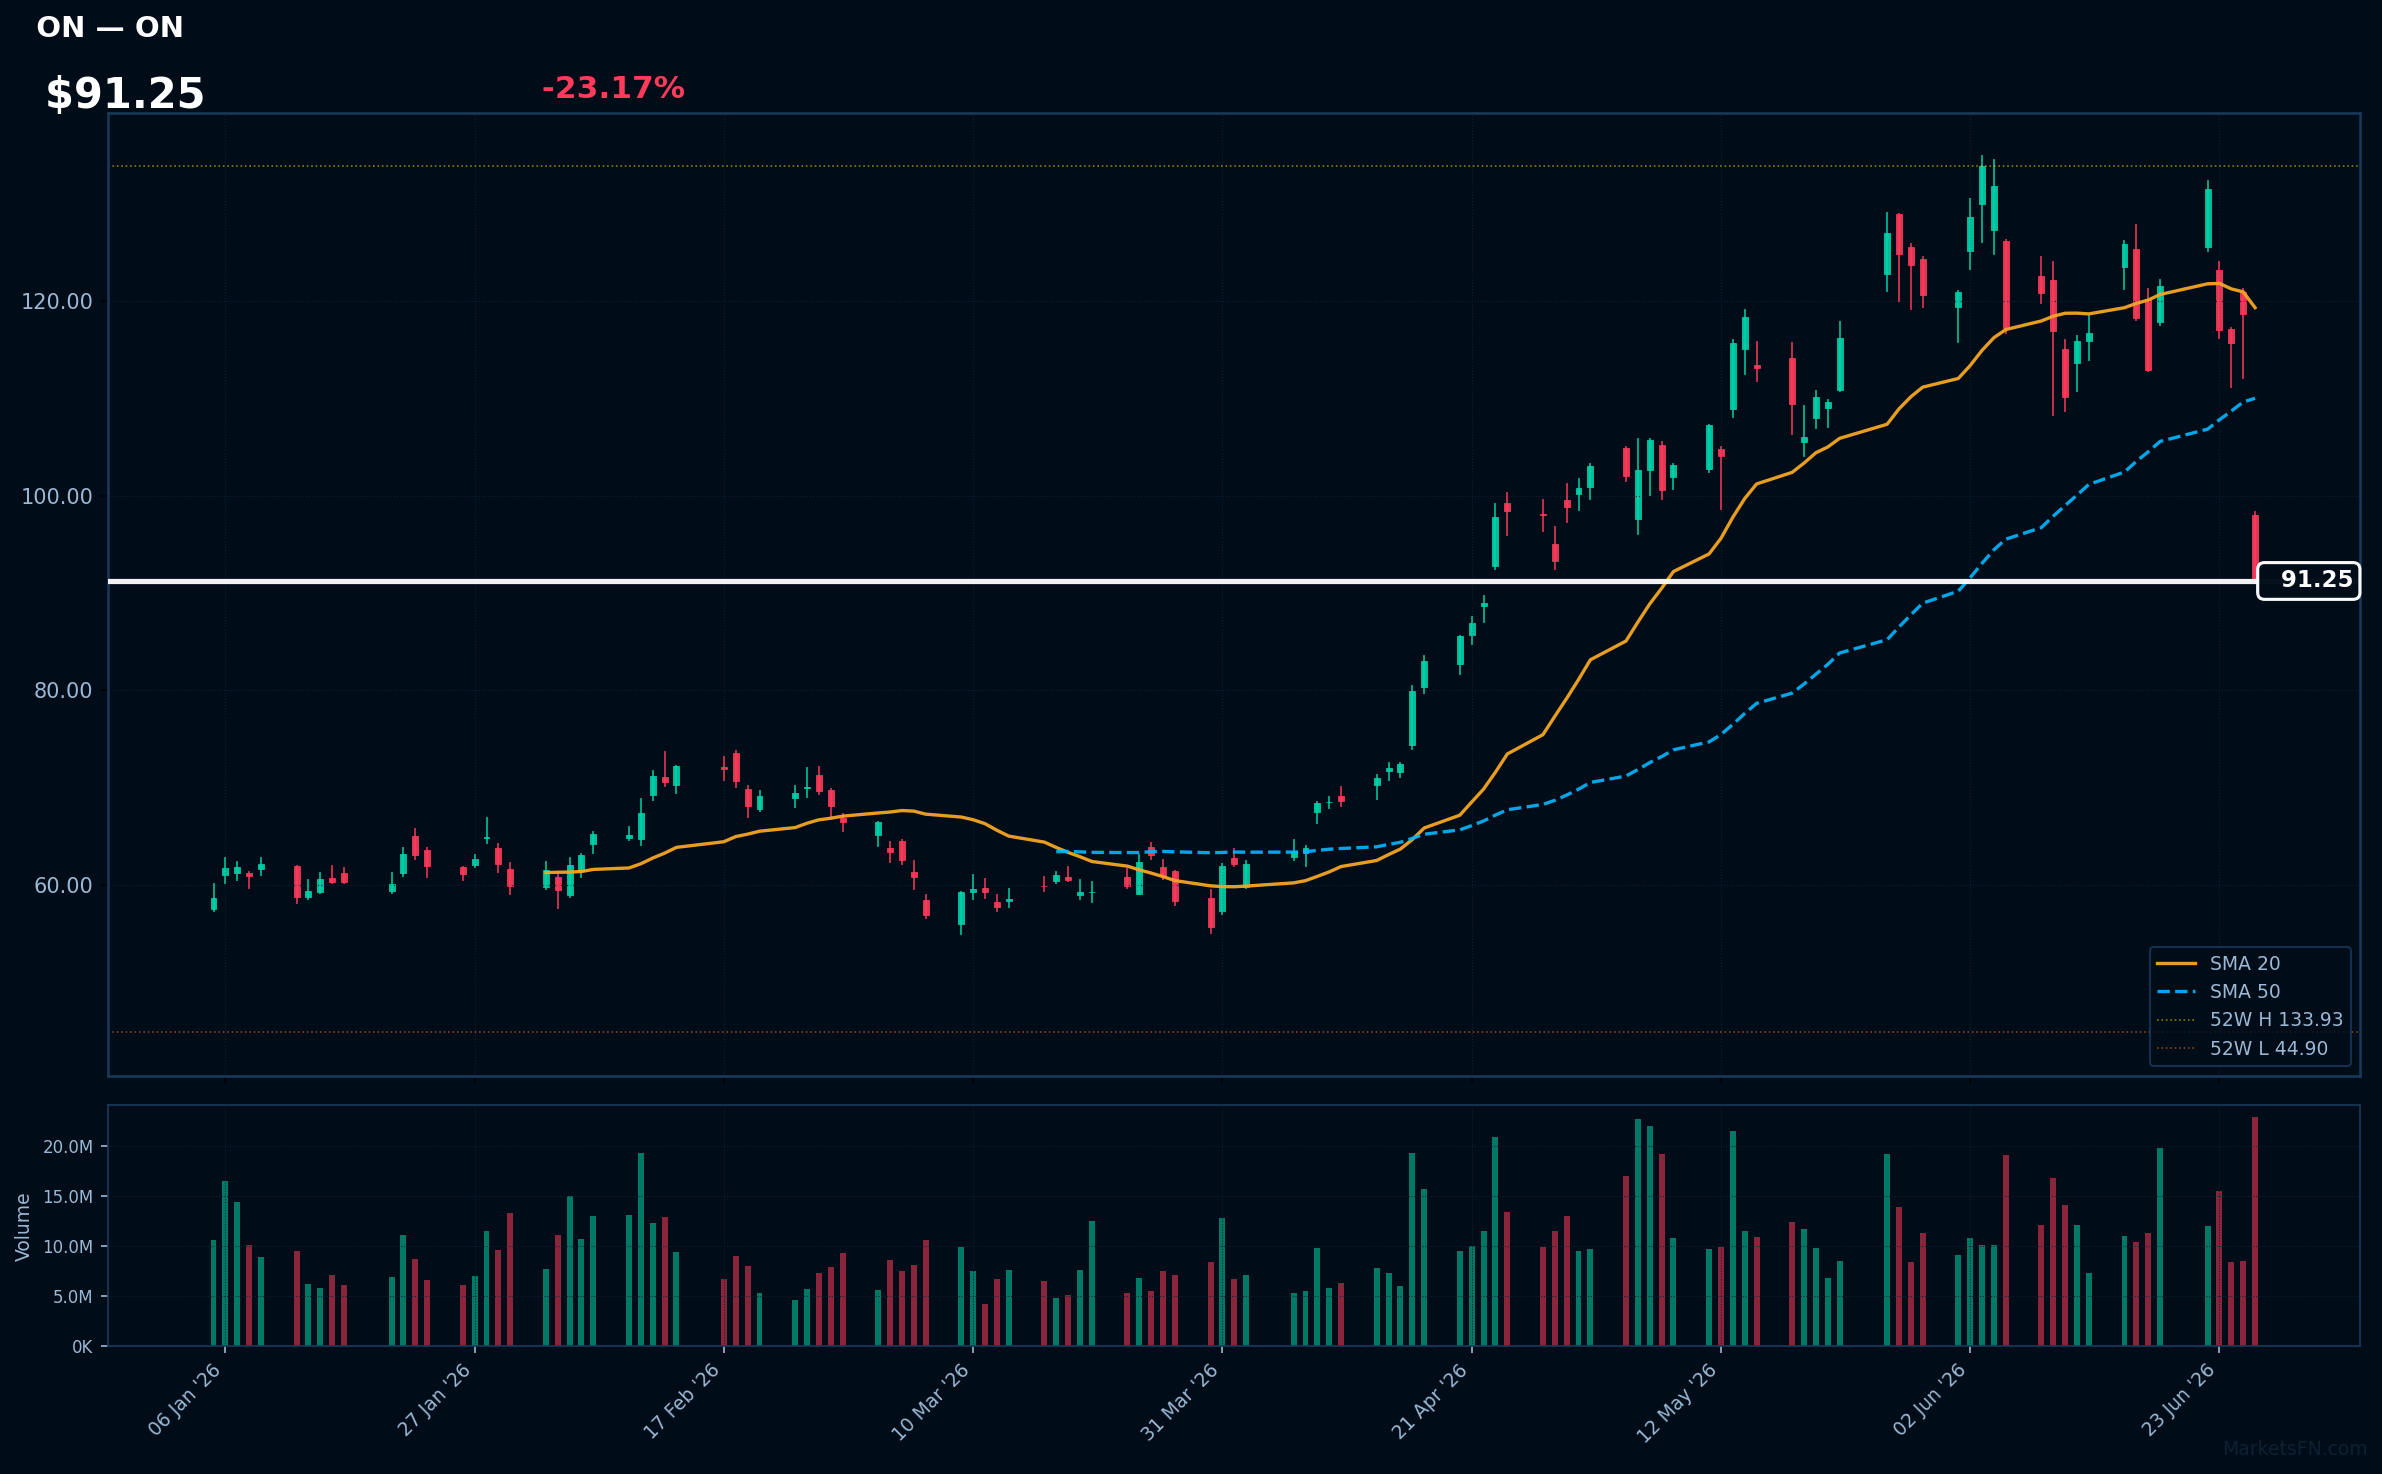
ON | ON Semiconductor Corp | Technology | Price: $91.23 | Day: -23.17% | 1W: -24.97% | 1M: -26.94% | RSI: 37.5 | vs MA200: +30.0% | Trend: Above MA200 · Below MA20, MA50
Recent headlines (last 12h)
- ON Semiconductor Faces Questions Over $7 Billion Synaptics Deal
- Onsemi Acquisition Seen Diluting Its Data Center Focus
- Onsemi shares slide on $7B Synaptics deal
- Stocks to Watch: ON Semiconductor, Apple, Zalando
Market Commentary
The S&P 500's +0.65% average daily change was backed by broad-based buying, with 336 advancing issues (67.9%) outpacing 159 decliners (32.1%) among the 495 constituents tracked. This suggests a positive tone in the session, driven by a diverse range of stocks.
A clear sector rotation is evident from today's top gainers and losers. Technology and Healthcare stocks led the gains, with MRNA, NOW, and LLY among the top 10 gainers, while Technology stocks also dominated the losers' list, with NXPI, MPWR, and ADI declining. This dichotomy within Technology suggests a nuanced shift in investor sentiment, potentially driven by earnings or sector-specific news.
With only 3.2% of stocks above their MA200, the index remains vulnerable to further downside pressure. Traders should watch the MA200 level closely, as a sustained move above it could signal a shift in the broader trend. The next catalyst will be the upcoming earnings reports from key constituents, which may validate or invalidate the current sector rotation and influence the S&P 500's direction.
Methodology
Daily ranking uses the latest session close versus the prior close. RSI (14-day EWM), MA20, MA50, and MA200 are computed from 12 months of daily OHLCV data sourced from Yahoo Finance. Charts show the last 120 trading sessions with SMA 20/50, 52-week H/L markers, and volume. Recent news (last 12 h) is sourced from FinViz. Updated every trading day.
Disclaimer
The content on MarketsFN.com is provided for educational and informational purposes only. It does not constitute financial advice, investment recommendations, or trading guidance. All investments involve risks, and past performance does not guarantee future results. You are solely responsible for your investment decisions and should conduct independent research and consult a qualified financial advisor before acting. MarketsFN.com and its authors are not liable for any losses or damages arising from your use of this information.
Related Articles
- Beyond Air Inc. (XAIR) Rises 3.67% After Earnings — Post Earning Analysis Beyond Air Inc. (XAIR) Rises 3.67% After Earnings Beyond Air, Inc. specializes in developing…
- Cineverse Corp. (CNVS) Rallies 16.42% After Earnings — Post Earning Analysis Cineverse Corp. (CNVS) Rallies 16.42% After Earnings Cineverse Corp (CNVS) has just disclosed its…
- Apogee Enterprises Inc. (APOG) Rallies 12.97% After Earnings — Post Earning Analysis Apogee Enterprises Inc. (APOG) Rallies 12.97% After Earnings Apogee Enterprises has reaffirmed…
- Nasdaq 100 52-Week Highs & Lows Radar: Monster Beverage (MNST), PDD ADR (PDD) and more — Nasdaq 100 stocks nearest to their 52-week high and low. Bloomberg-style charts, RSI/MA analysis and Grok commentary.
- S&P 500 52-Week Highs & Lows Radar: Lilly(Eli) & (LLY), Nike, (NKE) and more — S&P 500 stocks nearest to their 52-week high and low. Bloomberg-style charts, RSI/MA analysis and Grok commentary.