S&P 500 Bull & Bear Radar — June 29, 2026
· Stocks · QuoteReporter
S&P 500 Bull & Bear Radar — June 29, 2026
A daily technical sweep of 496 S&P 500 constituents ranked by session performance, enriched with RSI, MA20/MA50/MA200 trend signals, Bloomberg-style charts, and recent news.
Index-Wide Breadth
| Constituents tracked | 496 |
| Advancing | 329 (66.3%) |
| Declining | 166 (33.5%) |
| Average daily change | +0.71% |
| Above MA200 | 15 (3.0%) |
Top 10 Gainers
Today's strongest S&P 500 performers. Sector leadership: Technology (5), Healthcare (3), Financial (1), Communication Services (1).
| Ticker | Company | Sector | Price | Day % | 1W % | 1M % | RSI | vs MA200 | Trend |
|---|---|---|---|---|---|---|---|---|---|
| MRNA | Moderna Inc | Healthcare | $67.27 | +12.59% | +5.18% | +41.29% | 71.2 | +67.6% | Above MA20, MA50, MA200 |
| FDS | Factset Research Systems Inc | Financial | $231.74 | +10.97% | +4.72% | -1.69% | 50.6 | -8.6% | Above MA50 · Below MA20, MA200 |
| NOW | ServiceNow Inc | Technology | $98.34 | +9.85% | +3.47% | -3.70% | 47.2 | -26.9% | Below MA20, MA50, MA200 |
| WDAY | Workday Inc | Technology | $124.21 | +9.18% | +6.23% | -0.23% | 47.4 | -29.7% | Below MA20, MA50, MA200 |
| DDOG | Datadog Inc | Technology | $239.77 | +8.52% | +7.52% | +8.10% | 62.2 | +56.0% | Above MA20, MA50, MA200 |
| LLY | Lilly(Eli) & Co | Healthcare | $1208.12 | +7.13% | +9.97% | +11.56% | 72.3 | +23.8% | Above MA20, MA50, MA200 |
| BIIB | Biogen Inc | Healthcare | $216.03 | +6.97% | +9.89% | +9.68% | 69.4 | +22.6% | Above MA20, MA50, MA200 |
| IT | Gartner, Inc | Technology | $134.96 | +6.58% | +5.86% | -15.63% | 40.4 | -31.7% | Below MA20, MA50, MA200 |
| GDDY | Godaddy Inc | Technology | $84.55 | +6.55% | +9.75% | -3.23% | 54.5 | -20.6% | Above MA20 · Below MA50, MA200 |
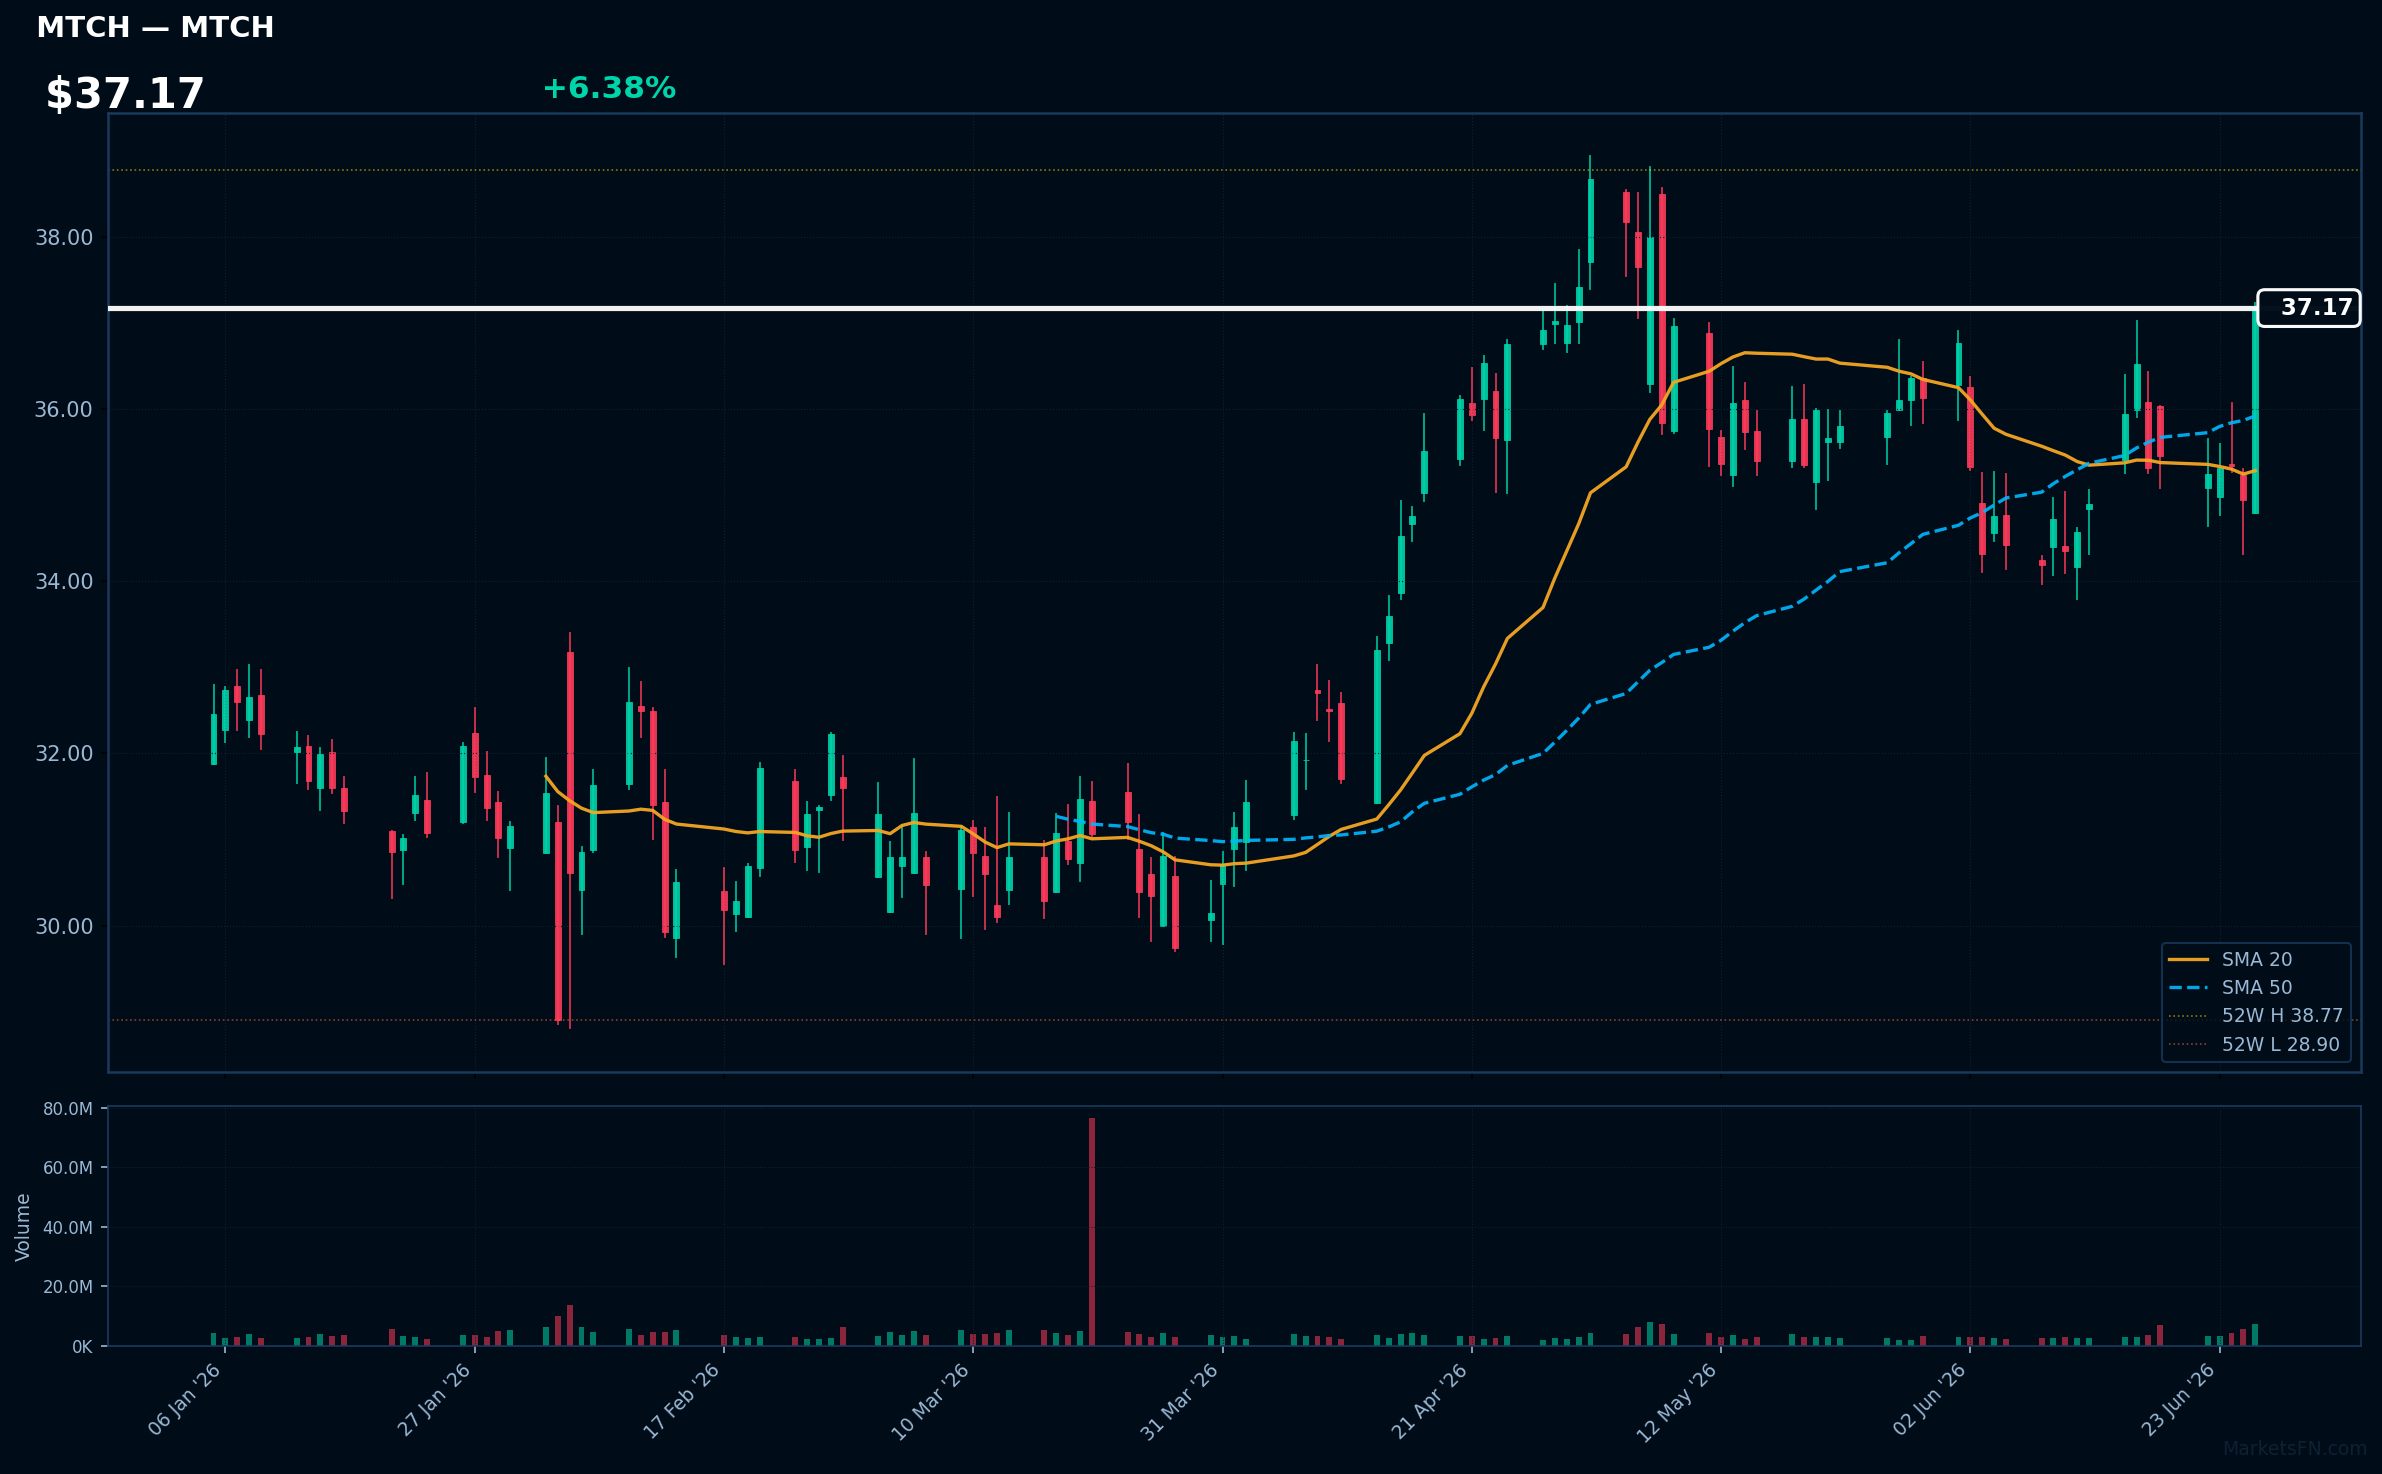
| MTCH | Match Group Inc | Communication Services | $37.17 | +6.38% | +4.85% | +2.96% | 61.3 | +11.3% | Above MA20, MA50, MA200 |
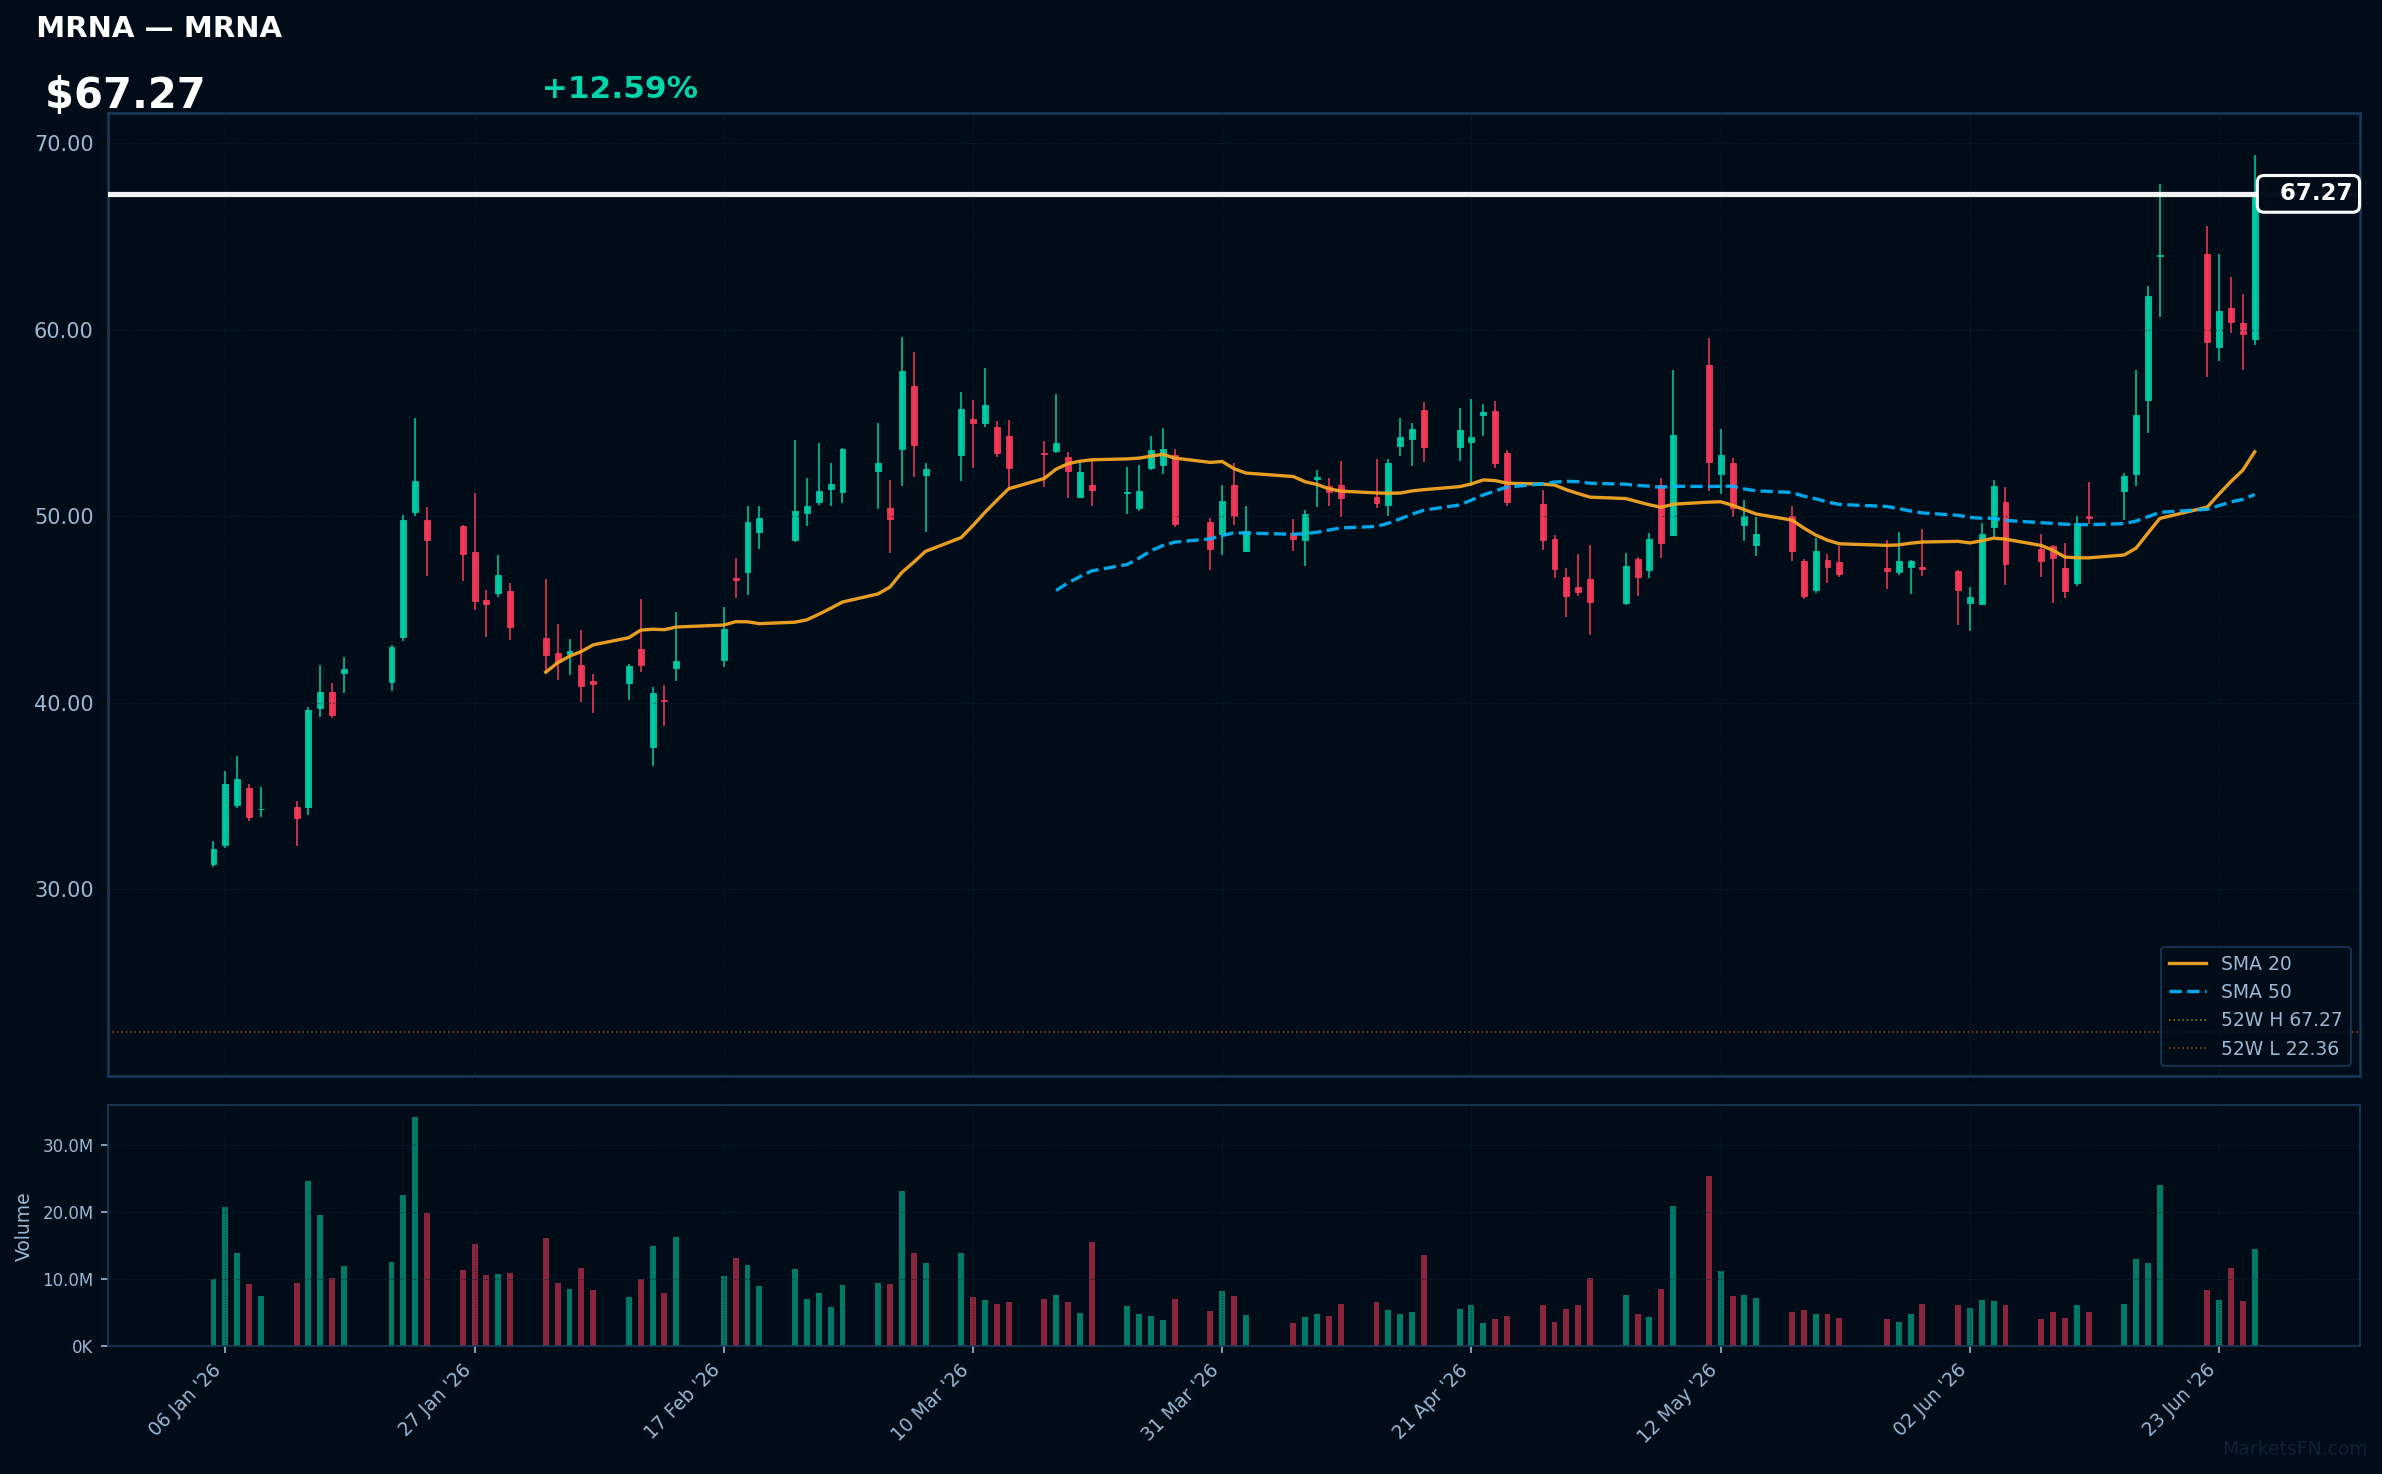
MRNA | Moderna Inc | Healthcare | Price: $67.27 | Day: +12.59% | 1W: +5.18% | 1M: +41.29% | RSI: 71.2 | vs MA200: +67.6% | Trend: Above MA20, MA50, MA200
Recent headlines (last 12h)
- This COVID Stock Market Winner Is Making a Comeback, Up 125% Year to Date
- MRNA Stock Rallies Over 40% In June: Moderna Bets Its Future On Cancer, Autoimmune Disease And AI-Powered mRNA
- Why Did SLS, MRNA, ABCL Stocks Surge To 52-Week Highs Last Week?
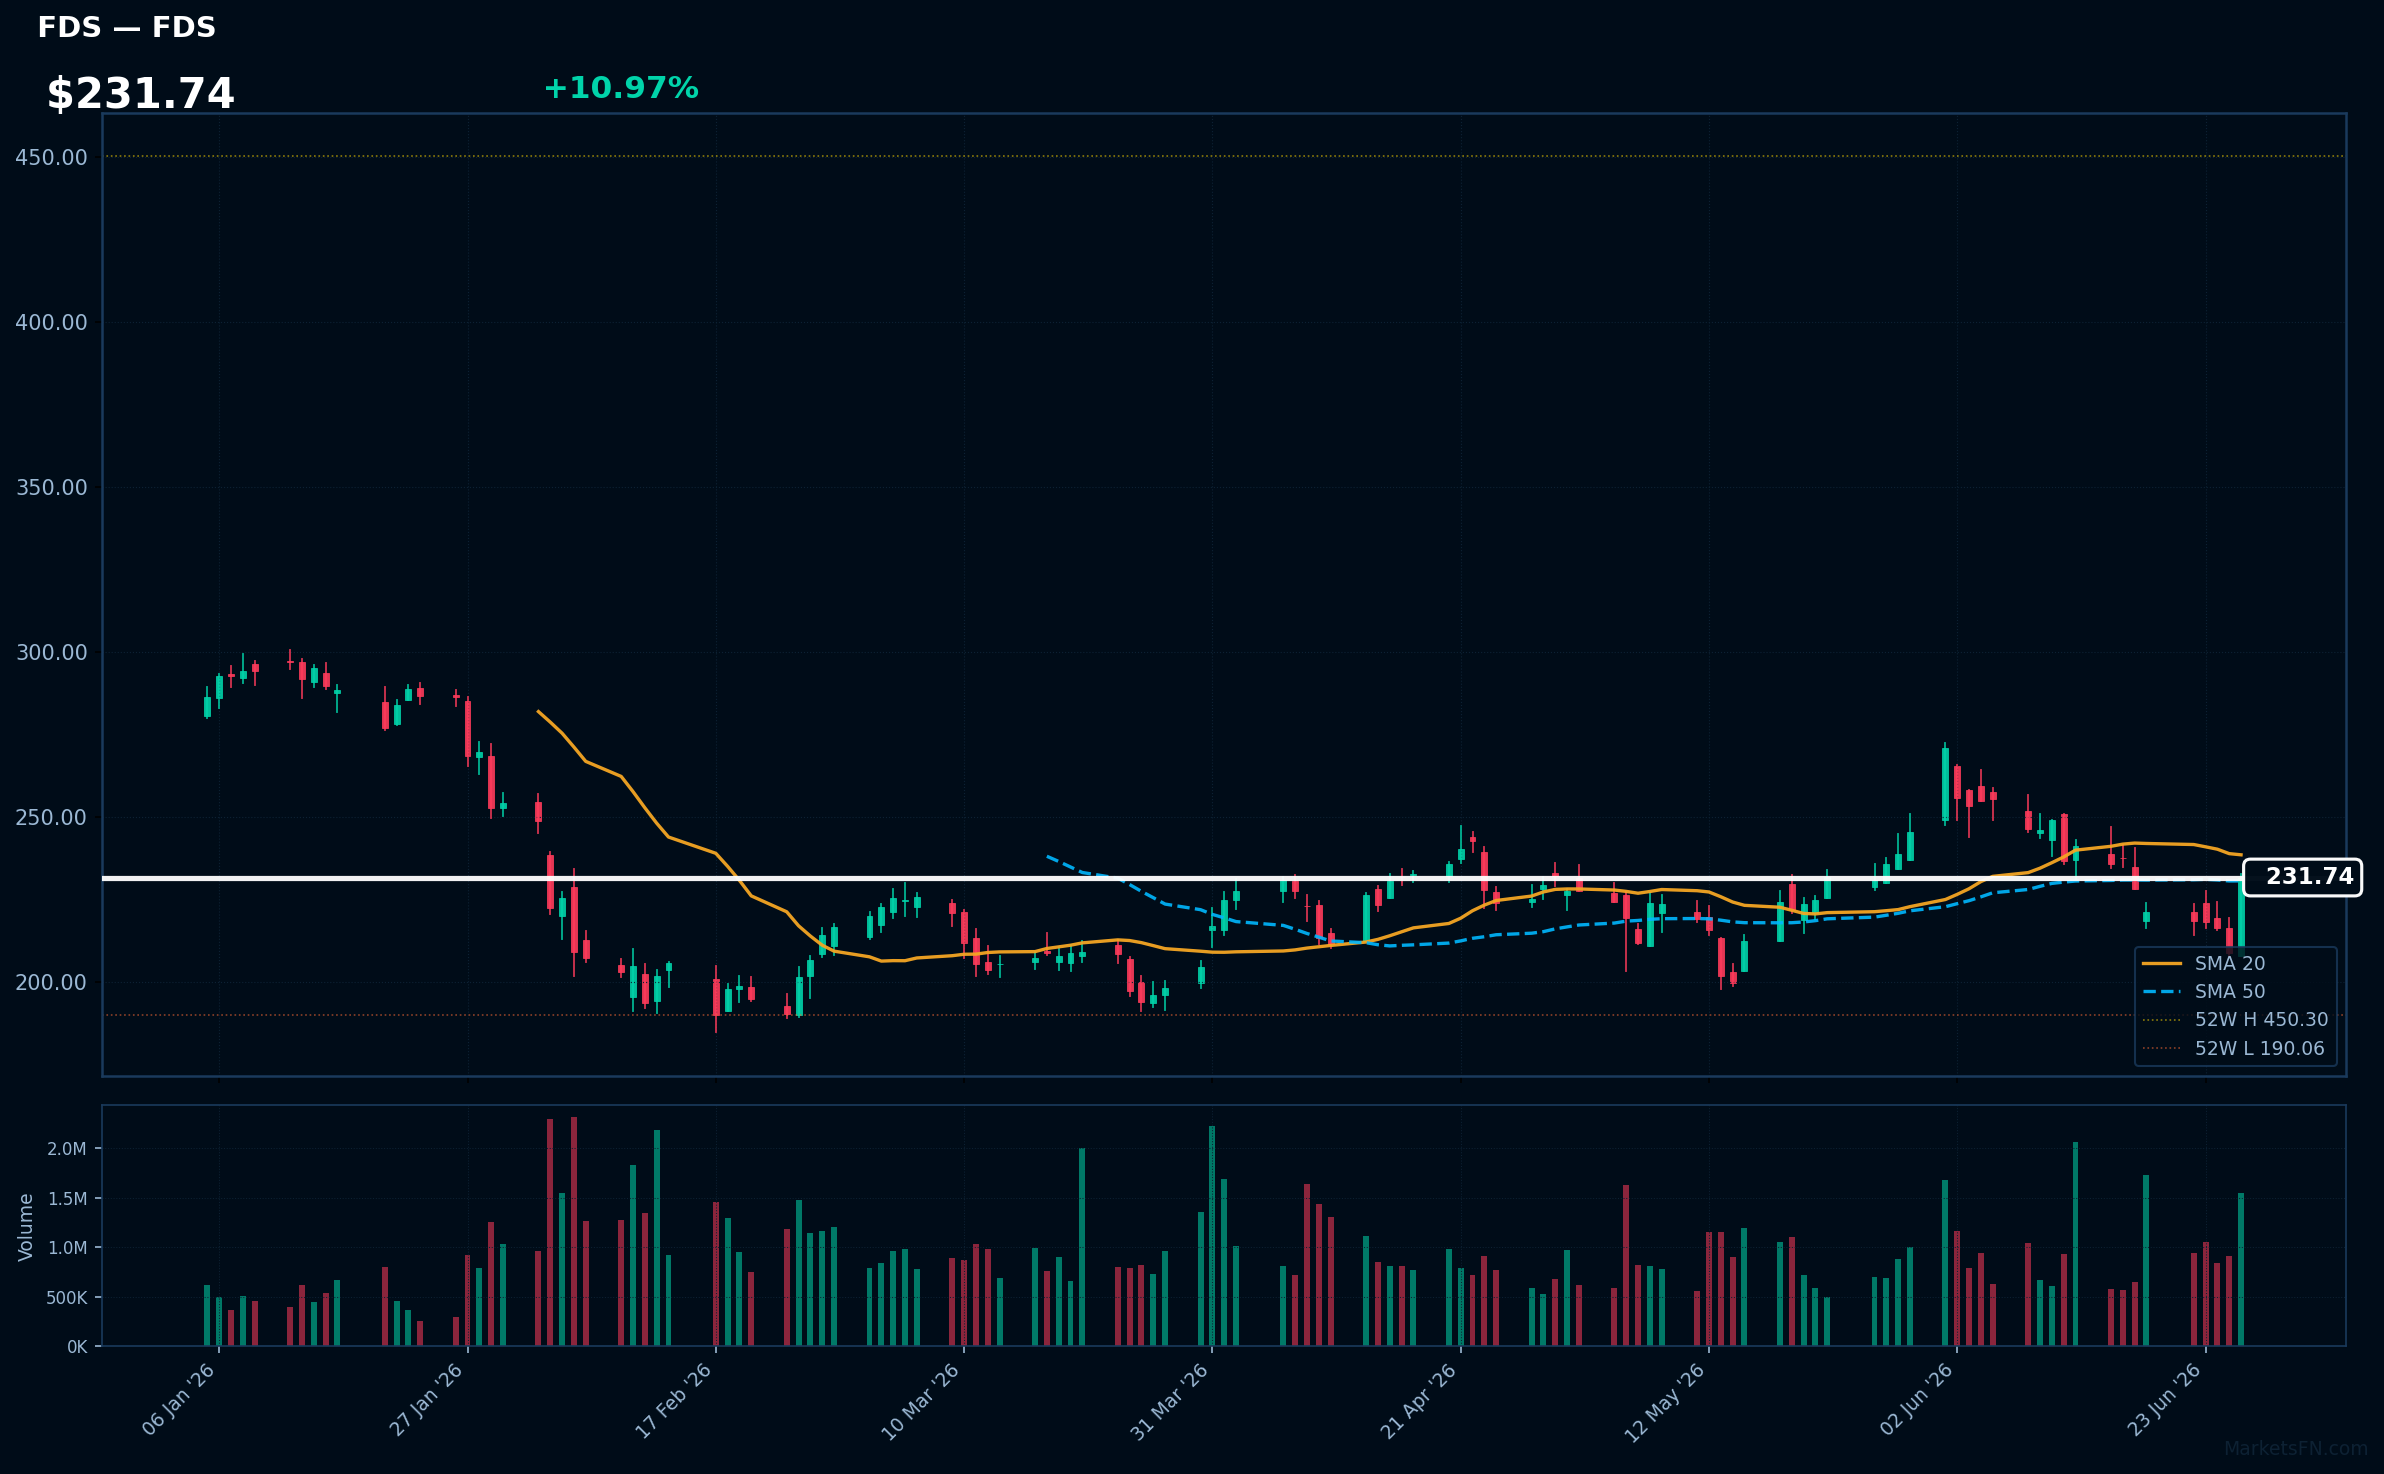
FDS | Factset Research Systems Inc | Financial | Price: $231.74 | Day: +10.97% | 1W: +4.72% | 1M: -1.69% | RSI: 50.6 | vs MA200: -8.6% | Trend: Above MA50 · Below MA20, MA200
Recent headlines (last 12h)
- FactSet Expands Wealth Management Workflow AI Capabilities Through Partnership with TIFIN.AI
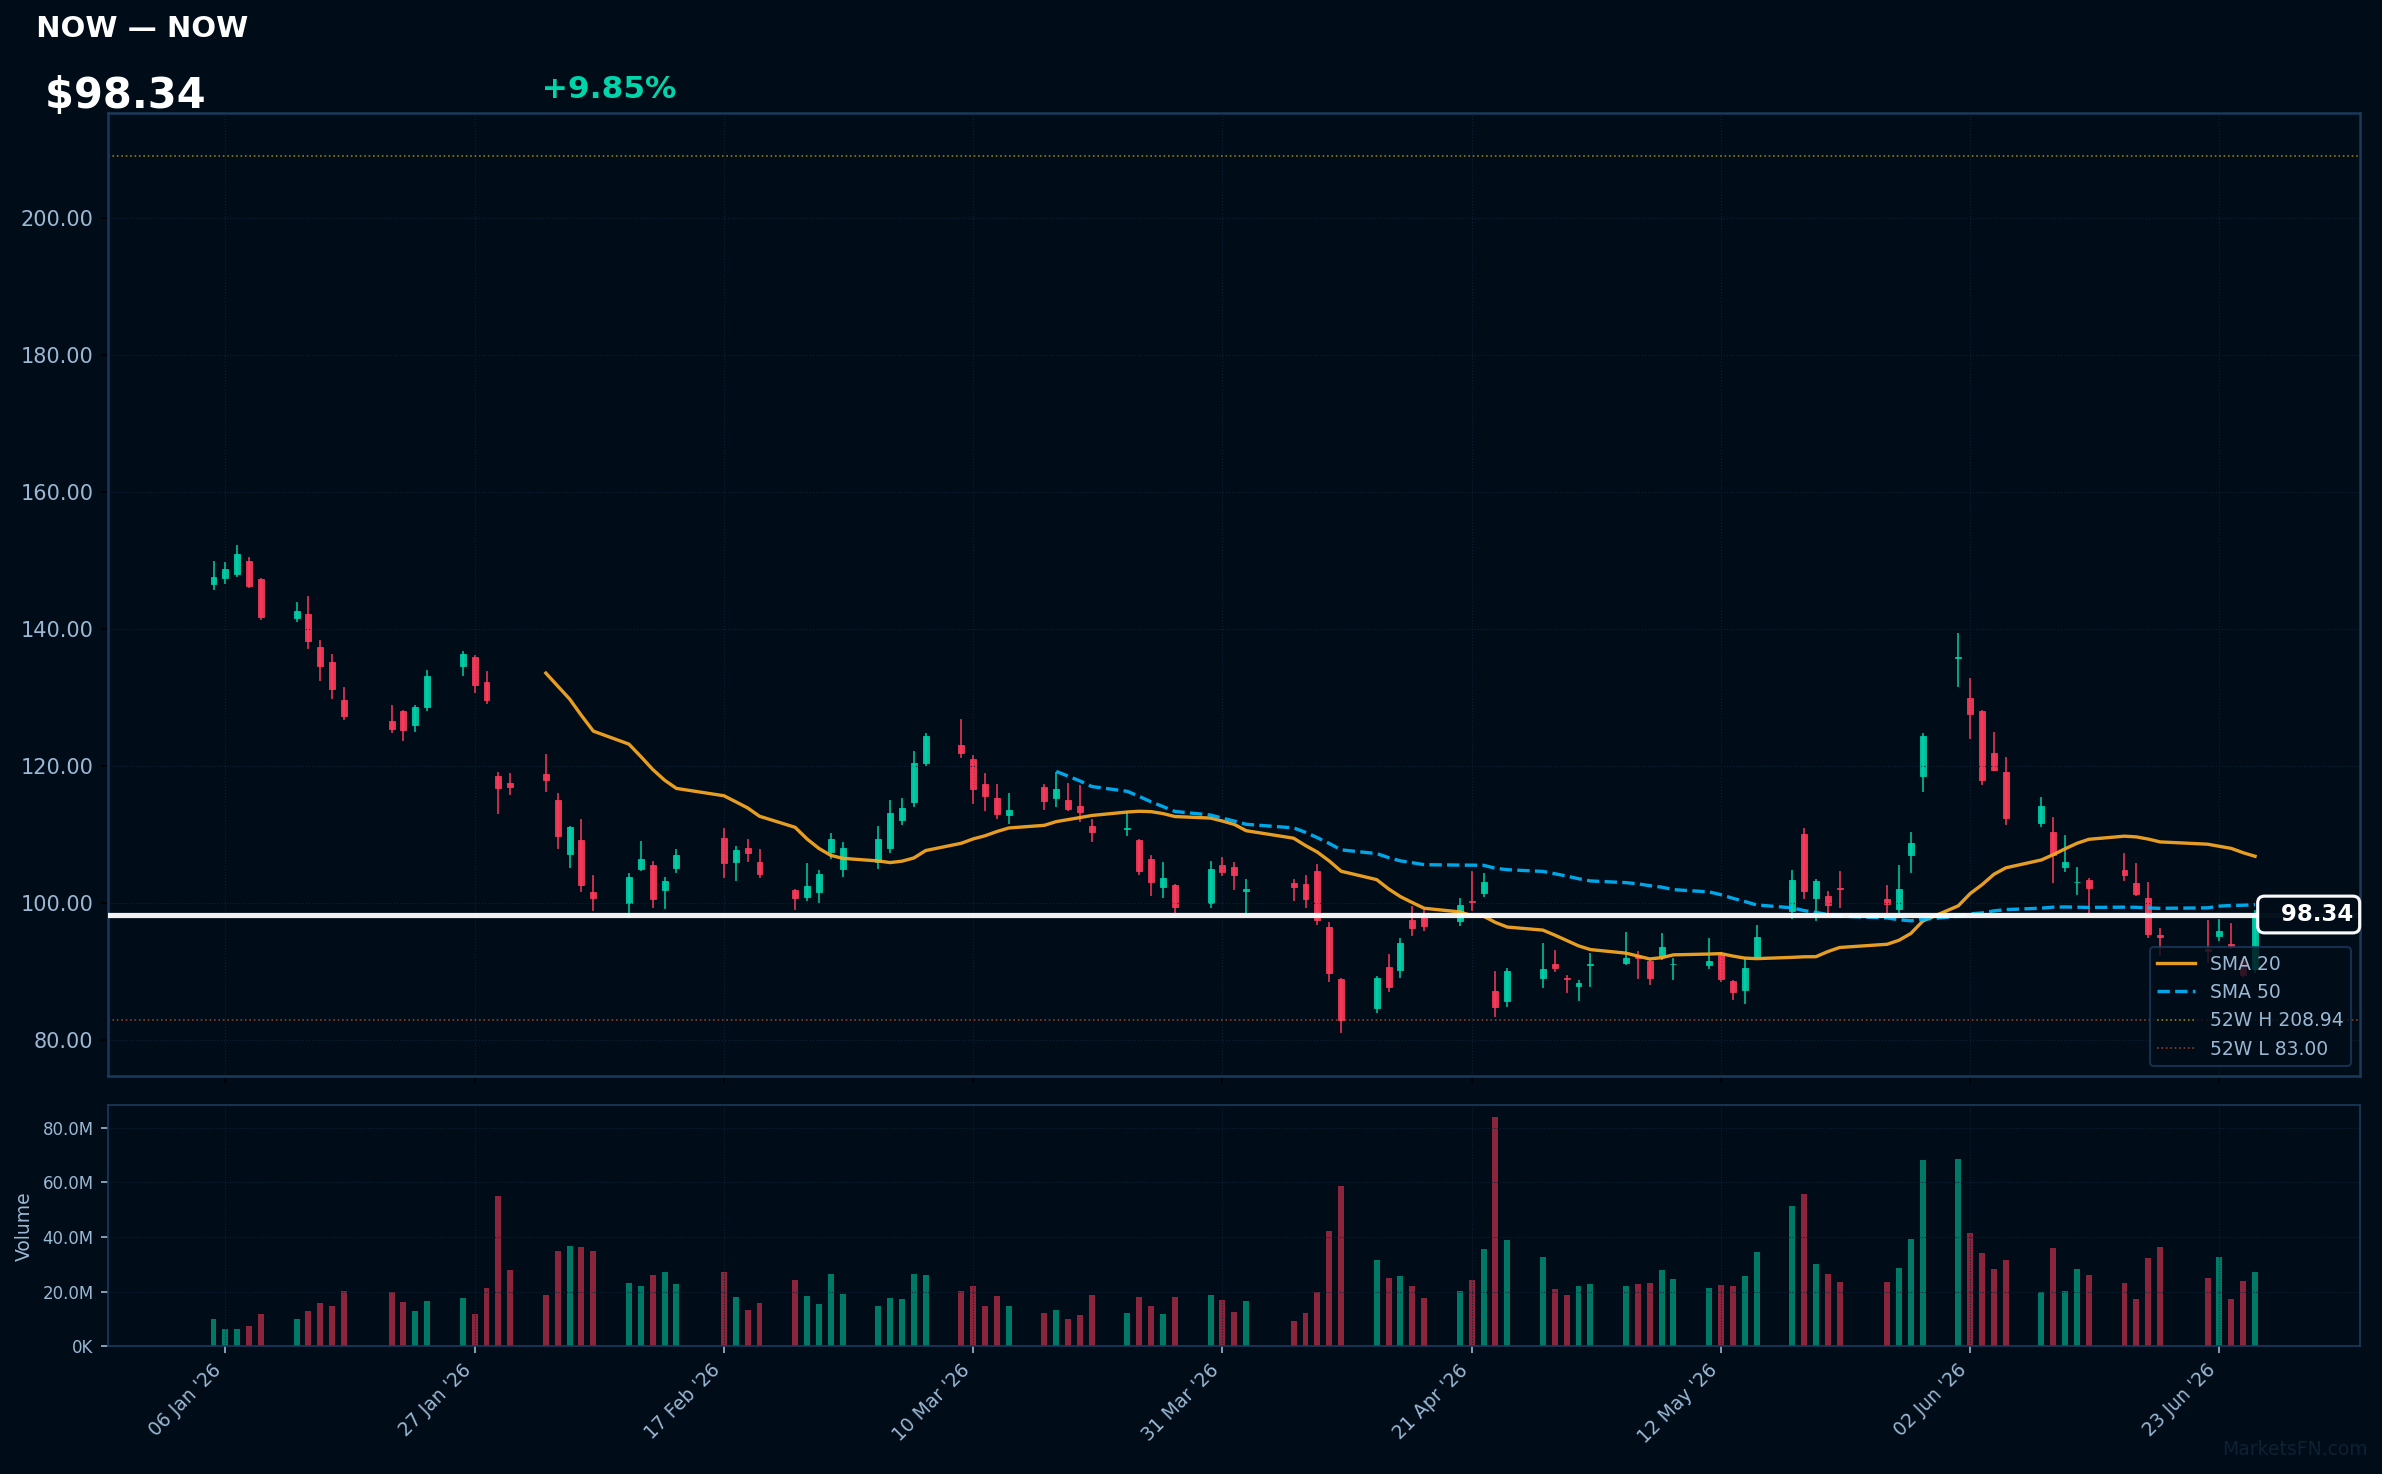
NOW | ServiceNow Inc | Technology | Price: $98.34 | Day: +9.85% | 1W: +3.47% | 1M: -3.70% | RSI: 47.2 | vs MA200: -26.9% | Trend: Below MA20, MA50, MA200
Recent headlines (last 12h)
- ServiceNow and Accenture launch AI-powered services to accelerate the shift from legacy risk platforms to agentic AI
- NOW, WDAY, ADBE, CRM: Software Stocks On The Rebound As OpenAI Threat Weakens
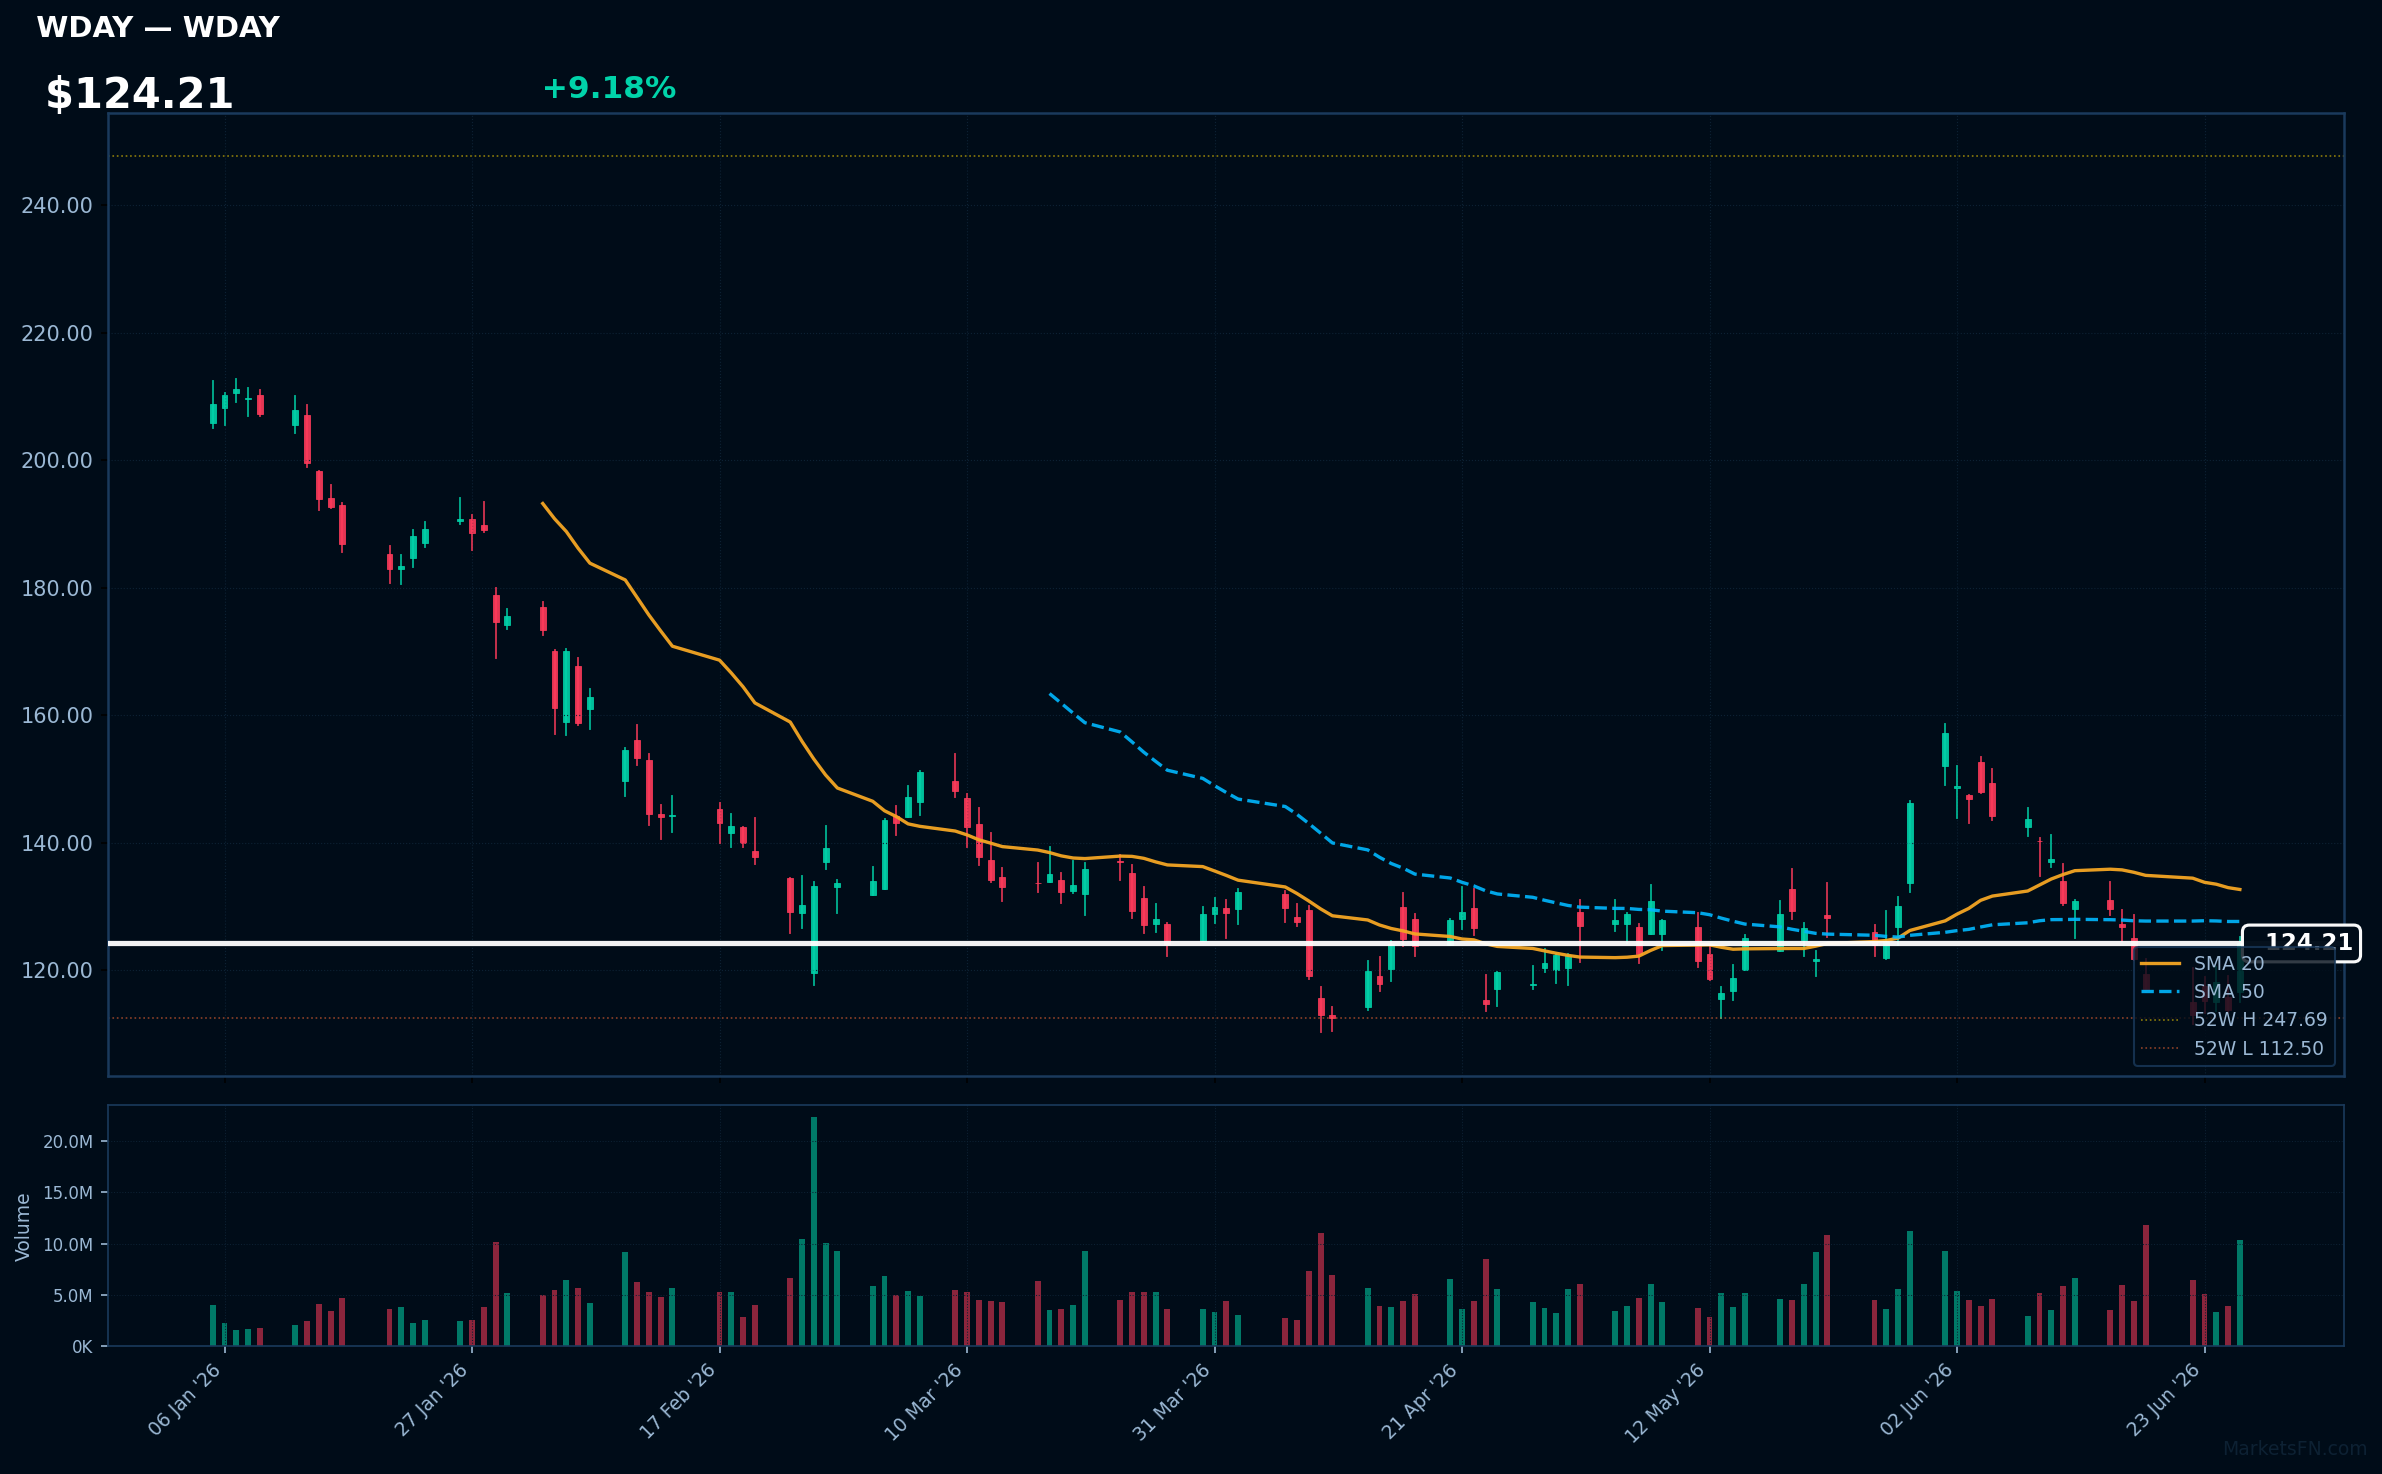
WDAY | Workday Inc | Technology | Price: $124.21 | Day: +9.18% | 1W: +6.23% | 1M: -0.23% | RSI: 47.4 | vs MA200: -29.7% | Trend: Below MA20, MA50, MA200
Recent headlines (last 12h)
- NOW, WDAY, ADBE, CRM: Software Stocks On The Rebound As OpenAI Threat Weakens
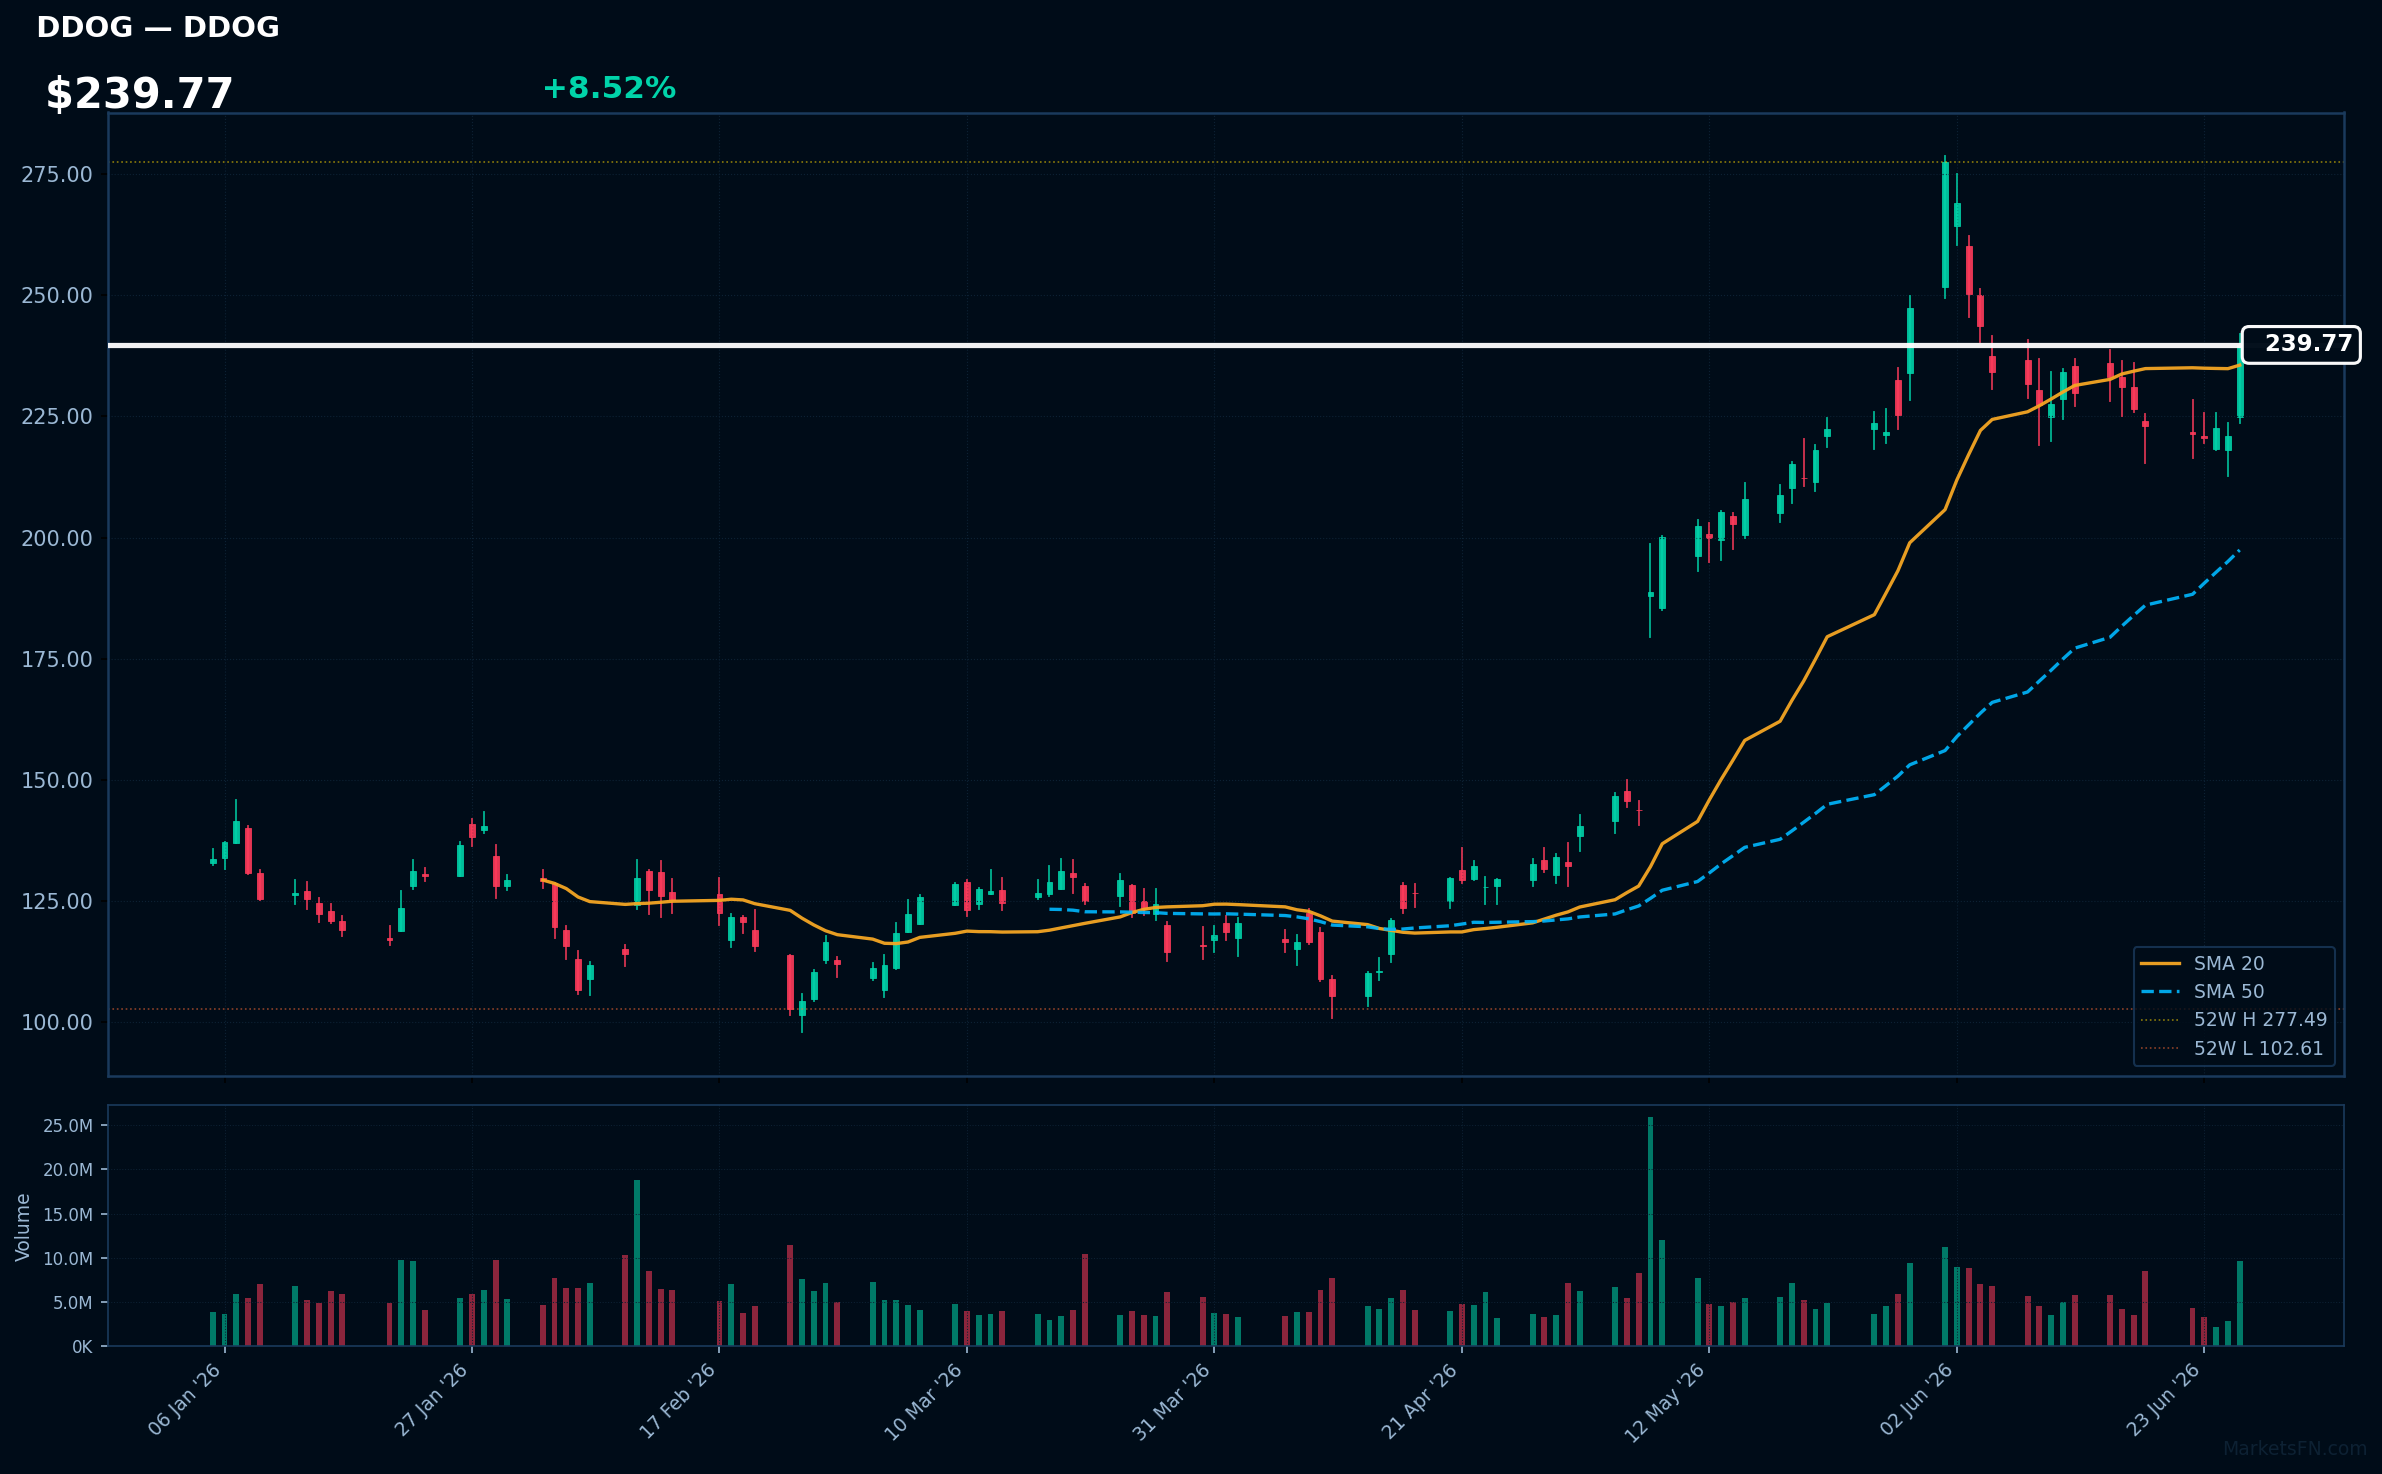
DDOG | Datadog Inc | Technology | Price: $239.77 | Day: +8.52% | 1W: +7.52% | 1M: +8.10% | RSI: 62.2 | vs MA200: +56.0% | Trend: Above MA20, MA50, MA200
Recent headlines (last 12h)
- NOW, WDAY, ADBE, CRM: Software Stocks On The Rebound As OpenAI Threat Weakens
LLY | Lilly(Eli) & Co | Healthcare | Price: $1208.12 | Day: +7.13% | 1W: +9.97% | 1M: +11.56% | RSI: 72.3 | vs MA200: +23.8% | Trend: Above MA20, MA50, MA200
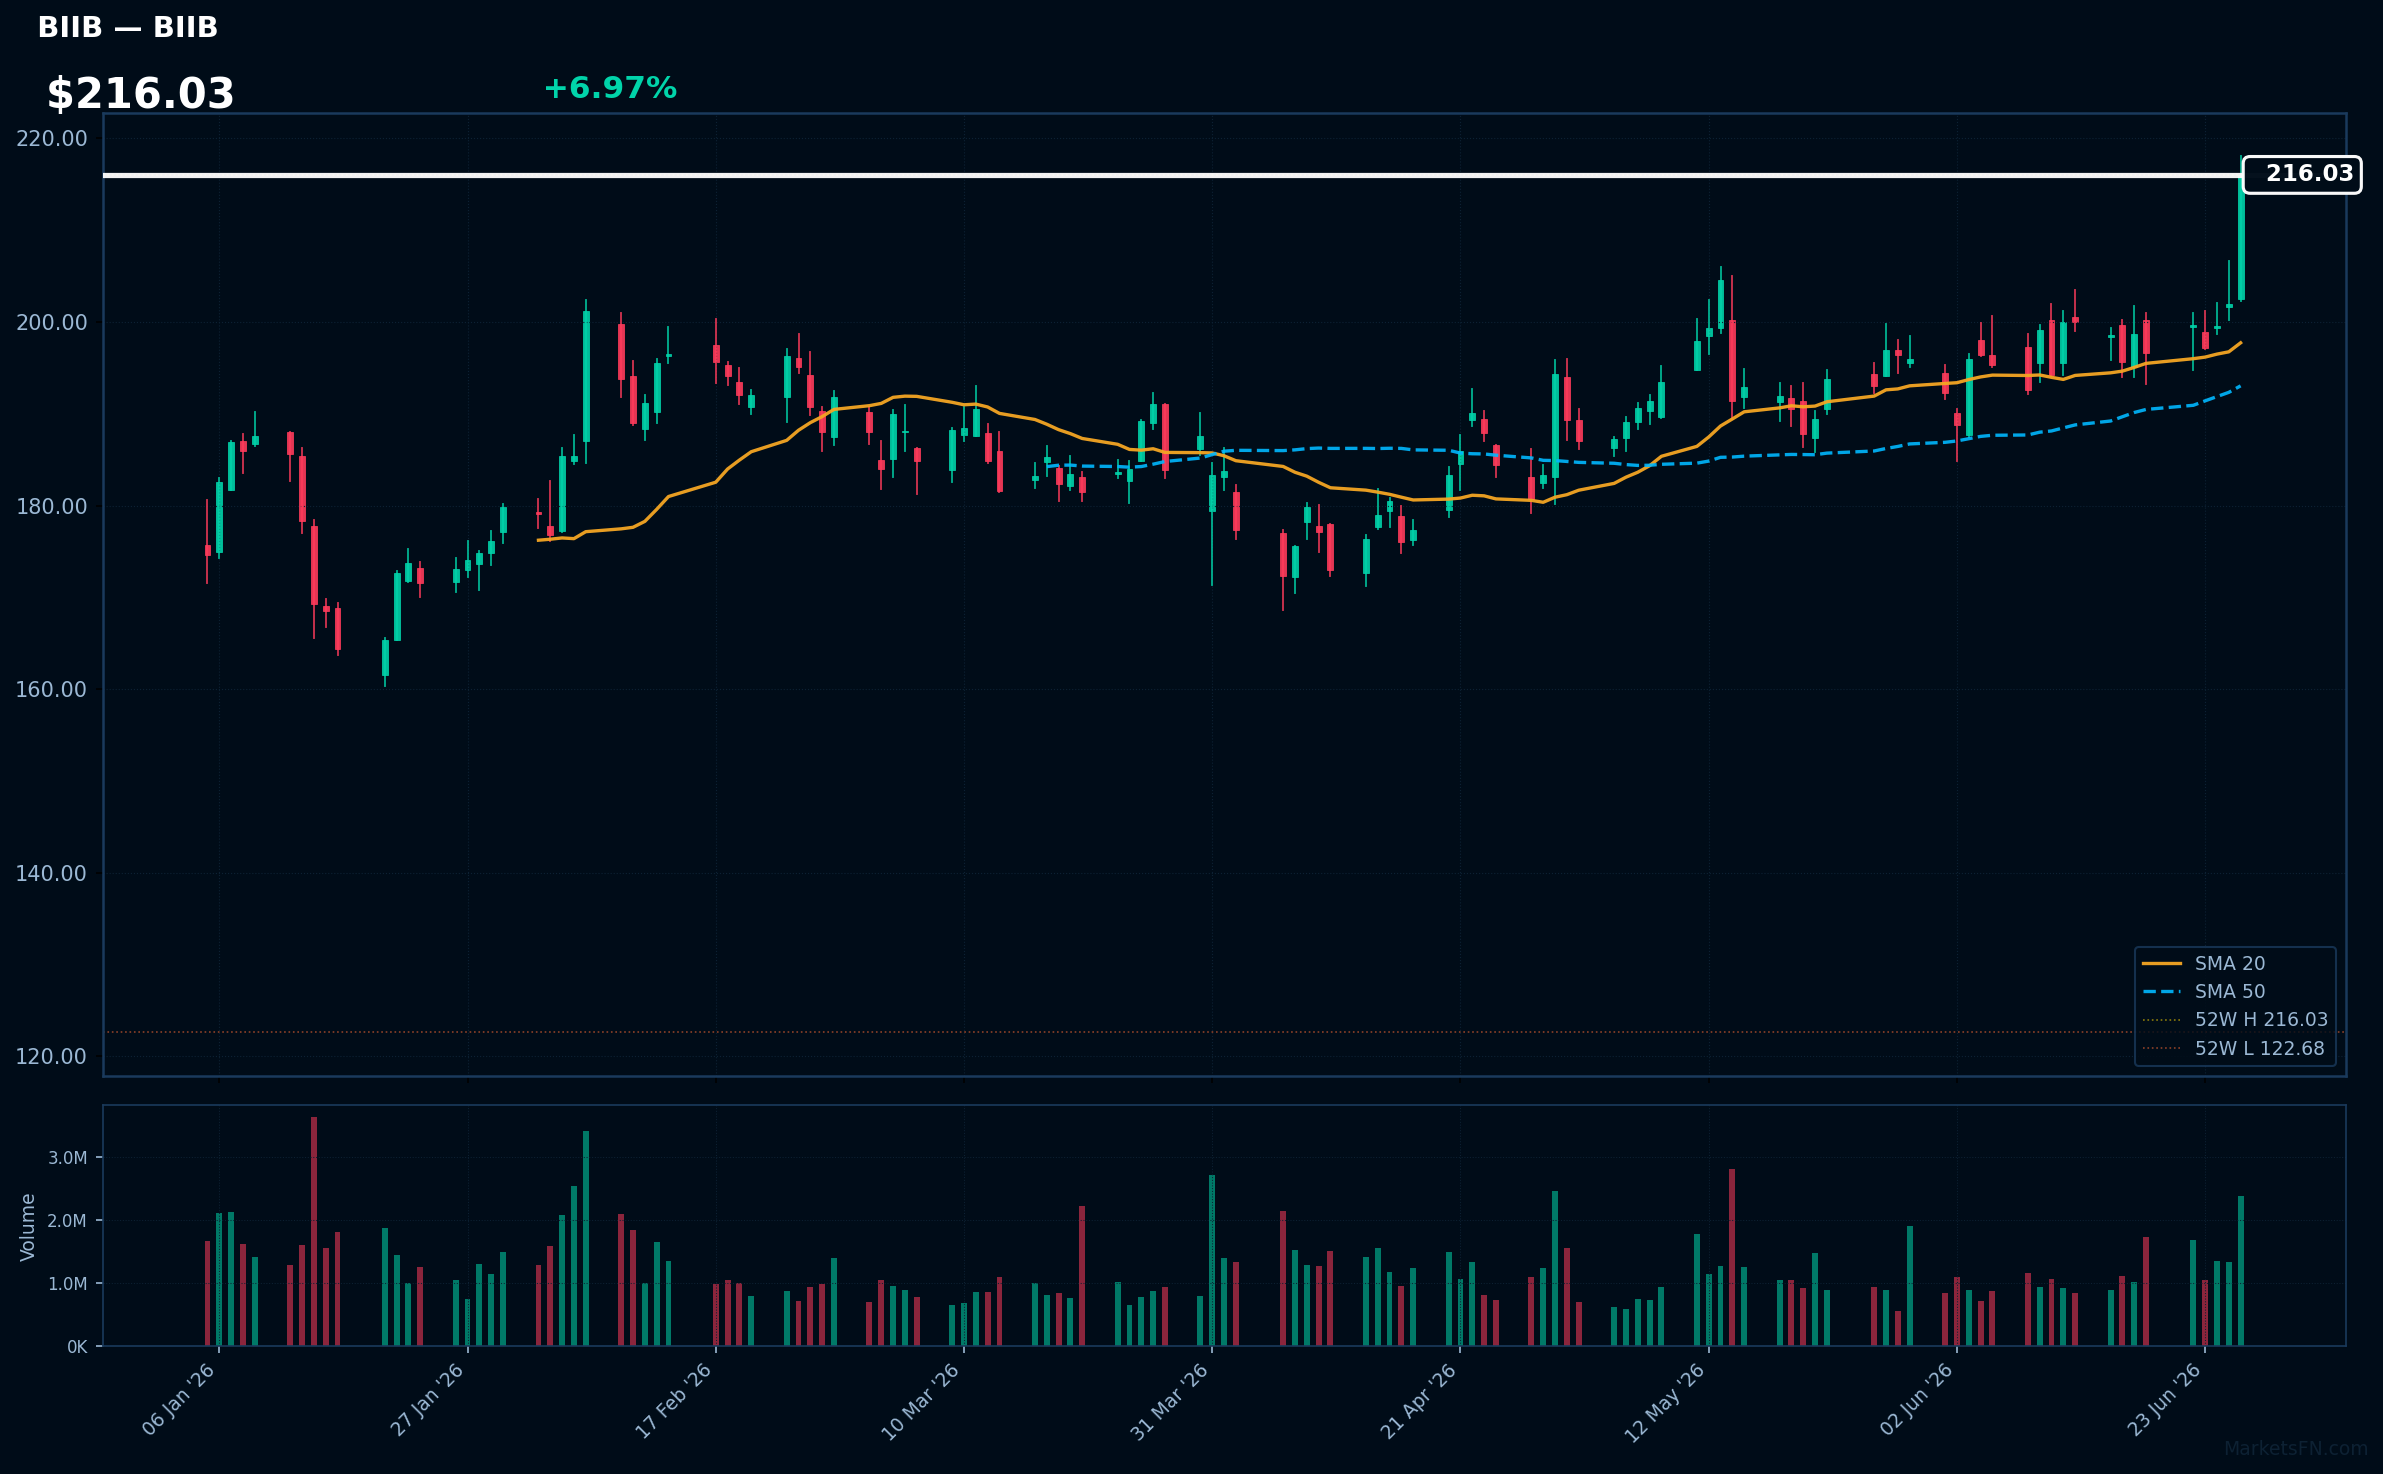
BIIB | Biogen Inc | Healthcare | Price: $216.03 | Day: +6.97% | 1W: +9.89% | 1M: +9.68% | RSI: 69.4 | vs MA200: +22.6% | Trend: Above MA20, MA50, MA200
Recent headlines (last 12h)
- Biogen trims Apellis pipeline and R&D team after $5.6bn takeover
- Biogen to Highlight Breadth of Alzheimer's Disease Portfolio at AAIC 2026, Including Phase 2 CELIA Data for Diranersen
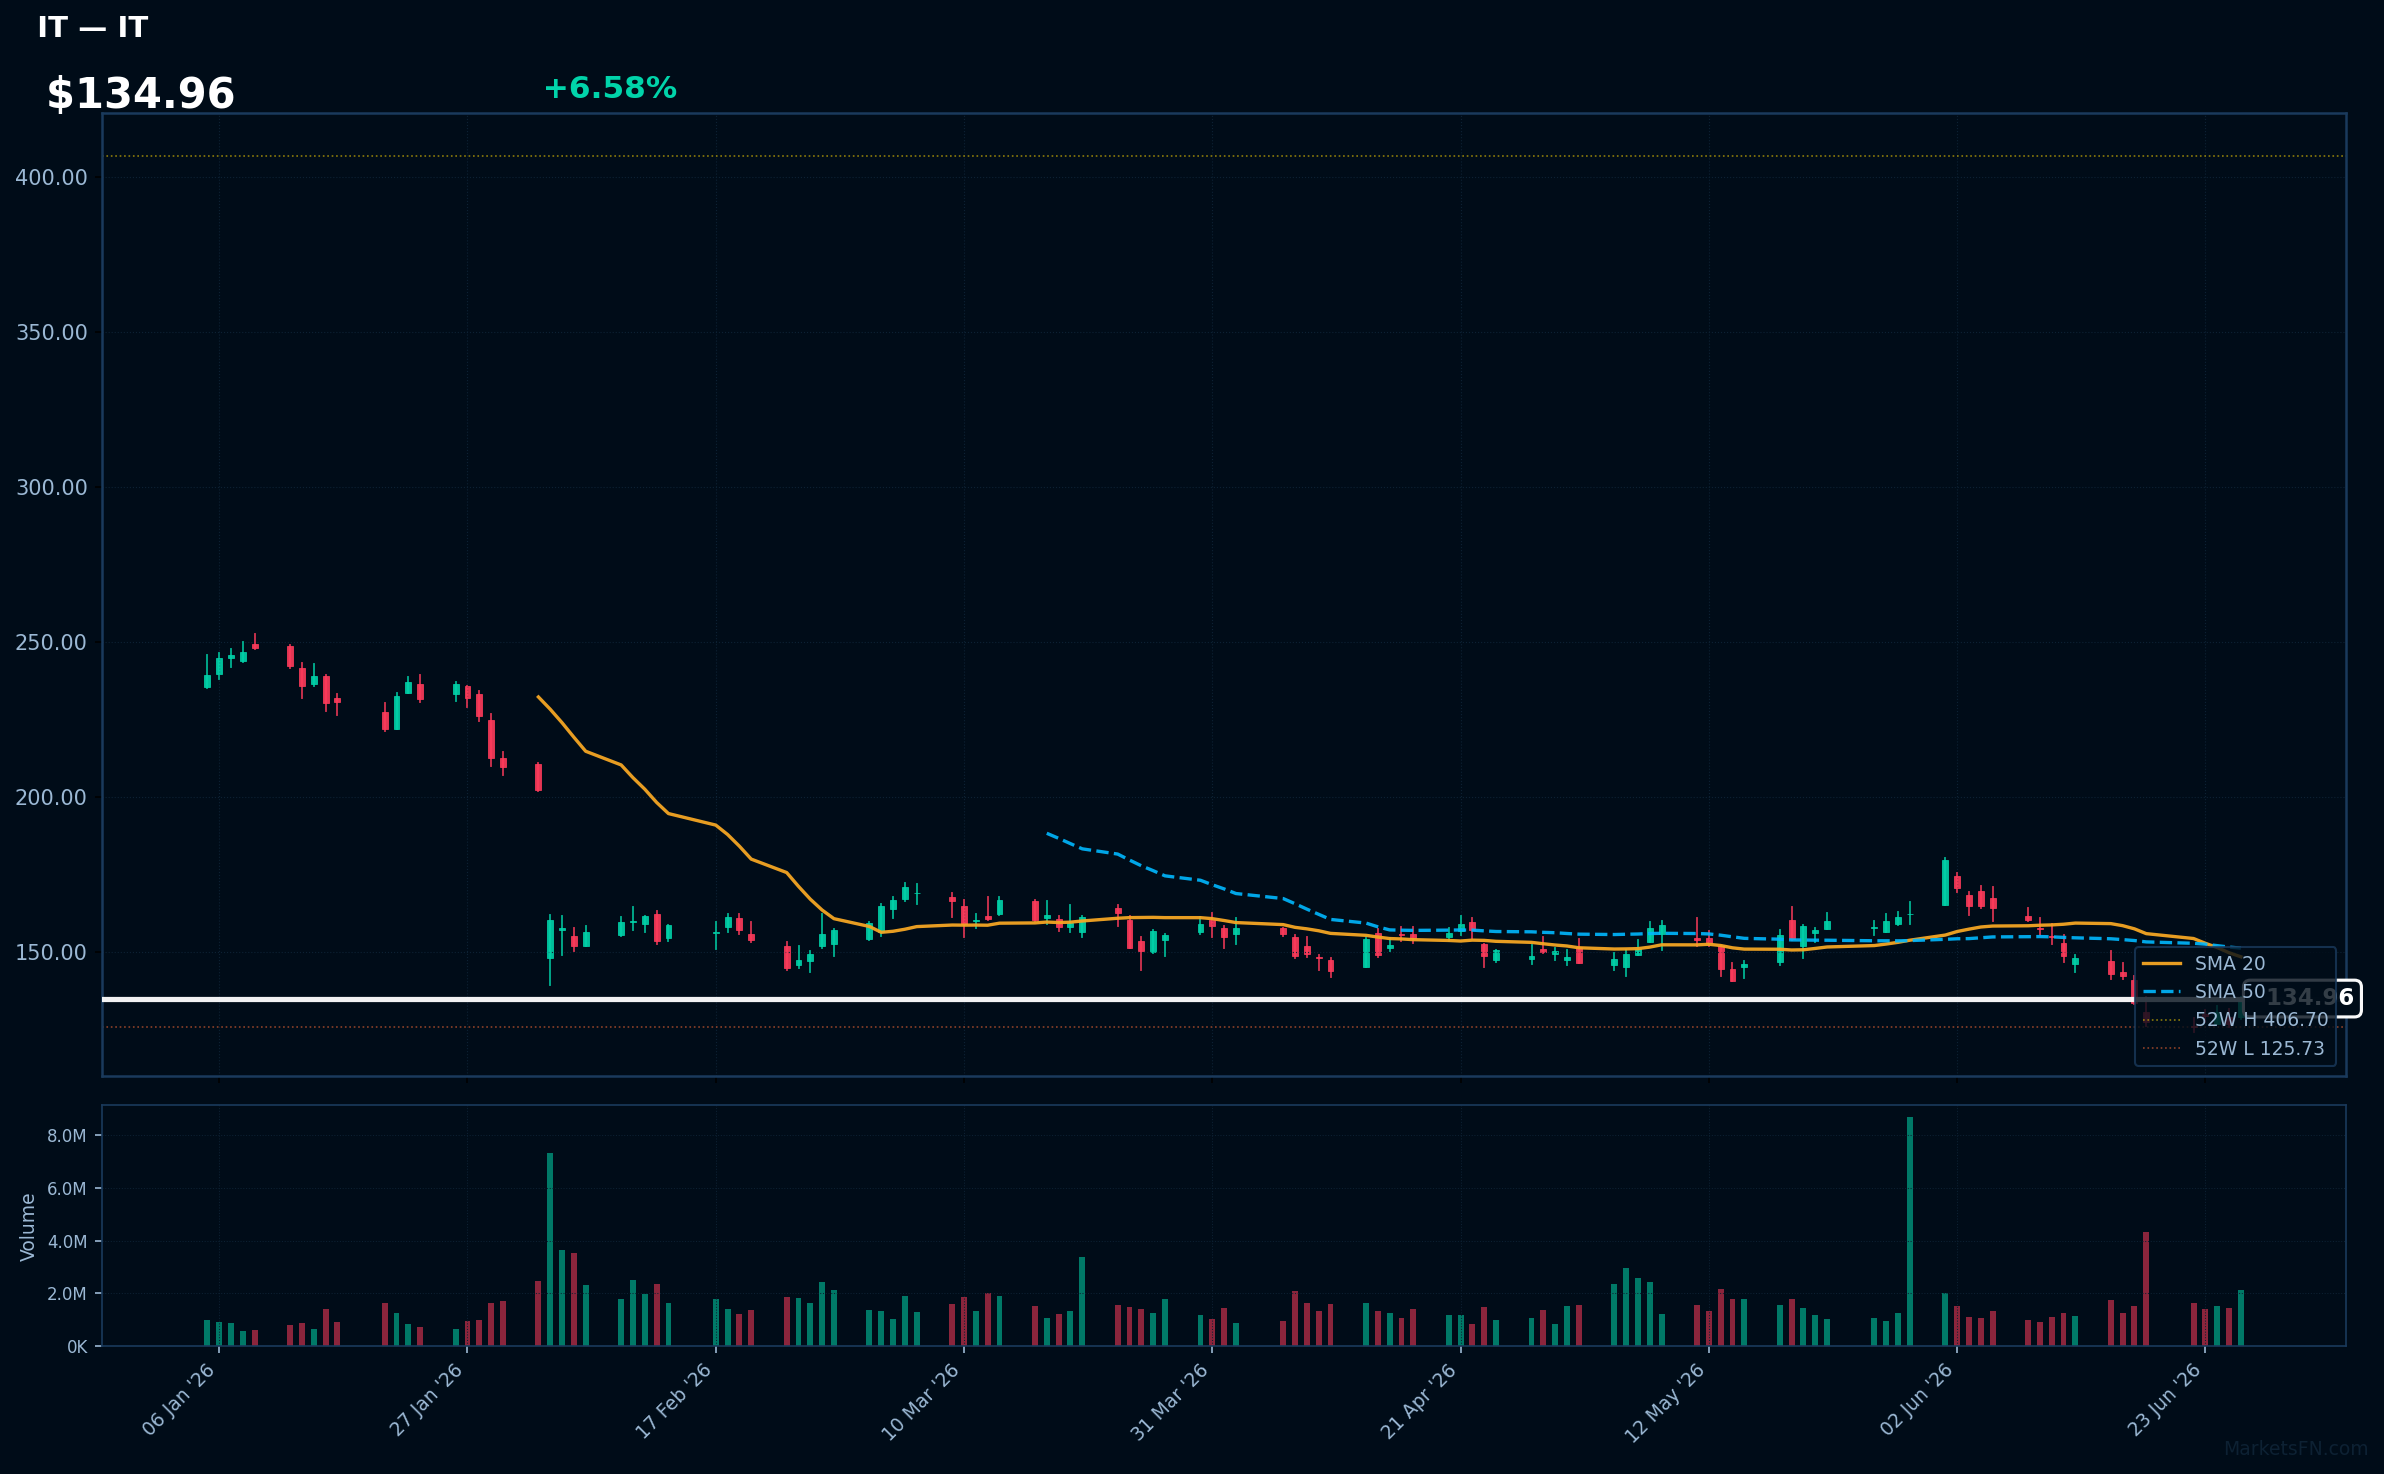
IT | Gartner, Inc | Technology | Price: $134.96 | Day: +6.58% | 1W: +5.86% | 1M: -15.63% | RSI: 40.4 | vs MA200: -31.7% | Trend: Below MA20, MA50, MA200
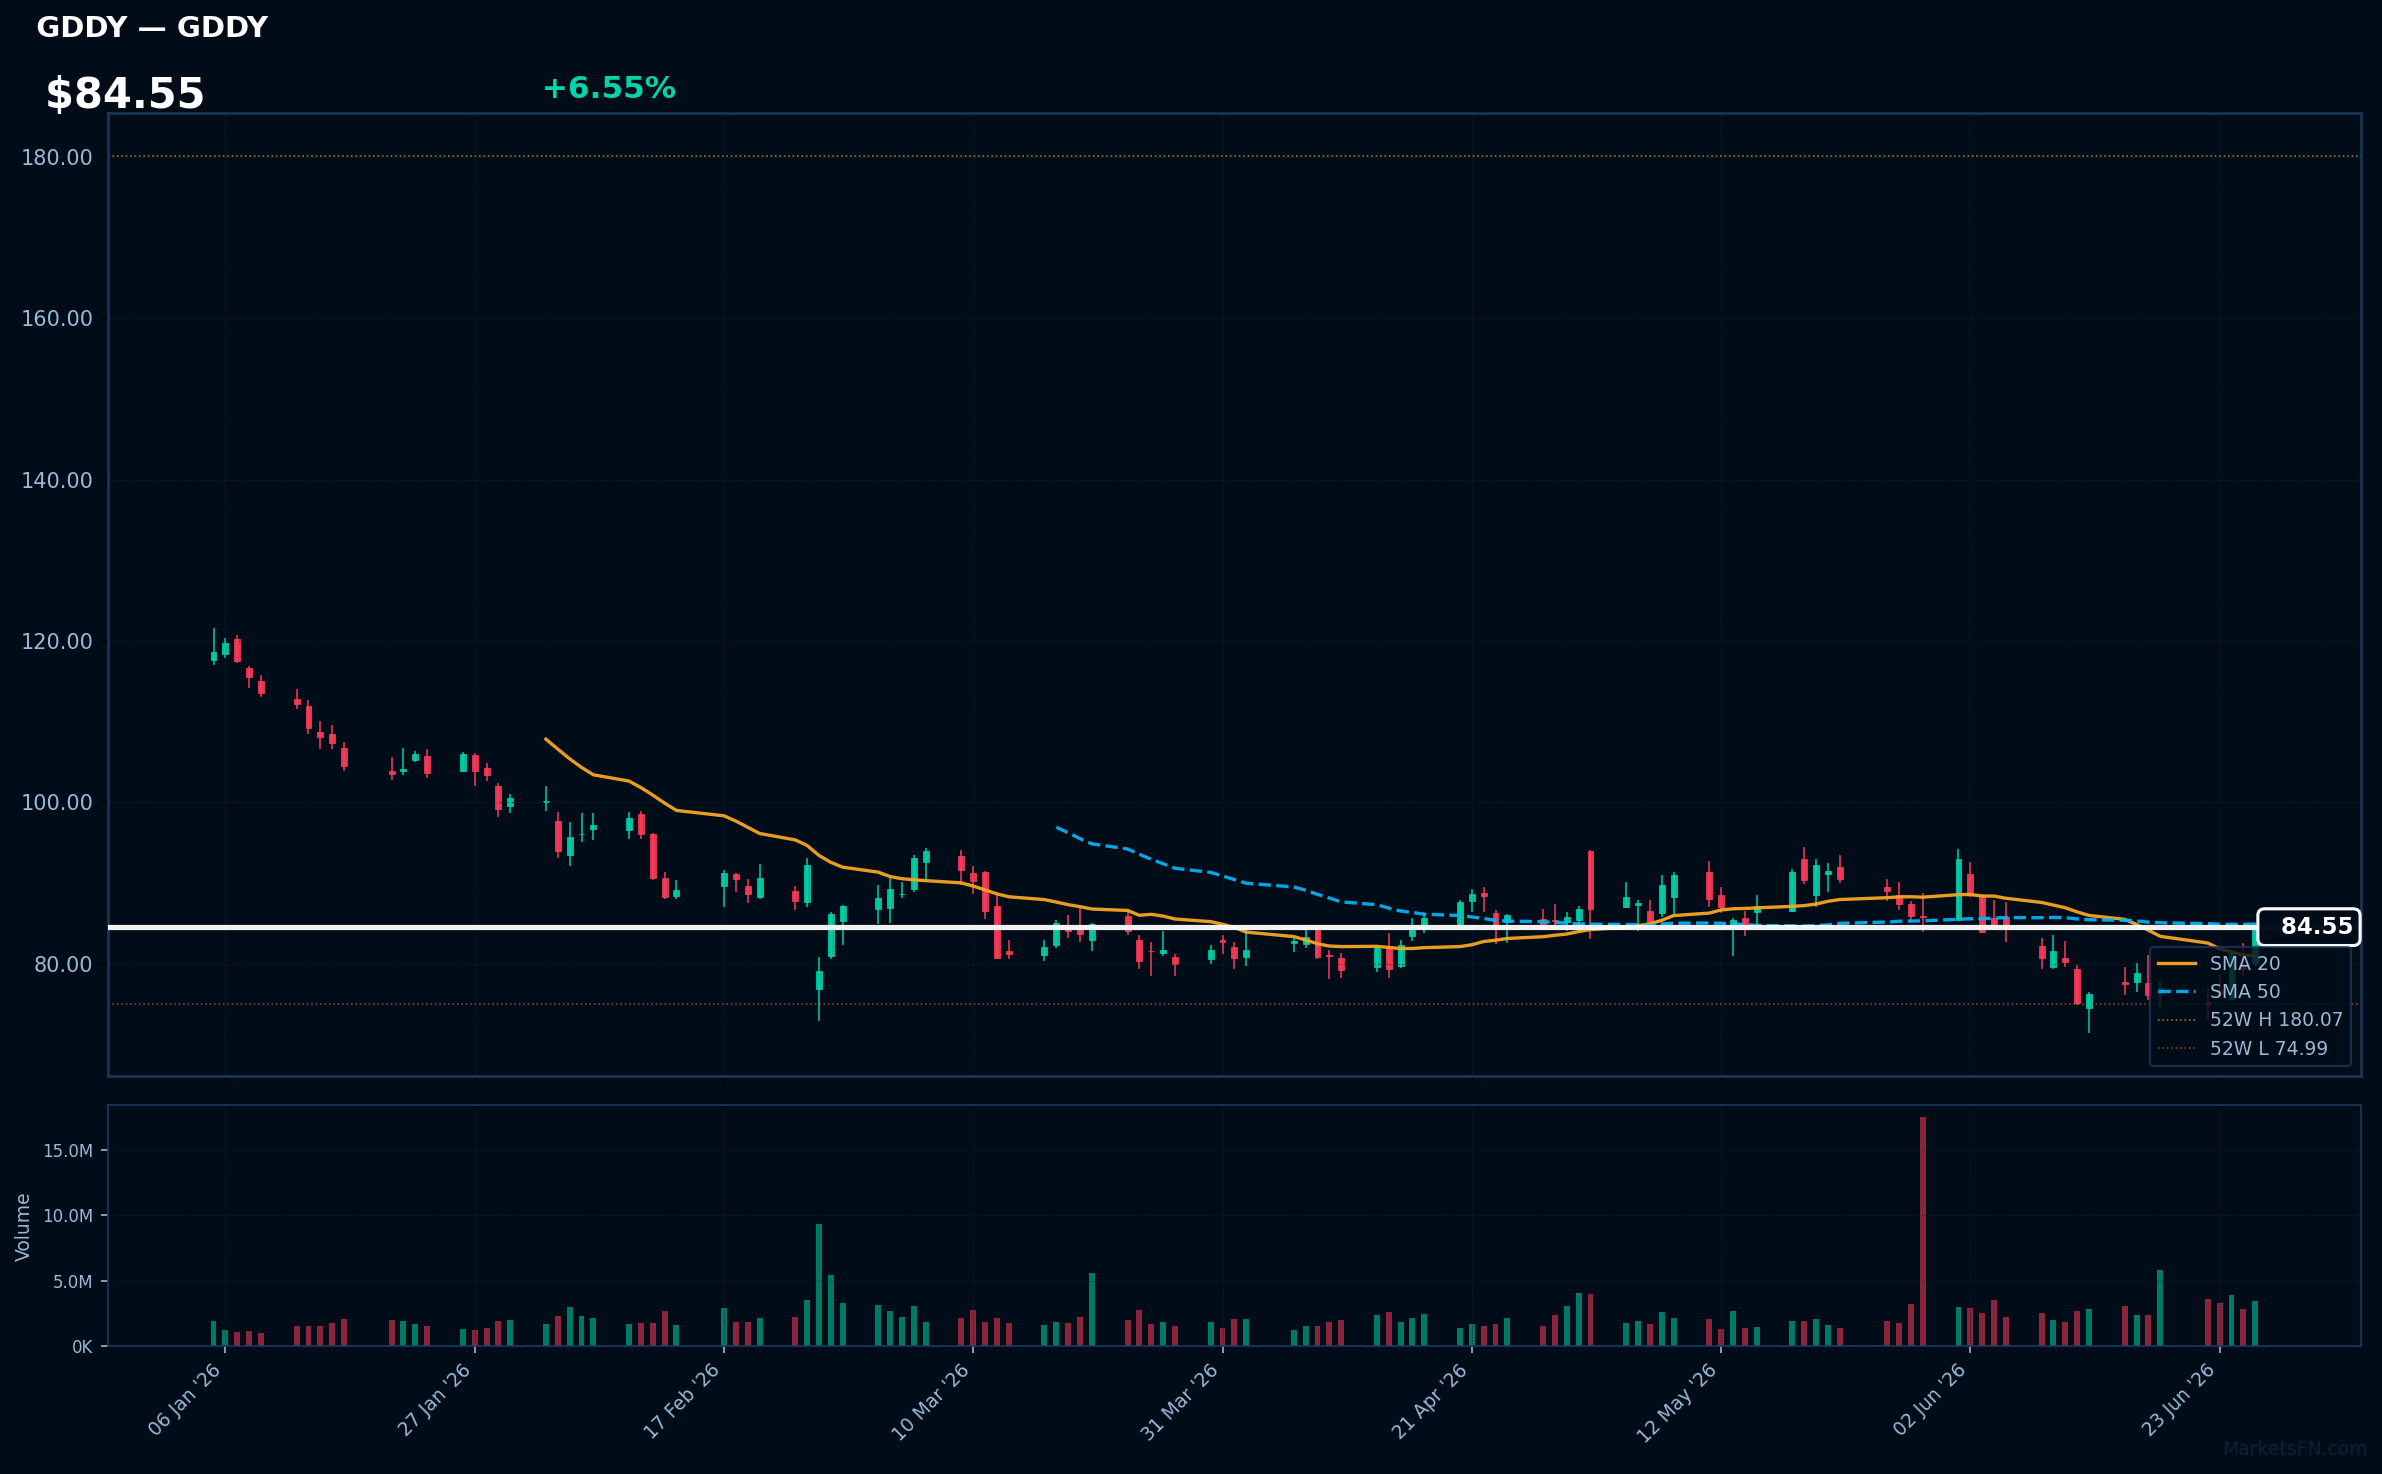
GDDY | Godaddy Inc | Technology | Price: $84.55 | Day: +6.55% | 1W: +9.75% | 1M: -3.23% | RSI: 54.5 | vs MA200: -20.6% | Trend: Above MA20 · Below MA50, MA200
MTCH | Match Group Inc | Communication Services | Price: $37.17 | Day: +6.38% | 1W: +4.85% | 1M: +2.96% | RSI: 61.3 | vs MA200: +11.3% | Trend: Above MA20, MA50, MA200
Top 10 Losers
Today's weakest S&P 500 performers. Sector drag: Technology (10).
| Ticker | Company | Sector | Price | Day % | 1W % | 1M % | RSI | vs MA200 | Trend |
|---|---|---|---|---|---|---|---|---|---|
| NXPI | NXP Semiconductors NV | Technology | $277.02 | -7.24% | -11.57% | -15.86% | 41.7 | +17.6% | Above MA200 · Below MA20, MA50 |
| ADI | Analog Devices Inc | Technology | $386.91 | -7.42% | -10.94% | -7.19% | 42.6 | +22.9% | Above MA200 · Below MA20, MA50 |
| TER | Teradyne, Inc | Technology | $436.86 | -7.44% | -0.24% | +16.24% | 56.3 | +67.1% | Above MA20, MA50, MA200 |
| QCOM | Qualcomm, Inc | Technology | $189.39 | -7.57% | -16.24% | -18.86% | 42.5 | +12.8% | Above MA200 · Below MA20, MA50 |
| TXN | Texas Instruments Inc | Technology | $285.43 | -8.46% | -11.59% | -10.09% | 44.7 | +33.8% | Above MA200 · Below MA20, MA50 |
| MPWR | Monolithic Power System Inc | Technology | $1313.32 | -8.69% | -16.01% | -18.94% | 38.1 | +13.3% | Above MA200 · Below MA20, MA50 |
| KEYS | Keysight Technologies Inc | Technology | $328.66 | -8.72% | -9.63% | -5.46% | 42.8 | +30.9% | Above MA200 · Below MA20, MA50 |
| STX | Seagate Technology Holdings Plc | Technology | $899.90 | -12.24% | -15.92% | +3.36% | 48.3 | +103.4% | Above MA50, MA200 · Below MA20 |
| WDC | Western Digital Corp | Technology | $586.45 | -13.17% | -21.41% | +10.53% | 50.1 | +109.2% | Above MA50, MA200 · Below MA20 |
| ON | ON Semiconductor Corp | Technology | $90.65 | -23.66% | -25.46% | -27.42% | 37.2 | +29.2% | Above MA200 · Below MA20, MA50 |
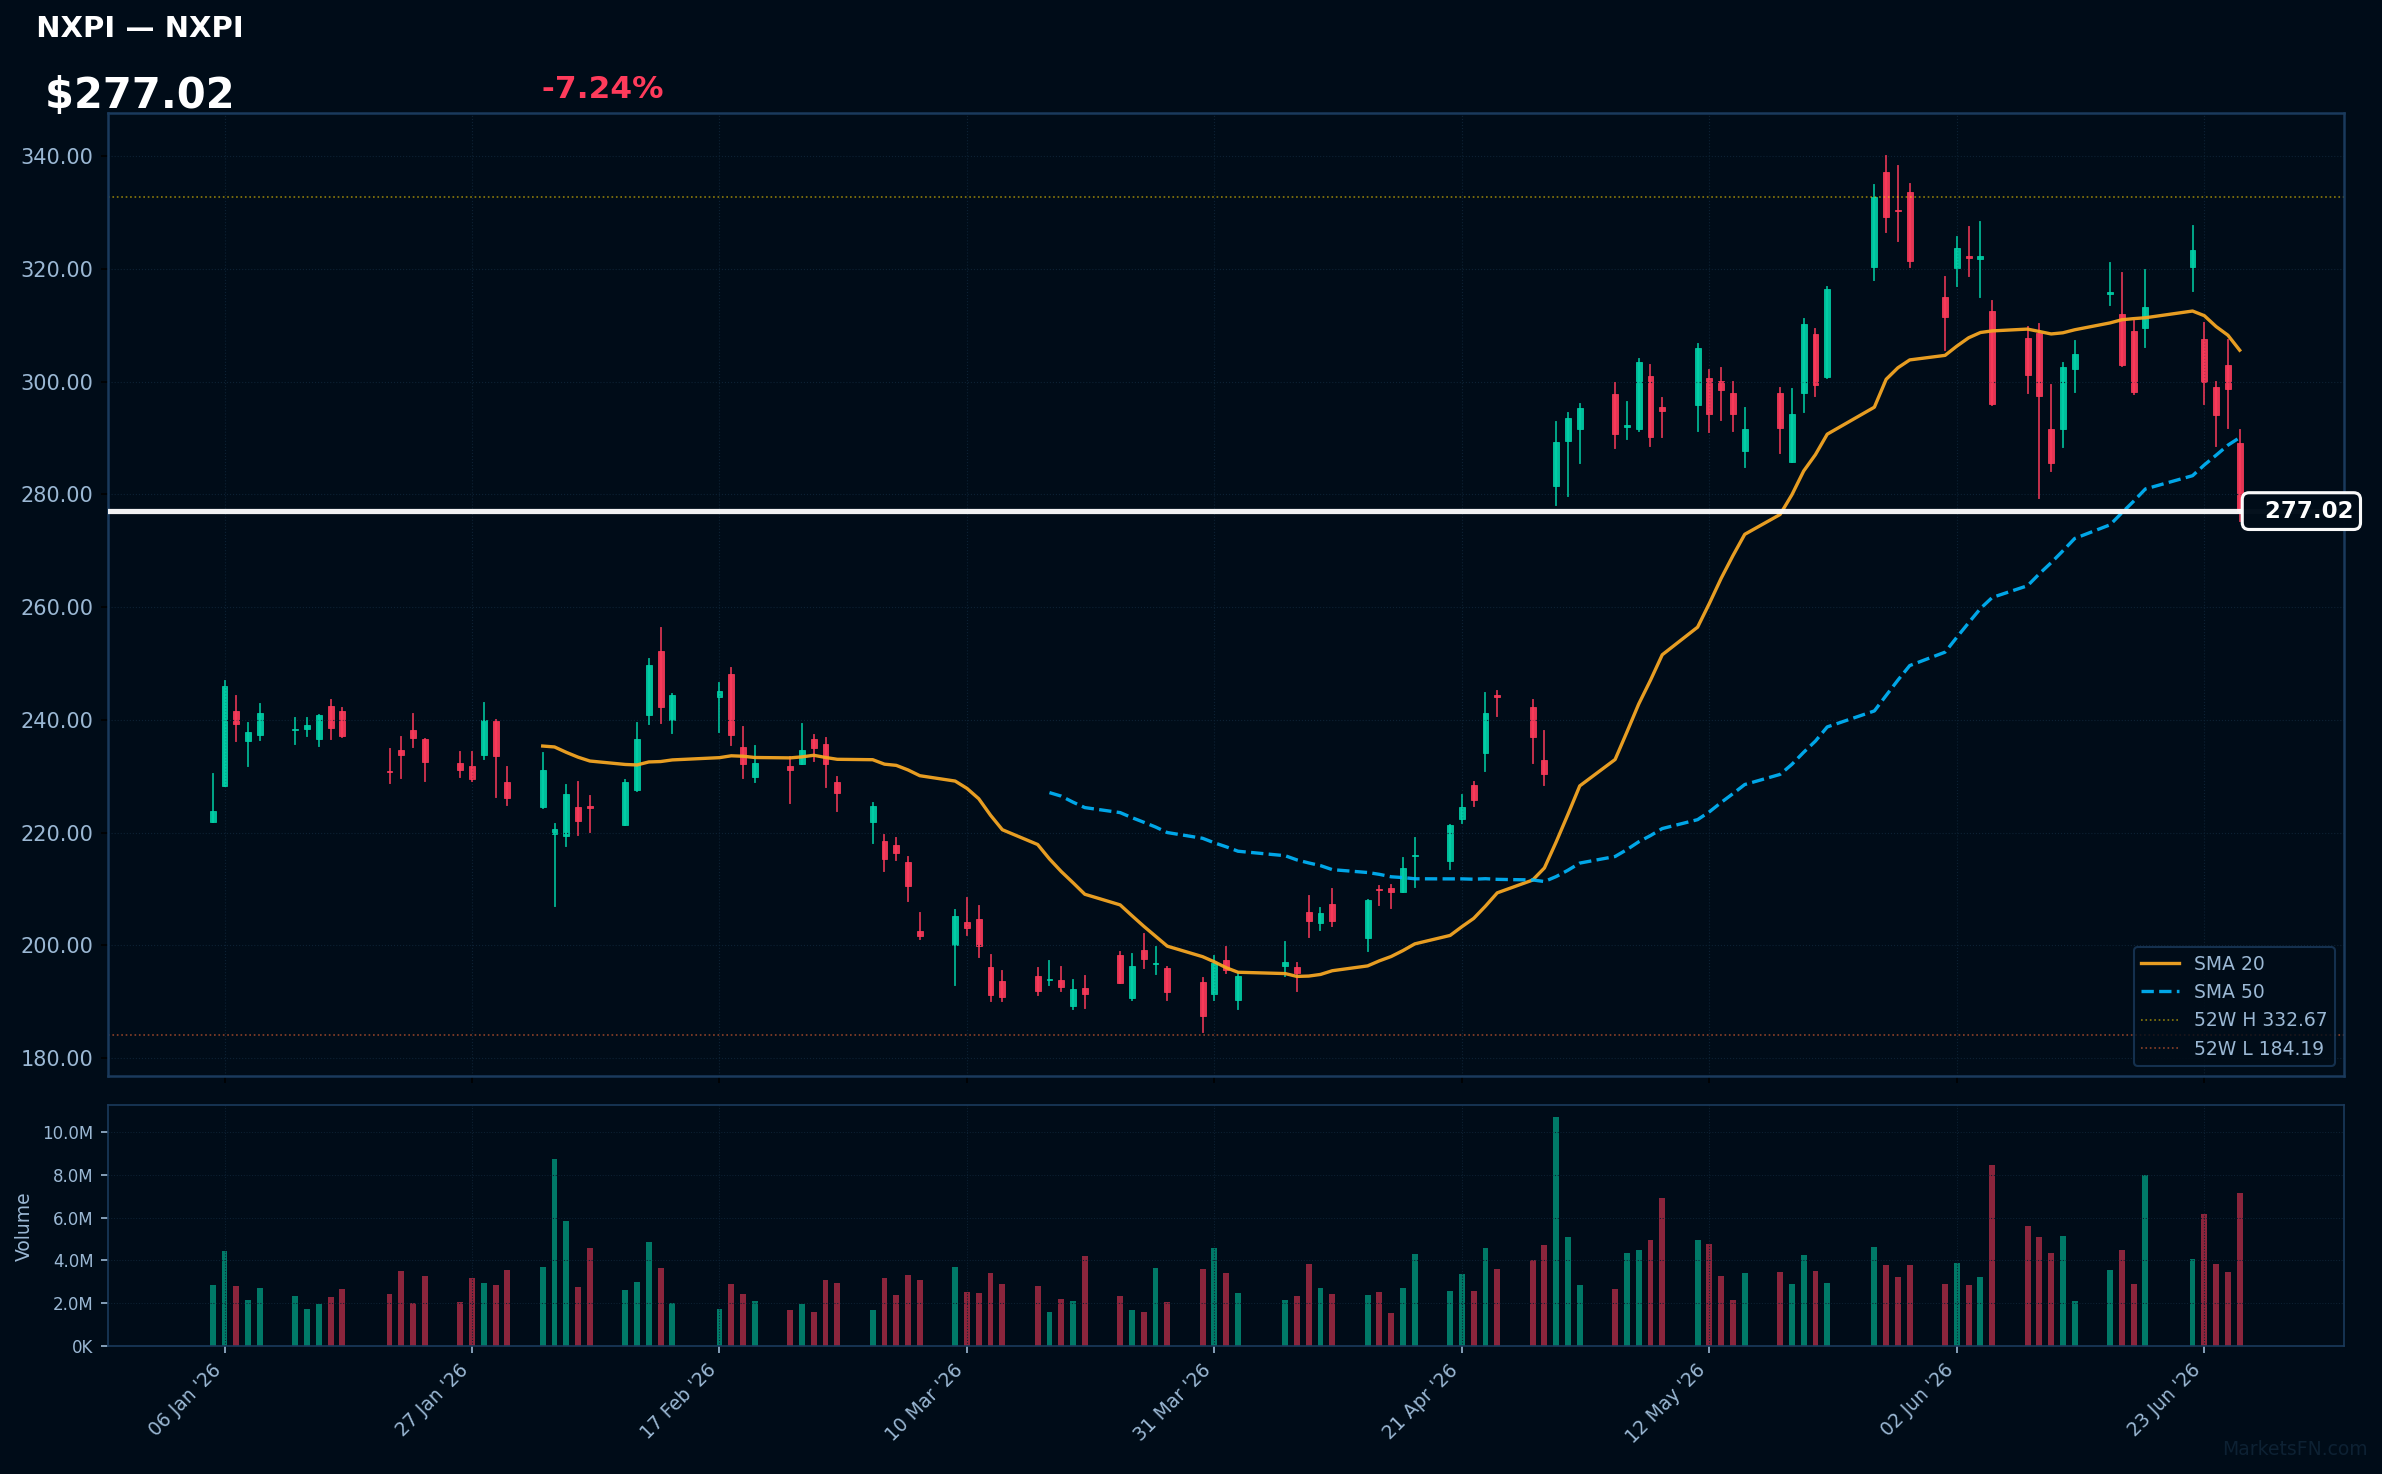
NXPI | NXP Semiconductors NV | Technology | Price: $277.02 | Day: -7.24% | 1W: -11.57% | 1M: -15.86% | RSI: 41.7 | vs MA200: +17.6% | Trend: Above MA200 · Below MA20, MA50
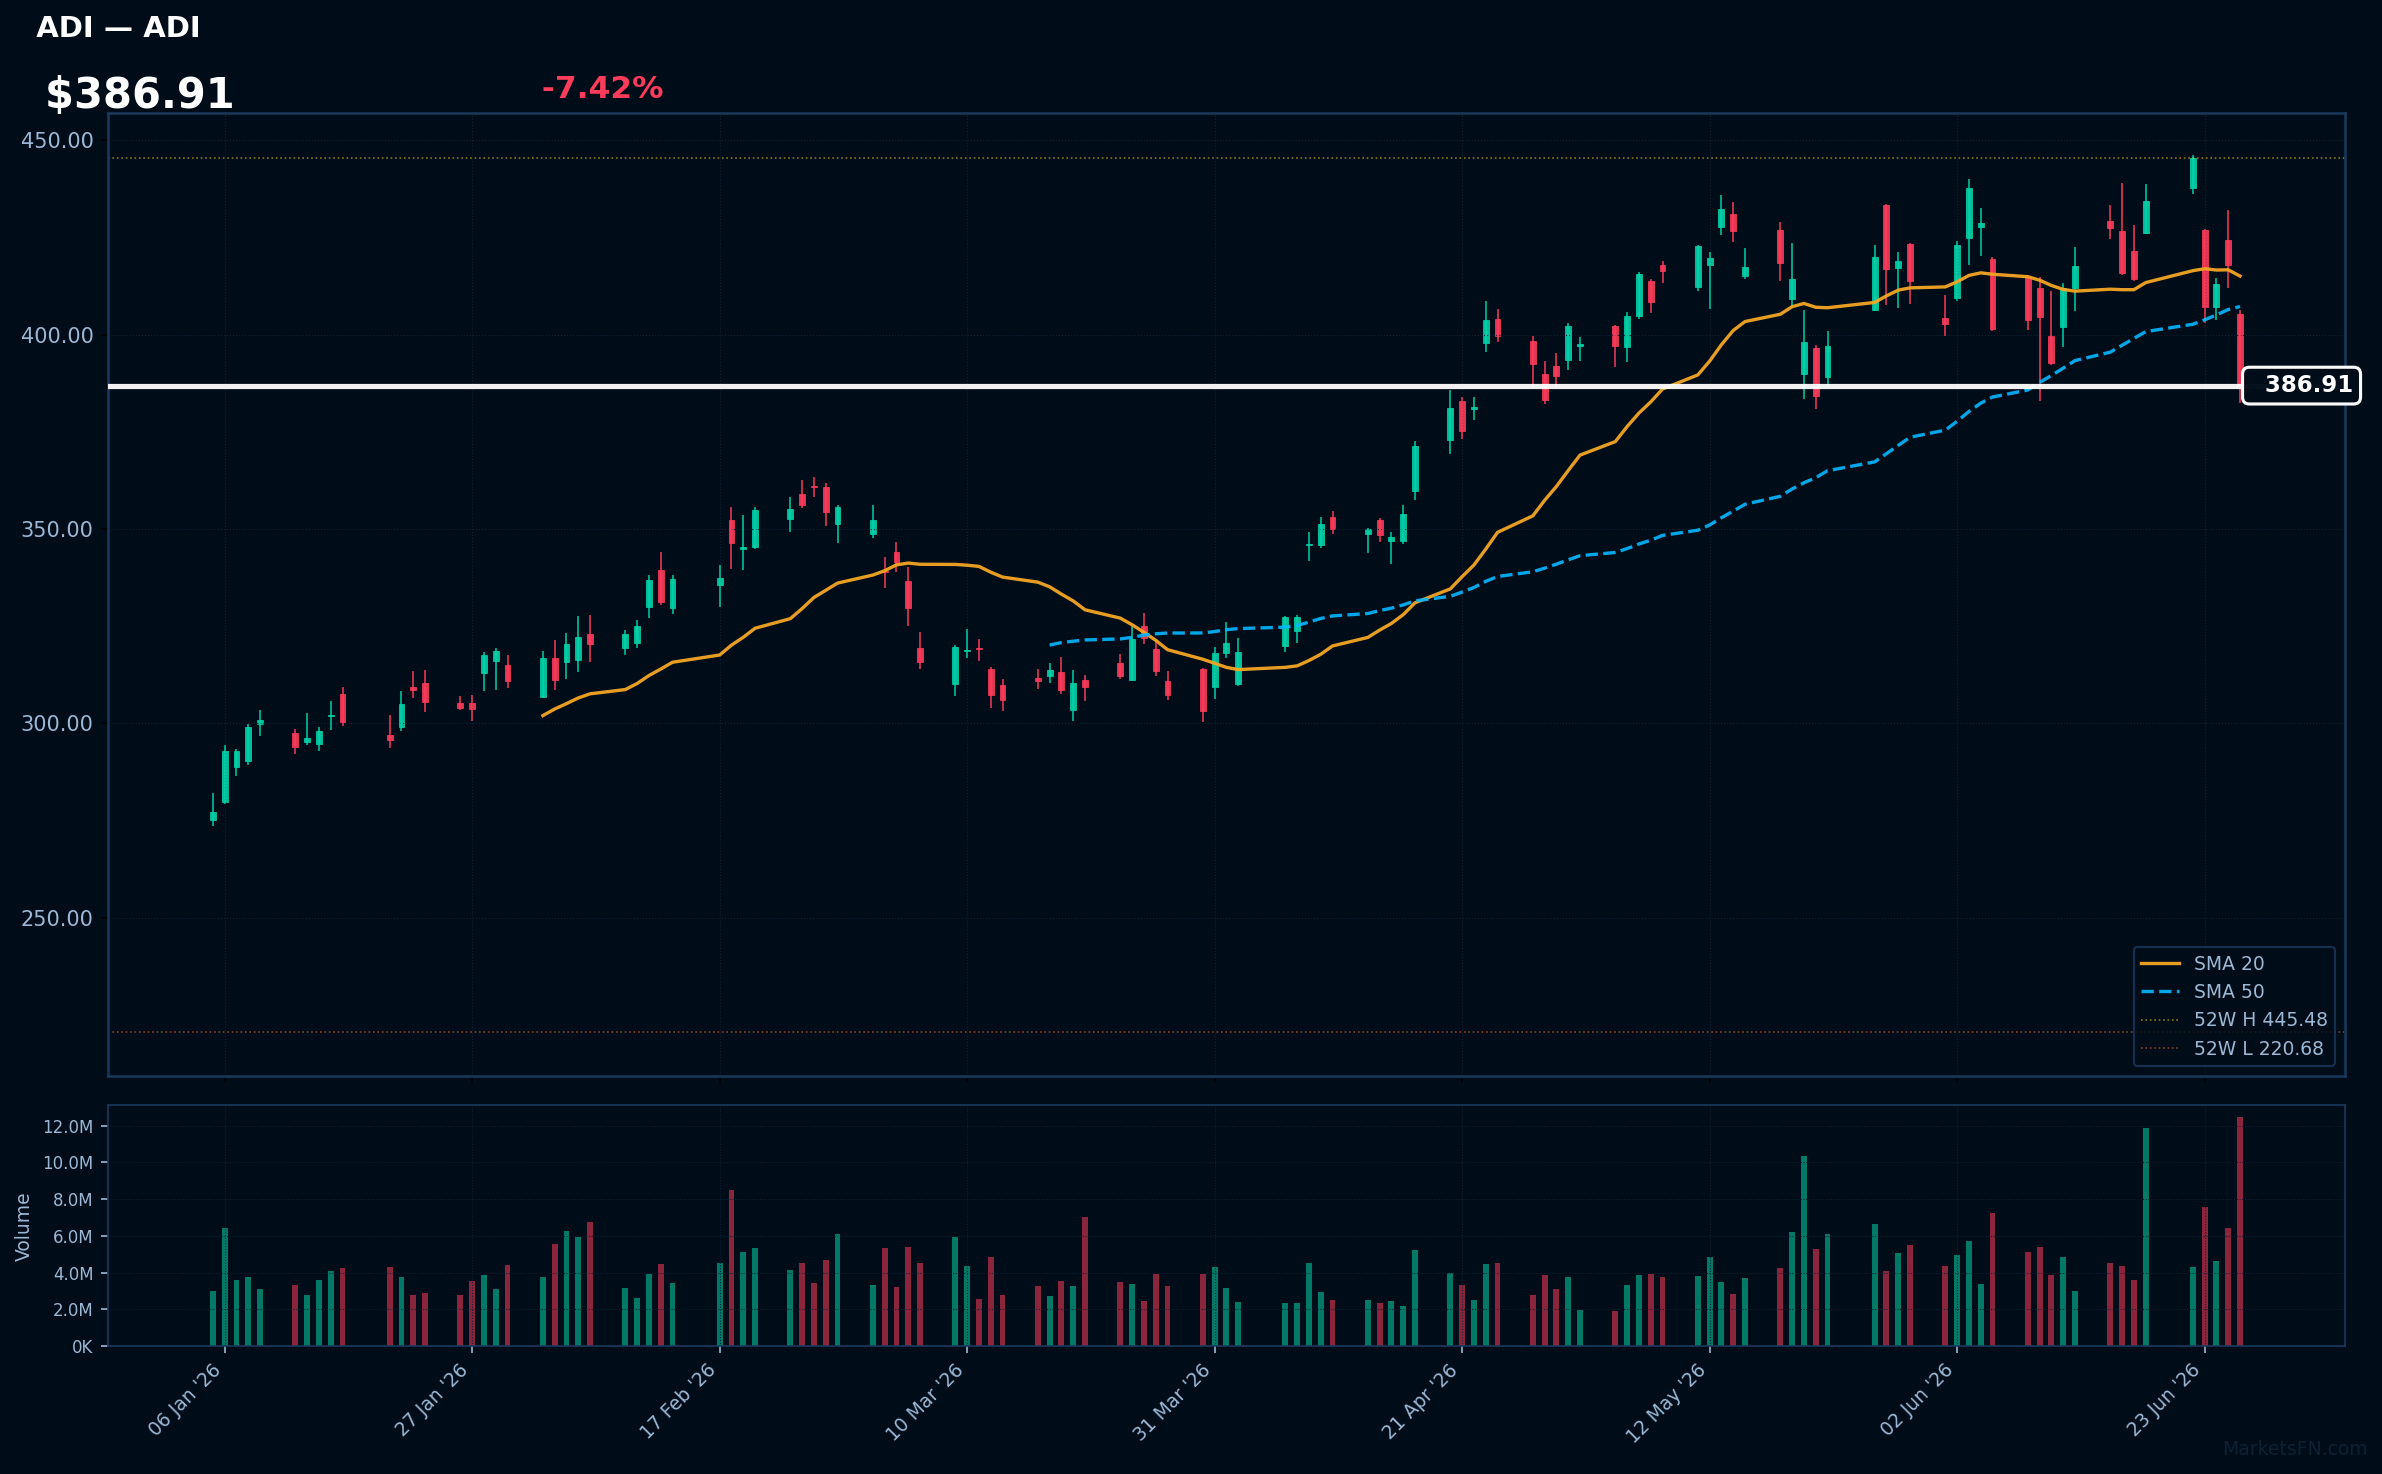
ADI | Analog Devices Inc | Technology | Price: $386.91 | Day: -7.42% | 1W: -10.94% | 1M: -7.19% | RSI: 42.6 | vs MA200: +22.9% | Trend: Above MA200 · Below MA20, MA50
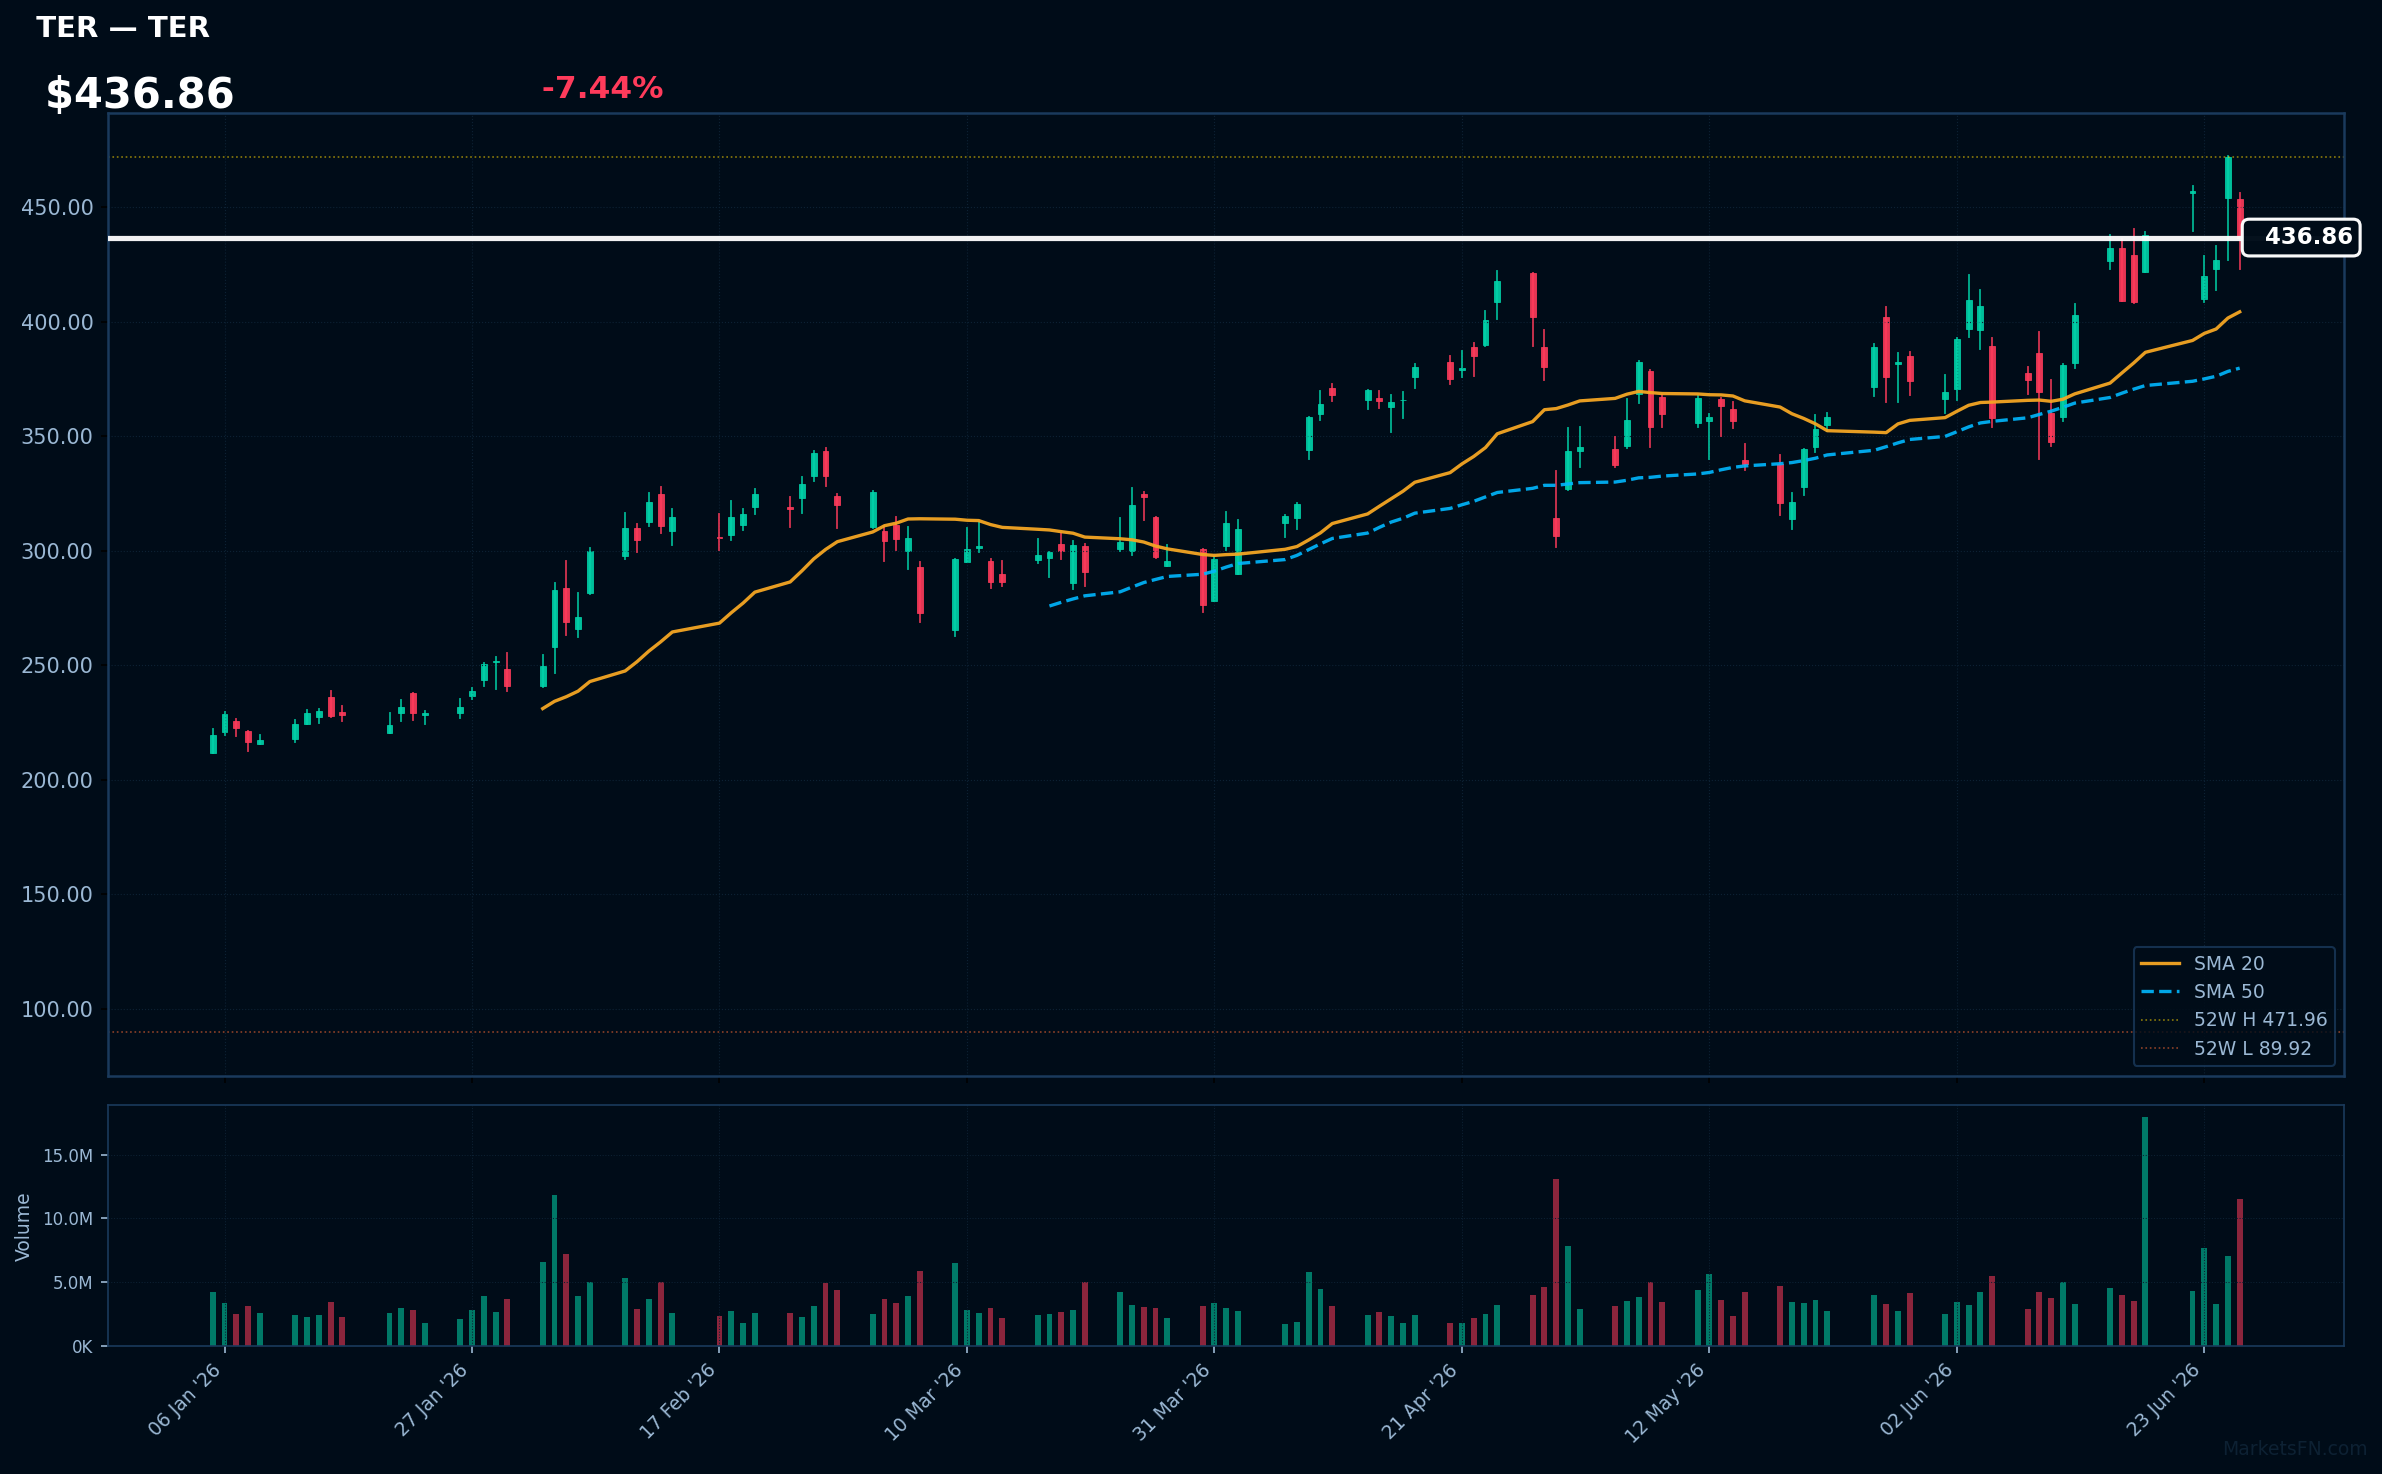
TER | Teradyne, Inc | Technology | Price: $436.86 | Day: -7.44% | 1W: -0.24% | 1M: +16.24% | RSI: 56.3 | vs MA200: +67.1% | Trend: Above MA20, MA50, MA200
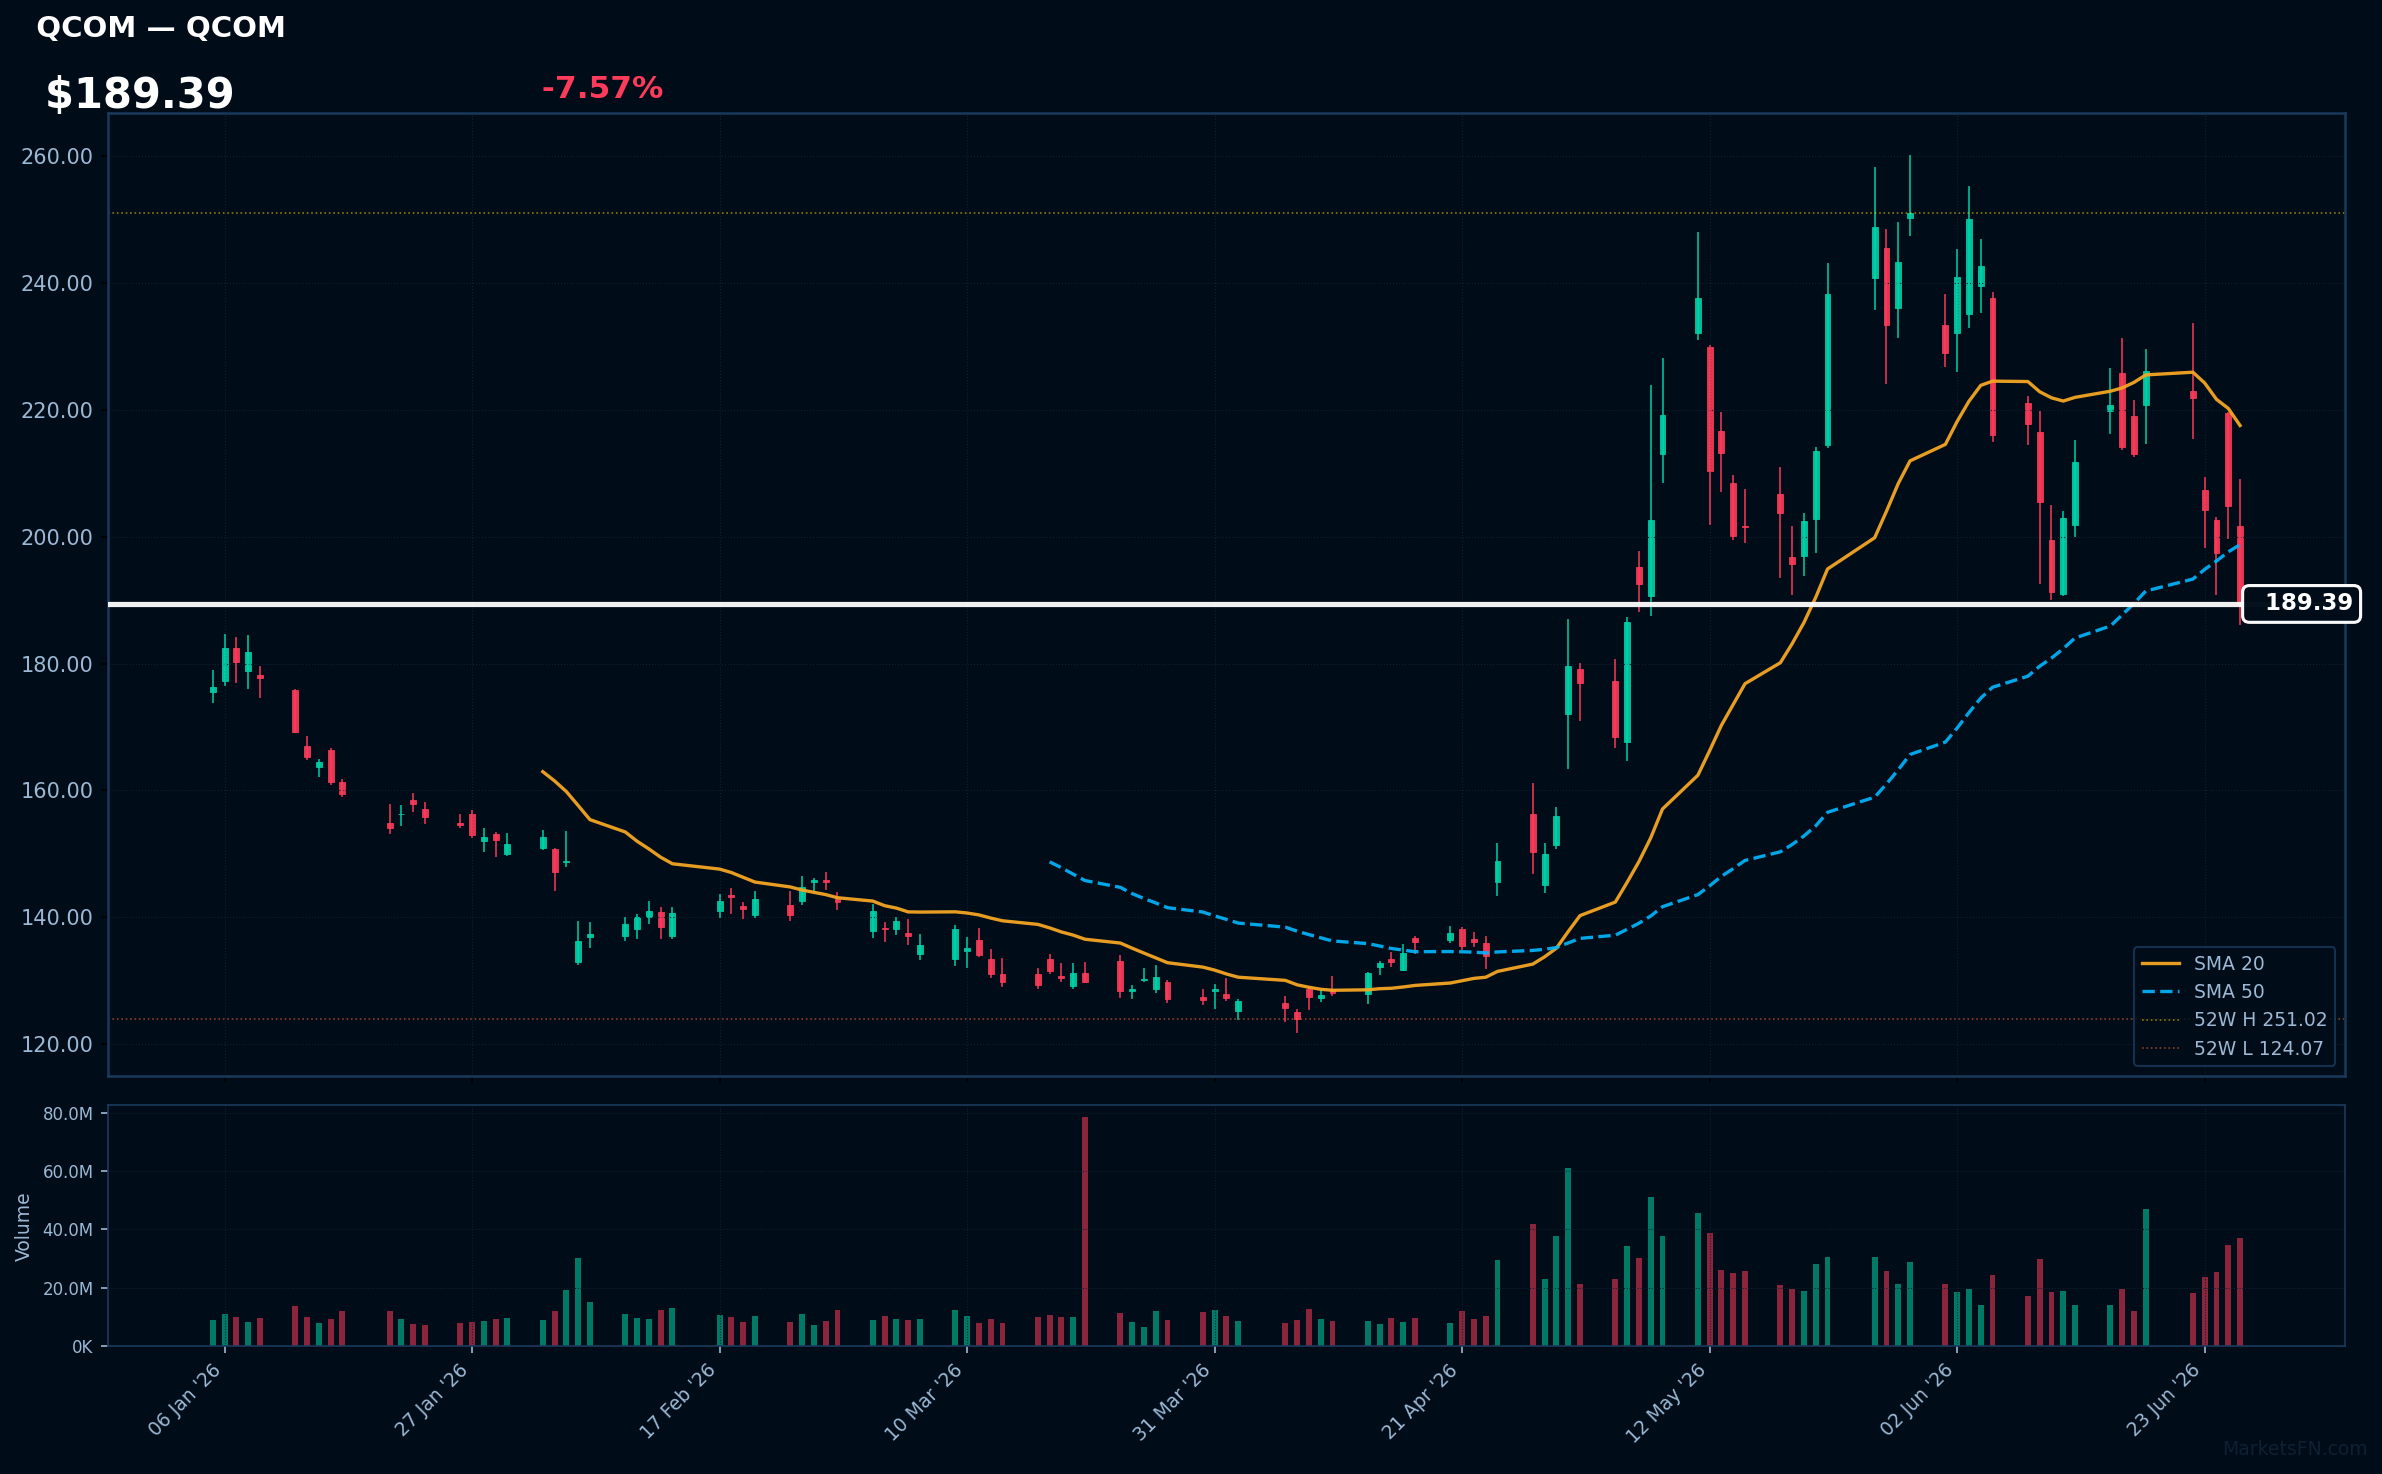
QCOM | Qualcomm, Inc | Technology | Price: $189.39 | Day: -7.57% | 1W: -16.24% | 1M: -18.86% | RSI: 42.5 | vs MA200: +12.8% | Trend: Above MA200 · Below MA20, MA50
Recent headlines (last 12h)
- Stock Market's Risk Appetite Is Shifting as AI, Iran, and Fed Fears Linger
- New leader board: Citi refreshes AI compute semiconductor picks
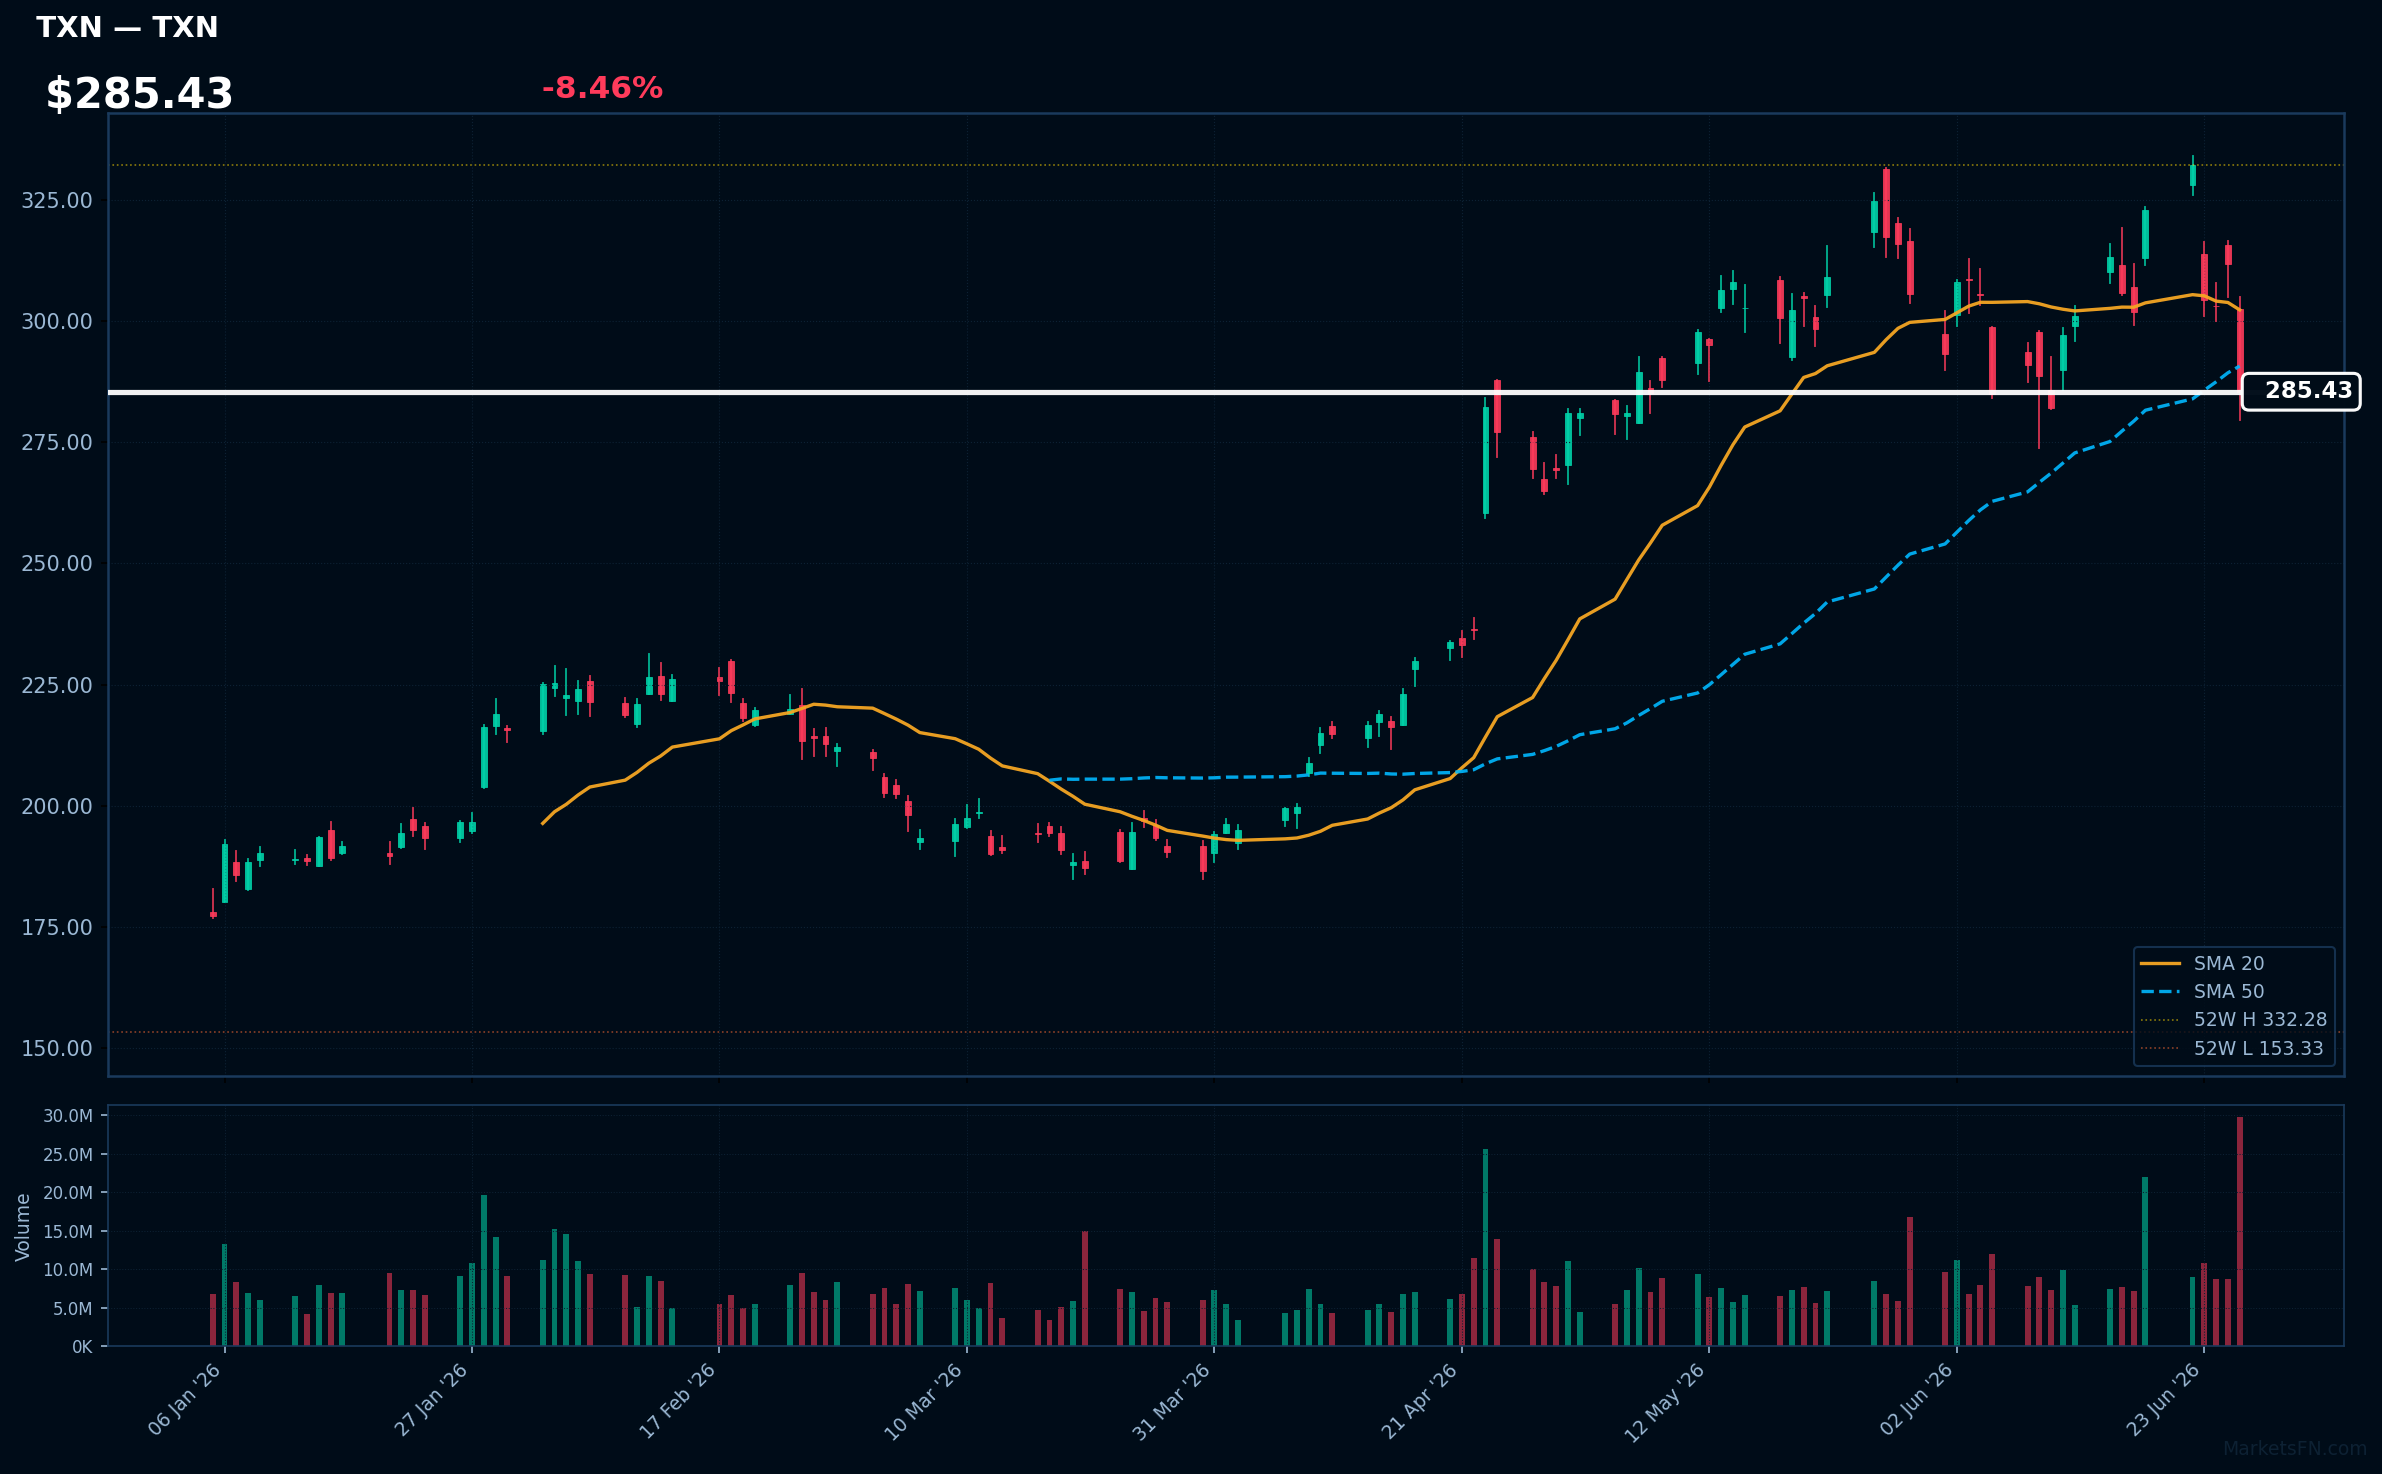
TXN | Texas Instruments Inc | Technology | Price: $285.43 | Day: -8.46% | 1W: -11.59% | 1M: -10.09% | RSI: 44.7 | vs MA200: +33.8% | Trend: Above MA200 · Below MA20, MA50
MPWR | Monolithic Power System Inc | Technology | Price: $1313.32 | Day: -8.69% | 1W: -16.01% | 1M: -18.94% | RSI: 38.1 | vs MA200: +13.3% | Trend: Above MA200 · Below MA20, MA50
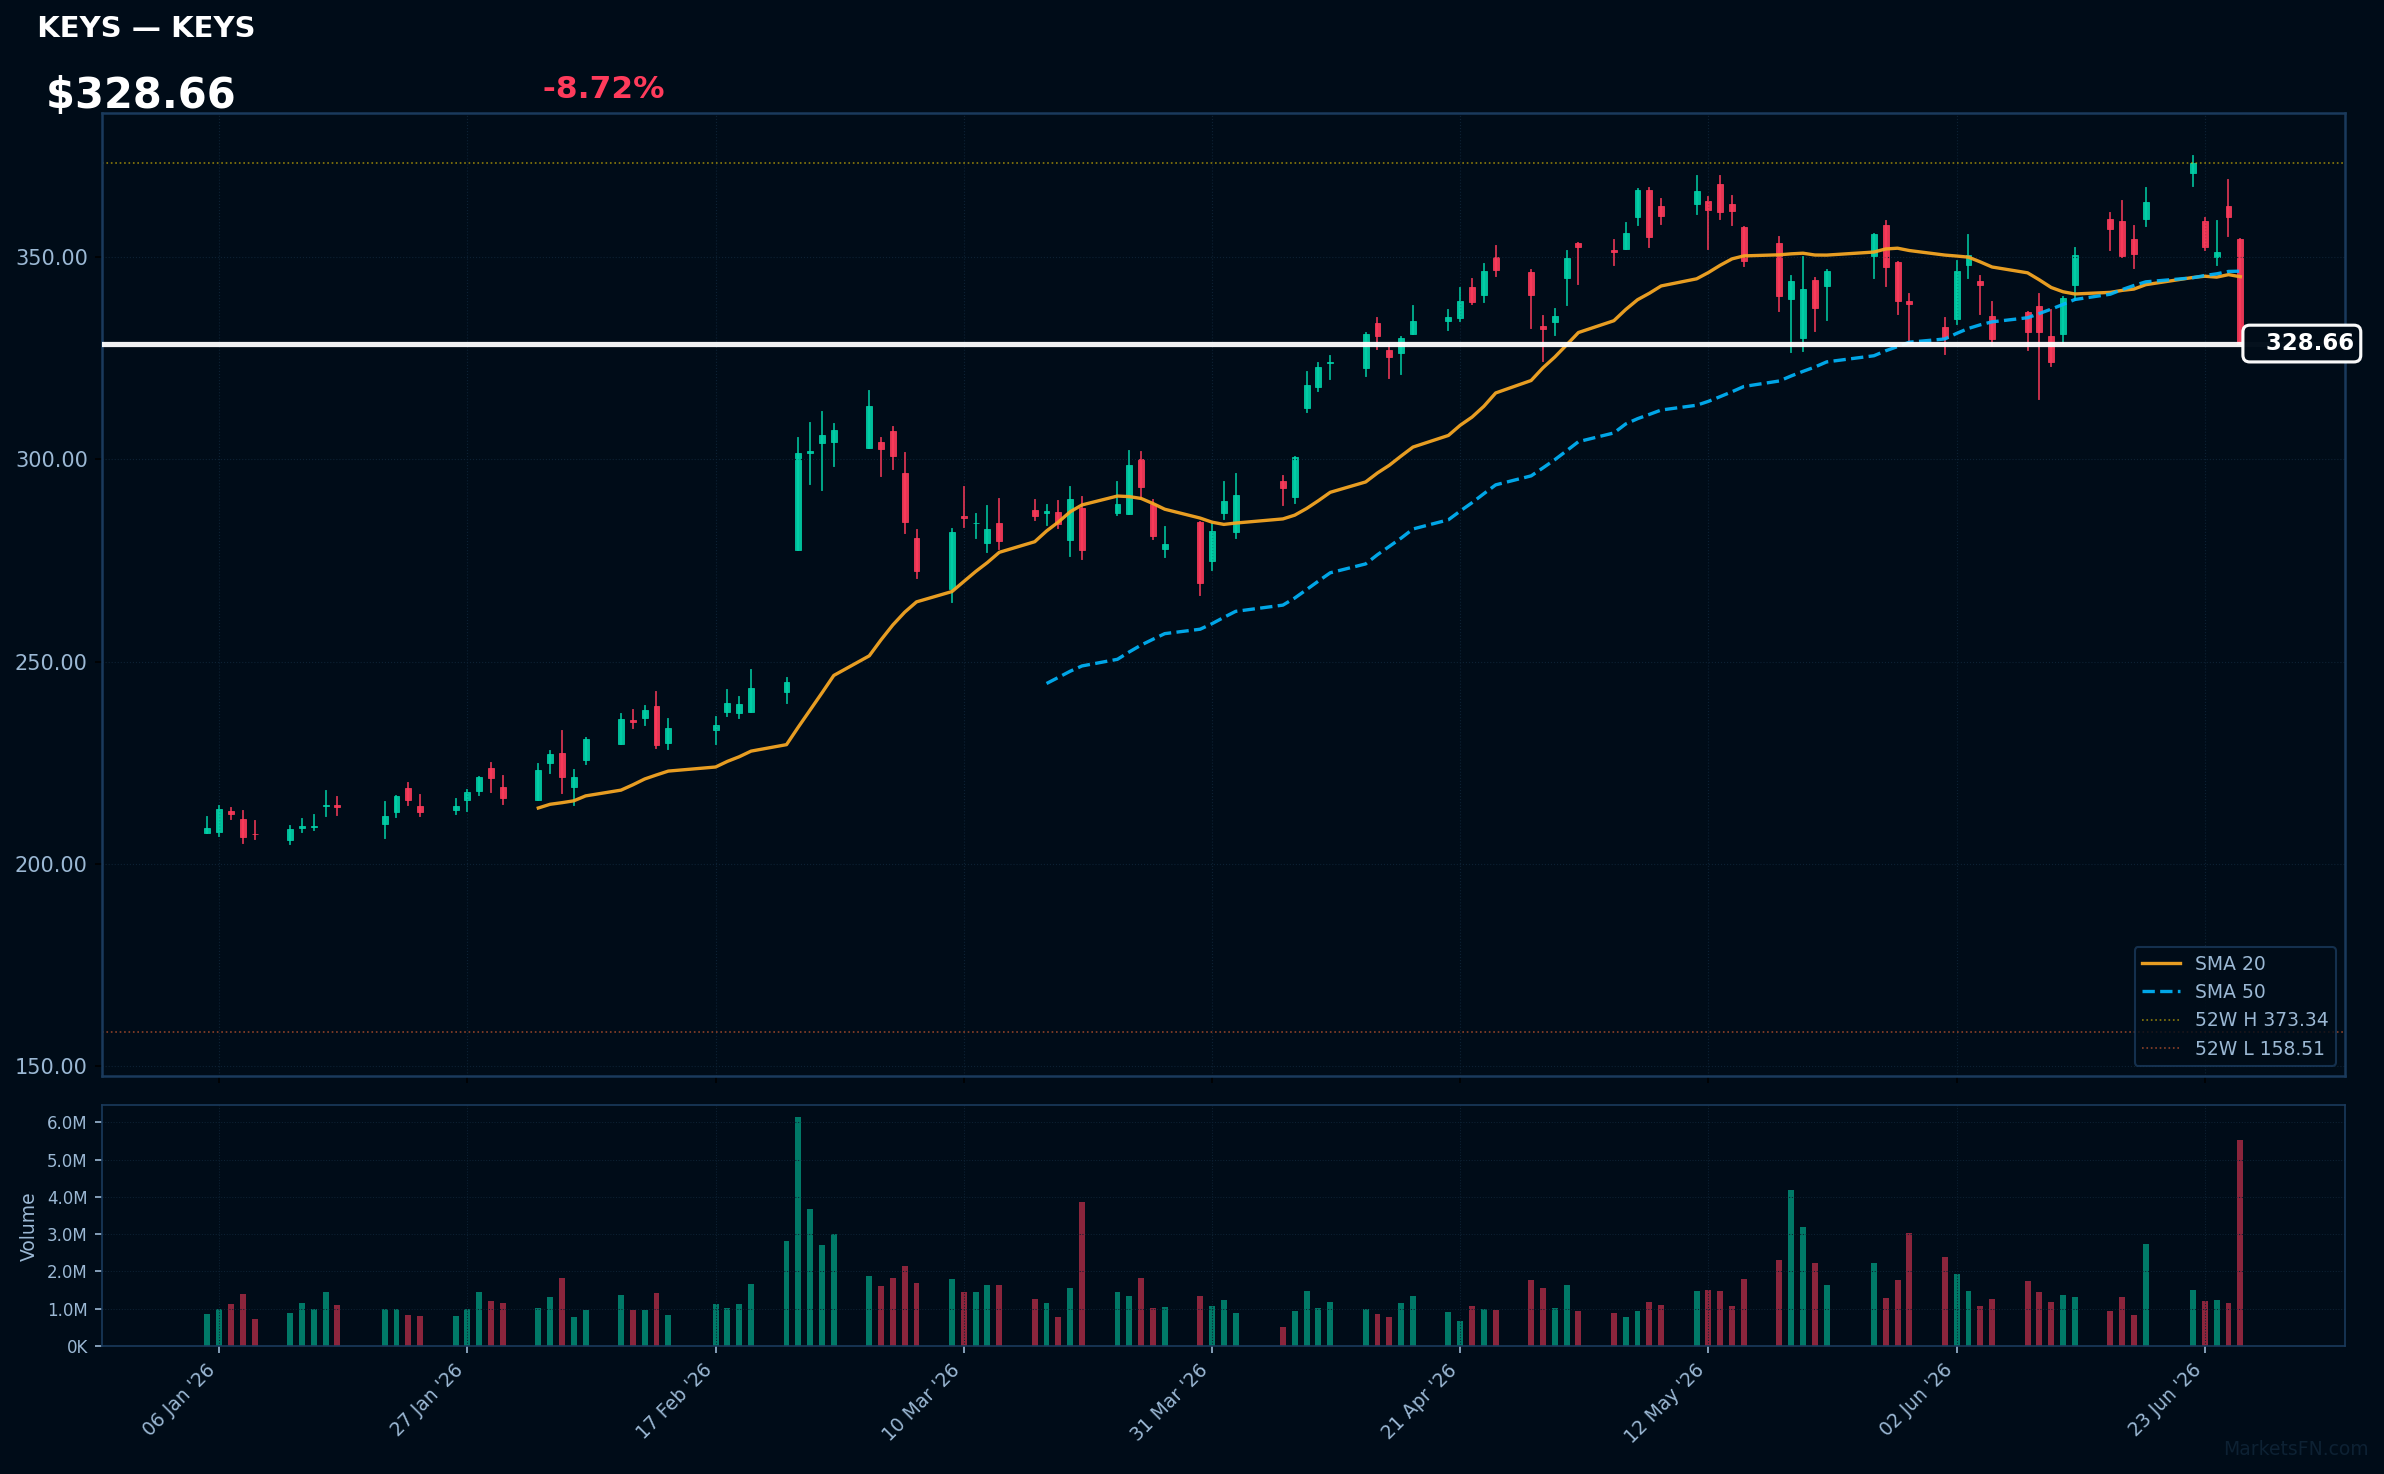
KEYS | Keysight Technologies Inc | Technology | Price: $328.66 | Day: -8.72% | 1W: -9.63% | 1M: -5.46% | RSI: 42.8 | vs MA200: +30.9% | Trend: Above MA200 · Below MA20, MA50
STX | Seagate Technology Holdings Plc | Technology | Price: $899.90 | Day: -12.24% | 1W: -15.92% | 1M: +3.36% | RSI: 48.3 | vs MA200: +103.4% | Trend: Above MA50, MA200 · Below MA20
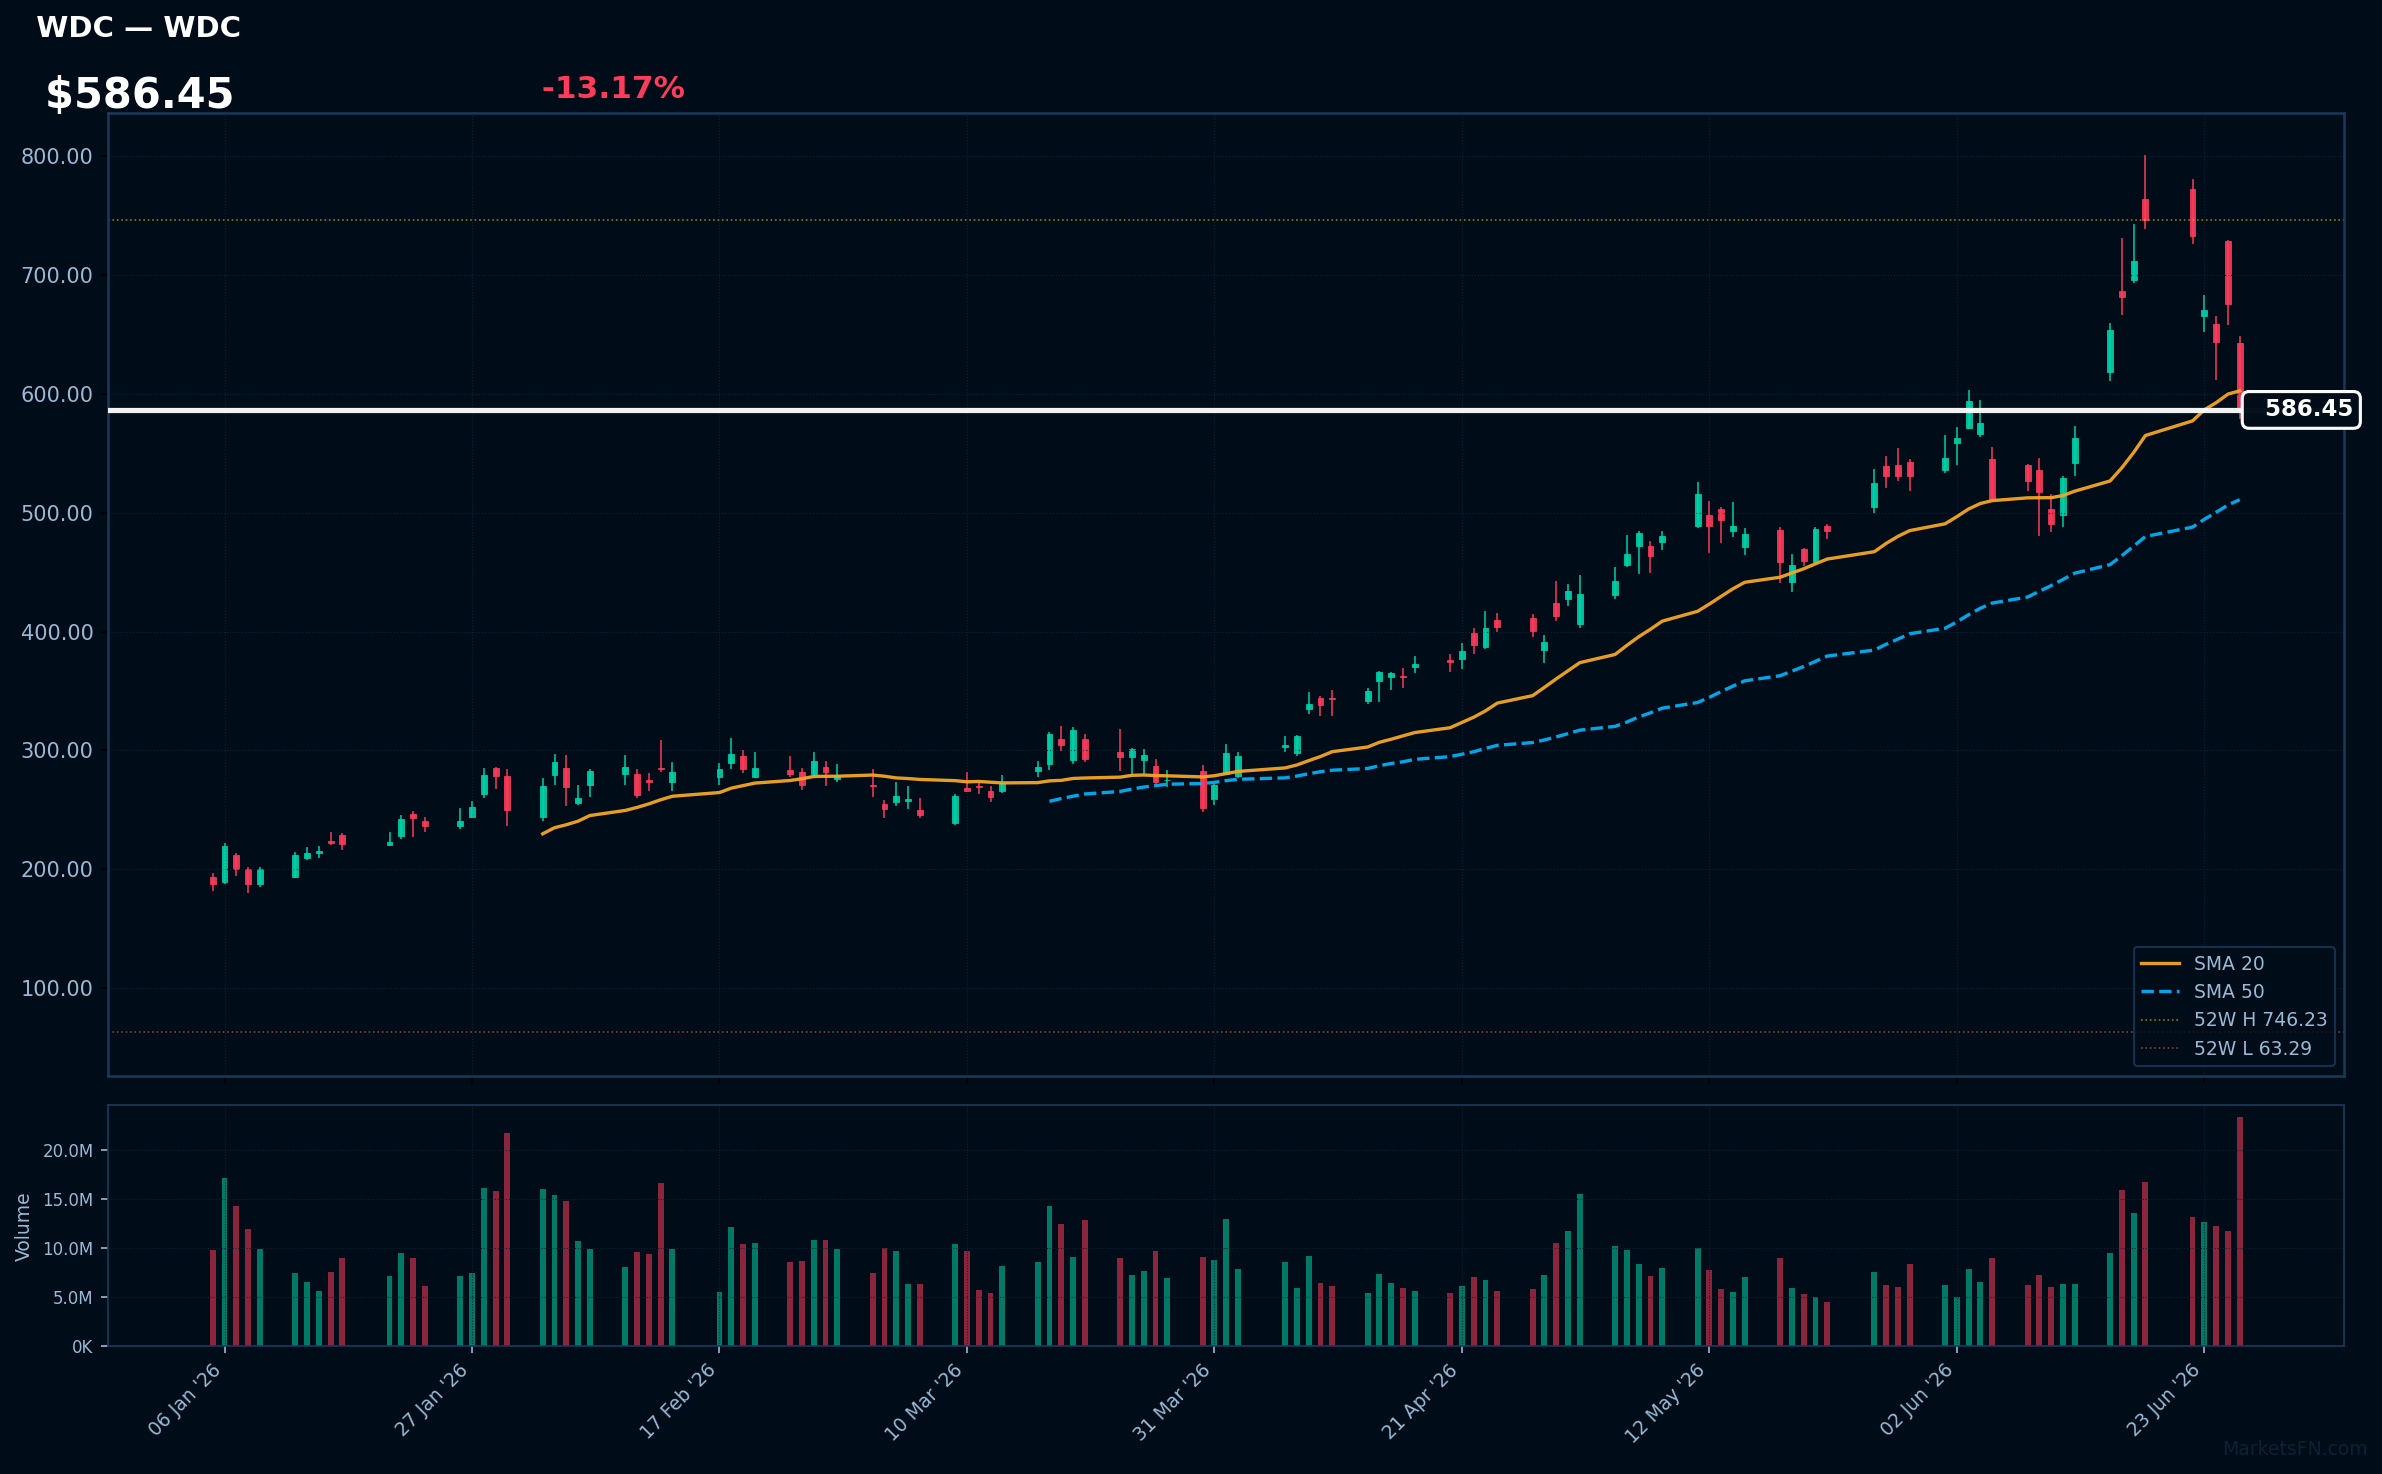
WDC | Western Digital Corp | Technology | Price: $586.45 | Day: -13.17% | 1W: -21.41% | 1M: +10.53% | RSI: 50.1 | vs MA200: +109.2% | Trend: Above MA50, MA200 · Below MA20
Recent headlines (last 12h)
- Why Is Micron Stock Rising Nearly 1% Overnight?
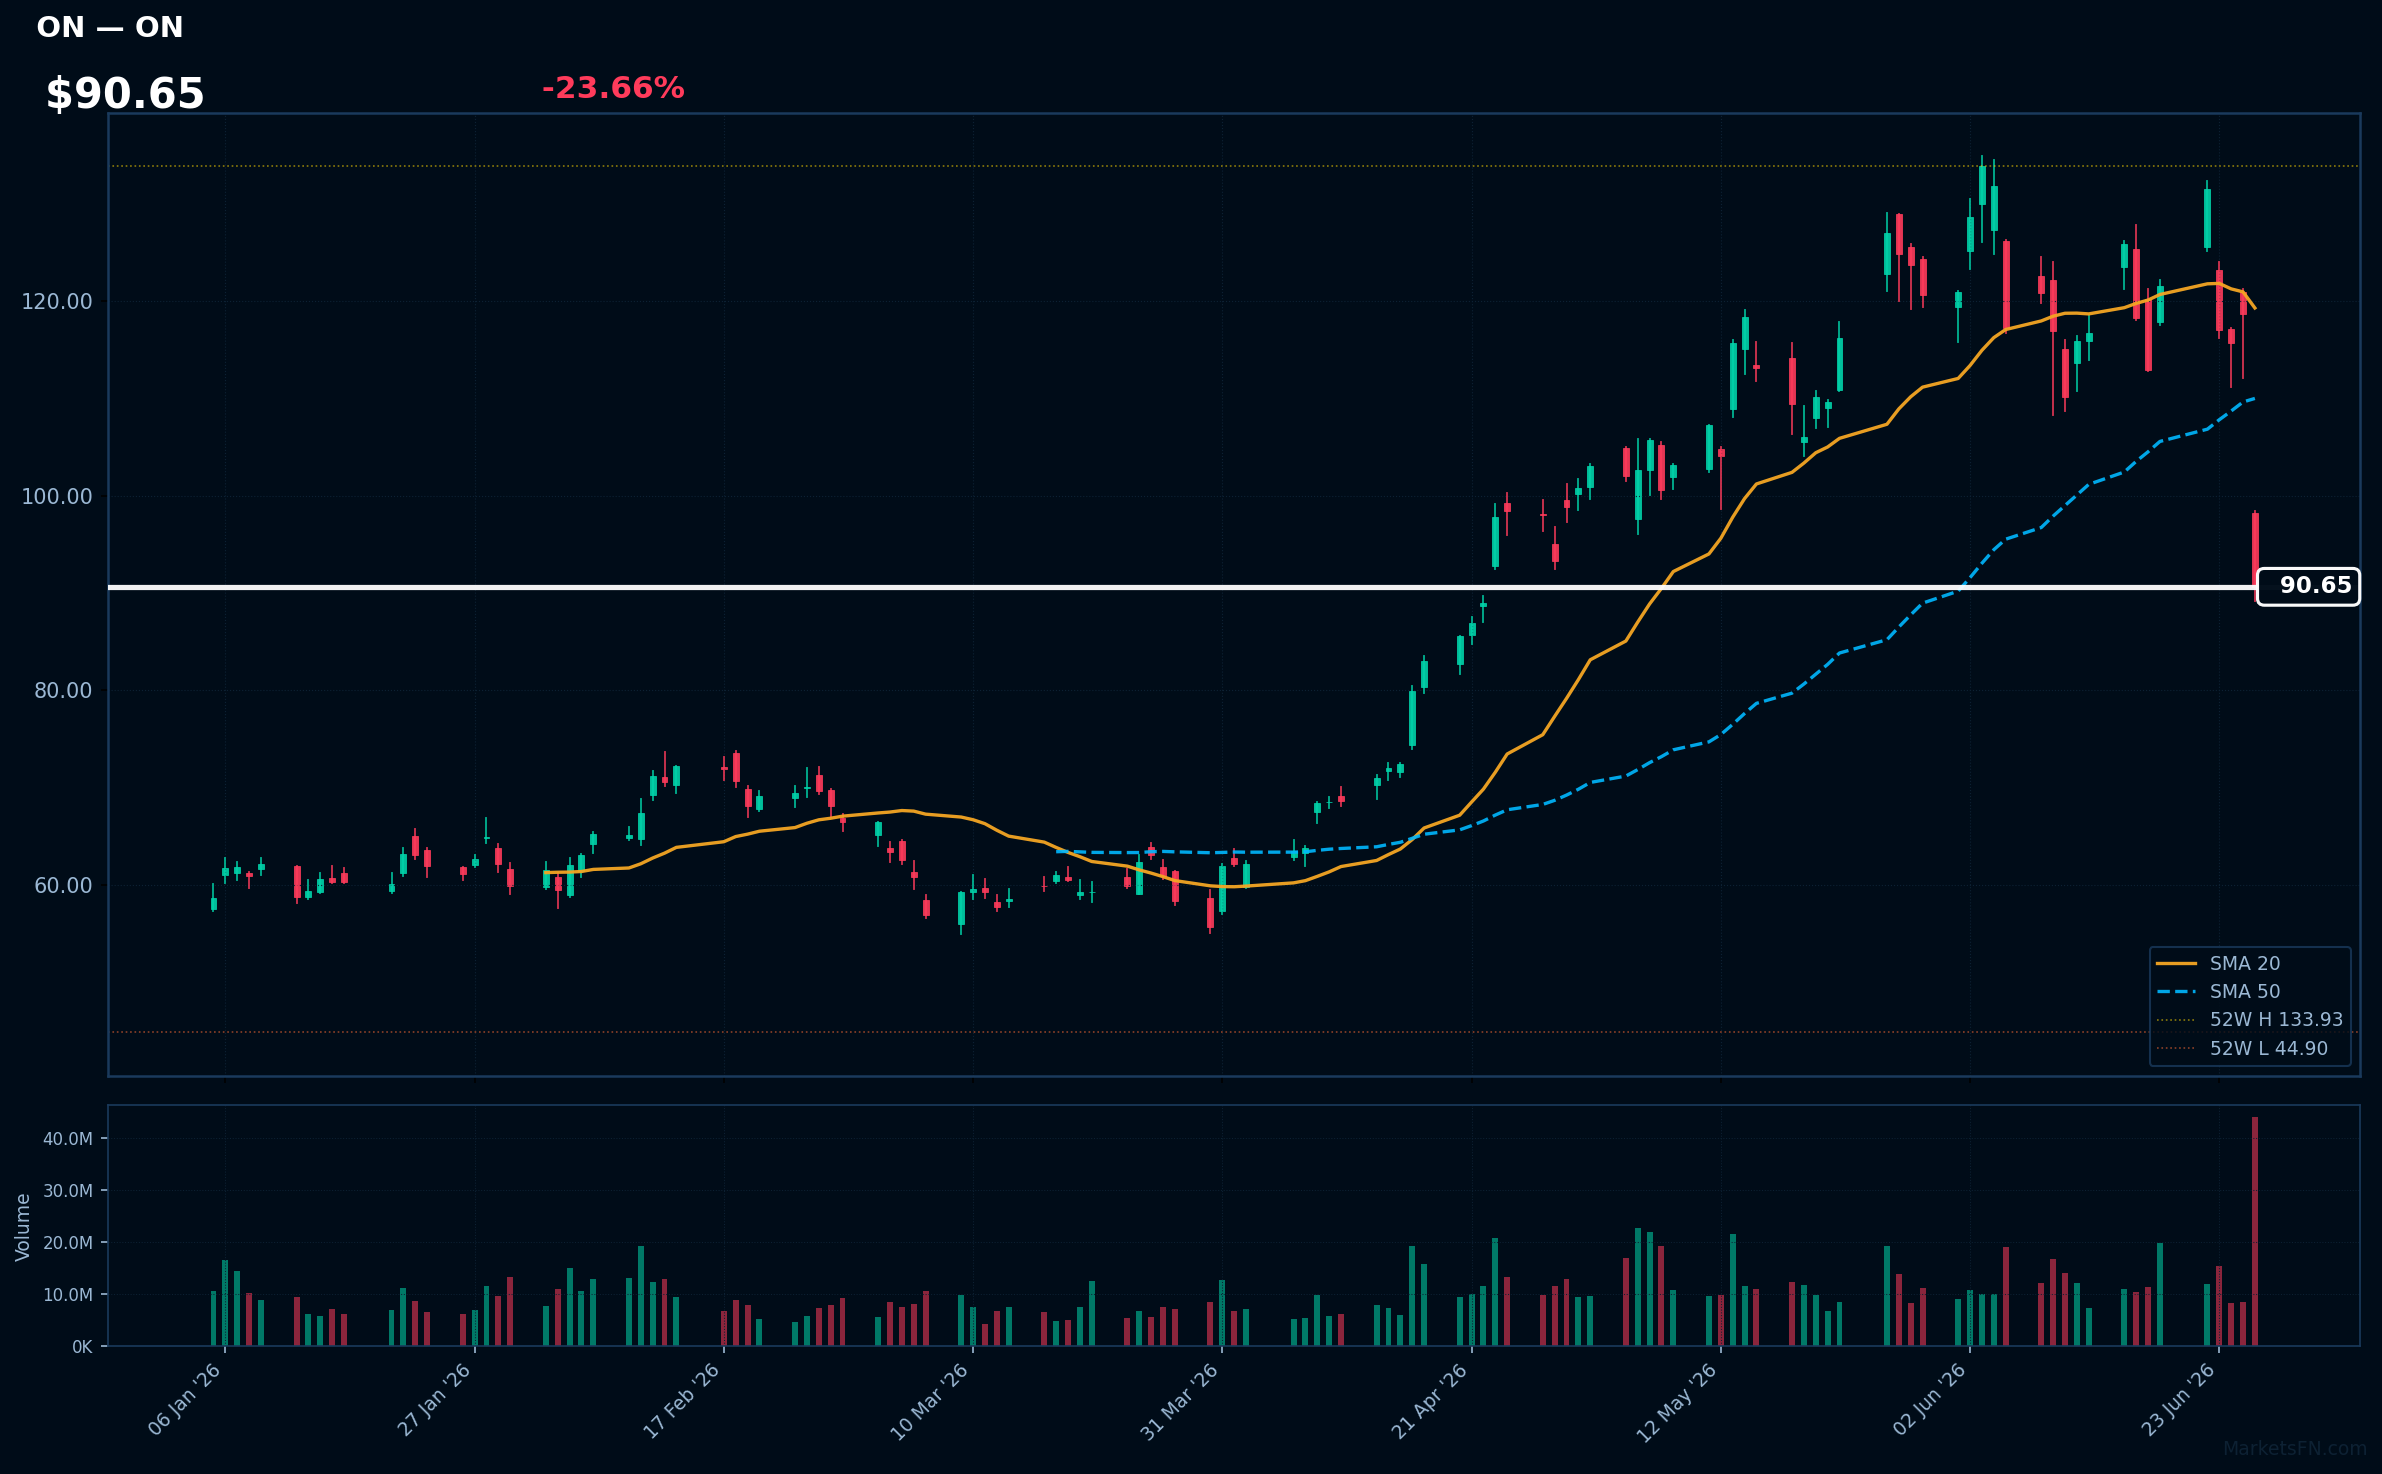
ON | ON Semiconductor Corp | Technology | Price: $90.65 | Day: -23.66% | 1W: -25.46% | 1M: -27.42% | RSI: 37.2 | vs MA200: +29.2% | Trend: Above MA200 · Below MA20, MA50
Market Commentary
The S&P 500's +0.71% average daily change was supported by broad-based buying, with 329 advancing issues (66.3%) outpacing 166 decliners (33.5%) among the 496 constituents tracked. This suggests a positive session tone, driven by a majority of the index's members.
Sector rotation is evident in today's movers, with Technology stocks dominating the laggards (NXPI, ADI, TER, QCOM, TXN, MPWR, KEYS, STX, WDC, ON) while Financial, Technology, and Healthcare names led the gains (MRNA, FDS, NOW, WDAY, DDOG, LLY, BIIB, IT, GDDY, MTCH). This divergence may indicate a shift in investor preferences away from semiconductor and hardware-related tech exposure.
With only 3.0% of constituents (15 stocks) trading above their MA200, the index remains vulnerable to further downside pressure. Traders should monitor whether the current advance/decline ratio can be sustained and watch for a potential reversal if the number of stocks above MA200 fails to improve. A break below the recent lows could trigger further selling pressure.
Methodology
Daily ranking uses the latest session close versus the prior close. RSI (14-day EWM), MA20, MA50, and MA200 are computed from 12 months of daily OHLCV data sourced from Yahoo Finance. Charts show the last 120 trading sessions with SMA 20/50, 52-week H/L markers, and volume. Recent news (last 12 h) is sourced from FinViz. Updated every trading day.
Disclaimer
The content on MarketsFN.com is provided for educational and informational purposes only. It does not constitute financial advice, investment recommendations, or trading guidance. All investments involve risks, and past performance does not guarantee future results. You are solely responsible for your investment decisions and should conduct independent research and consult a qualified financial advisor before acting. MarketsFN.com and its authors are not liable for any losses or damages arising from your use of this information.
Related Articles
- S&P 500 Bull & Bear Radar — June 26, 2026 — S&P 500 Bull & Bear Radar — June 26, 2026 A daily technical sweep of 495 S&P 500 constituents ranked by session…
- Beyond Air Inc. (XAIR) Rises 3.67% After Earnings — Post Earning Analysis Beyond Air Inc. (XAIR) Rises 3.67% After Earnings Beyond Air, Inc. specializes in developing…
- Cineverse Corp. (CNVS) Rallies 16.42% After Earnings — Post Earning Analysis Cineverse Corp. (CNVS) Rallies 16.42% After Earnings Cineverse Corp (CNVS) has just disclosed its…
- Apogee Enterprises Inc. (APOG) Rallies 12.97% After Earnings — Post Earning Analysis Apogee Enterprises Inc. (APOG) Rallies 12.97% After Earnings Apogee Enterprises has reaffirmed…
- Nasdaq 100 52-Week Highs & Lows Radar: Monster Beverage (MNST), PDD ADR (PDD) and more — Nasdaq 100 stocks nearest to their 52-week high and low. Bloomberg-style charts, RSI/MA analysis and Grok commentary.