Natural Gas: Up 1.9% to $3.26 — Above MA50 ($3.03) — Constructive
· Commodities · QuoteReporter
Natural Gas: Up 1.9% to $3.26 — Above MA50 ($3.03) — Constructive
Analysis Date: July 03, 2026
📊 Current Market Data
CURRENT PRICE
$3.26
DAILY CHANGE
+1.94%
WEEKLY CHANGE
+0.84%
52W HIGH
$7.83
52W LOW
$2.48
💡 Key Market Factors
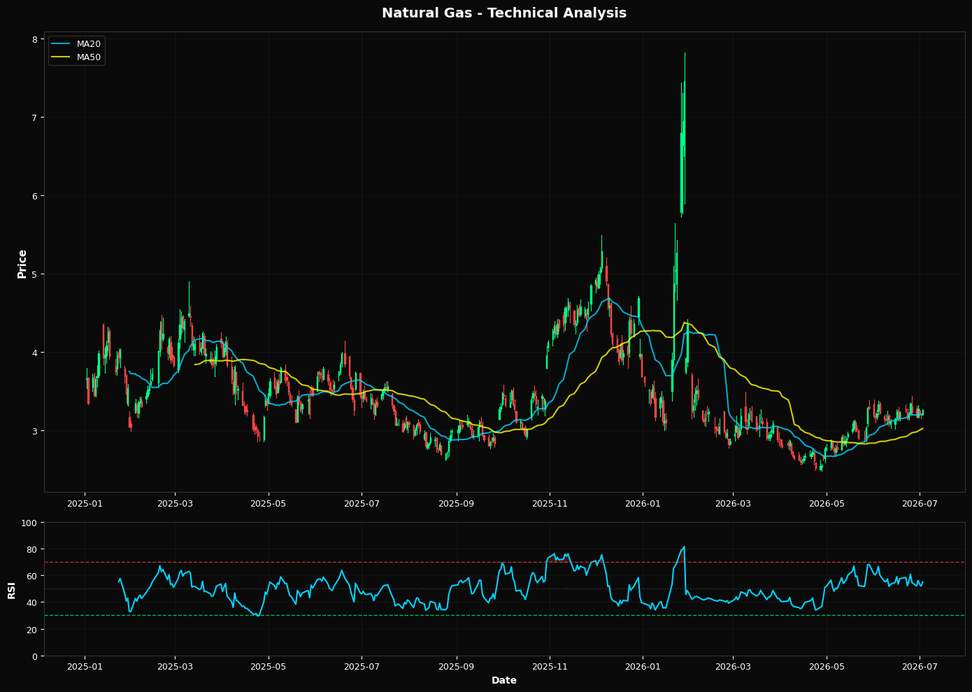
Natural gas prices are poised for a potential breakout, driven by a confluence of technical indicators and macroeconomic factors. The most pressing macro driver for natural gas today is the U.S. dollar's strength, which has been exerting downward pressure on commodity prices broadly. However, with the Federal Reserve signaling a potential pause in rate hikes, the dollar could weaken, providing a tailwind for natural gas prices. This dynamic is crucial as it could amplify the current upward momentum, given that natural gas has already gained 1.94% daily and 0.84% weekly. From a technical perspective, natural gas is showing signs of bullish momentum. The current price of $3.26 is above both the 20-day moving average of $3.20 and the 50-day moving average of $3.03, indicating a short-term uptrend. However, it remains below the 200-day moving average of $3.46, suggesting that while the short-term outlook is positive, the longer-term trend is still bearish. The Relative Strength Index (RSI) at 55.0 suggests that the commodity is neither overbought nor oversold, providing room for further gains. The nearest Fibonacci resistance level at $4.52 is a critical target; surpassing this could signal a more sustained rally. The key risk to this bullish outlook is a potential resurgence in inflation, which could prompt the Federal Reserve to resume rate hikes, strengthening the dollar and putting downward pressure on natural gas prices. Conversely, a significant drop in inflation data could weaken the dollar further, enhancing the bullish case for natural gas. The market may be underpricing the impact of a weaker dollar, which could lead to a sharper-than-expected rise in natural gas prices if the Fed's dovish stance solidifies. Looking ahead, the upcoming U.S. inflation report will be pivotal. A lower-than-expected inflation figure could confirm the current bullish bias by reinforcing expectations of a Fed pause, thereby weakening the dollar and supporting higher natural gas prices. Conversely, a surprise uptick in inflation could invalidate this view, as it would likely strengthen the dollar and pressure natural gas prices downward. This data point will be crucial in determining the next directional move for natural gas.📈 Technical Indicators Summary
RSI (14)
55.0
50-Day MA
$3.03
200-Day MA
$3.46
Fib Level
38.2%
📊 Technical Analysis Chart (18-Month View)
📐 Fibonacci Retracement Analysis
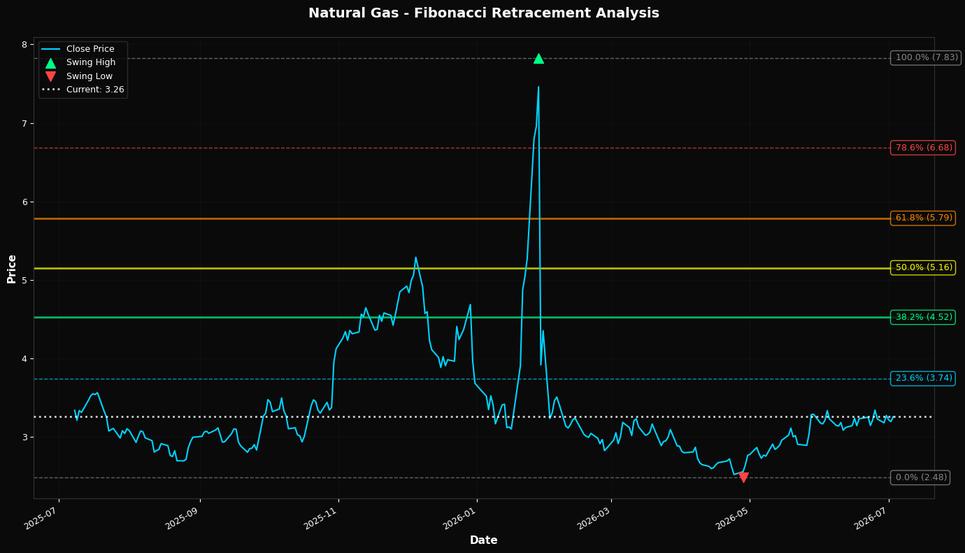
🎯 Key Trading Levels
Key Fibonacci Levels:
- 38.2%: $4.52
- 50.0%: $5.16
- 61.8%: $5.79
Support: $2.48 (Swing Low), $3.03 (50-Day MA)
Resistance: $7.83 (Swing High)
Disclaimer
The content on MarketsFN.com is provided for educational and informational purposes only. It does not constitute financial advice, investment recommendations, or trading guidance. All investments involve risks, and past performance does not guarantee future results. You are solely responsible for your investment decisions and should conduct independent research and consult a qualified financial advisor before acting. MarketsFN.com and its authors are not liable for any losses or damages arising from your use of this information.