Palladium: Up 2.3% to $1240.50 — Bearish — Below MA50 & MA200
· Commodities · QuoteReporter
Palladium: Up 2.3% to $1240.50 — Bearish — Below MA50 & MA200
Analysis Date: July 02, 2026
📊 Current Market Data
CURRENT PRICE
$1240.50
DAILY CHANGE
+2.28%
WEEKLY CHANGE
+5.11%
52W HIGH
$2169.90
52W LOW
$1082.00
💡 Key Market Factors
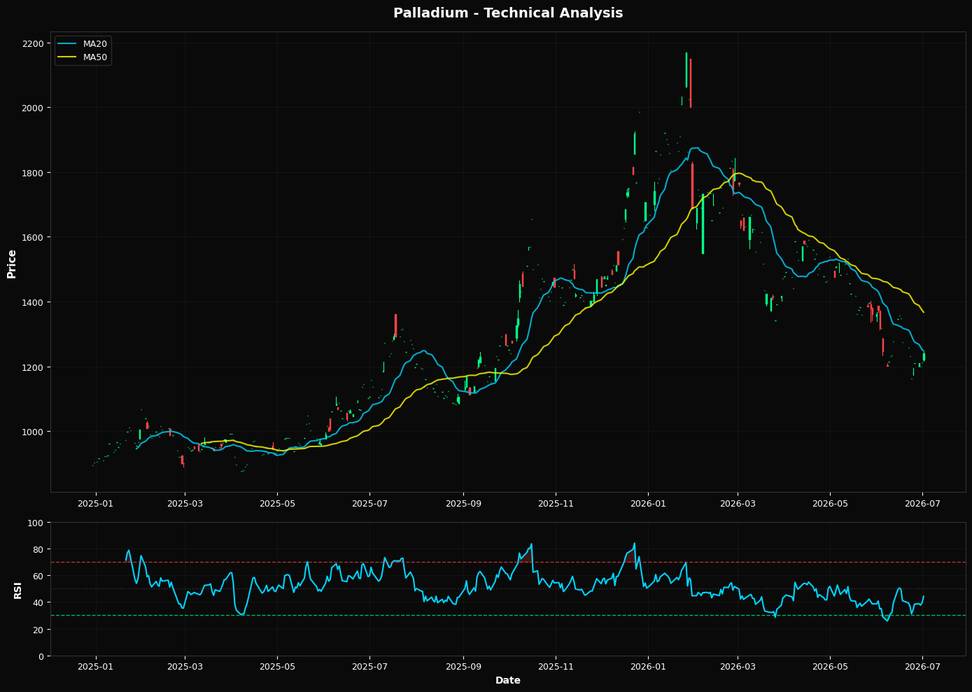
Palladium's recent price action suggests a potential rebound, but the market may be underestimating the impact of a stronger U.S. dollar. With palladium prices at $1240.50, up 2.28% daily and 5.11% weekly, the commodity is showing signs of recovery. However, the U.S. dollar's strength could cap gains, as a robust dollar typically pressures commodity prices by making them more expensive for holders of other currencies. Given the Federal Reserve's hawkish stance on interest rates, the dollar's appreciation could continue, posing a headwind for palladium. Technically, palladium is in a precarious position. The Relative Strength Index (RSI) at 44.2 indicates that the commodity is neither overbought nor oversold, suggesting a neutral momentum. However, the price is below its 20-day moving average of $1247.52, as well as significantly below the 50-day and 200-day moving averages of $1367.04 and $1516.78, respectively. This bearish alignment of moving averages points to a downward trend. The nearest Fibonacci support at 61.8% is at $1497.58, far above the current price, indicating that any upward movement would need to overcome significant resistance levels. The technical setup suggests a bearish bias unless palladium can break above these key moving averages. A key risk that could alter palladium's trajectory is a shift in Federal Reserve policy. Should the Fed signal a pause or reversal in its rate hikes, the dollar could weaken, providing a tailwind for palladium prices. Conversely, stronger-than-expected U.S. economic data could reinforce the Fed's hawkish stance, further strengthening the dollar and pressuring palladium. The market may be underpricing the potential for a dovish pivot, which could lead to a rapid revaluation of palladium if it occurs. Looking ahead, the upcoming U.S. inflation data release will be crucial. A lower-than-expected inflation print could prompt the Fed to reconsider its rate path, potentially weakening the dollar and boosting palladium. Conversely, persistently high inflation would likely reinforce the current policy trajectory, maintaining pressure on palladium prices. This data point will be pivotal in confirming or invalidating the current bearish outlook for palladium.📈 Technical Indicators Summary
RSI (14)
44.2
50-Day MA
$1367.04
200-Day MA
$1516.78
Fib Level
61.8%
📊 Technical Analysis Chart (18-Month View)
📐 Fibonacci Retracement Analysis
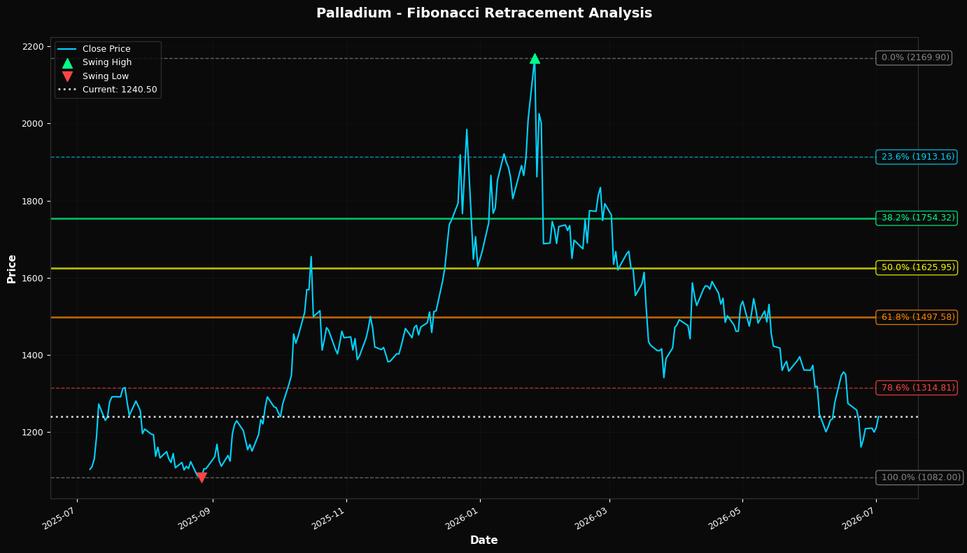
🎯 Key Trading Levels
Key Fibonacci Levels:
- 38.2%: $1754.32
- 50.0%: $1625.95
- 61.8%: $1497.58
Support: $1082.00 (Swing Low), $1367.04 (50-Day MA)
Resistance: $2169.90 (Swing High)
Disclaimer
The content on MarketsFN.com is provided for educational and informational purposes only. It does not constitute financial advice, investment recommendations, or trading guidance. All investments involve risks, and past performance does not guarantee future results. You are solely responsible for your investment decisions and should conduct independent research and consult a qualified financial advisor before acting. MarketsFN.com and its authors are not liable for any losses or damages arising from your use of this information.