Platinum: Up 3.3% to $1669.30 — Bearish — Below MA50 & MA200
· Commodities · QuoteReporter
Platinum: Up 3.3% to $1669.30 — Bearish — Below MA50 & MA200
Analysis Date: July 03, 2026
📊 Current Market Data
CURRENT PRICE
$1669.30
DAILY CHANGE
+3.26%
WEEKLY CHANGE
+2.35%
52W HIGH
$2852.40
52W LOW
$1276.20
💡 Key Market Factors
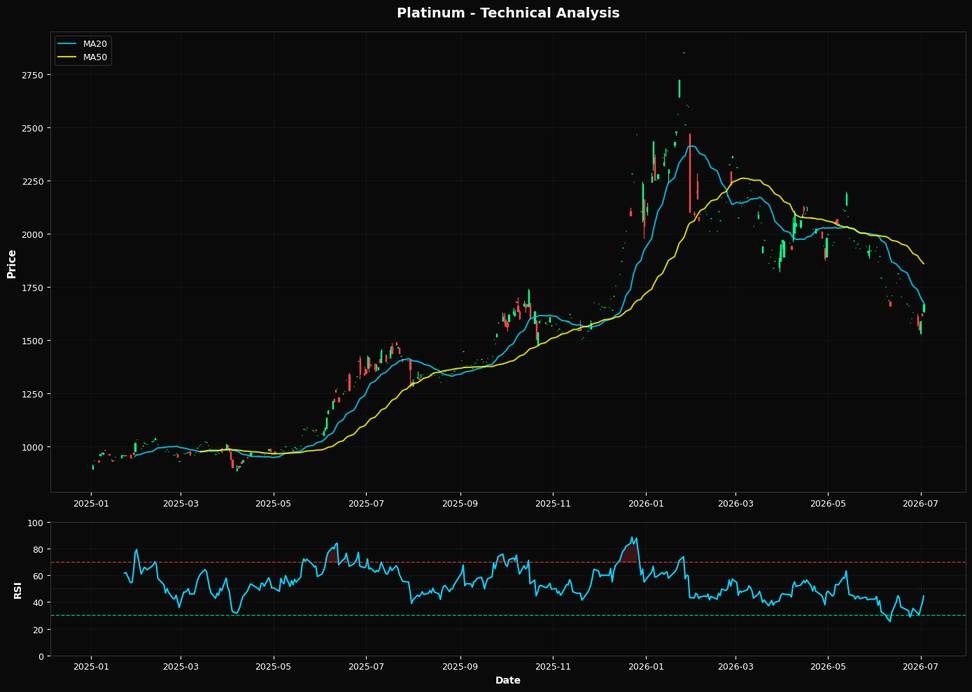
Platinum's recent price action suggests a potential rebound, but macroeconomic headwinds could limit its upside. The most pressing macro driver for platinum right now is the Federal Reserve's interest rate policy. With the price of platinum at $1669.30, up +3.26% daily and +2.35% weekly, the market is showing resilience. However, the broader context of a strong U.S. dollar and potential further rate hikes could suppress demand for commodities priced in USD, including platinum. The Fed's hawkish stance, aimed at curbing inflation, continues to exert downward pressure on precious metals by increasing the opportunity cost of holding non-yielding assets like platinum. Technically, platinum is in a precarious position. The Relative Strength Index (RSI) at 44.5 indicates that the commodity is neither overbought nor oversold, suggesting a lack of strong momentum. The current price is below the 20-day moving average of $1676.58, and significantly below the 50-day and 200-day moving averages of $1858.96 and $1904.62, respectively. This bearish alignment of moving averages points to a downtrend, reinforced by the nearest Fibonacci support level at 61.8% or $1878.31, which is well above the current price. The technical setup suggests that while there may be short-term gains, the overall trend remains bearish unless the price can break above these key resistance levels. A key risk that could alter the current outlook for platinum is a shift in the Federal Reserve's policy stance. Should upcoming economic data, particularly inflation figures, indicate a slowdown in price pressures, the Fed might pivot towards a more dovish stance. This could weaken the USD and lower interest rates, providing a tailwind for platinum prices. Conversely, stronger-than-expected inflation data could reinforce the Fed's hawkish approach, further pressuring platinum. Looking ahead, the next significant catalyst will be the release of U.S. inflation data. A lower-than-expected inflation print could validate a bullish reversal in platinum, potentially driving prices above the 20-day moving average and challenging the 50-day moving average. Conversely, a higher inflation reading would likely confirm the bearish trend, keeping platinum prices suppressed. Investors should closely monitor these developments, as they will be critical in determining the near-term direction of platinum.📈 Technical Indicators Summary
RSI (14)
44.5
50-Day MA
$1858.96
200-Day MA
$1904.62
Fib Level
61.8%
📊 Technical Analysis Chart (18-Month View)
📐 Fibonacci Retracement Analysis
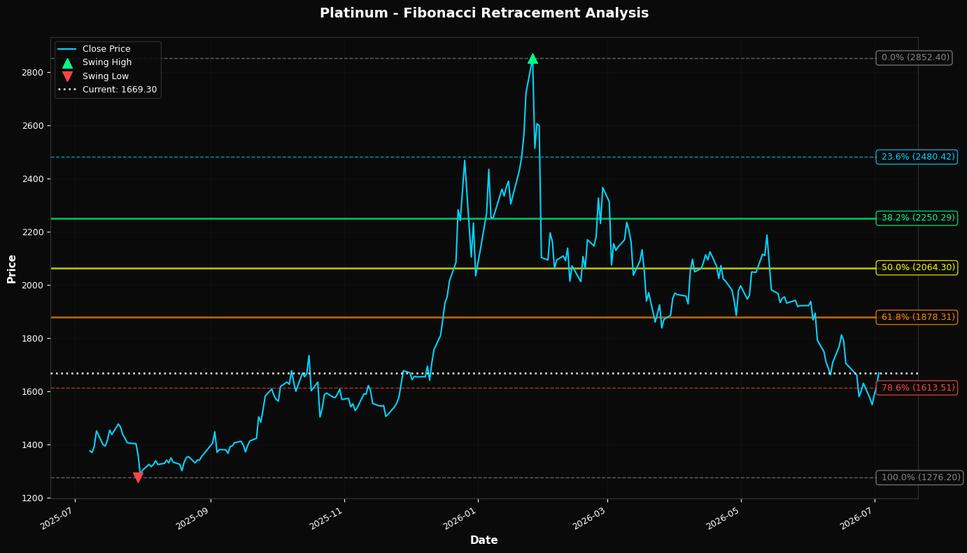
🎯 Key Trading Levels
Key Fibonacci Levels:
- 38.2%: $2250.29
- 50.0%: $2064.30
- 61.8%: $1878.31
Support: $1276.20 (Swing Low), $1858.96 (50-Day MA)
Resistance: $2852.40 (Swing High)
Disclaimer
The content on MarketsFN.com is provided for educational and informational purposes only. It does not constitute financial advice, investment recommendations, or trading guidance. All investments involve risks, and past performance does not guarantee future results. You are solely responsible for your investment decisions and should conduct independent research and consult a qualified financial advisor before acting. MarketsFN.com and its authors are not liable for any losses or damages arising from your use of this information.