S&P 500 2026 YTD Highs & Lows Radar: Arista Networks (ANET), VICI Properties (VICI) and more
MarketsFN Team

S&P 500 2026 YTD Highs & Lows Radar: Arista Networks (ANET), VICI Properties (VICI) and more
Screening all 503 S&P 500 constituents for stocks nearest to their 2026 year-to-date high and their 2026 YTD low. Data as of July 09, 2026. % Realized = total return since Jan 1 2026.
Legend: RSI > 70 = overbought · RSI < 30 = oversold · Green % Realized = positive YTD return · Red = negative.
📈 Nearest to 2026 High
Sectors represented: Energy (3), Technology (1), Utilities (1)
| Ticker | Company | Sector | Price Last | % Realized | 2026 YTD High Date | RSI | % above MA200 | Trend |
|---|---|---|---|---|---|---|---|---|
| ANET | Arista Networks Inc | Technology | $181.05 | +35.52% | 2026-07-08 | 63.2 | +25.9% | Above MA20, MA50, MA200 |
| MPC | Marathon Petroleum Corp | Energy | $280.68 | +69.96% | 2026-07-08 | 68.5 | +32.1% | Above MA20, MA50, MA200 |
| D | Dominion Energy Inc | Utilities | $69.86 | +17.93% | 2026-07-08 | 61.6 | +11.8% | Above MA20, MA50, MA200 |
| VLO | Valero Energy Corp | Energy | $282.88 | +71.12% | 2026-07-08 | 66.8 | +36.3% | Above MA20, MA50, MA200 |
| TRGP | Targa Resources Corp | Energy | $277.86 | +48.77% | 2026-07-08 | 59.4 | +30.0% | Above MA20, MA50, MA200 |
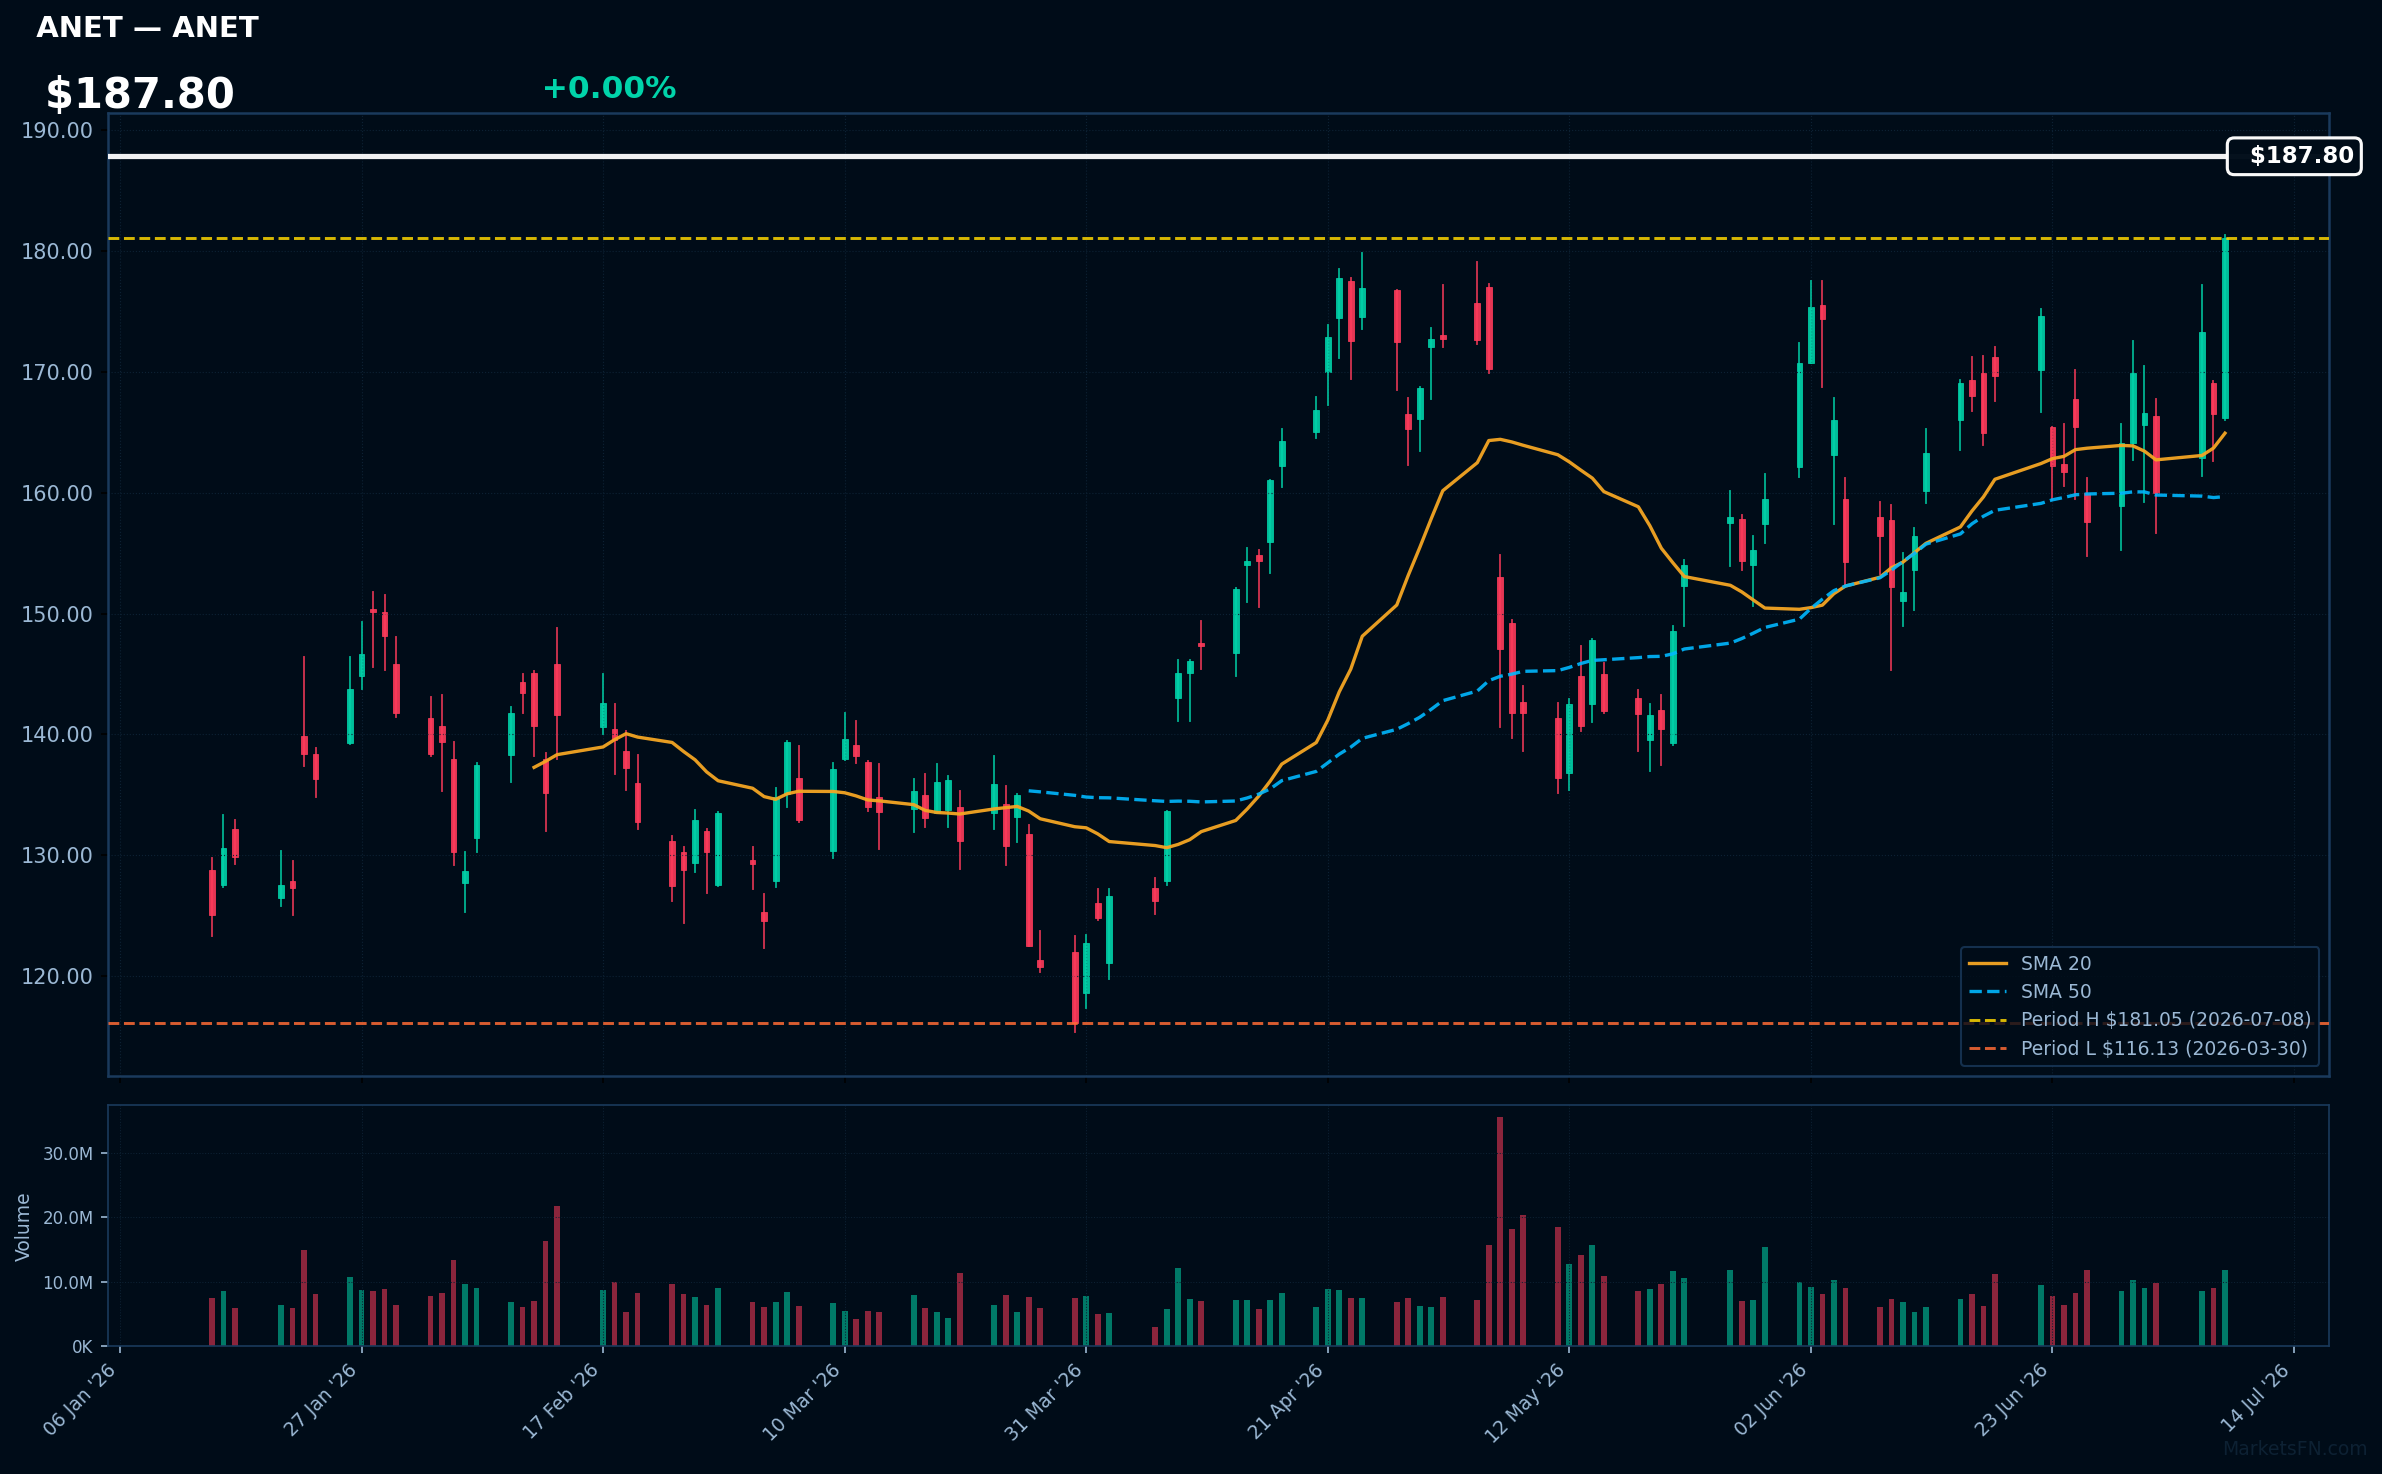
ANET | Arista Networks Inc | Technology | Price Last: $181.05 | % Realized: +35.52% | RSI: 63.2 | % above MA200: +25.9% | Trend: Above MA20, MA50, MA200
Arista Networks Inc (ANET) is a cloud networking company providing high-performance switching solutions for data centers. Investors should care due to its strong presence in the rapidly growing cloud infrastructure market, driven by increasing demand for high-bandwidth, low-latency networking.
Arista Networks Inc shows bullish technicals with RSI(14) at 63.2, indicating rising momentum. The MA alignment is bullish as price ($187.80) > MA20 > MA50 > MA200, confirming a sustained uptrend. The stock is near its 2026 YTD high, 0.0% below, suggesting a potential breakout.
Related headlines
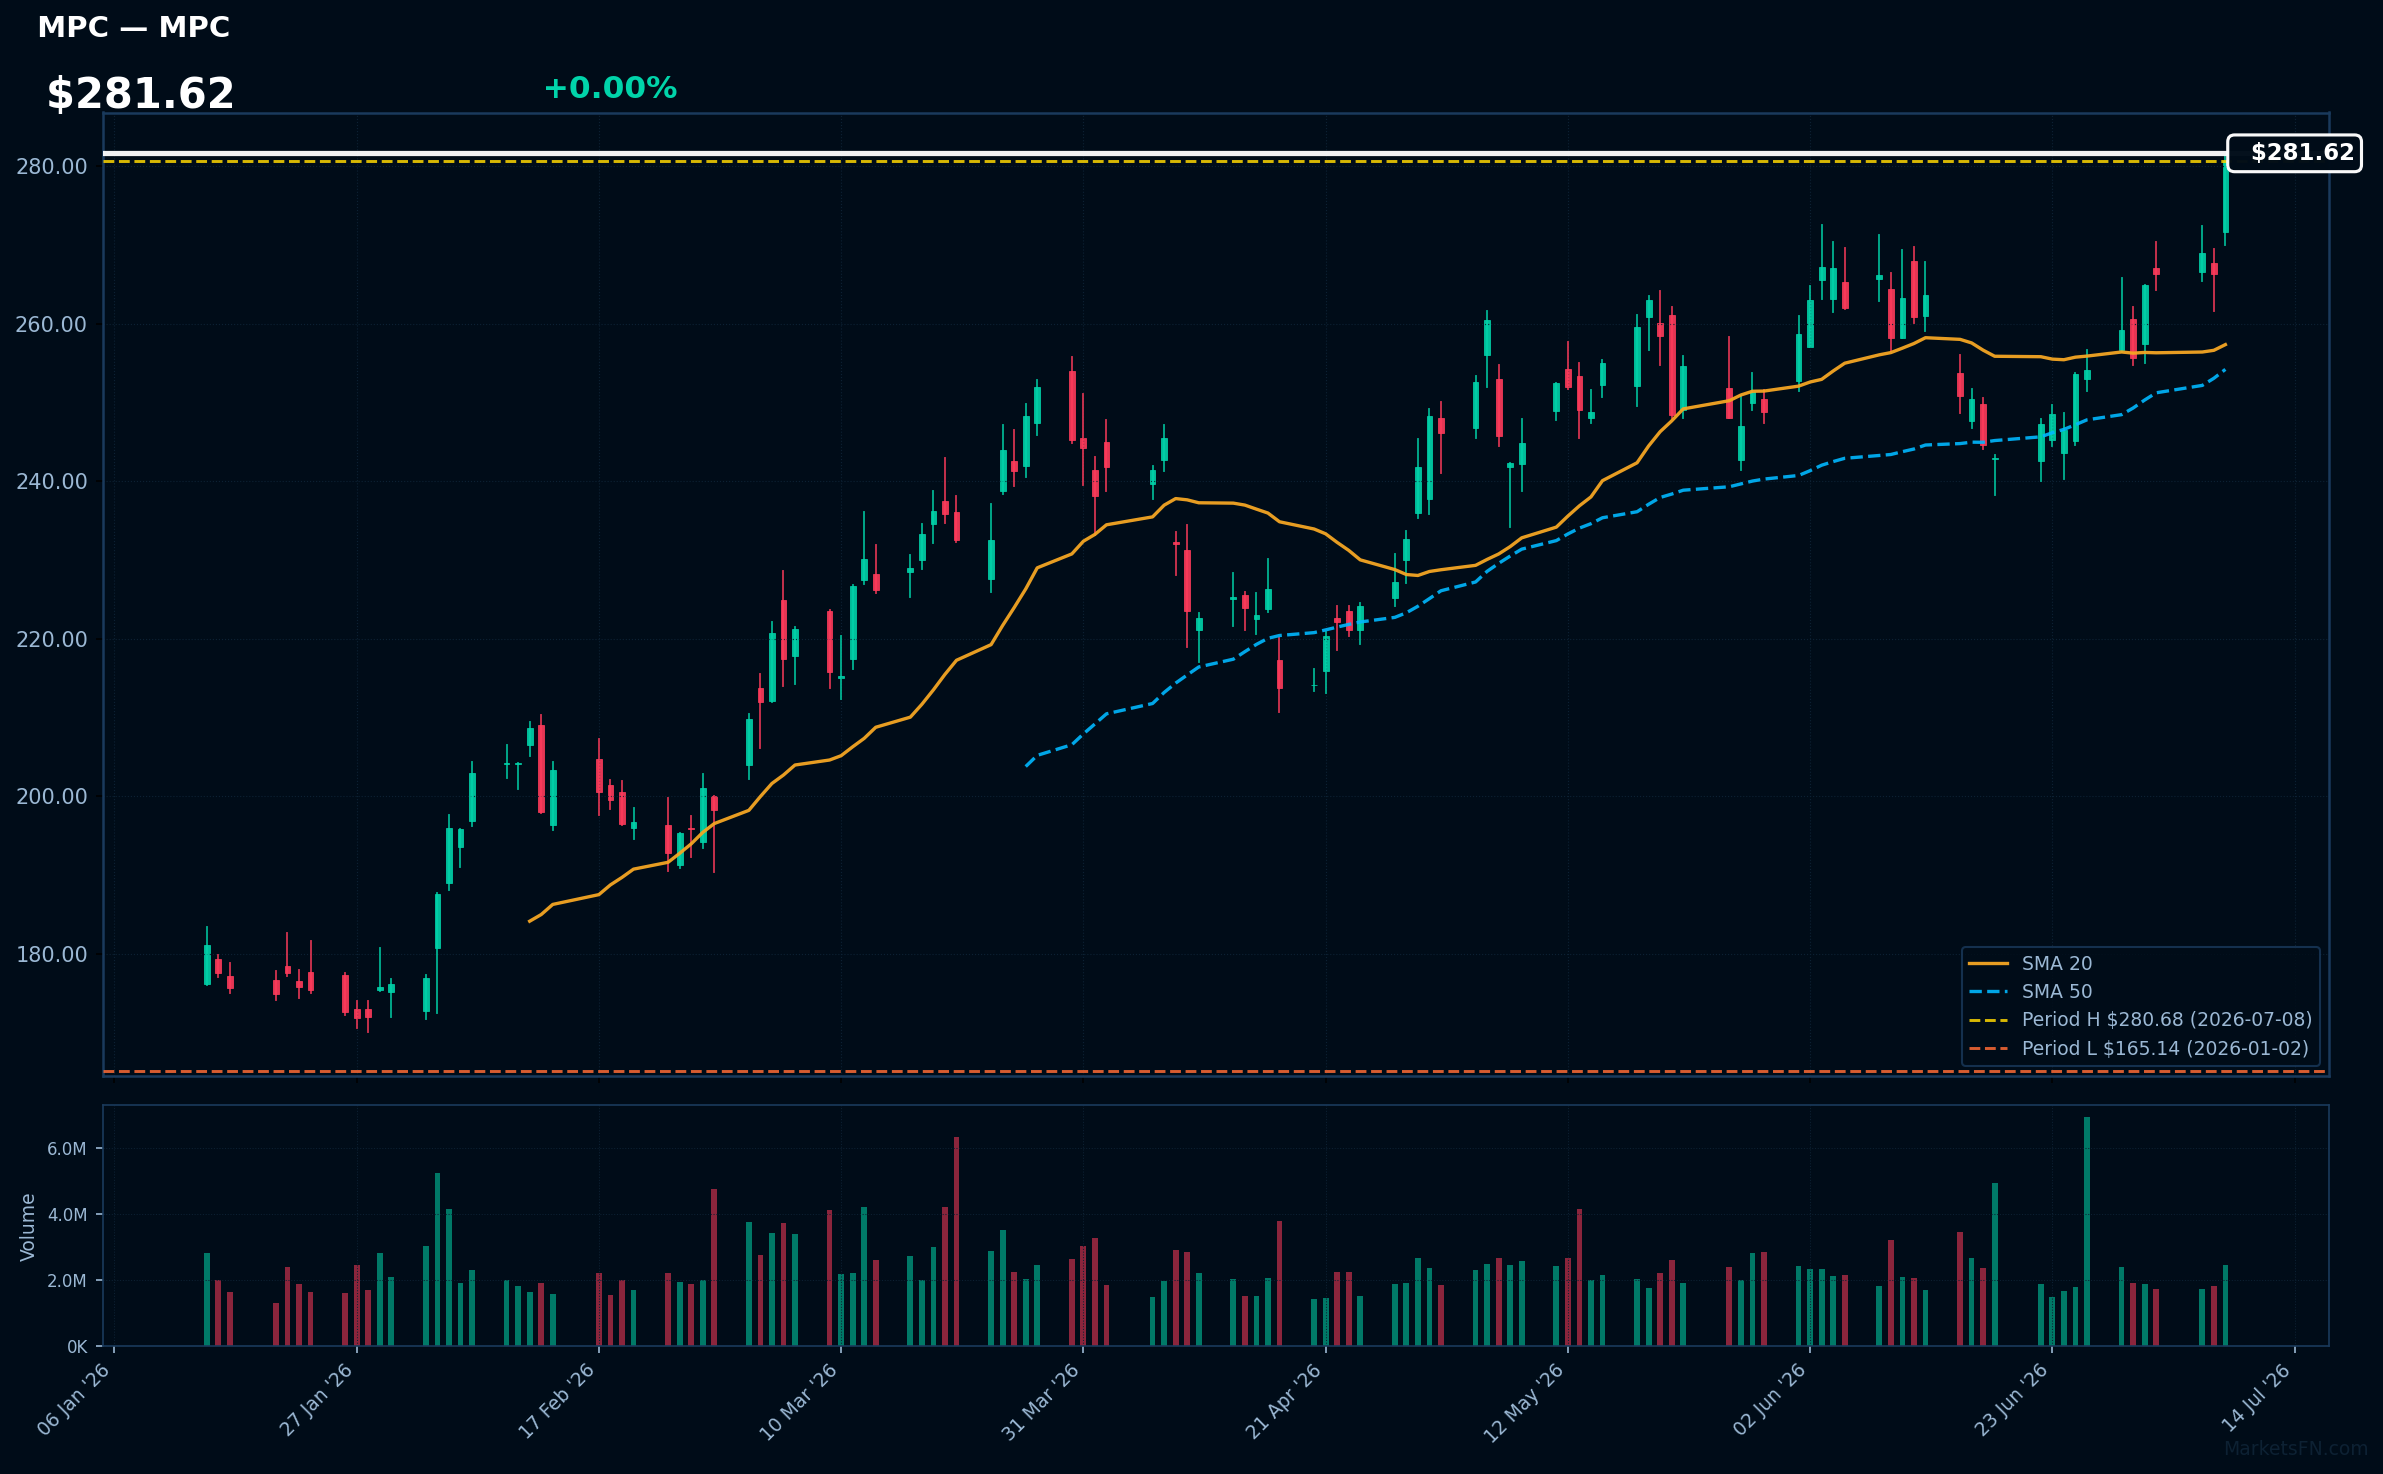
MPC | Marathon Petroleum Corp | Energy | Price Last: $280.68 | % Realized: +69.96% | RSI: 68.5 | % above MA200: +32.1% | Trend: Above MA20, MA50, MA200
Marathon Petroleum Corp is a refining and marketing company, operating refineries and retail outlets. Investors should care about its refining capacity, product margins, and distribution network, as these drive revenue and profitability in the energy sector.
MPC's RSI(14) is 68.5, nearing overbought territory. The MA alignment (price > MA20 > MA50 > MA200) indicates a sustained uptrend. With the stock 0.0% below its 2026 YTD high, it suggests potential for a breakout, indicating strong momentum.
Related headlines
- BP, Marathon, 7-Eleven, Walmart sued for allegedly using AI to boost California gas prices
- Marathon Petroleum Corp. to Report Second-Quarter Financial Results on August 4, 2026
- Marathon Petroleum Corp. names Brian Worthington vice president, Investor Relations; Kristina Kazarian to become vice president, Finance and Treasurer
- MPC- A US Refiner Benefitting from Tighter Jet Fuel Market
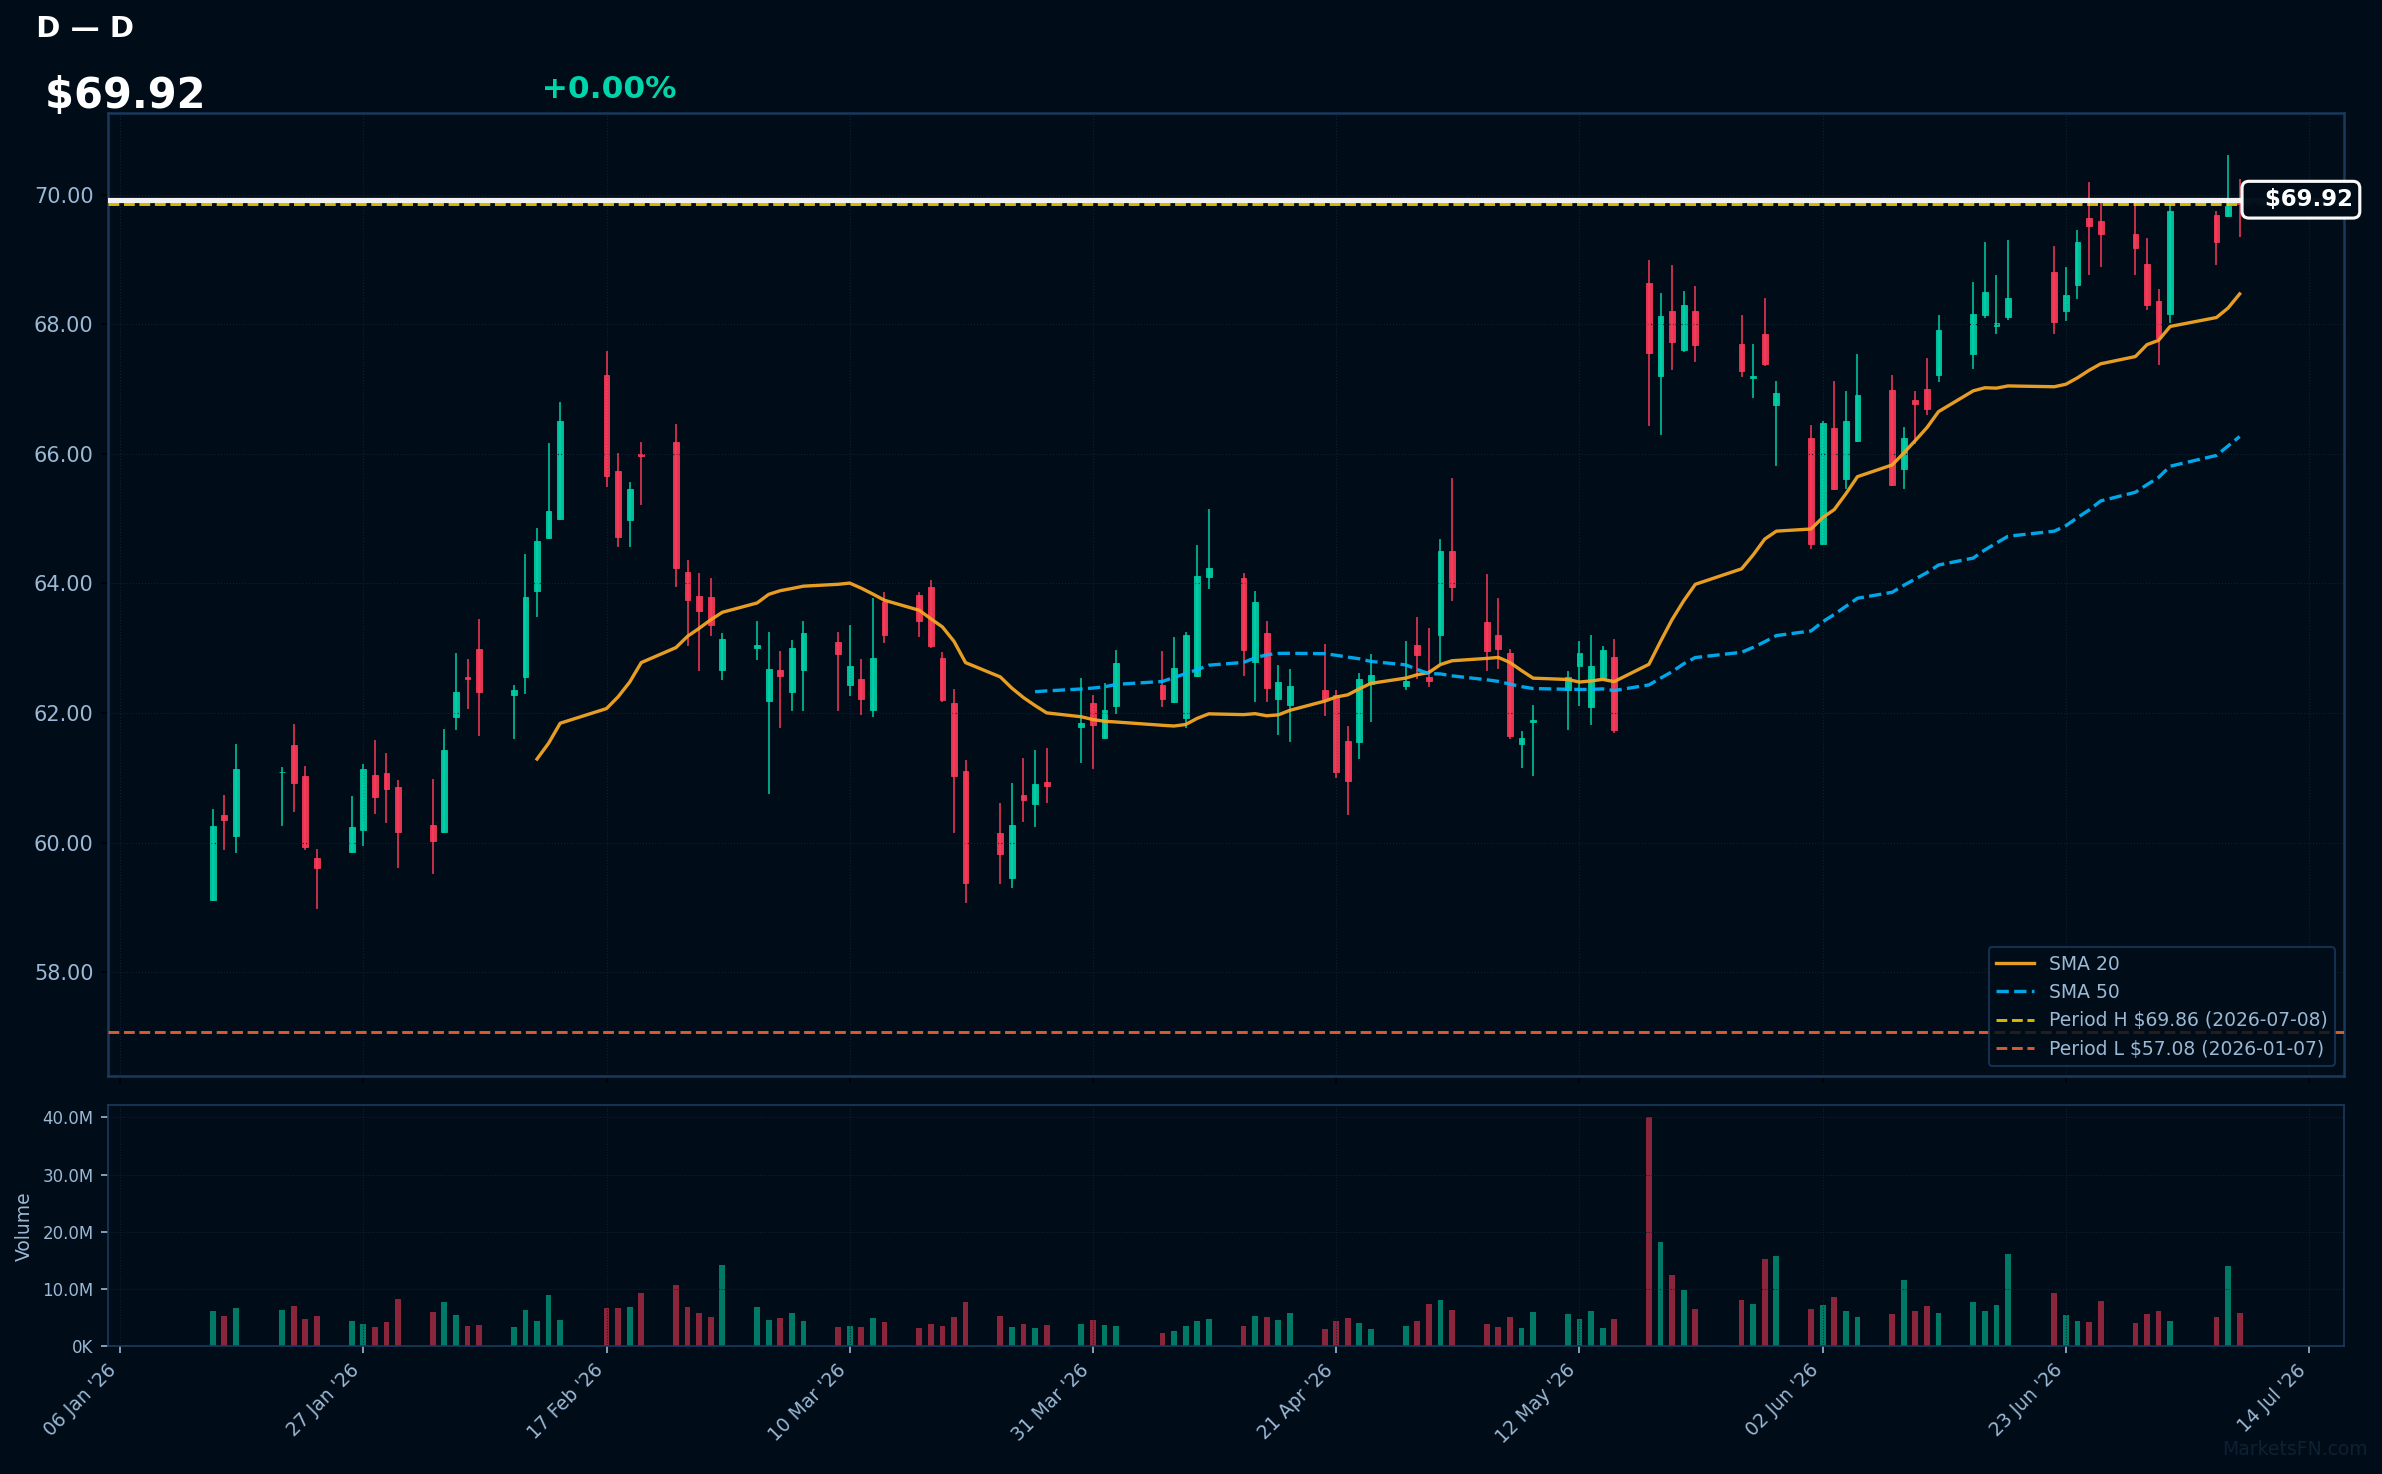
D | Dominion Energy Inc | Utilities | Price Last: $69.86 | % Realized: +17.93% | RSI: 61.6 | % above MA200: +11.8% | Trend: Above MA20, MA50, MA200
Dominion Energy Inc is a utility company that generates and distributes electricity and natural gas. Investors should care because its stable cash flows and dividend yield can provide a defensive component to a portfolio, while its infrastructure investments drive growth.
Dominion Energy Inc's current technical situation indicates momentum, with RSI(14) at 61.6 and a bullish MA alignment (price > MA20 > MA50 > MA200), suggesting a sustained uptrend. The stock is near its 2026 YTD high, 0.0% below, indicating a potential breakout level.
Related headlines
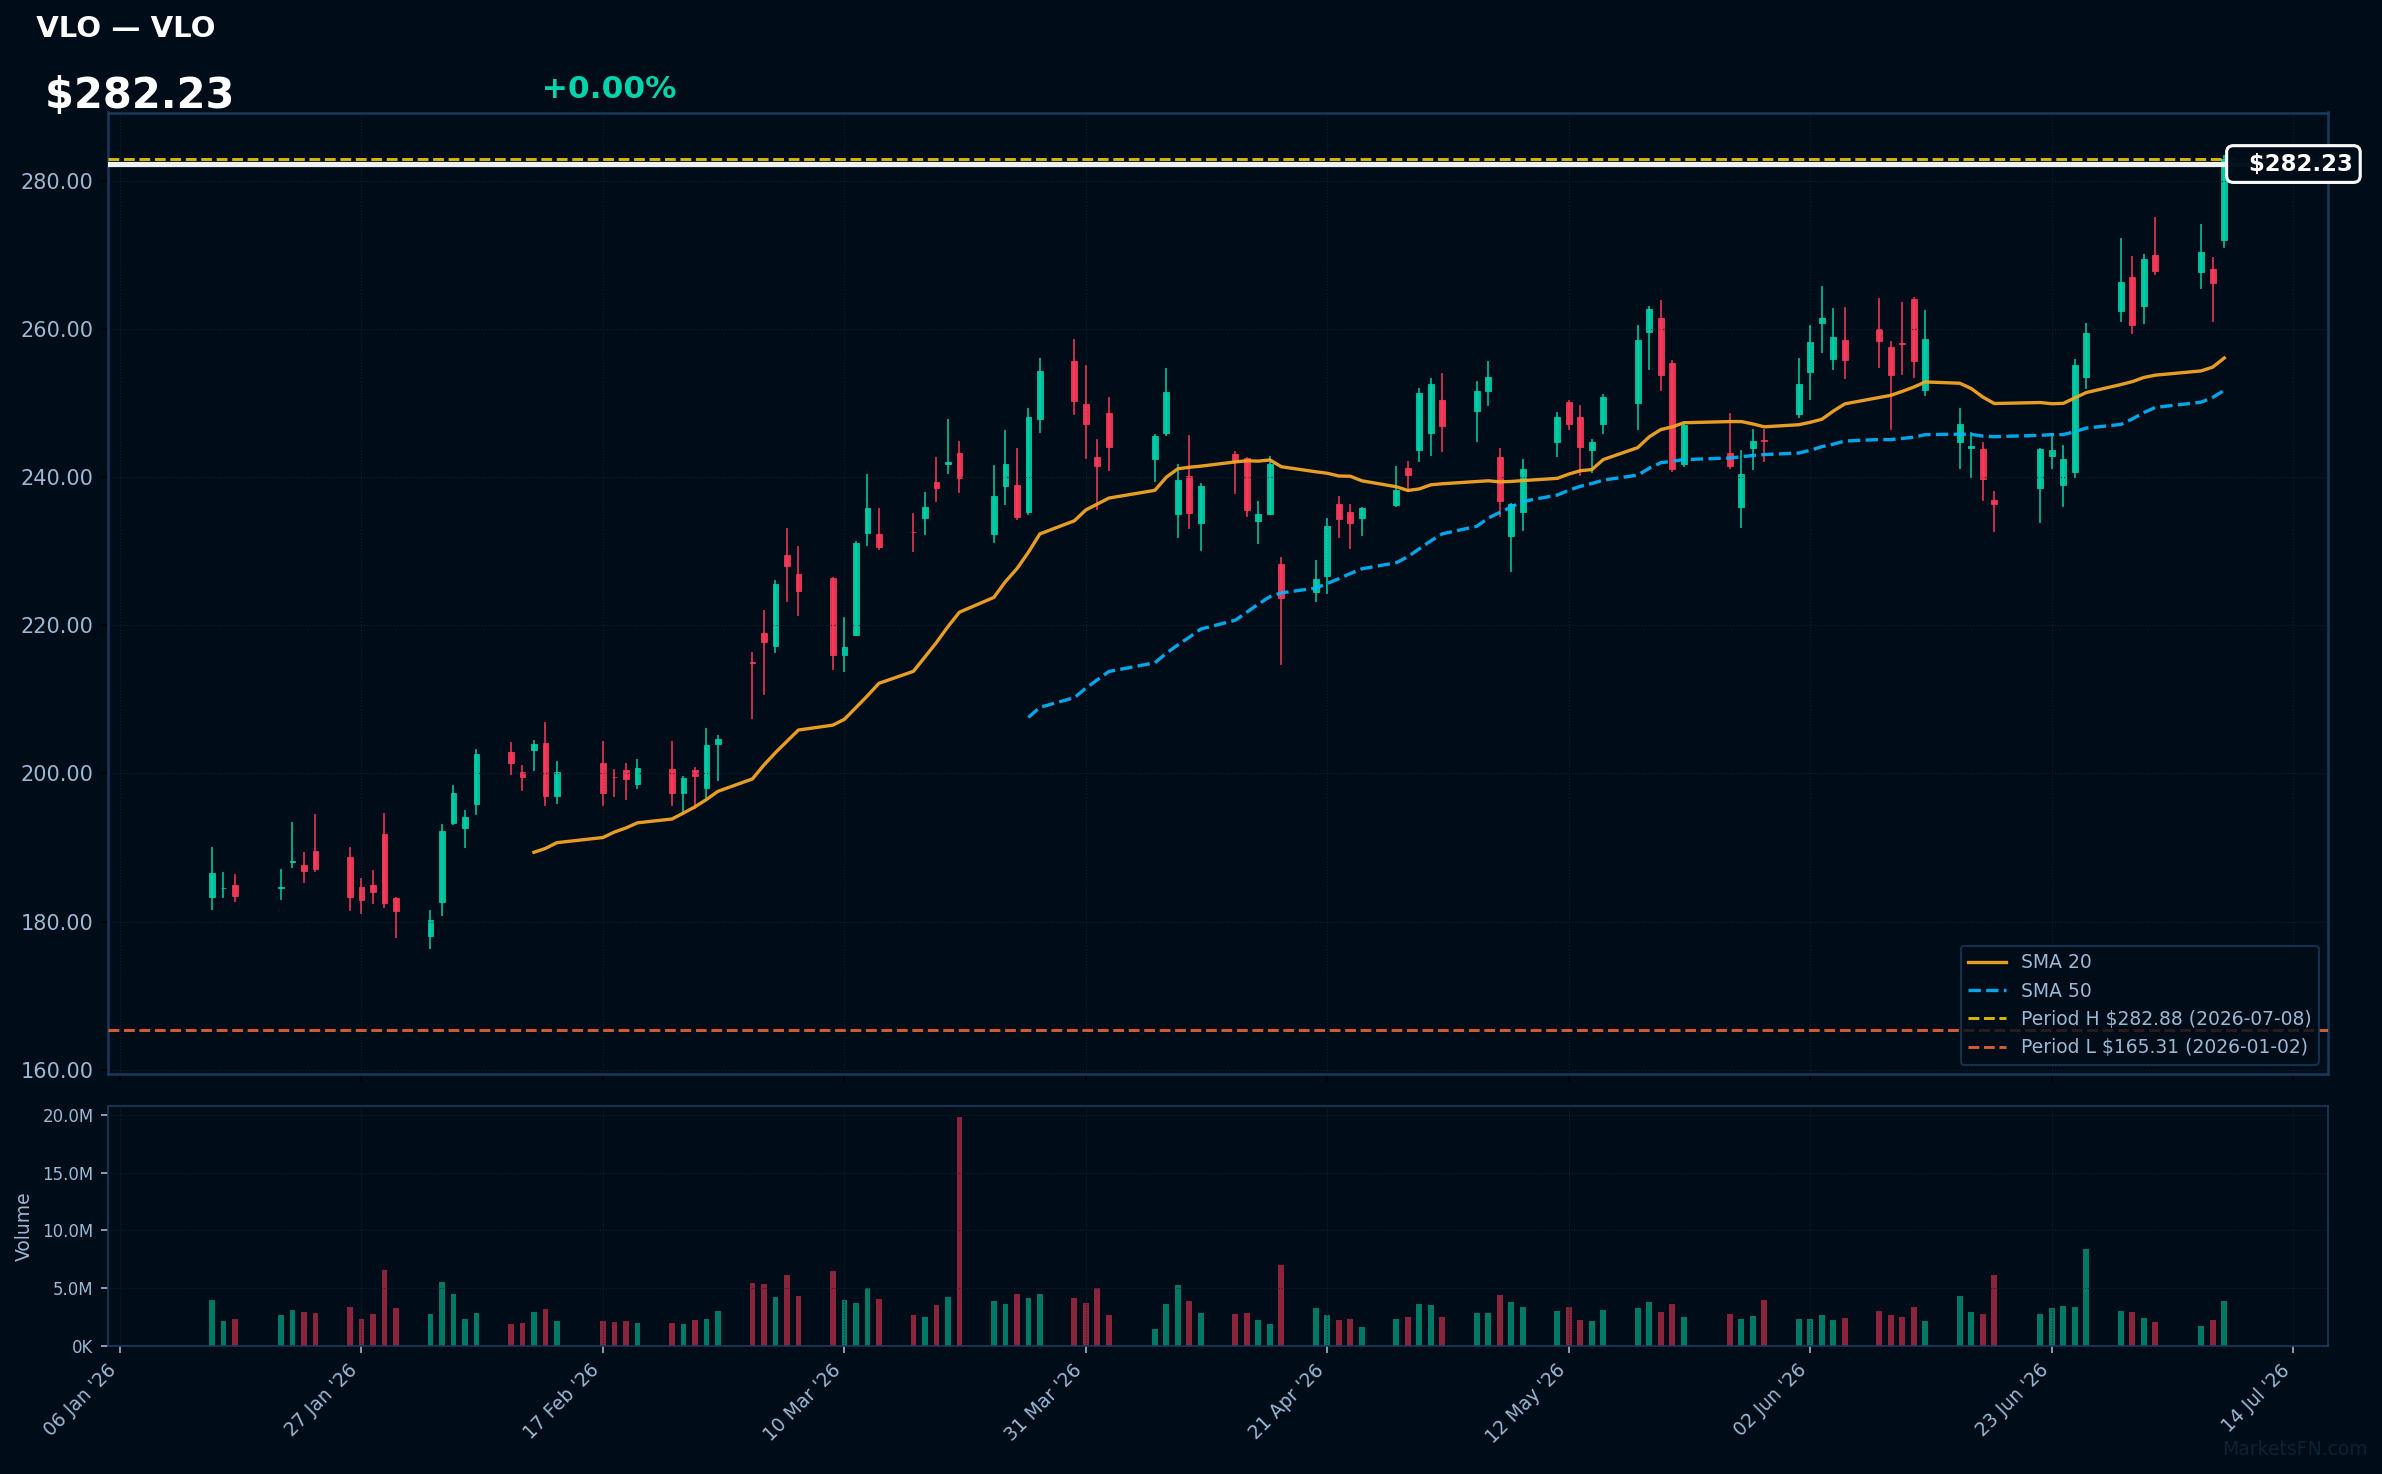
VLO | Valero Energy Corp | Energy | Price Last: $282.88 | % Realized: +71.12% | RSI: 66.8 | % above MA200: +36.3% | Trend: Above MA20, MA50, MA200
Valero Energy Corp is a refining company that operates a significant number of refineries, producing fuels such as gasoline and diesel. Investors should care because its refining operations are closely tied to energy demand and margin fluctuations.
Valero Energy Corp's current technical situation indicates sustained uptrend momentum with RSI(14) at 66.8 and a bullish MA alignment: price ($282.23) > MA20 > MA50 > MA200, near a potential breakout at its 2026 YTD high.
Related headlines
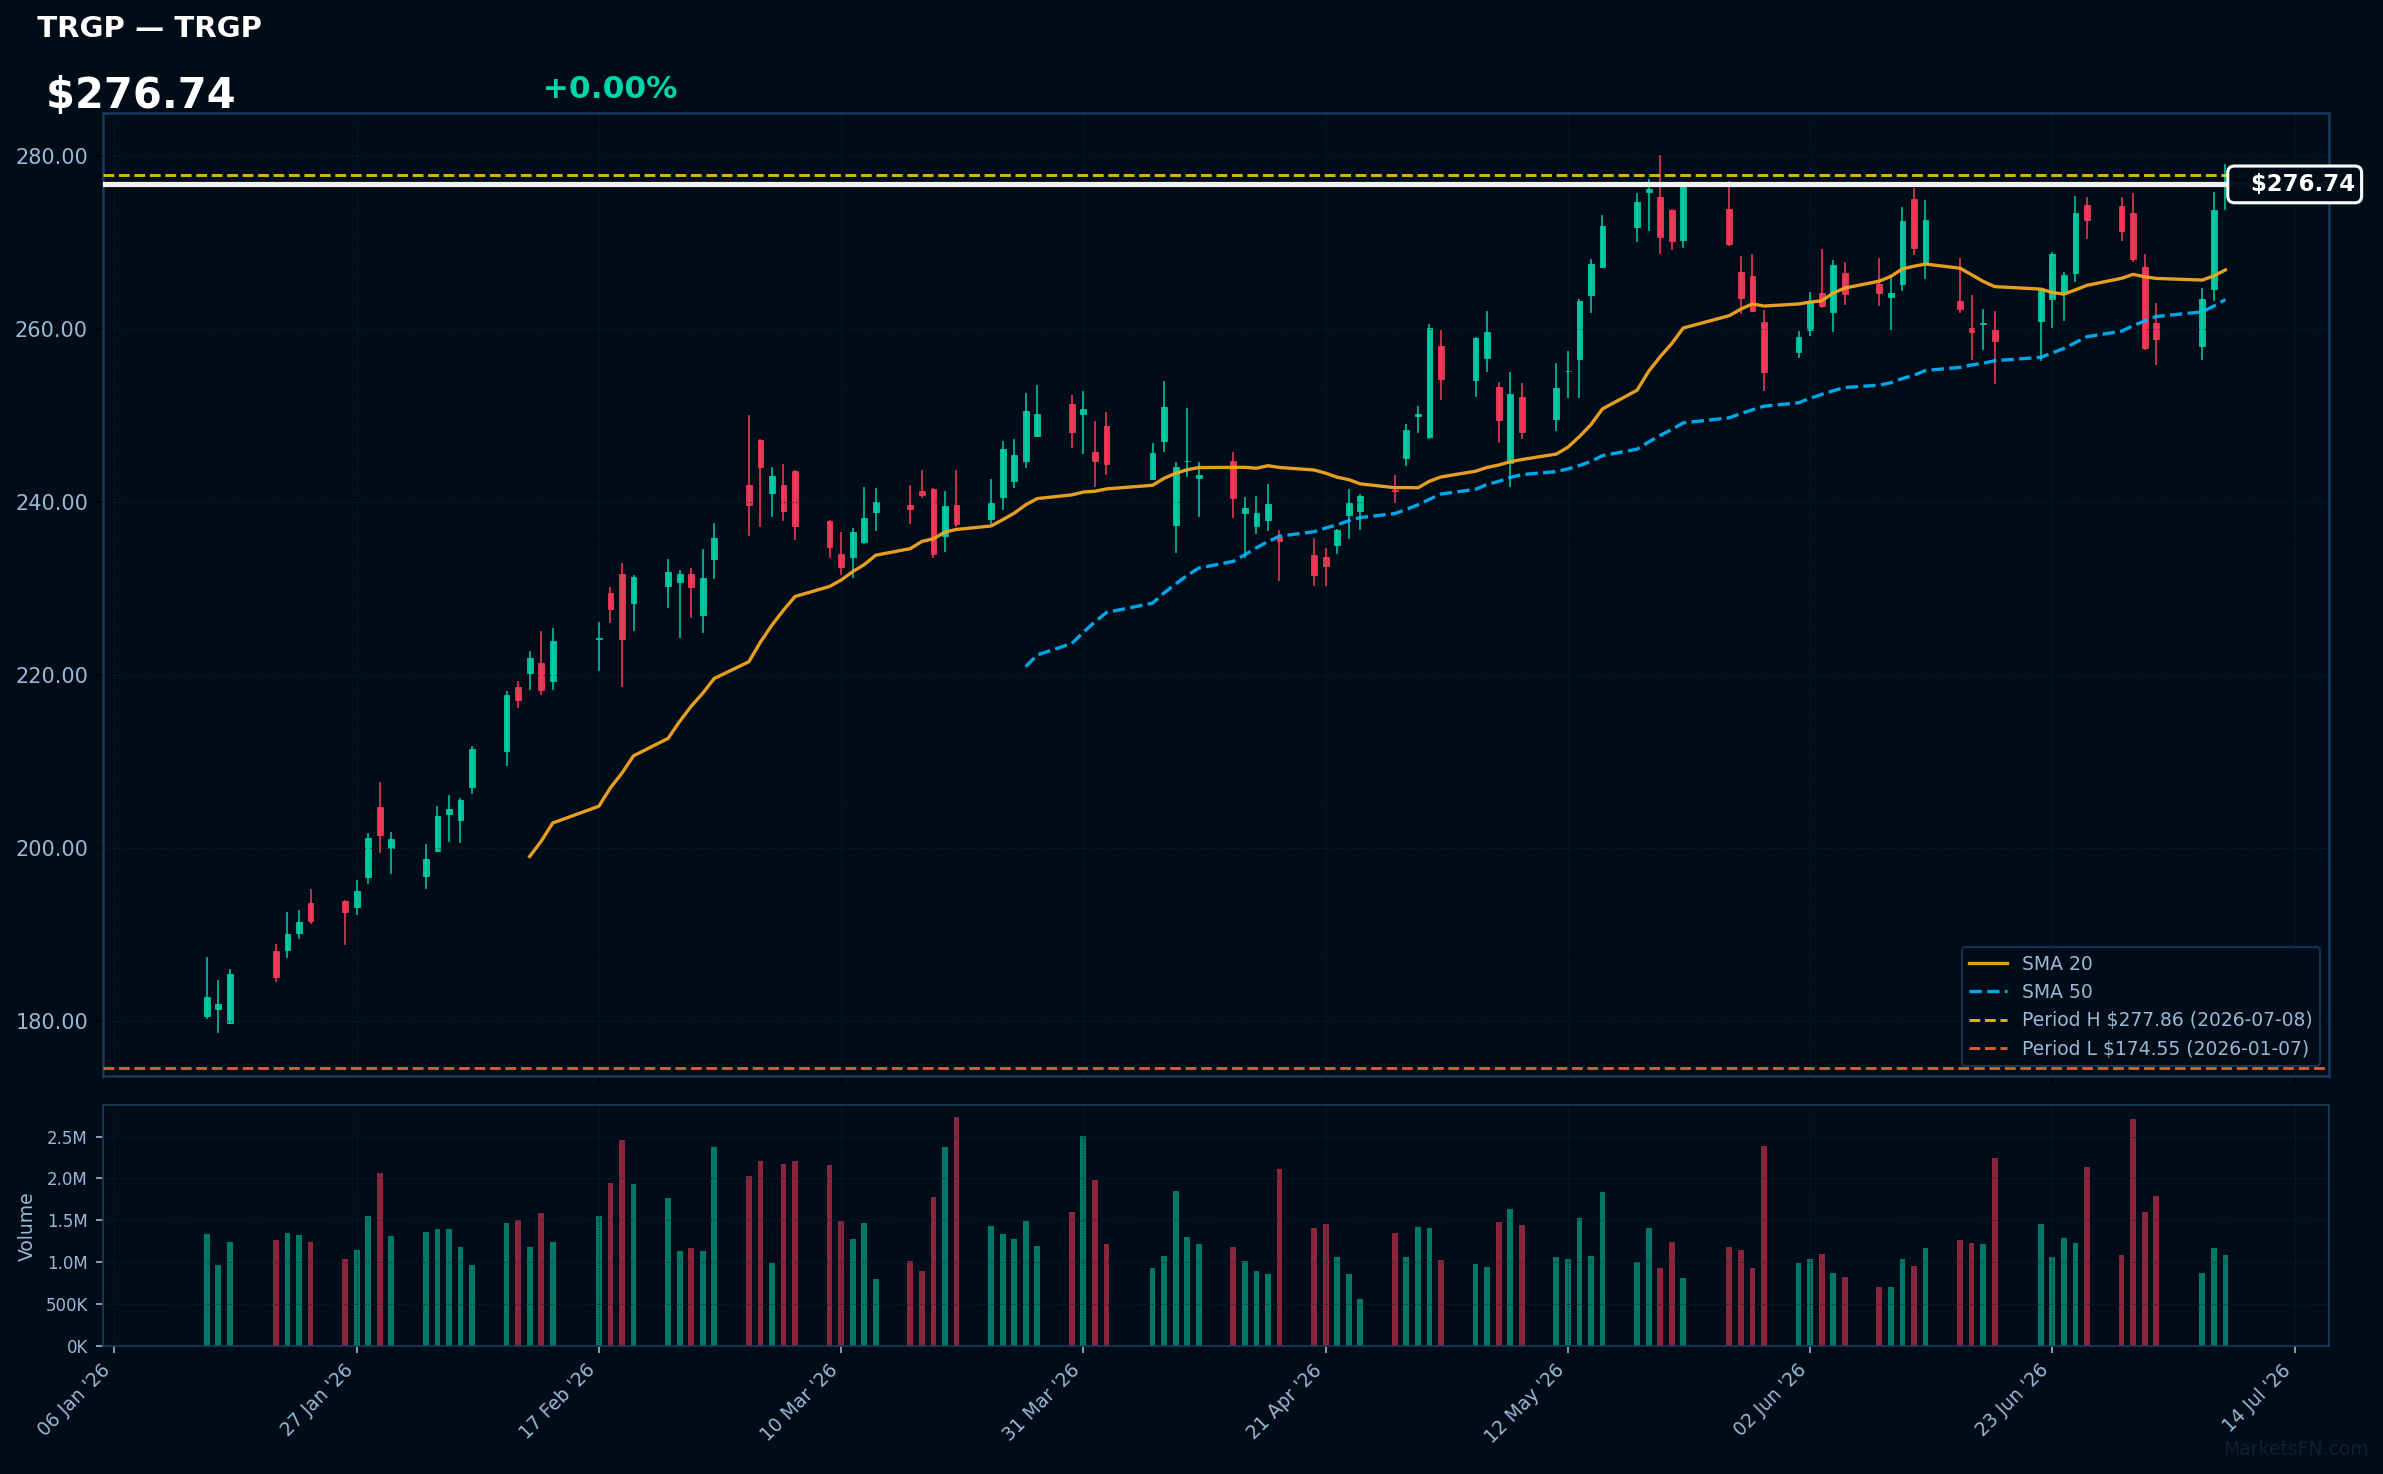
TRGP | Targa Resources Corp | Energy | Price Last: $277.86 | % Realized: +48.77% | RSI: 59.4 | % above MA200: +30.0% | Trend: Above MA20, MA50, MA200
Targa Resources Corp is a midstream energy company that provides infrastructure for natural gas and liquids processing, transportation, and storage. Investors should care because its performance is tied to energy demand and commodity prices.
Targa Resources Corp shows bullish technicals with RSI(14) at 59.4 and a sustained uptrend as price ($276.74) > MA20 > MA50 > MA200. It's near its 2026 YTD high, up 48.8% YTD, indicating strong momentum.
Related headlines
- Targa Resources Corp. Q1 2026 Earnings Call Summary
- Targa Resources Corp. Reports Record First Quarter 2026 Financial Results and Increases Financial Outlook for 2026
- Targa Resources Corp. Declares Increase to Quarterly Common Dividend and Announces Timing of First Quarter 2026 Earnings Webcast
- Targa Resources Stock: Is TRGP Underperforming the Energy Sector?
📉 Nearest to 2026 Low
Sectors represented: Real Estate (2), Consumer Defensive (1), Consumer Cyclical (1), Communication Services (1)
| Ticker | Company | Sector | Price Last | % Realized | 2026 YTD Low Date | RSI | % above MA200 | Trend |
|---|---|---|---|---|---|---|---|---|
| VICI | VICI Properties Inc | Real Estate | $26.09 | -7.32% | 2026-06-22 | 38.4 | -9.5% | Below MA20, MA50, MA200 |
| STZ | Constellation Brands Inc | Consumer Defensive | $130.34 | -7.67% | 2026-07-08 | 32.6 | -10.6% | Below MA20, MA50, MA200 |
| WY | Weyerhaeuser Co | Real Estate | $22.46 | -5.63% | 2026-07-08 | 35.1 | -7.0% | Below MA20, MA50, MA200 |
| HAS | Hasbro, Inc | Consumer Cyclical | $75.86 | -8.57% | 2026-07-08 | 28.1 | -12.2% | Below MA20, MA50, MA200 |
| WBD | Warner Bros. Discovery Inc | Communication Services | $26.15 | -8.28% | 2026-07-06 | 40.8 | +1.0% | Above MA200 · Below MA20, MA50 |
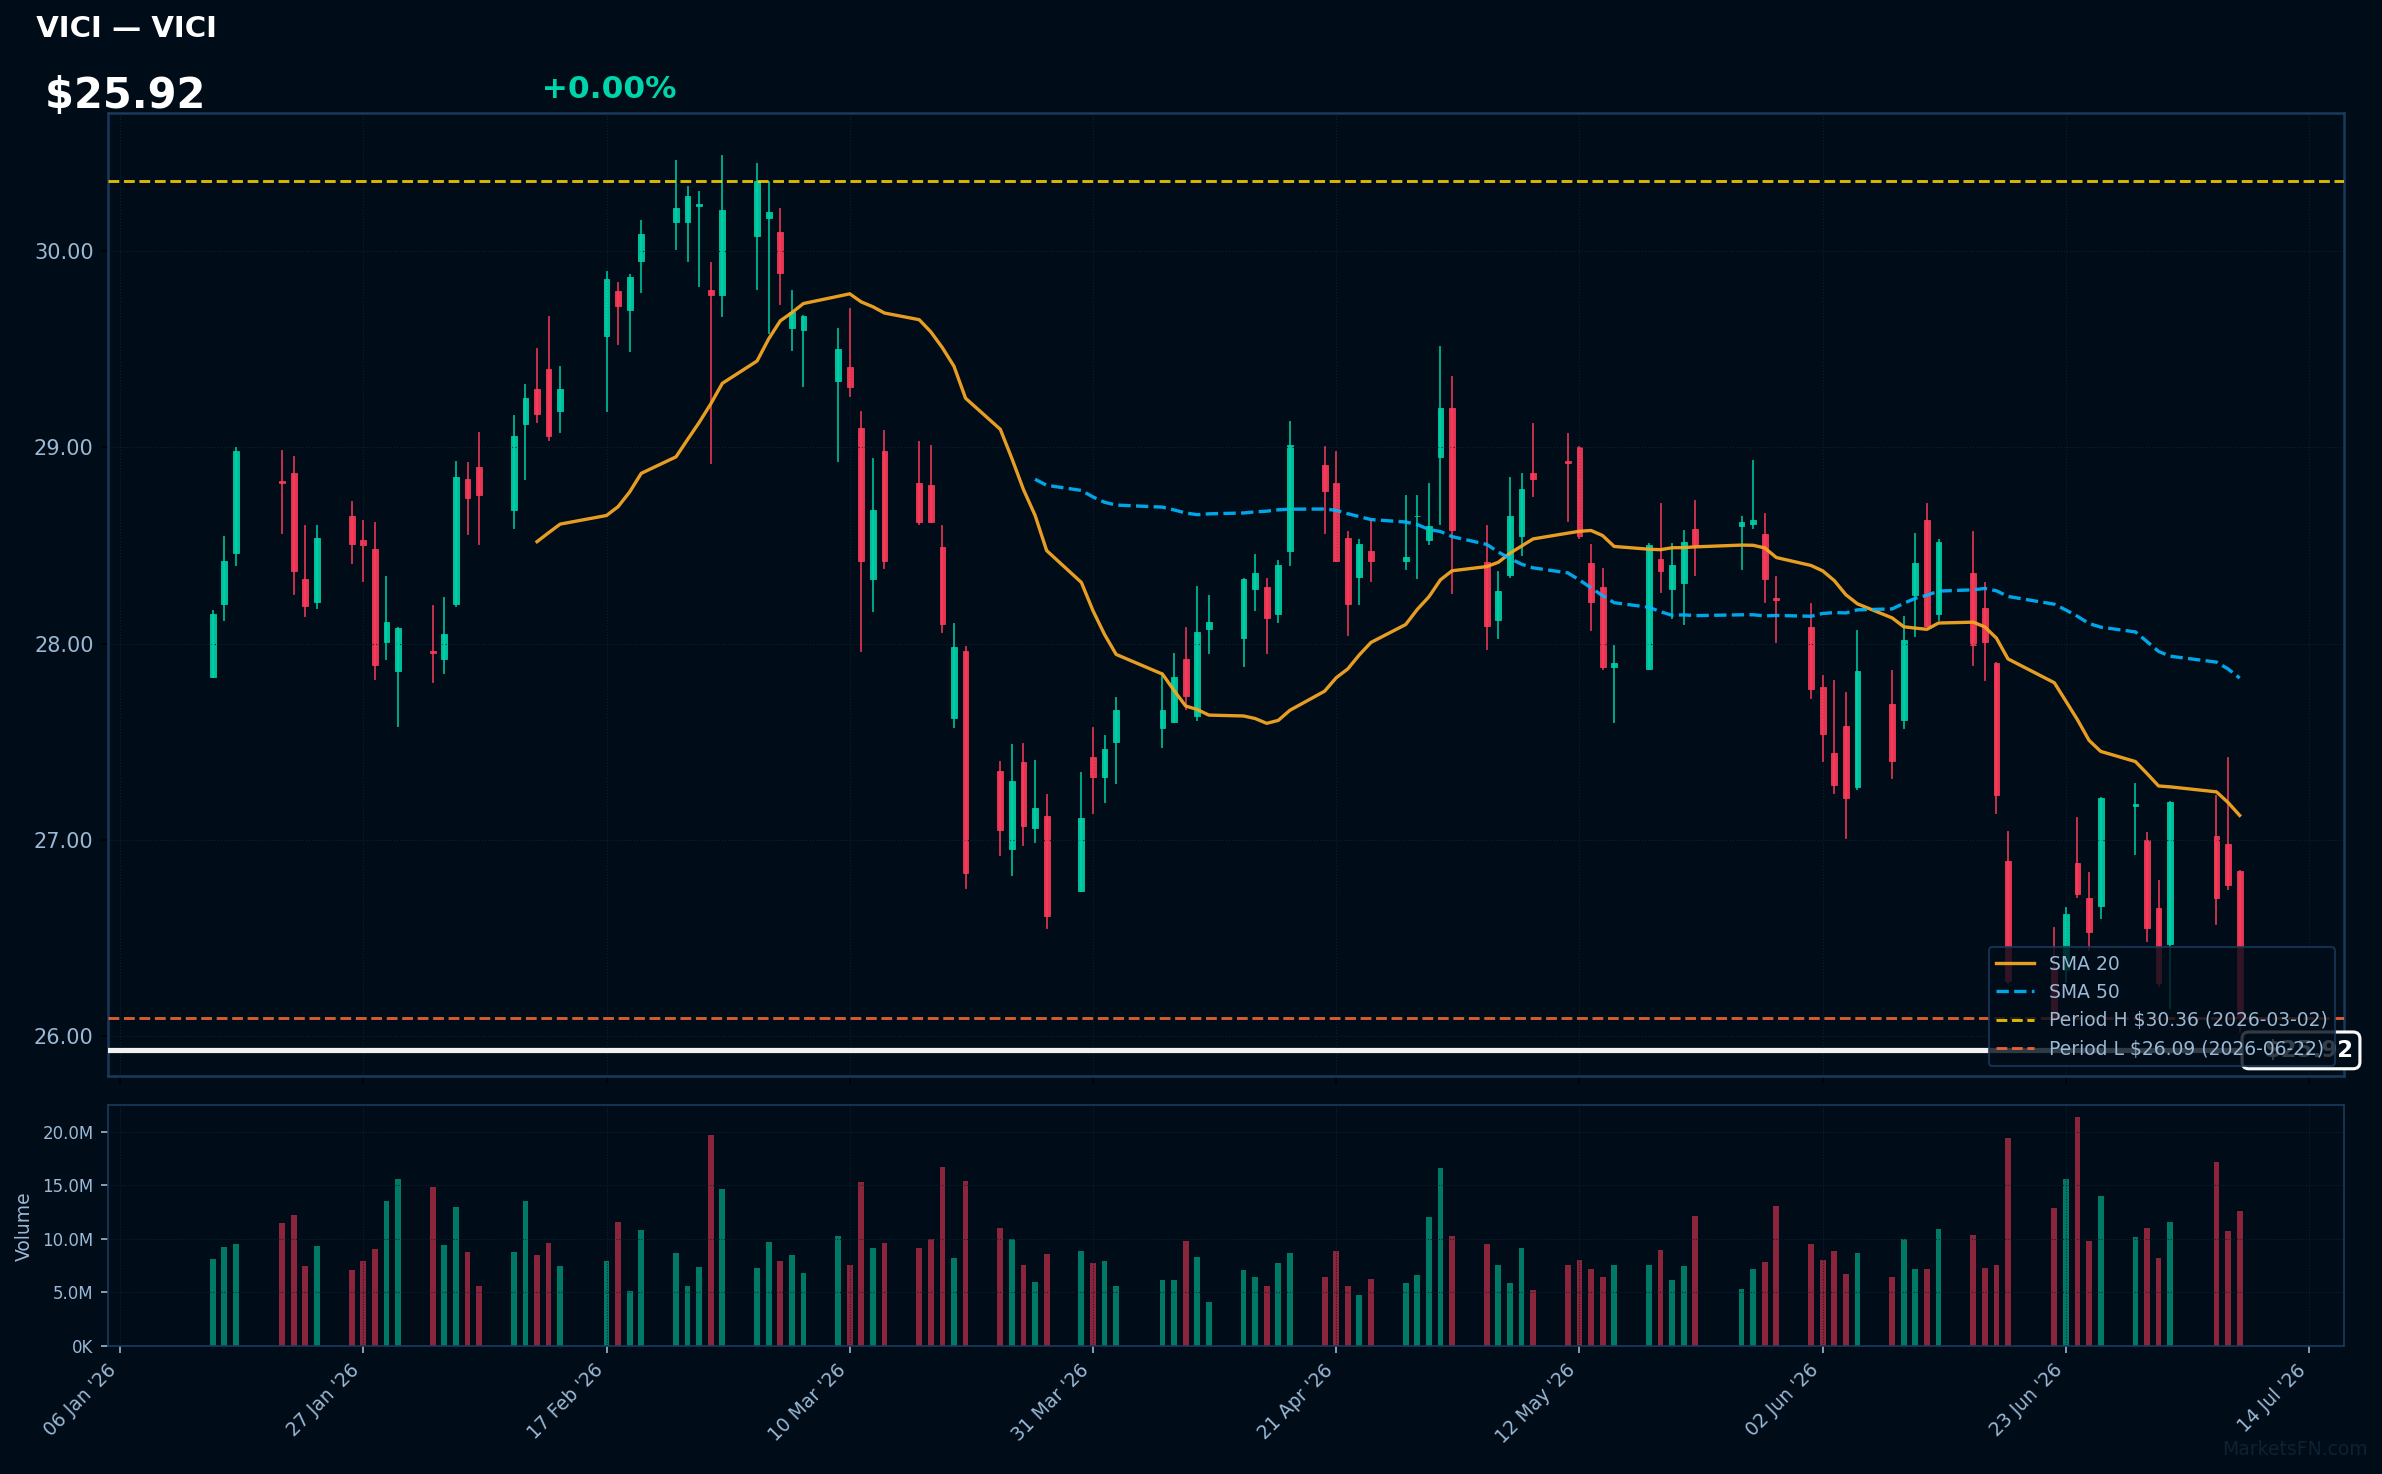
VICI | VICI Properties Inc | Real Estate | Price Last: $26.09 | % Realized: -7.32% | RSI: 38.4 | % above MA200: -9.5% | Trend: Below MA20, MA50, MA200
VICI Properties Inc is a real estate investment trust (REIT) that owns and acquires entertainment, hospitality, and gaming properties. Investors should care because its performance is tied to the recovery and growth of these sectors.
VICI is testing major support with its price 0.0% above its 2026 YTD low. The RSI(14) is 38.4, and the MA alignment is bearish (price < MA20 < MA50 < MA200), indicating a sustained downtrend and potential further decline.
Related headlines
- VICI Properties Inc. Announces Release Date for Second Quarter 2026 Results
- VICI Properties Inc. Completes Sale-Leaseback of Canadian Portfolio in Connection With Pure Casino Entertainment's Acquisition of Gamehost
- VICI Properties and Club Med Announce Acquisition and Redevelopment of Carambola Beach Resort in St. Croix
- CLUB MED ADVANCES STRATEGIC NORTH AMERICAN EXPANSION WITH THE REDEVELOPMENT OF CARAMBOLA BEACH RESORT IN ST. CROIX IN PARTNERSHIP WITH VICI PROPERTIES
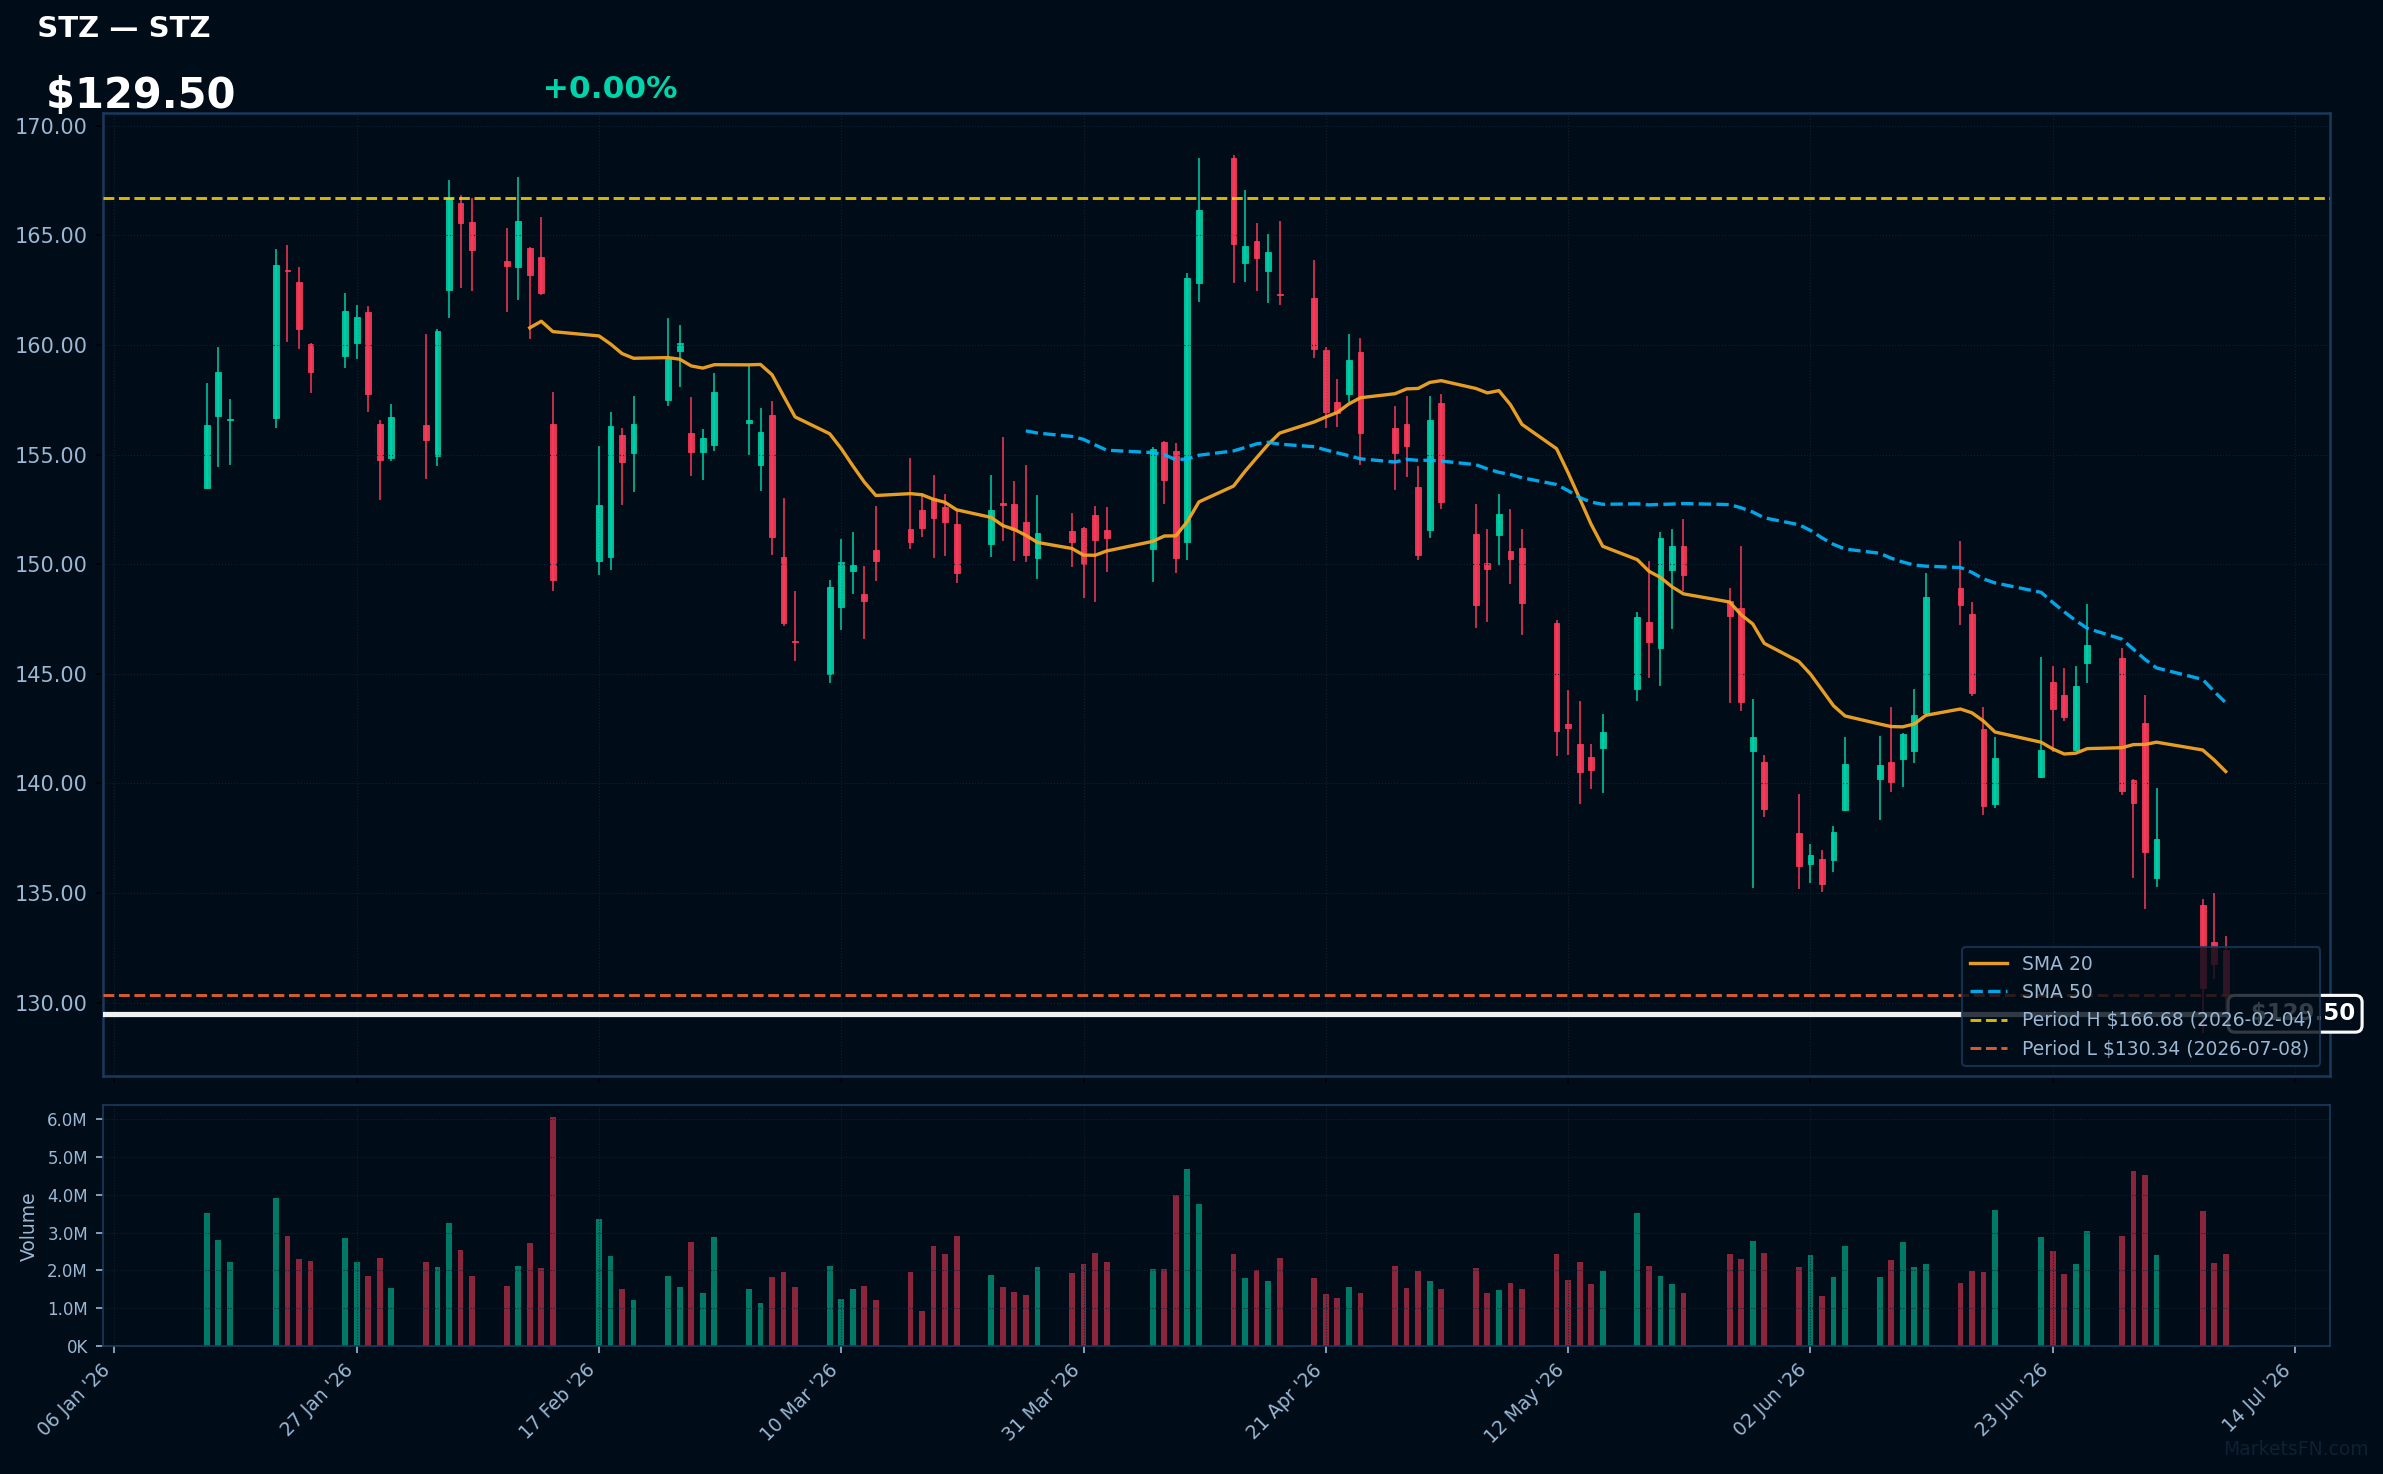
STZ | Constellation Brands Inc | Consumer Defensive | Price Last: $130.34 | % Realized: -7.67% | RSI: 32.6 | % above MA200: -10.6% | Trend: Below MA20, MA50, MA200
Constellation Brands Inc is a leading beverage alcohol company owning prominent beer brands like Corona and Modelo, and wine brands like Robert Mondavi and Kim Crawford, making it a significant player in the global alcoholic beverages market.
Constellation Brands Inc is testing major support at its 2026 YTD low with an RSI(14) of 32.6, indicating oversold conditions, and a bearish MA alignment (price < MA20 < MA50 < MA200), suggesting a sustained downtrend, potentially a warning sign for investors.
Related headlines
- You may want to start a position in Constellation Brands, says Jim Cramer
- Constellation Brands Inc. Cl A stock underperforms Monday when compared to competitors
- Constellation Brands Inc (STZ) Q1 2027 Earnings Call Highlights: Navigating Growth Amid Volatility
- Constellation's New Boss Sees Brighter Summer for Beer
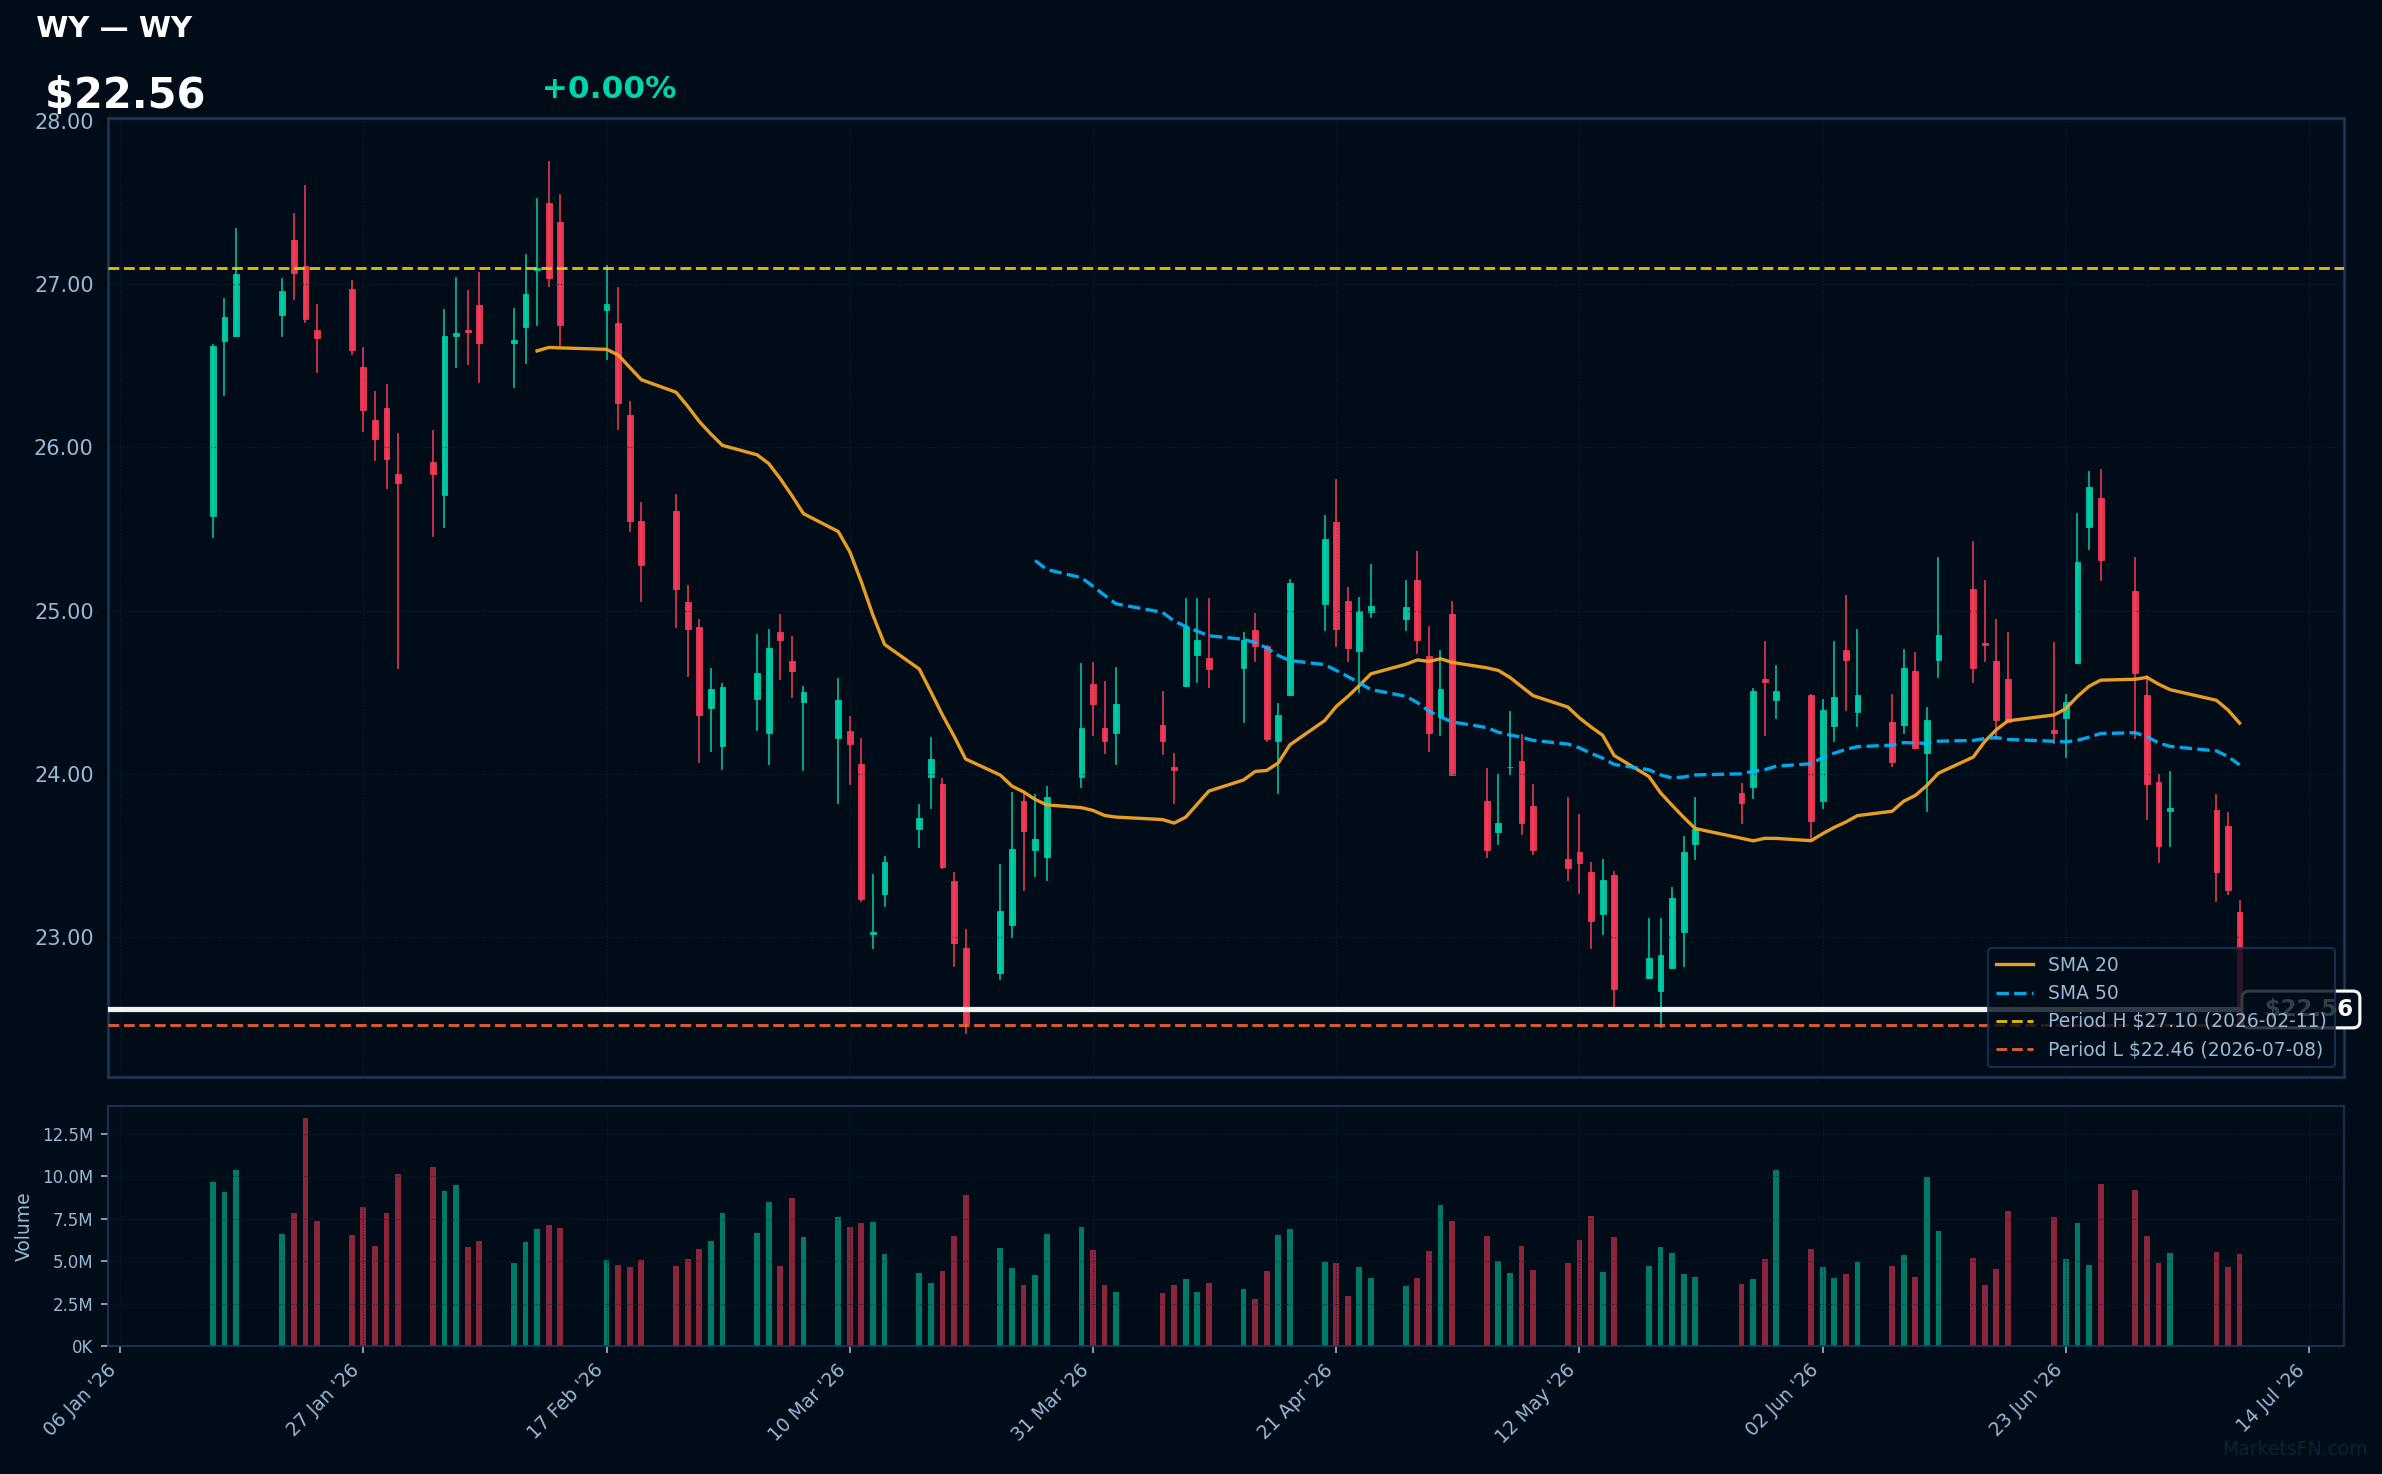
WY | Weyerhaeuser Co | Real Estate | Price Last: $22.46 | % Realized: -5.63% | RSI: 35.1 | % above MA200: -7.0% | Trend: Below MA20, MA50, MA200
Weyerhaeuser Co is a timberlands owner and manager, engaging in harvesting and selling timber, and constructing and selling homes. Investors should care due to its exposure to the housing market and timber demand fluctuations.
Weyerhaeuser Co's RSI is 35.1, indicating potential oversold conditions. The stock is below its MA20, MA50, and MA200, showing mixed signals. It's 0.0% above its 2026 YTD low, testing major support, a potential warning sign.
Related headlines
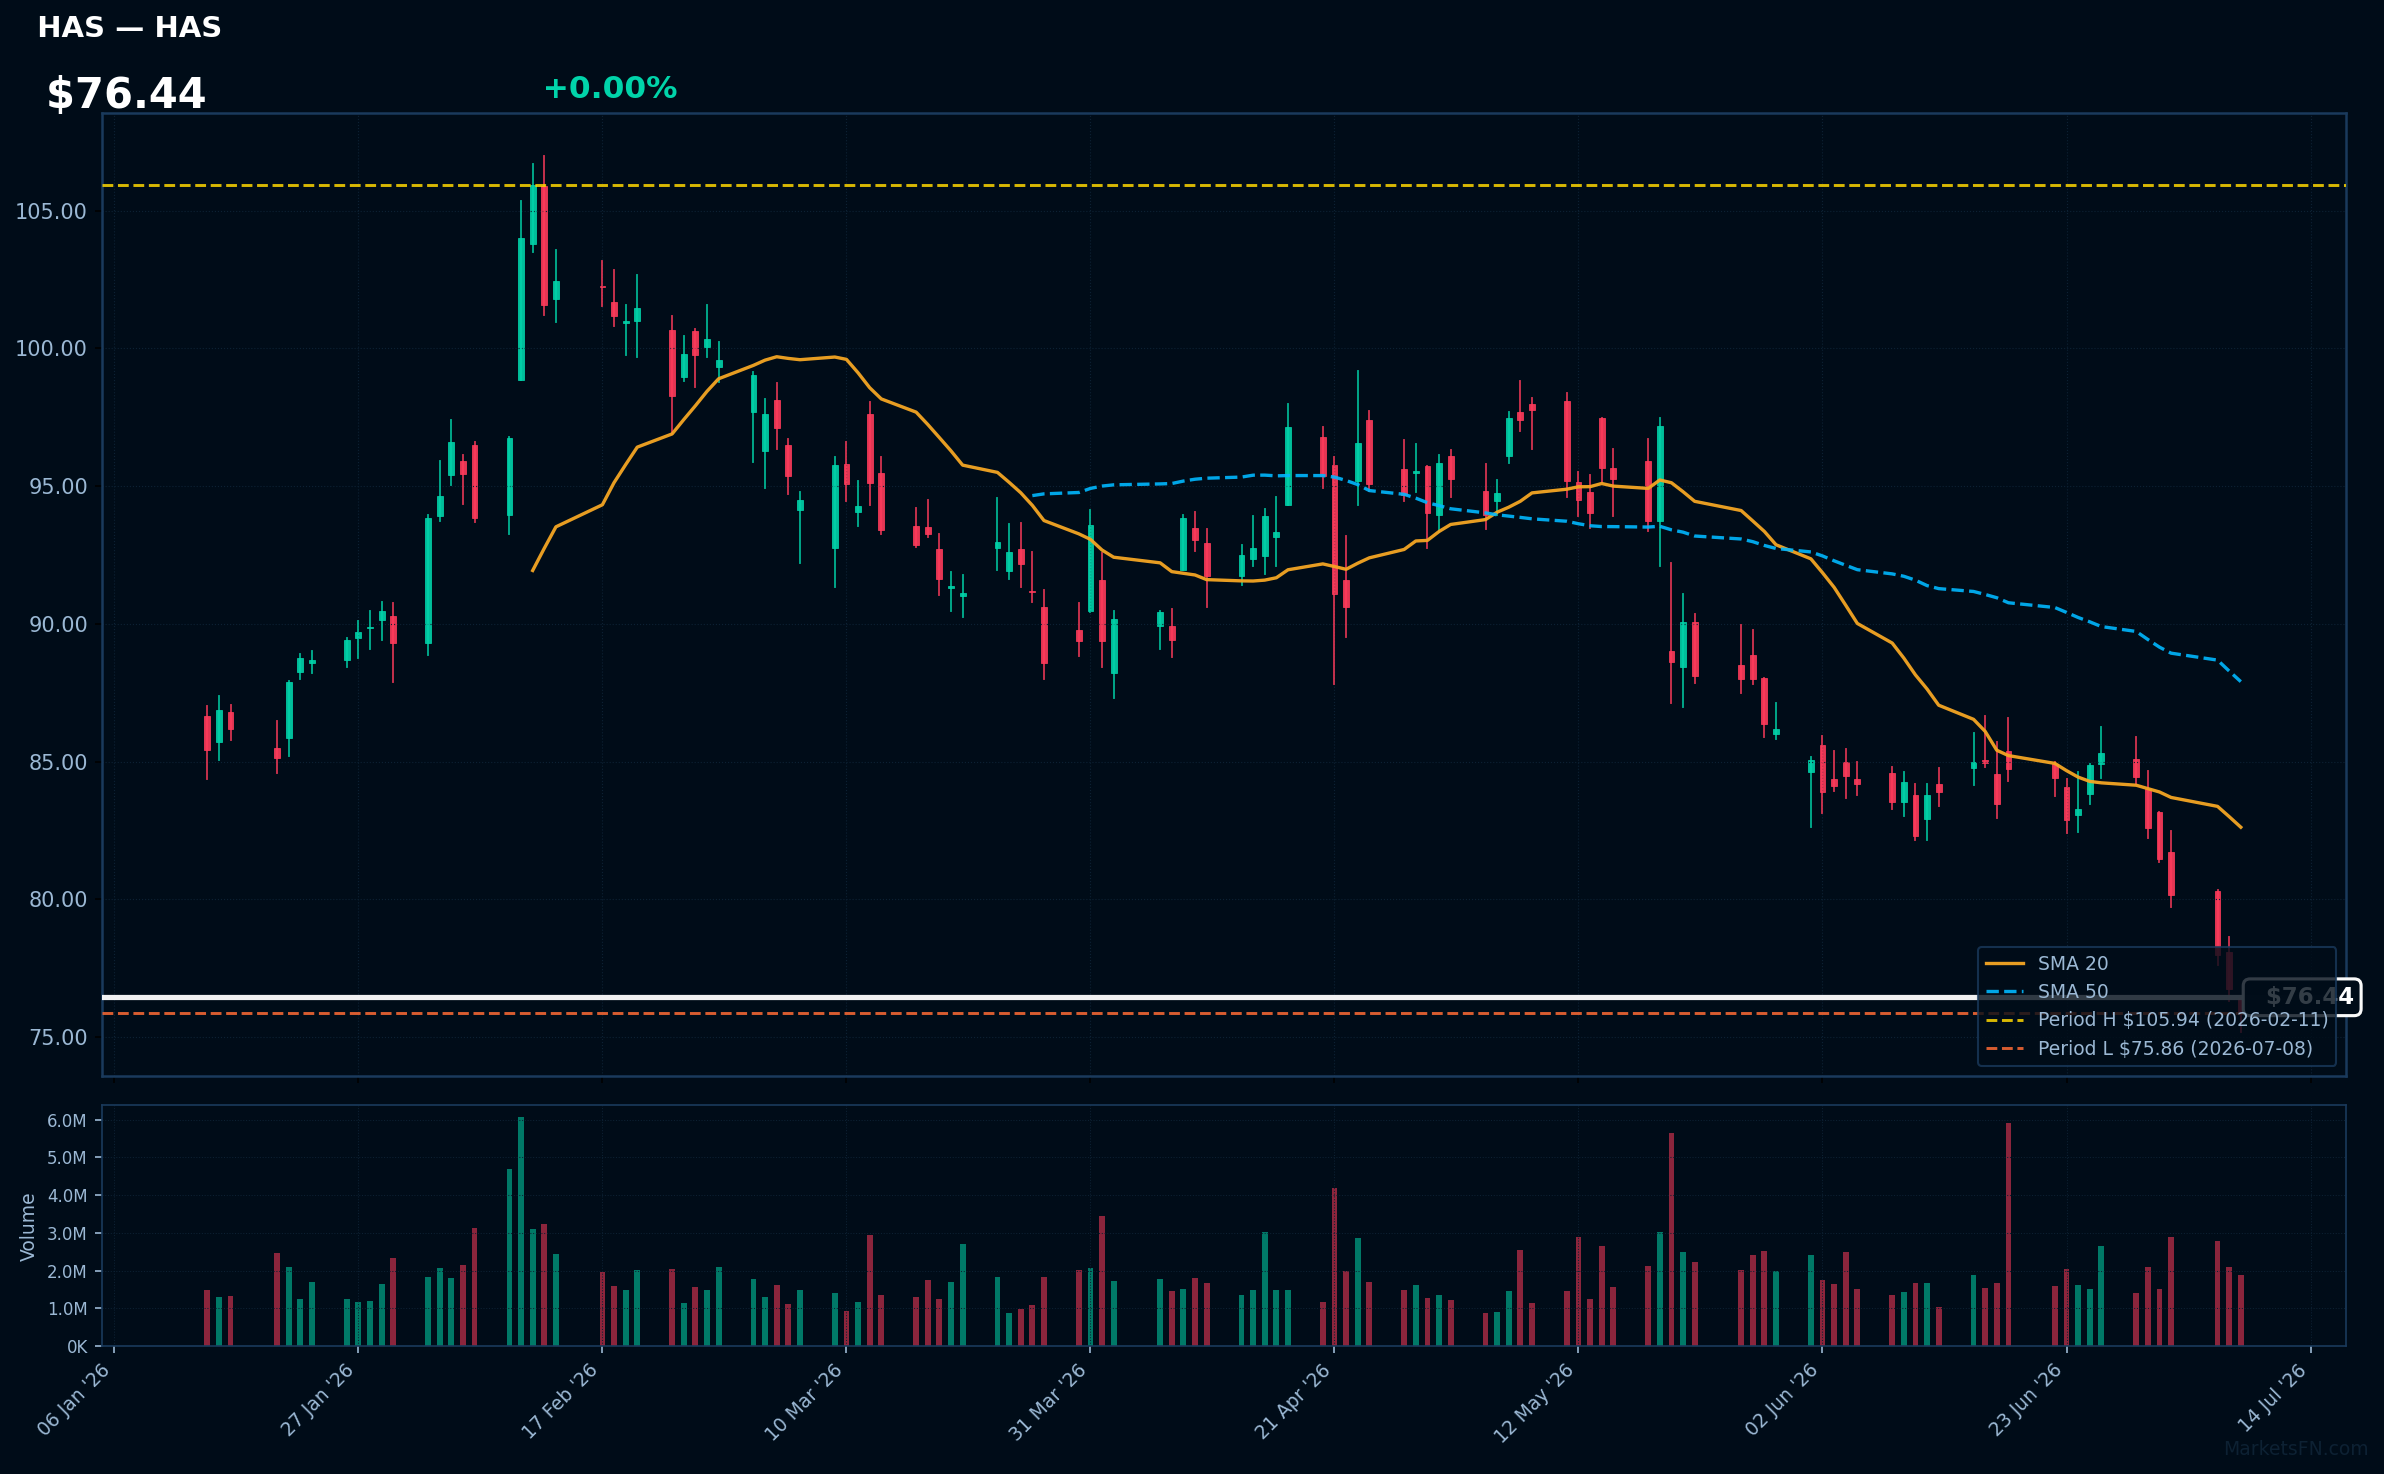
HAS | Hasbro, Inc | Consumer Cyclical | Price Last: $75.86 | % Realized: -8.57% | RSI: 28.1 | % above MA200: -12.2% | Trend: Below MA20, MA50, MA200
Hasbro, Inc (HAS) is a global play and entertainment company that designs, manufactures, and markets consumer products, including brands like Transformers, My Little Pony, and Nerf. Investors care about its ability to innovate and maintain market share in a competitive toy industry.
Hasbro's technical situation is bearish, with an RSI(14) of 28.1 indicating oversold conditions and the stock below its MA20, MA50, and MA200, signaling potential further downside. It's currently 0.0% above its 2026 YTD low, testing major support.
Related headlines
- Hasbro to Announce Second Quarter 2026 Earnings on July 21, 2026
- Hasbro Named to The Civic 50 for 14th Consecutive Year, Extending Unmatched Record of Corporate Citizenship Leadership
- Why Hasbros Gina Goetter sees finance and operations as one role
- Optimus Prime will take your call: Hasbro leans into AI-driven licensing
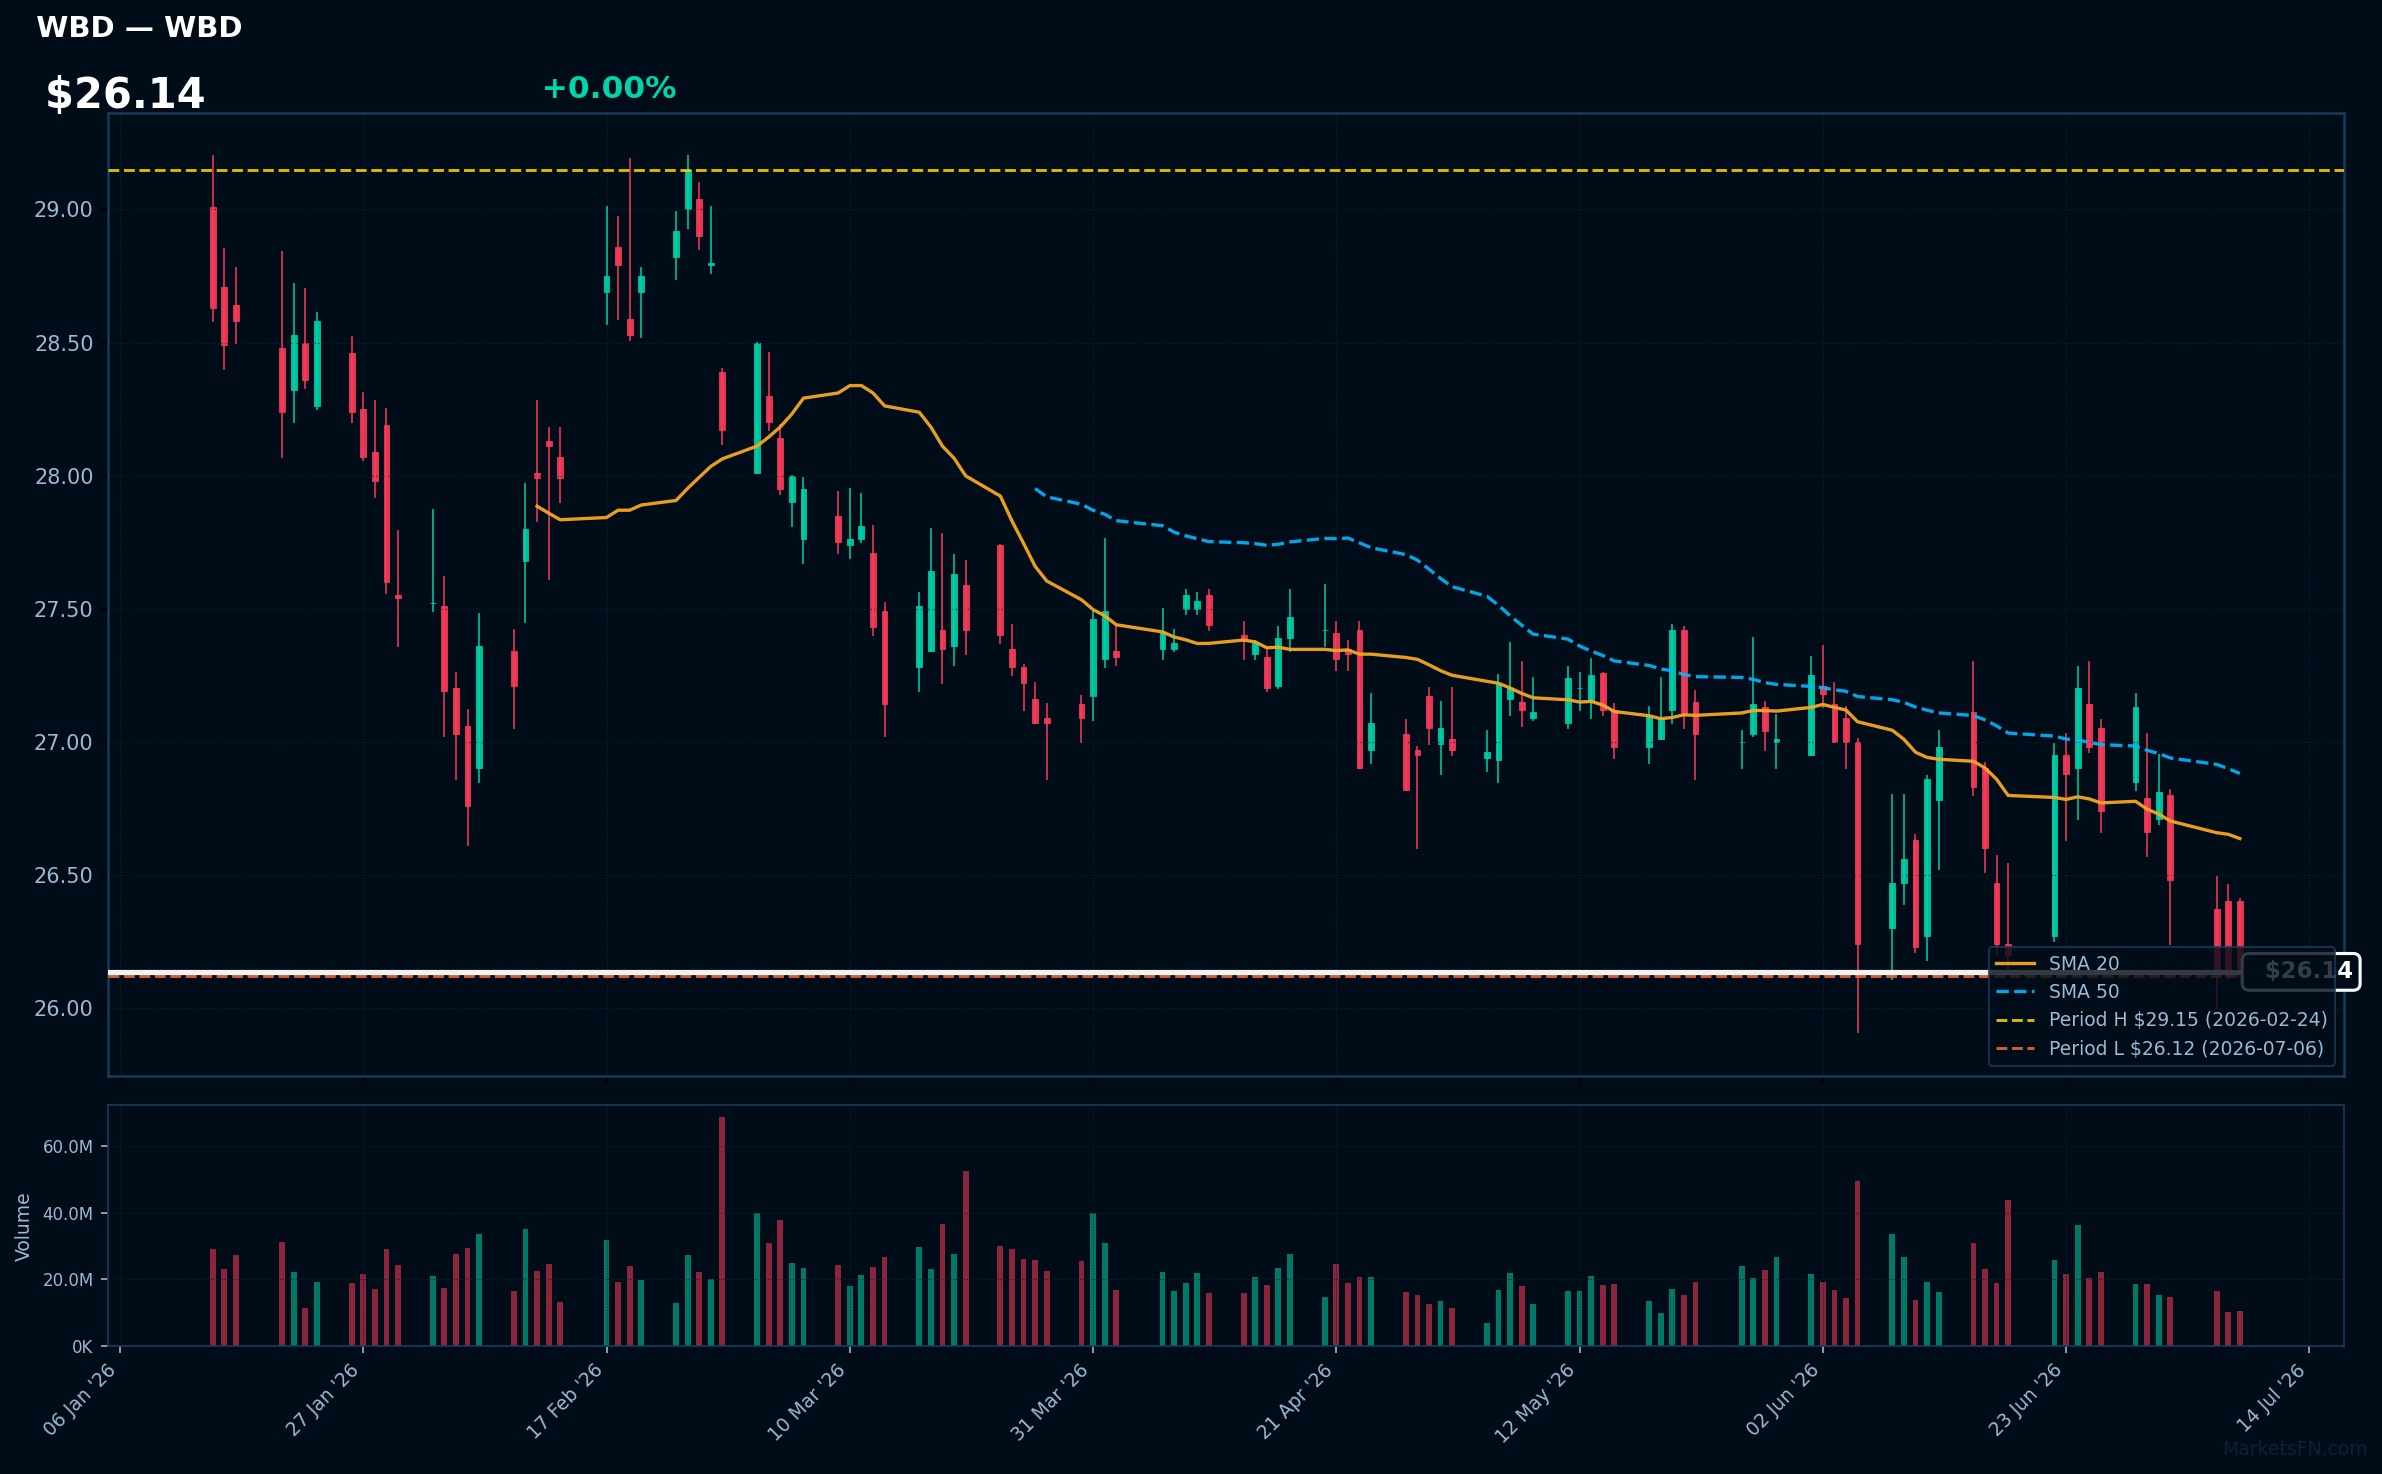
WBD | Warner Bros. Discovery Inc | Communication Services | Price Last: $26.15 | % Realized: -8.28% | RSI: 40.8 | % above MA200: +1.0% | Trend: Above MA200 · Below MA20, MA50
Warner Bros. Discovery Inc is a media conglomerate with significant holdings in film, television, and streaming through brands like HBO, Warner Bros., and Discovery. Investors should care due to its influence on entertainment trends and potential for streaming growth.
WBD's technicals indicate a warning sign: RSI(14) at 40.8 suggests bearish momentum, with price below MA20/MA50 but above MA200, showing mixed signals. The stock is 0.1% above its 2026 YTD low, testing major support.
Related headlines
Market Commentary
The S&P 500 stocks listed are currently trading near their year-to-date (YTD) extremes for 2026. Specifically, stocks like ANET, MPC, D, VLO, and TRGP are at their YTD highs, while VICI, STZ, WY, HAS, and WBD are near their YTD lows. This indicates that these stocks have either reached new highs or are struggling to move beyond their recent lows in 2026.
The stocks at their YTD highs are primarily from the energy sector (MPC, VLO, TRGP) and utilities (D), suggesting strong performance in these sectors. In contrast, the stocks near their YTD lows are from diverse sectors, including real estate (VICI), consumer staples (STZ), industrials (WY), consumer discretionary (HAS), and communication services (WBD). This divergence may indicate varying market conditions and sector-specific themes driving these movements.
Investors should monitor sector-specific news and earnings reports for these stocks, as well as broader market trends, to understand the sustainability of these extreme price levels. Watching how these stocks react to future market developments will be crucial in determining whether their current YTD extremes persist or reverse.
Methodology: All 503 S&P 500 constituents screened. Close prices downloaded from 2026-01-01. Period high = highest close since Jan 1 2026; period low = lowest close since Jan 1 2026. Distance = (current price / period extreme − 1) × 100. Technical indicators computed on up to 1 year of daily OHLCV data.
Disclaimer: For informational purposes only. Not investment advice. Past performance is not indicative of future results.

