Nasdaq 100 52-Week Highs & Lows Radar: CSX (CSX), O'Reilly Automotive, (ORLY) and more
MarketsFN Team

Nasdaq 100 52-Week Highs & Lows Radar: CSX (CSX), O'Reilly Automotive, (ORLY) and more
Screening all 101 Nasdaq 100 constituents for stocks nearest to their 52-week high and their 52-week low. Data as of July 09, 2026. % Realized = 52-week total return.
Legend: RSI > 70 = overbought · RSI < 30 = oversold · Green % Realized = positive 52W return · Red = negative.
📈 Nearest to 52-Week High
Sectors represented: Technology (2), Industrials (1), Communication Services (1), Consumer Cyclical (1)
| Ticker | Company | Sector | Price Last | % Realized | 52-Week High Date | RSI | % above MA200 | Trend |
|---|---|---|---|---|---|---|---|---|
| CSX | CSX Corp | Industrials | $49.03 | +47.10% | 2026-07-09 | 65.1 | +22.4% | Above MA20, MA50, MA200 |
| EA | Electronic Arts, Inc | Communication Services | $205.25 | +34.43% | 2026-07-01 | 63.7 | +1.9% | Above MA20, MA50, MA200 |
| SBUX | Starbucks Corp | Consumer Cyclical | $105.73 | +11.00% | 2026-05-15 | 60.7 | +13.5% | Above MA20, MA50, MA200 |
| FTNT | Fortinet Inc | Technology | $160.18 | +48.80% | 2026-07-06 | 65.9 | +69.1% | Above MA20, MA50, MA200 |
| AAPL | Apple Inc | Technology | $310.45 | +47.04% | 2026-06-02 | 59.4 | +14.1% | Above MA20, MA50, MA200 |
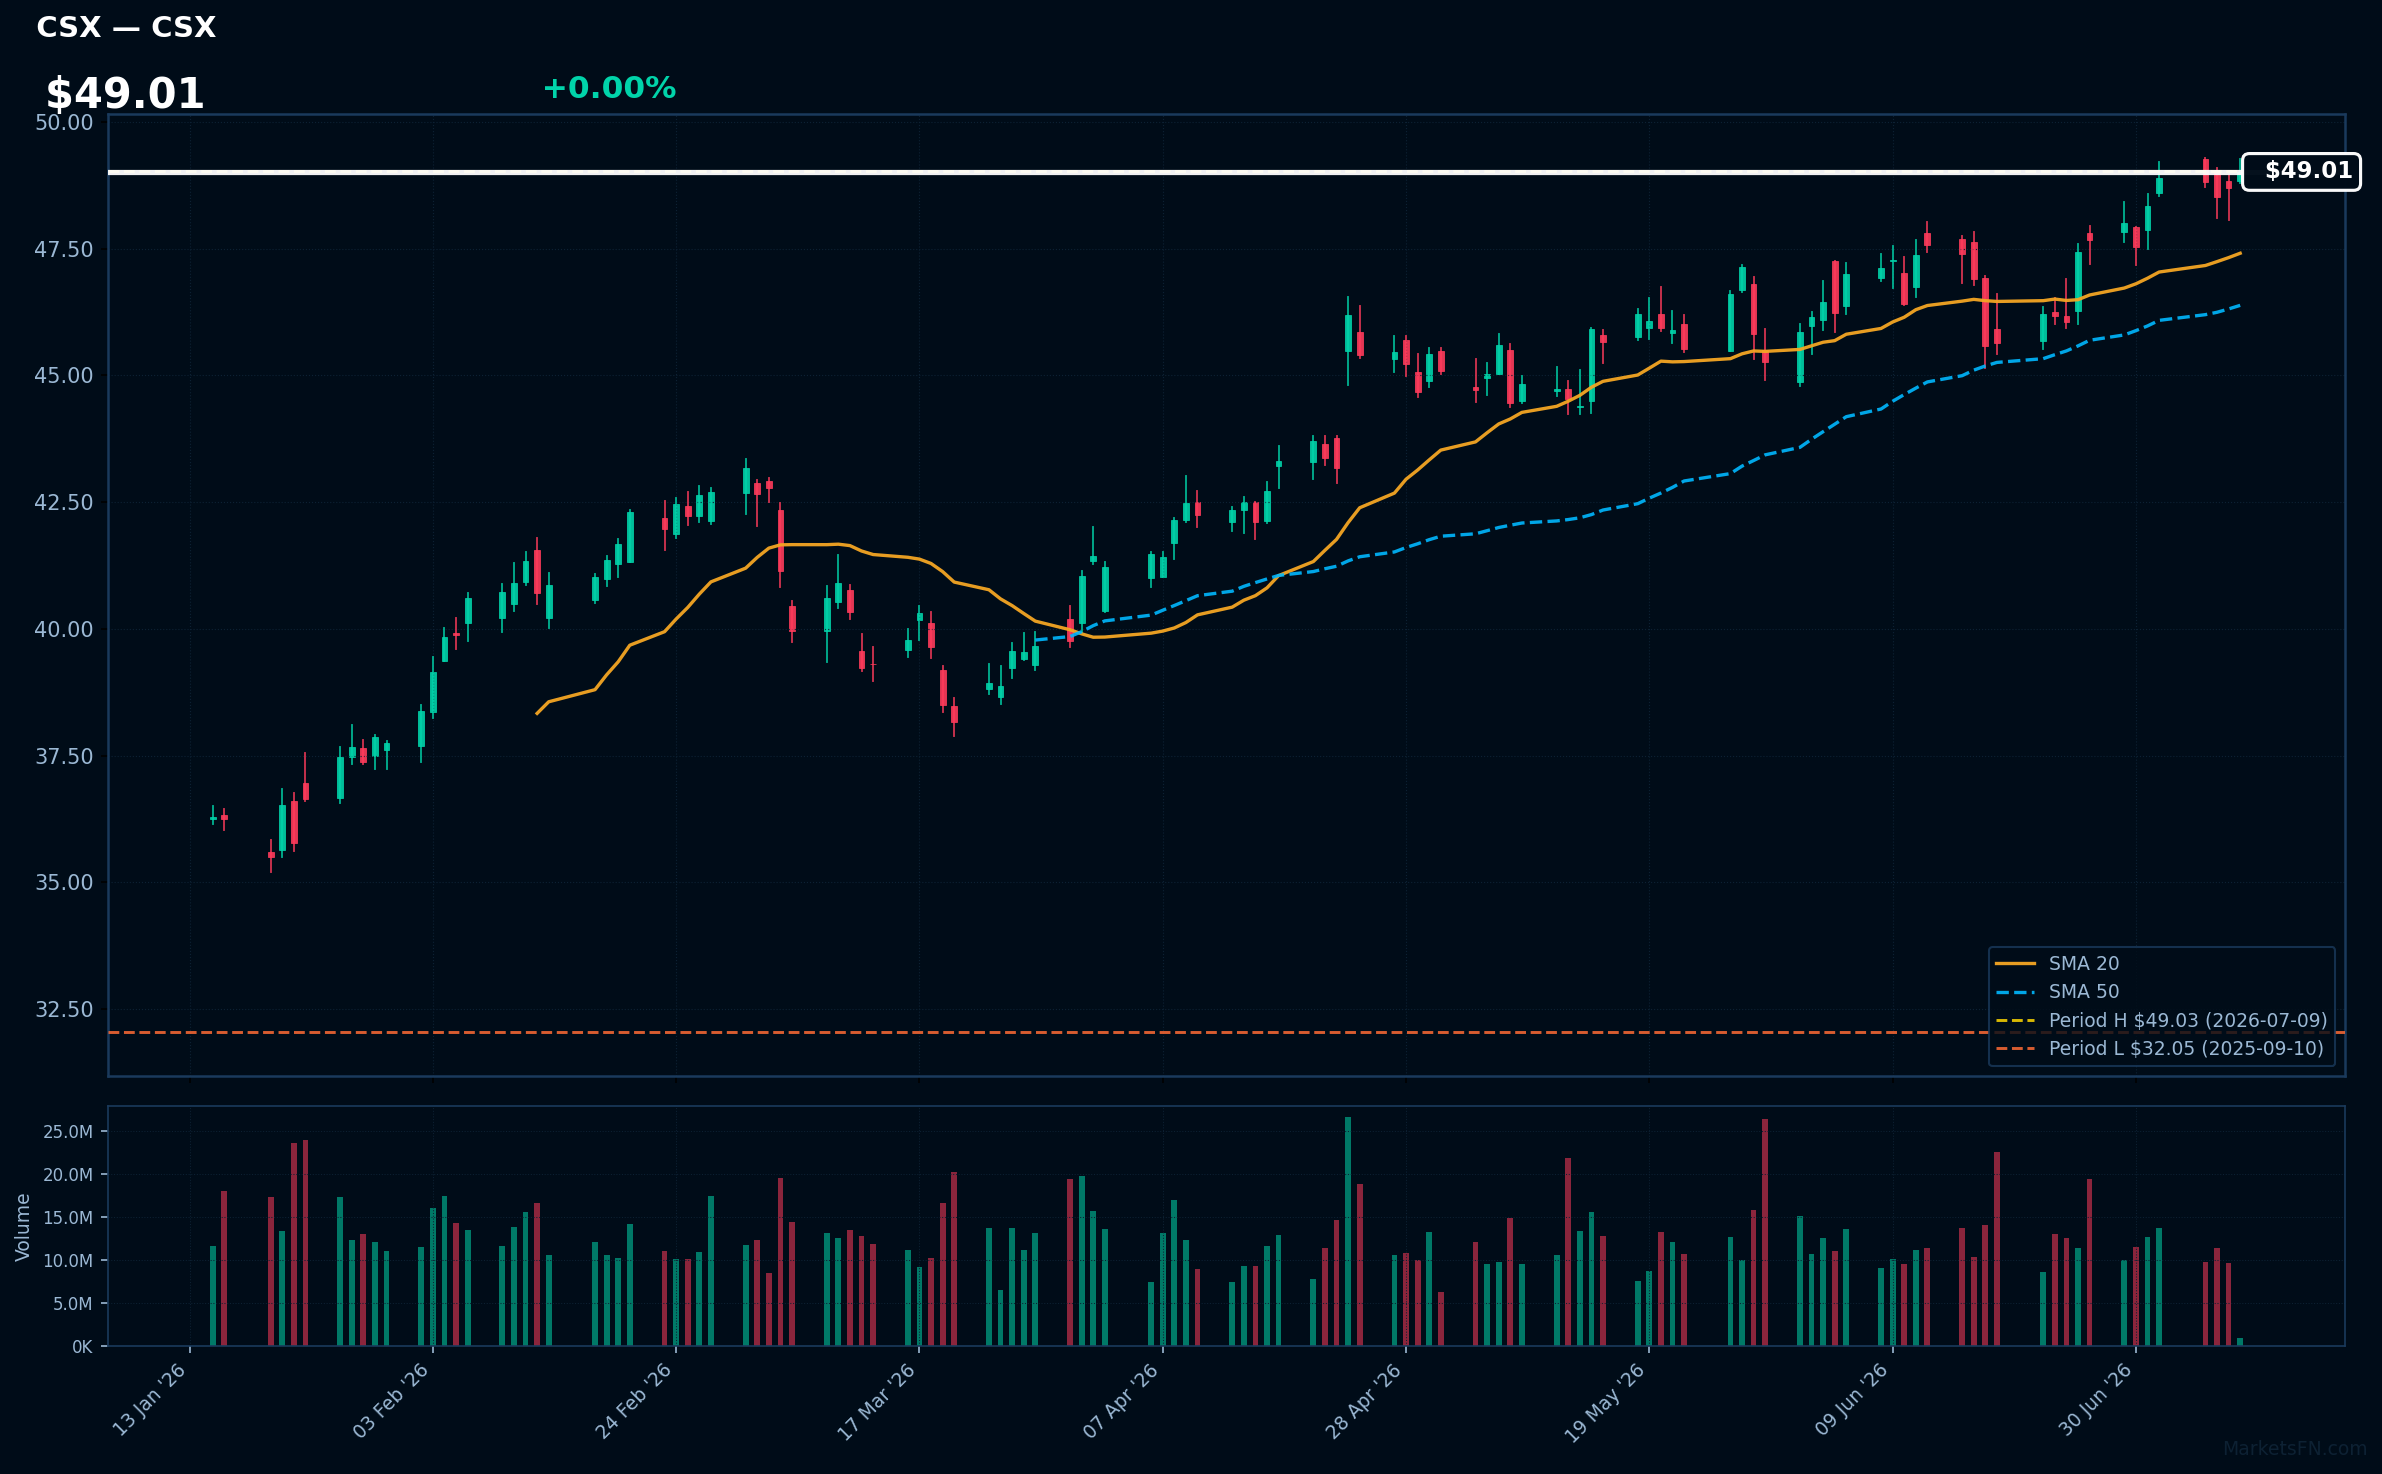
CSX | CSX Corp | Industrials | Price Last: $49.03 | % Realized: +47.10% | RSI: 65.1 | % above MA200: +22.4% | Trend: Above MA20, MA50, MA200
CSX Corp operates a rail network transporting coal, intermodal, and automotive goods, making it a key player in North American freight infrastructure; investors should care due to its critical role in the supply chain and potential exposure to economic fluctuations.
CSX Corp's technicals indicate momentum, with RSI(14) at 65.1, price above MA20, MA50, and MA200, and a 0.0% gap to its 52-Week high, suggesting a sustained uptrend; the alignment of MA20 > MA50 > MA200 further supports this trend.
Related headlines
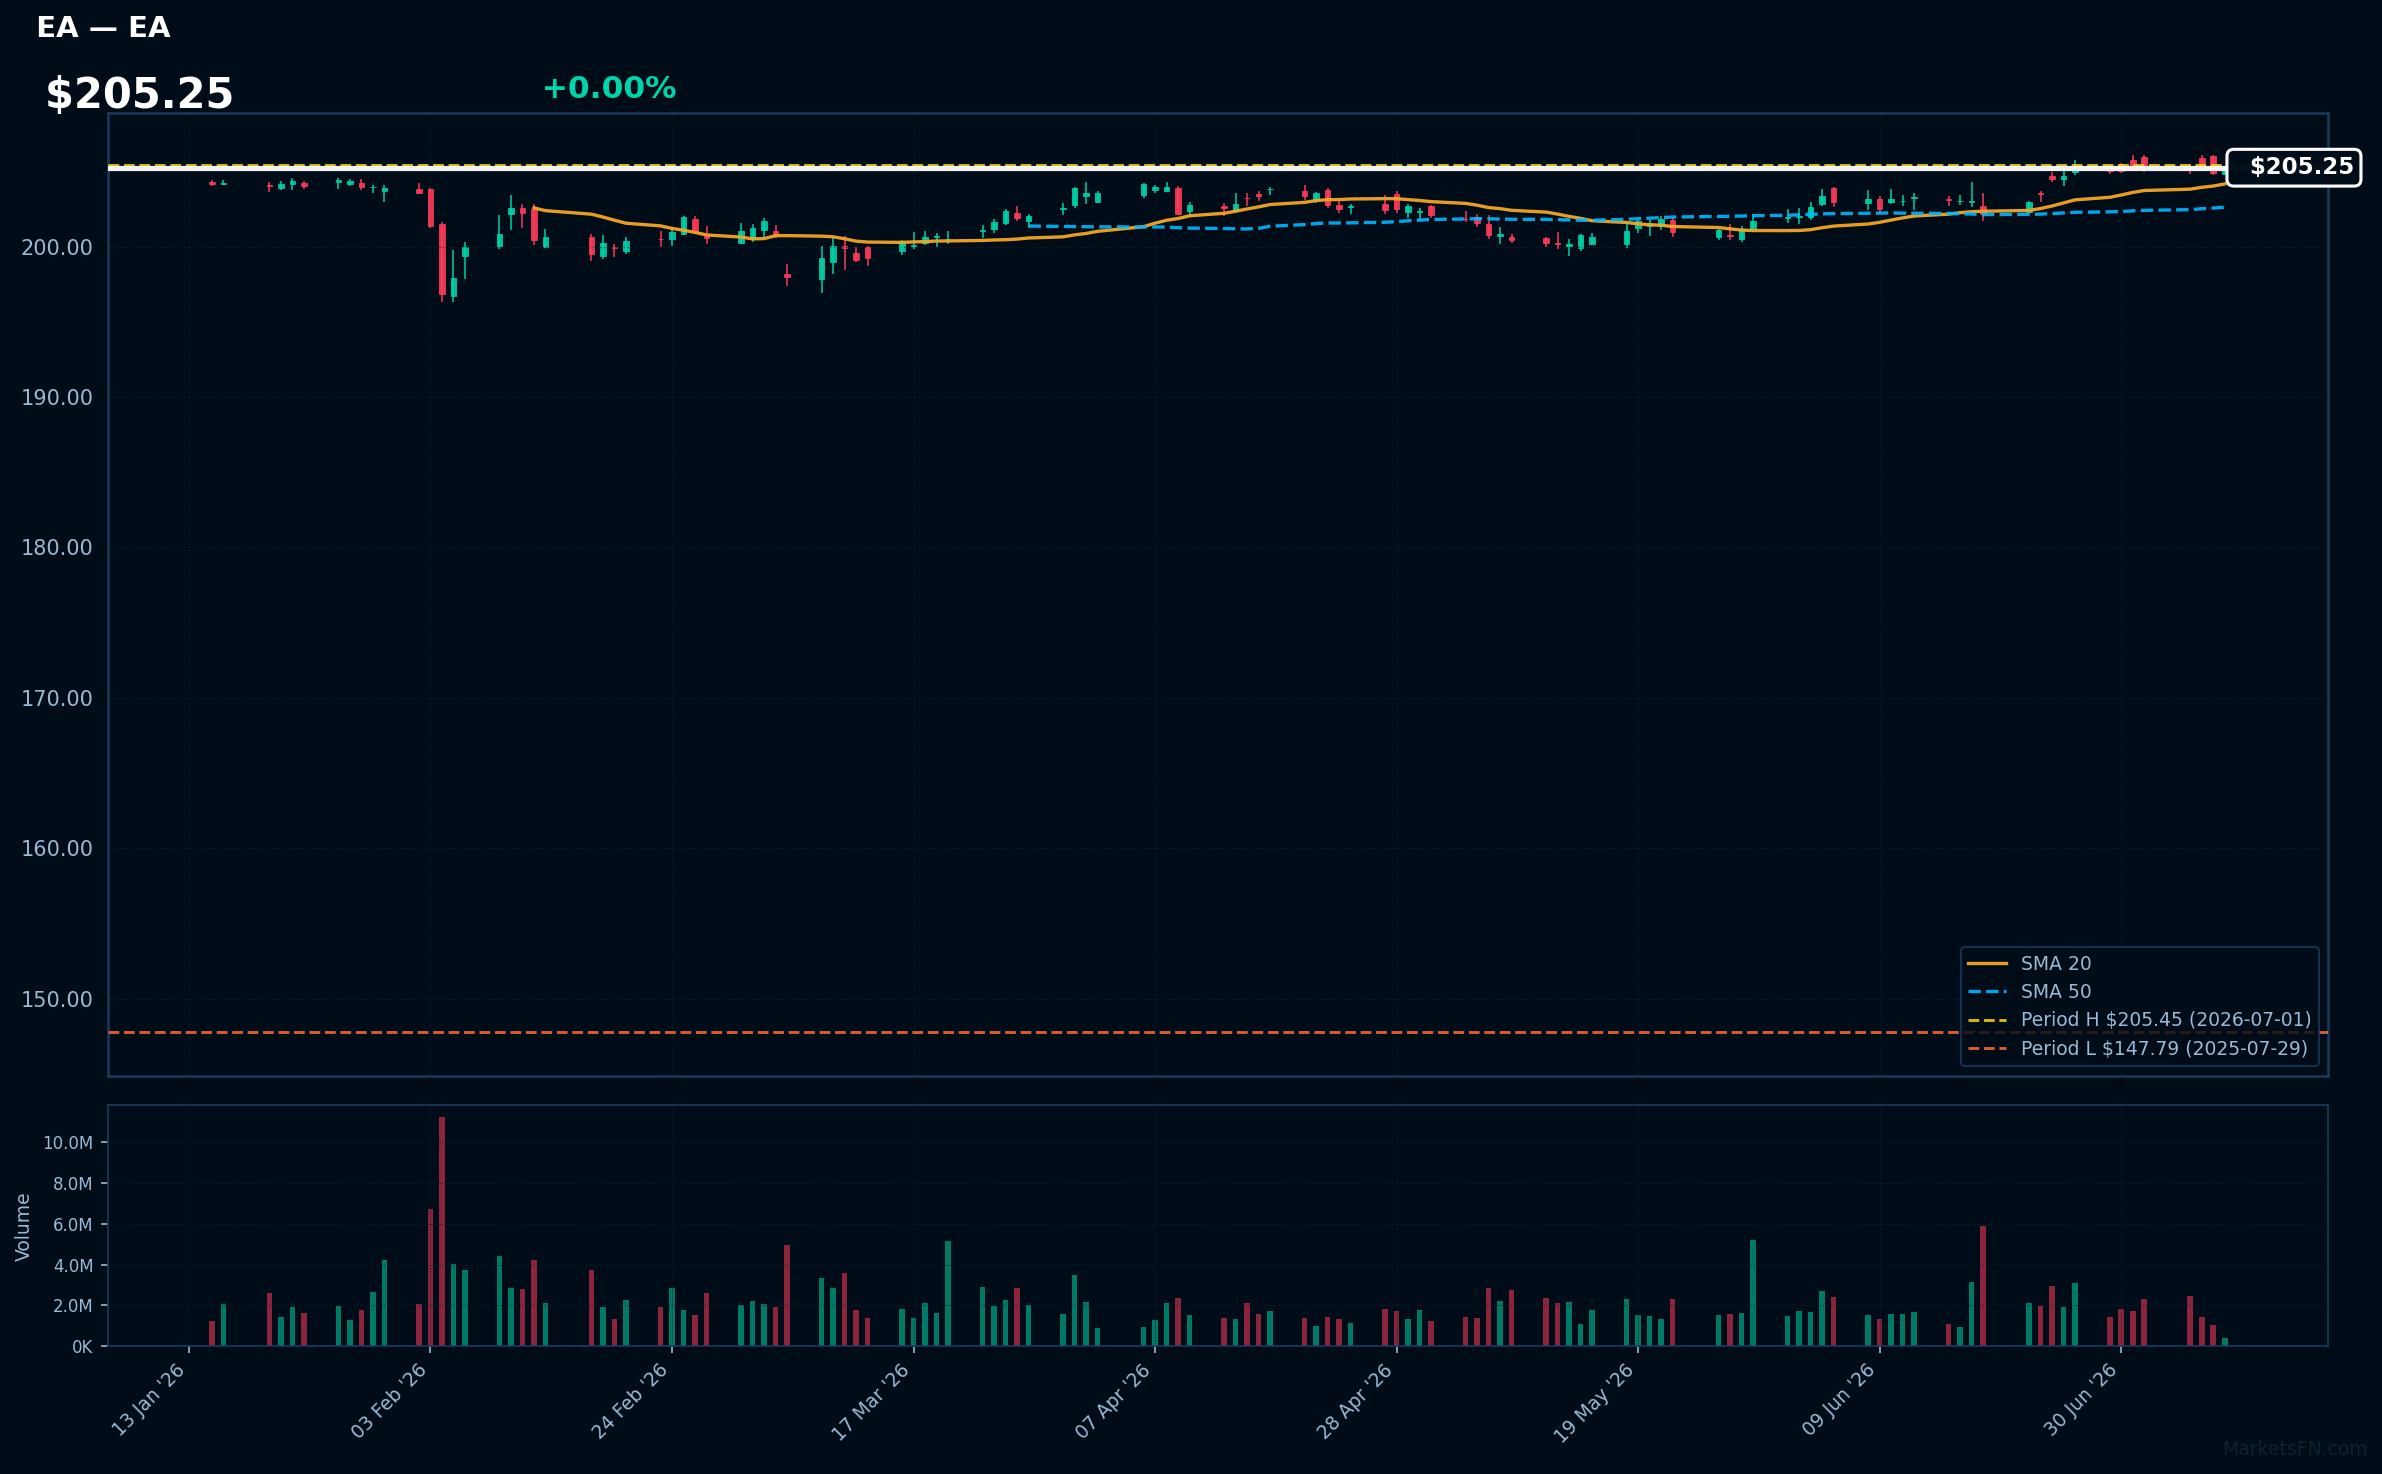
EA | Electronic Arts, Inc | Communication Services | Price Last: $205.25 | % Realized: +34.43% | RSI: 63.7 | % above MA200: +1.9% | Trend: Above MA20, MA50, MA200
Electronic Arts, Inc (EA) is a leading interactive entertainment software company that develops and publishes games such as FIFA, Madden NFL, and The Sims. Investors should care about its performance in the gaming market and its ability to innovate and release successful titles.
EA's current technical situation indicates momentum, with an RSI(14) of 63.7 and a bullish MA alignment (price > MA20 > MA50 > MA200). The stock is 0.1% below its 52-Week high, near a potential breakout level, having returned 34.4% over the 52-Week period.
Related headlines
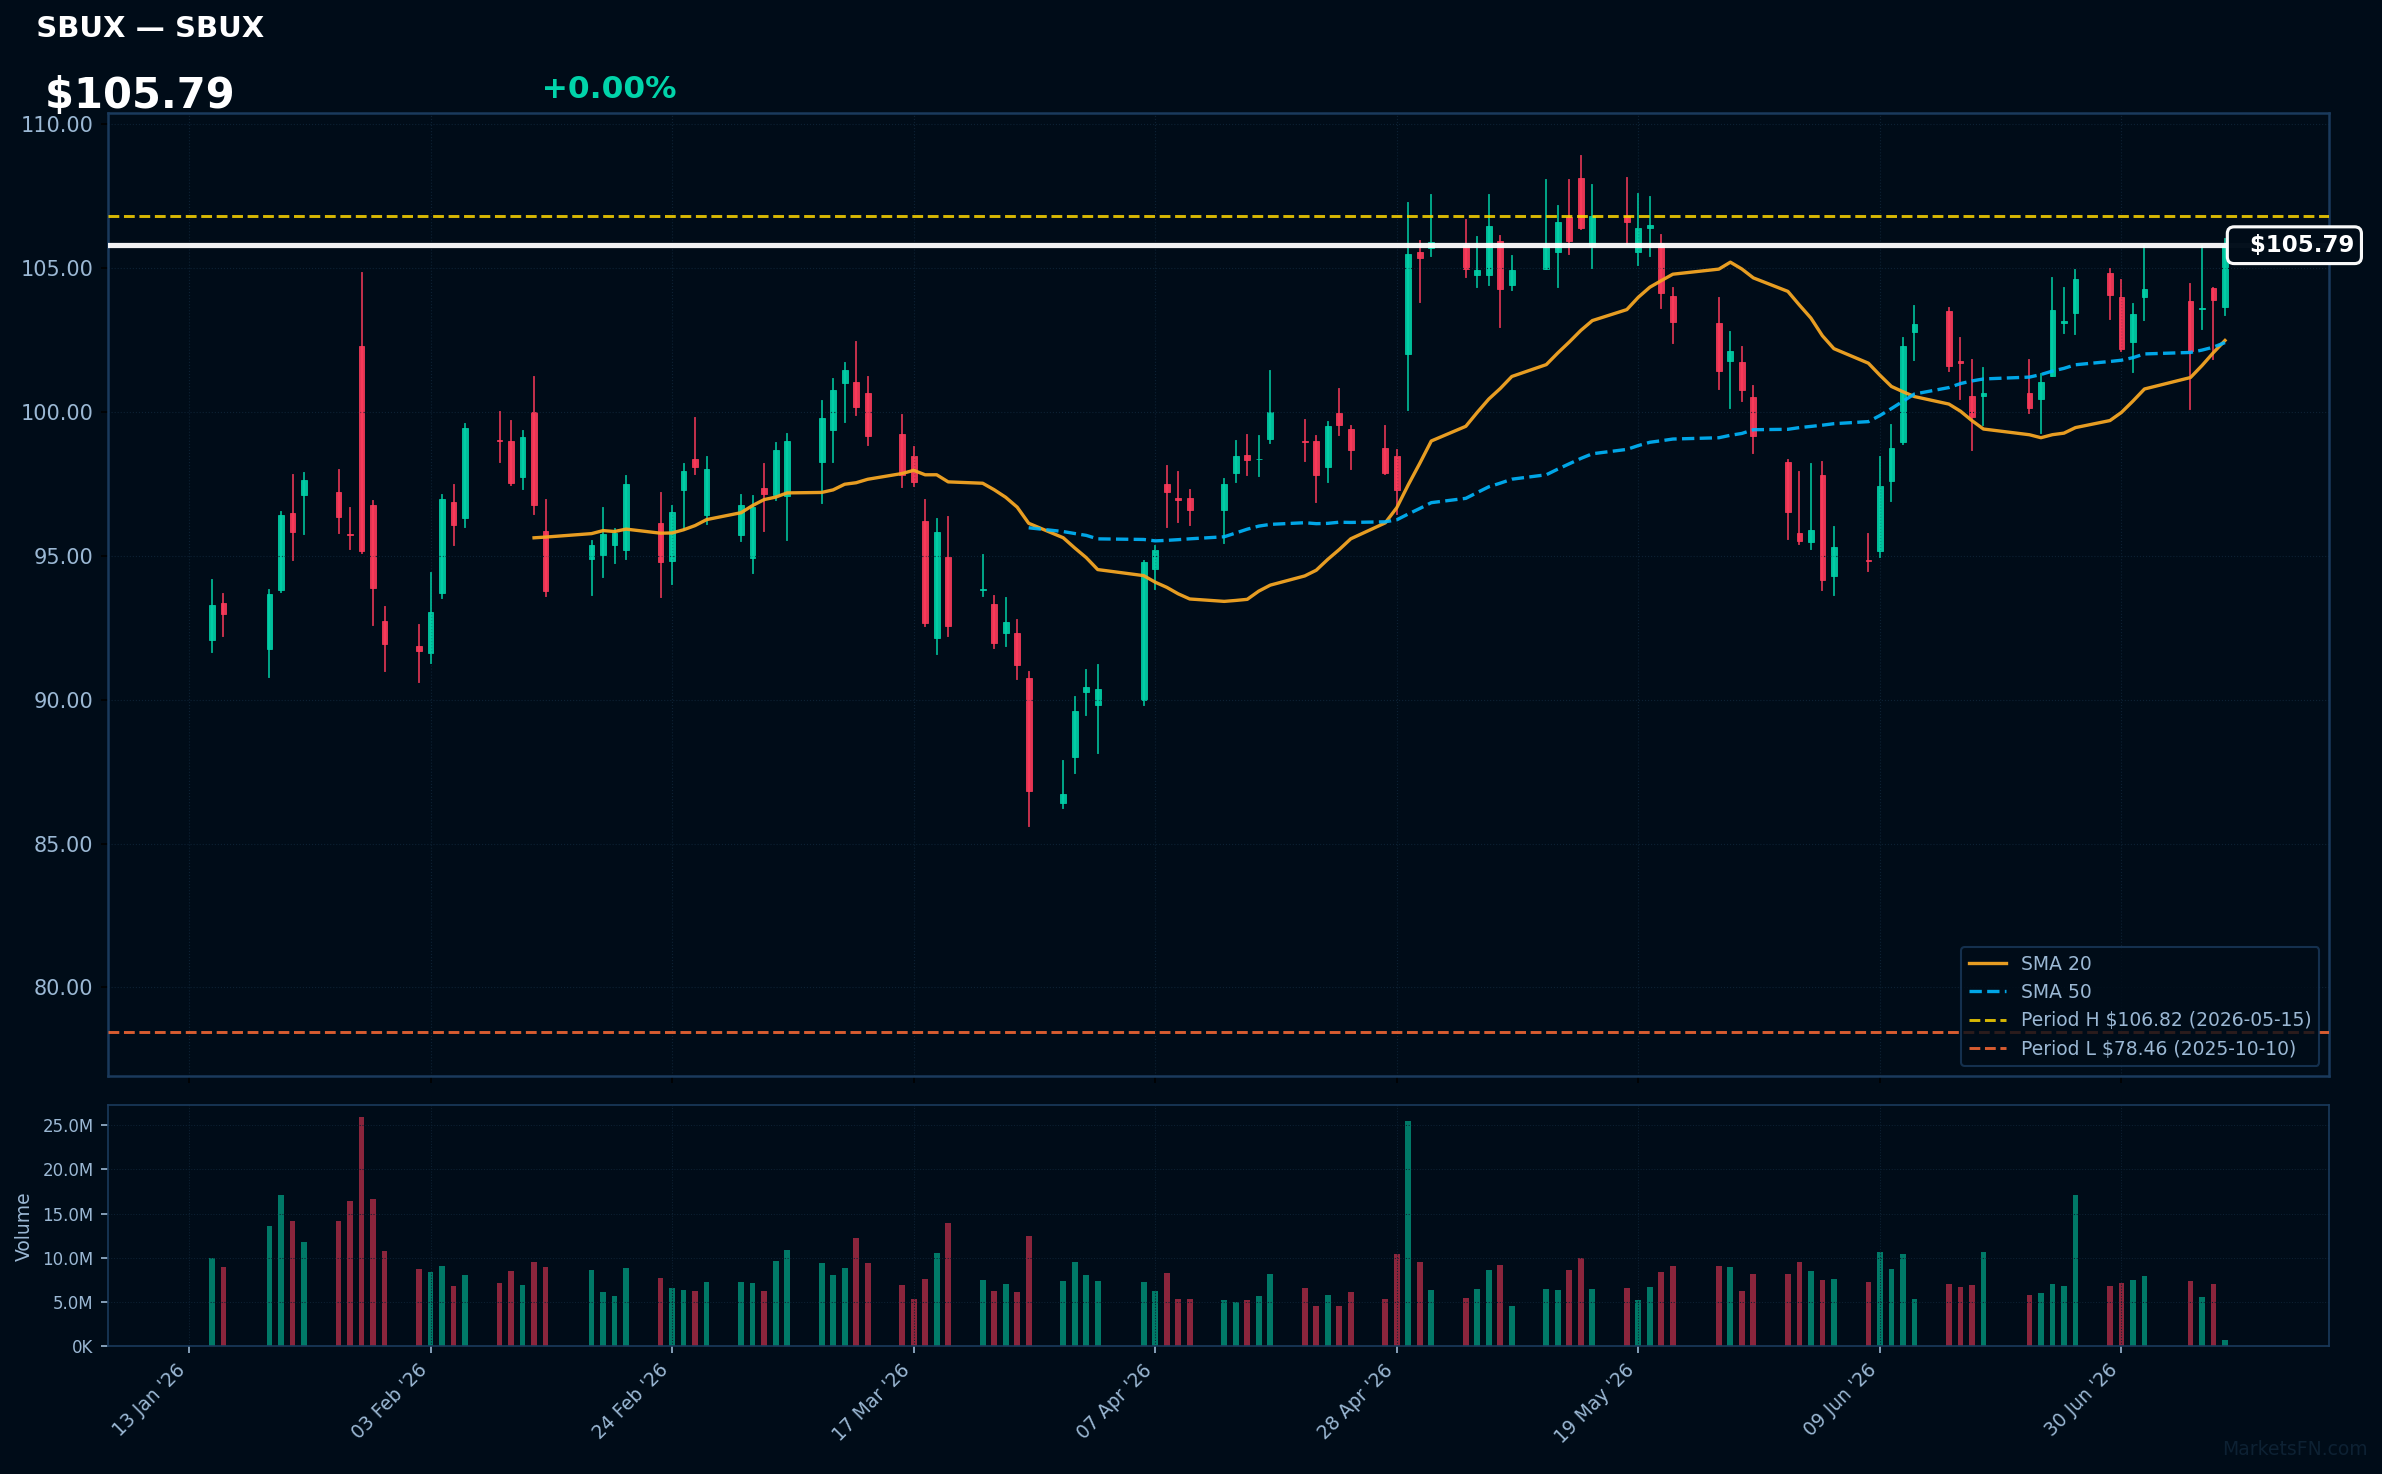
SBUX | Starbucks Corp | Consumer Cyclical | Price Last: $105.73 | % Realized: +11.00% | RSI: 60.7 | % above MA200: +13.5% | Trend: Above MA20, MA50, MA200
Starbucks Corp operates a global chain of coffeehouses, offering a wide range of coffee beverages, food items, and other products. Investors care about its brand strength, global expansion, and ability to maintain profitability amidst changing consumer preferences.
The stock is in a sustained uptrend with price > MA20 > MA50 > MA200, RSI(14) at 60.7, and is 1.0% below its 52-Week high, indicating strong momentum with no clear warning signs; the 11.0% 52-Week return further supports this positive technical picture.
Related headlines
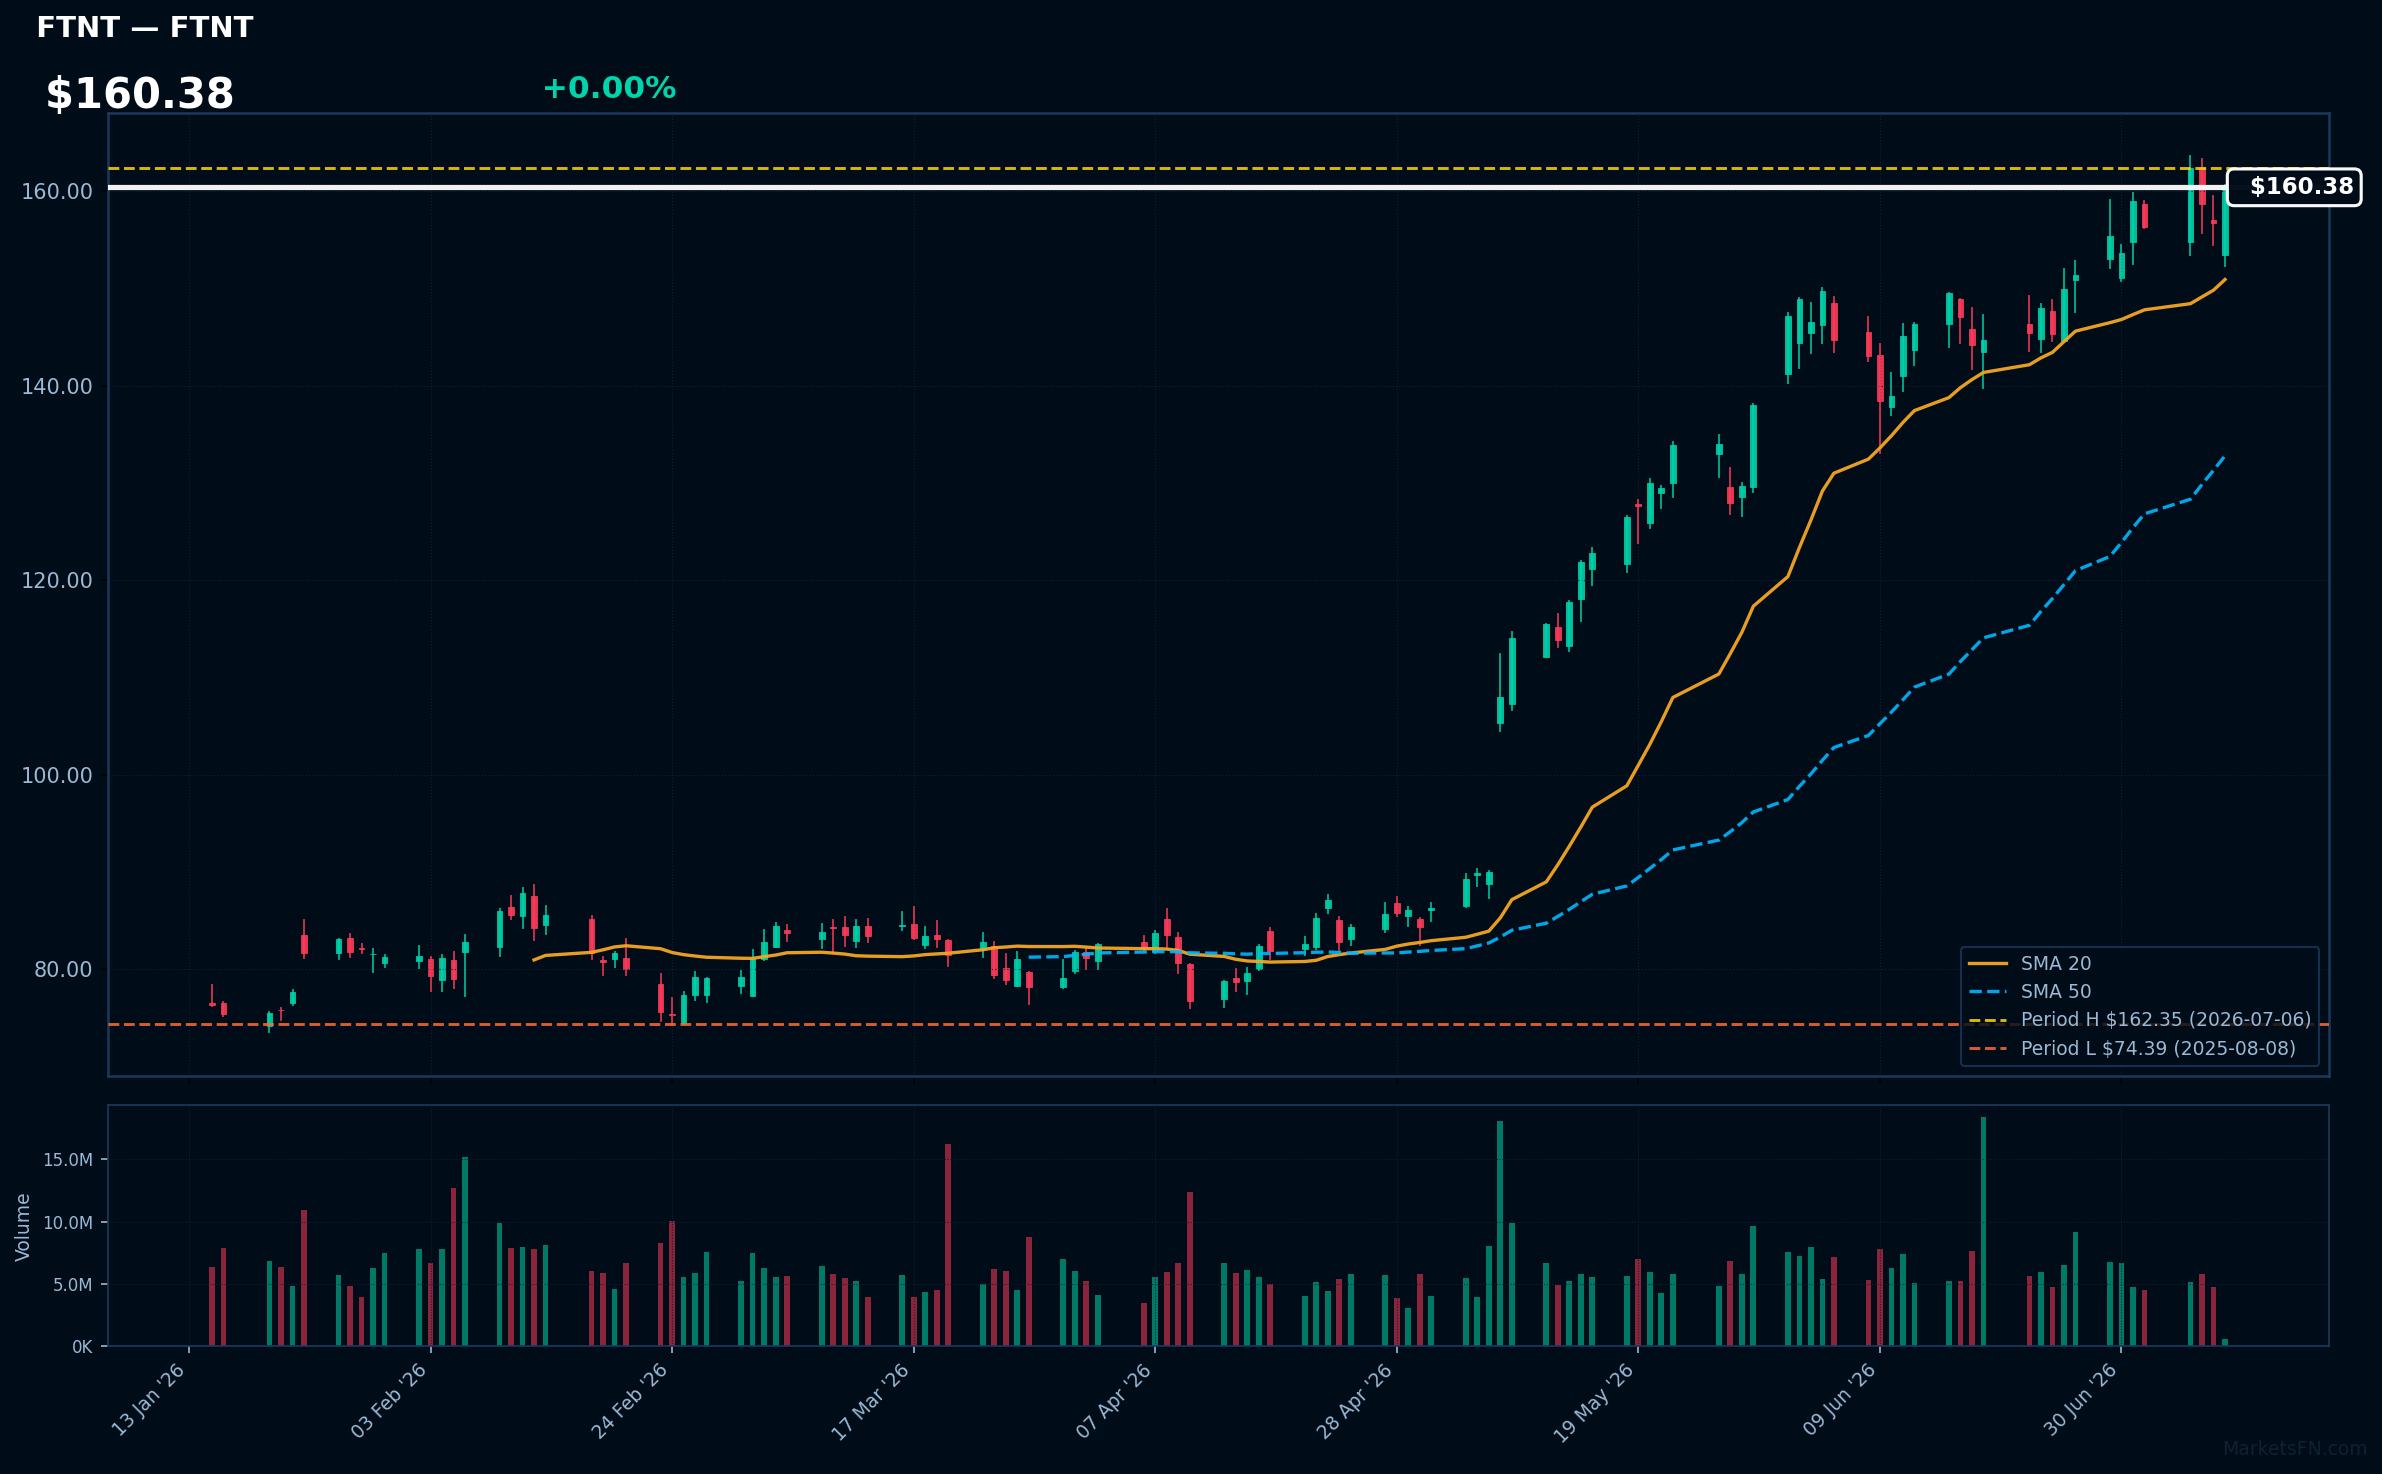
FTNT | Fortinet Inc | Technology | Price Last: $160.18 | % Realized: +48.80% | RSI: 65.9 | % above MA200: +69.1% | Trend: Above MA20, MA50, MA200
Fortinet Inc is a cybersecurity company providing solutions like firewalls and threat protection; investors should care due to its potential in the growing cybersecurity market.
Fortinet Inc shows bullish technicals with RSI(14) at 65.9, price > MA20 > MA50 > MA200, and is 1.3% below its 52-Week high, indicating sustained uptrend and potential breakout, with 48.8% return over the 52-Week period.
Related headlines
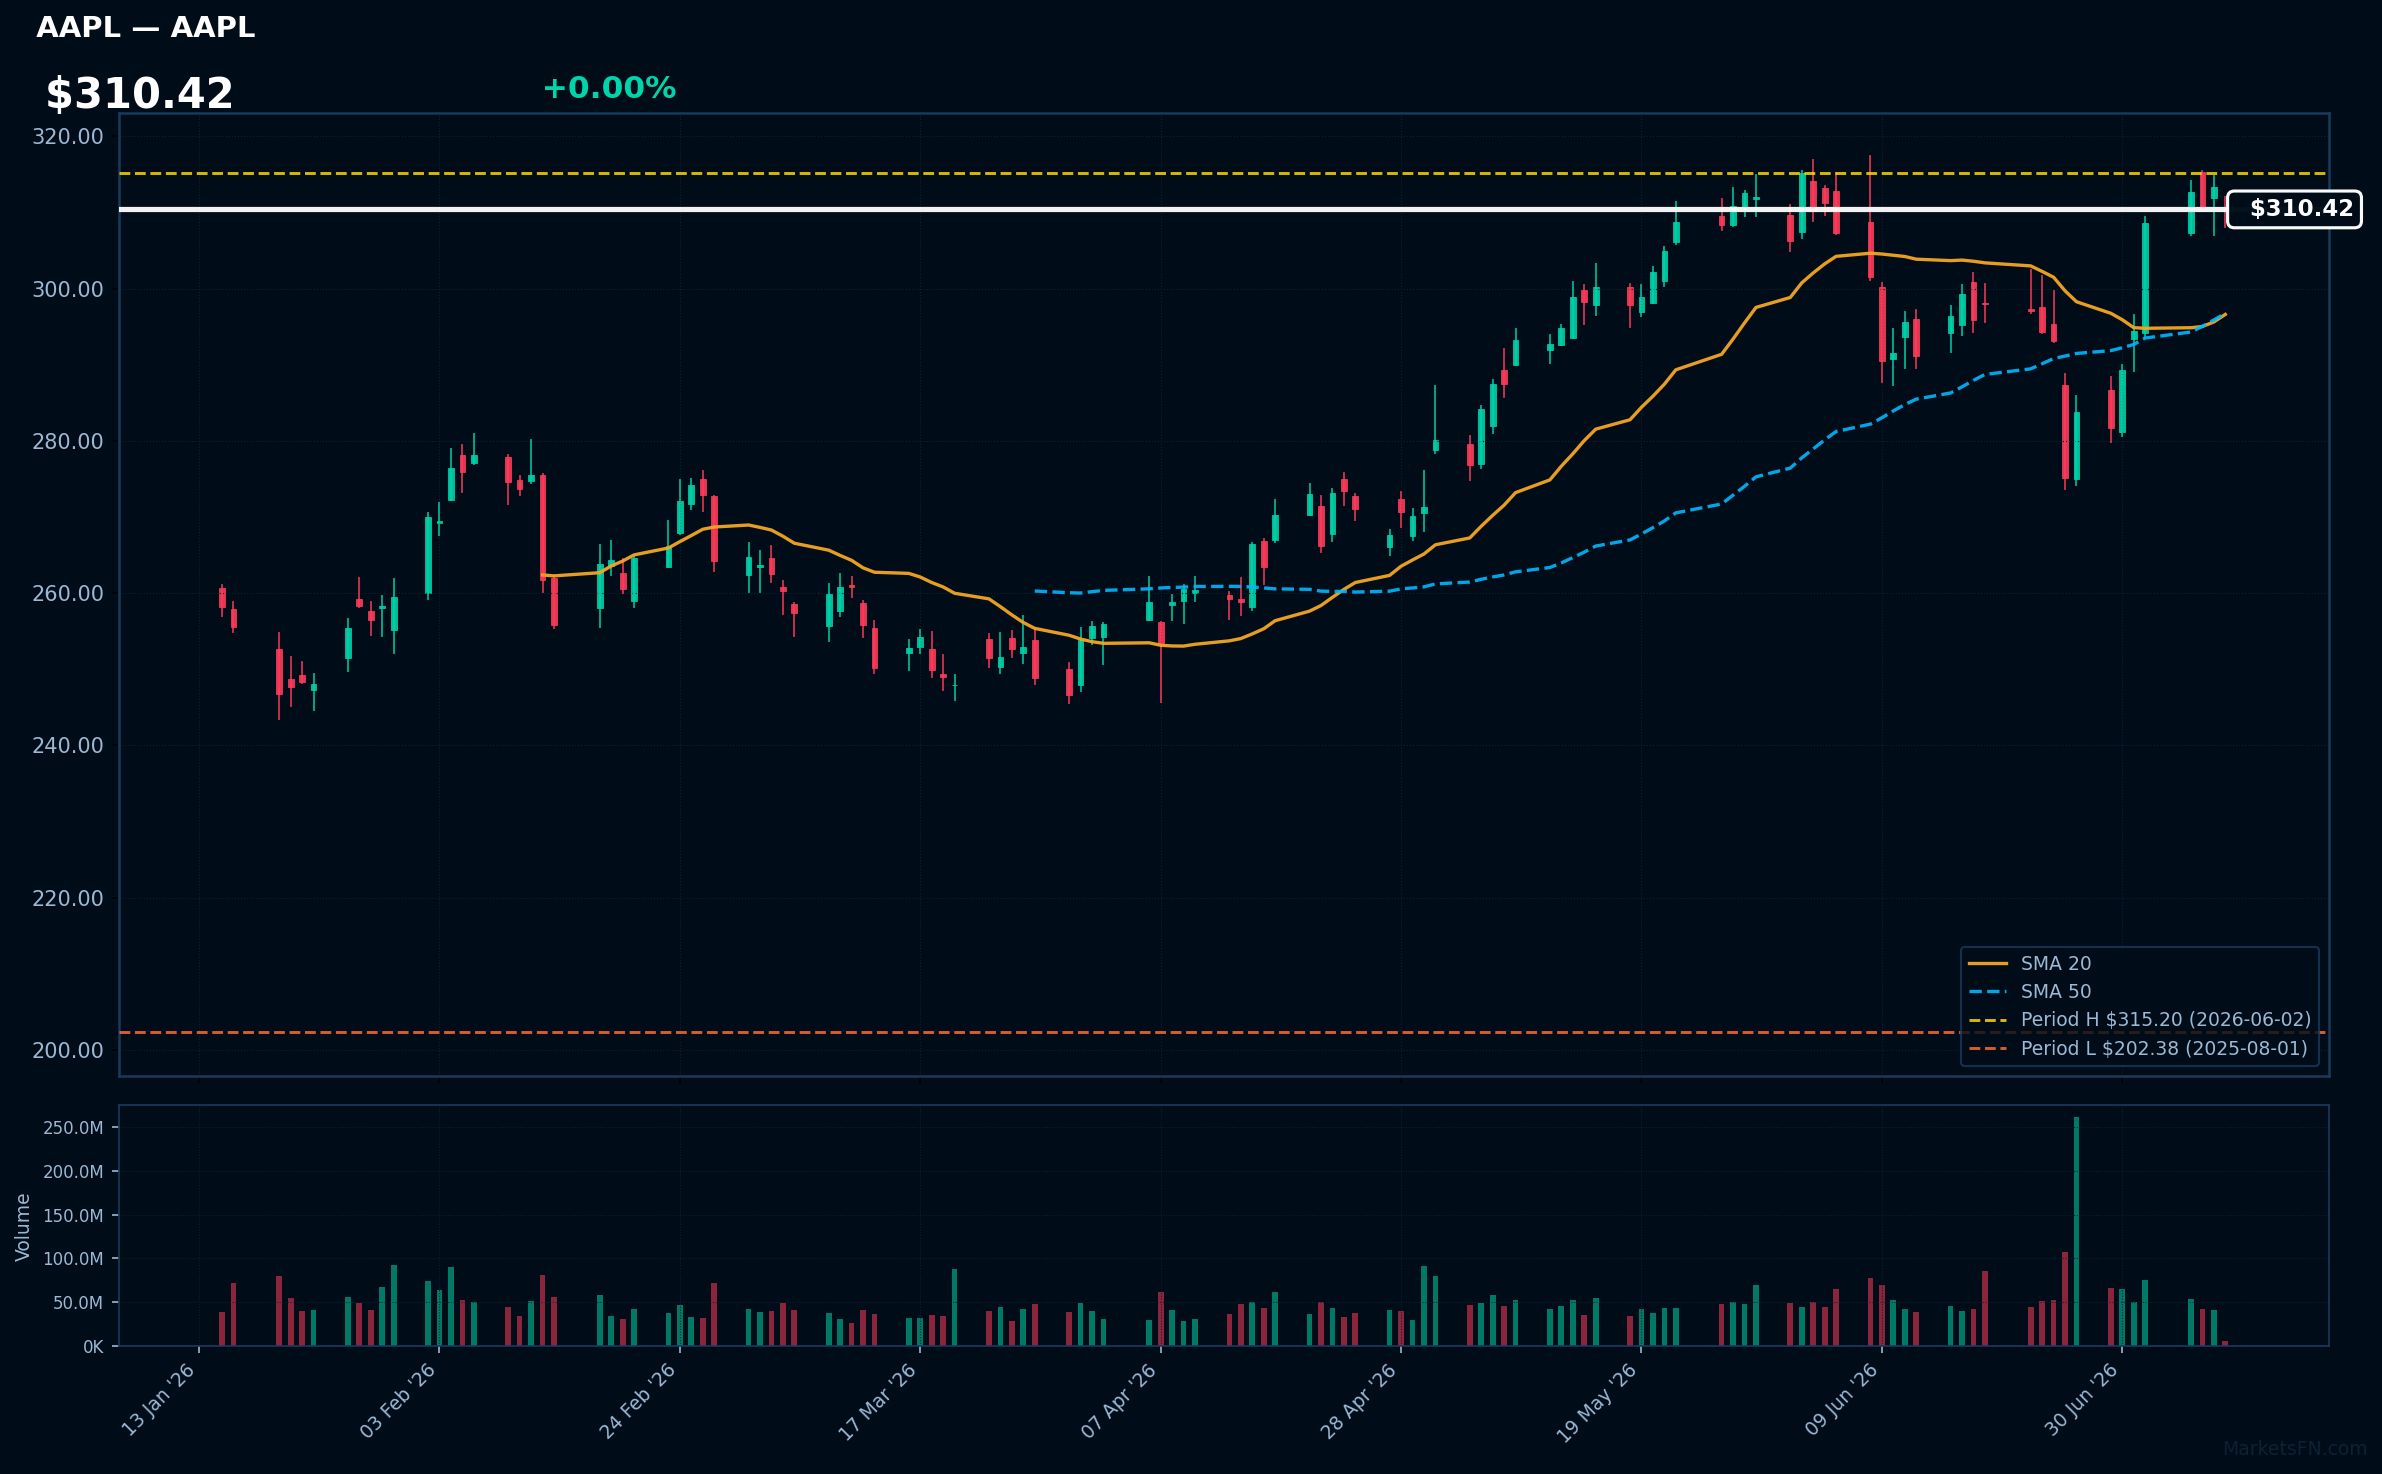
AAPL | Apple Inc | Technology | Price Last: $310.45 | % Realized: +47.04% | RSI: 59.4 | % above MA200: +14.1% | Trend: Above MA20, MA50, MA200
Apple Inc designs, manufactures, and markets consumer electronics, software, and services. Investors care about its innovative product ecosystem, services growth, and profitability. Its flagship products, like iPhones, drive revenue, while services like Apple Music contribute to margins.
AAPL's RSI(14) is 59.4, indicating moderate momentum. With the price above MA20, MA50, and MA200, it shows a bullish trend. Being 1.5% below its 52-Week high suggests a potential breakout, supported by a 47.0% 52-Week return, signaling strong upward momentum.
Related headlines
📉 Nearest to 52-Week Low
Sectors represented: Consumer Cyclical (1), Industrials (1), Consumer Defensive (1), Real Estate (1), Communication Services (1)
| Ticker | Company | Sector | Price Last | % Realized | 52-Week Low Date | RSI | % above MA200 | Trend |
|---|---|---|---|---|---|---|---|---|
| ORLY | O'Reilly Automotive, Inc | Consumer Cyclical | $84.28 | -8.97% | 2026-07-06 | 39.7 | -10.8% | Below MA20, MA50, MA200 |
| CPRT | Copart, Inc | Industrials | $28.13 | -40.95% | 2026-06-29 | 37.4 | -24.4% | Below MA20, MA50, MA200 |
| PEP | PepsiCo Inc | Consumer Defensive | $135.11 | +0.47% | 2025-07-15 | 37.6 | -10.0% | Below MA20, MA50, MA200 |
| CSGP | Costar Group, Inc | Real Estate | $28.94 | -65.75% | 2026-06-30 | 40.8 | -45.4% | Below MA20, MA50, MA200 |
| CMCSA | Comcast Corp | Communication Services | $22.91 | -31.39% | 2026-06-22 | 40.0 | -16.4% | Below MA20, MA50, MA200 |
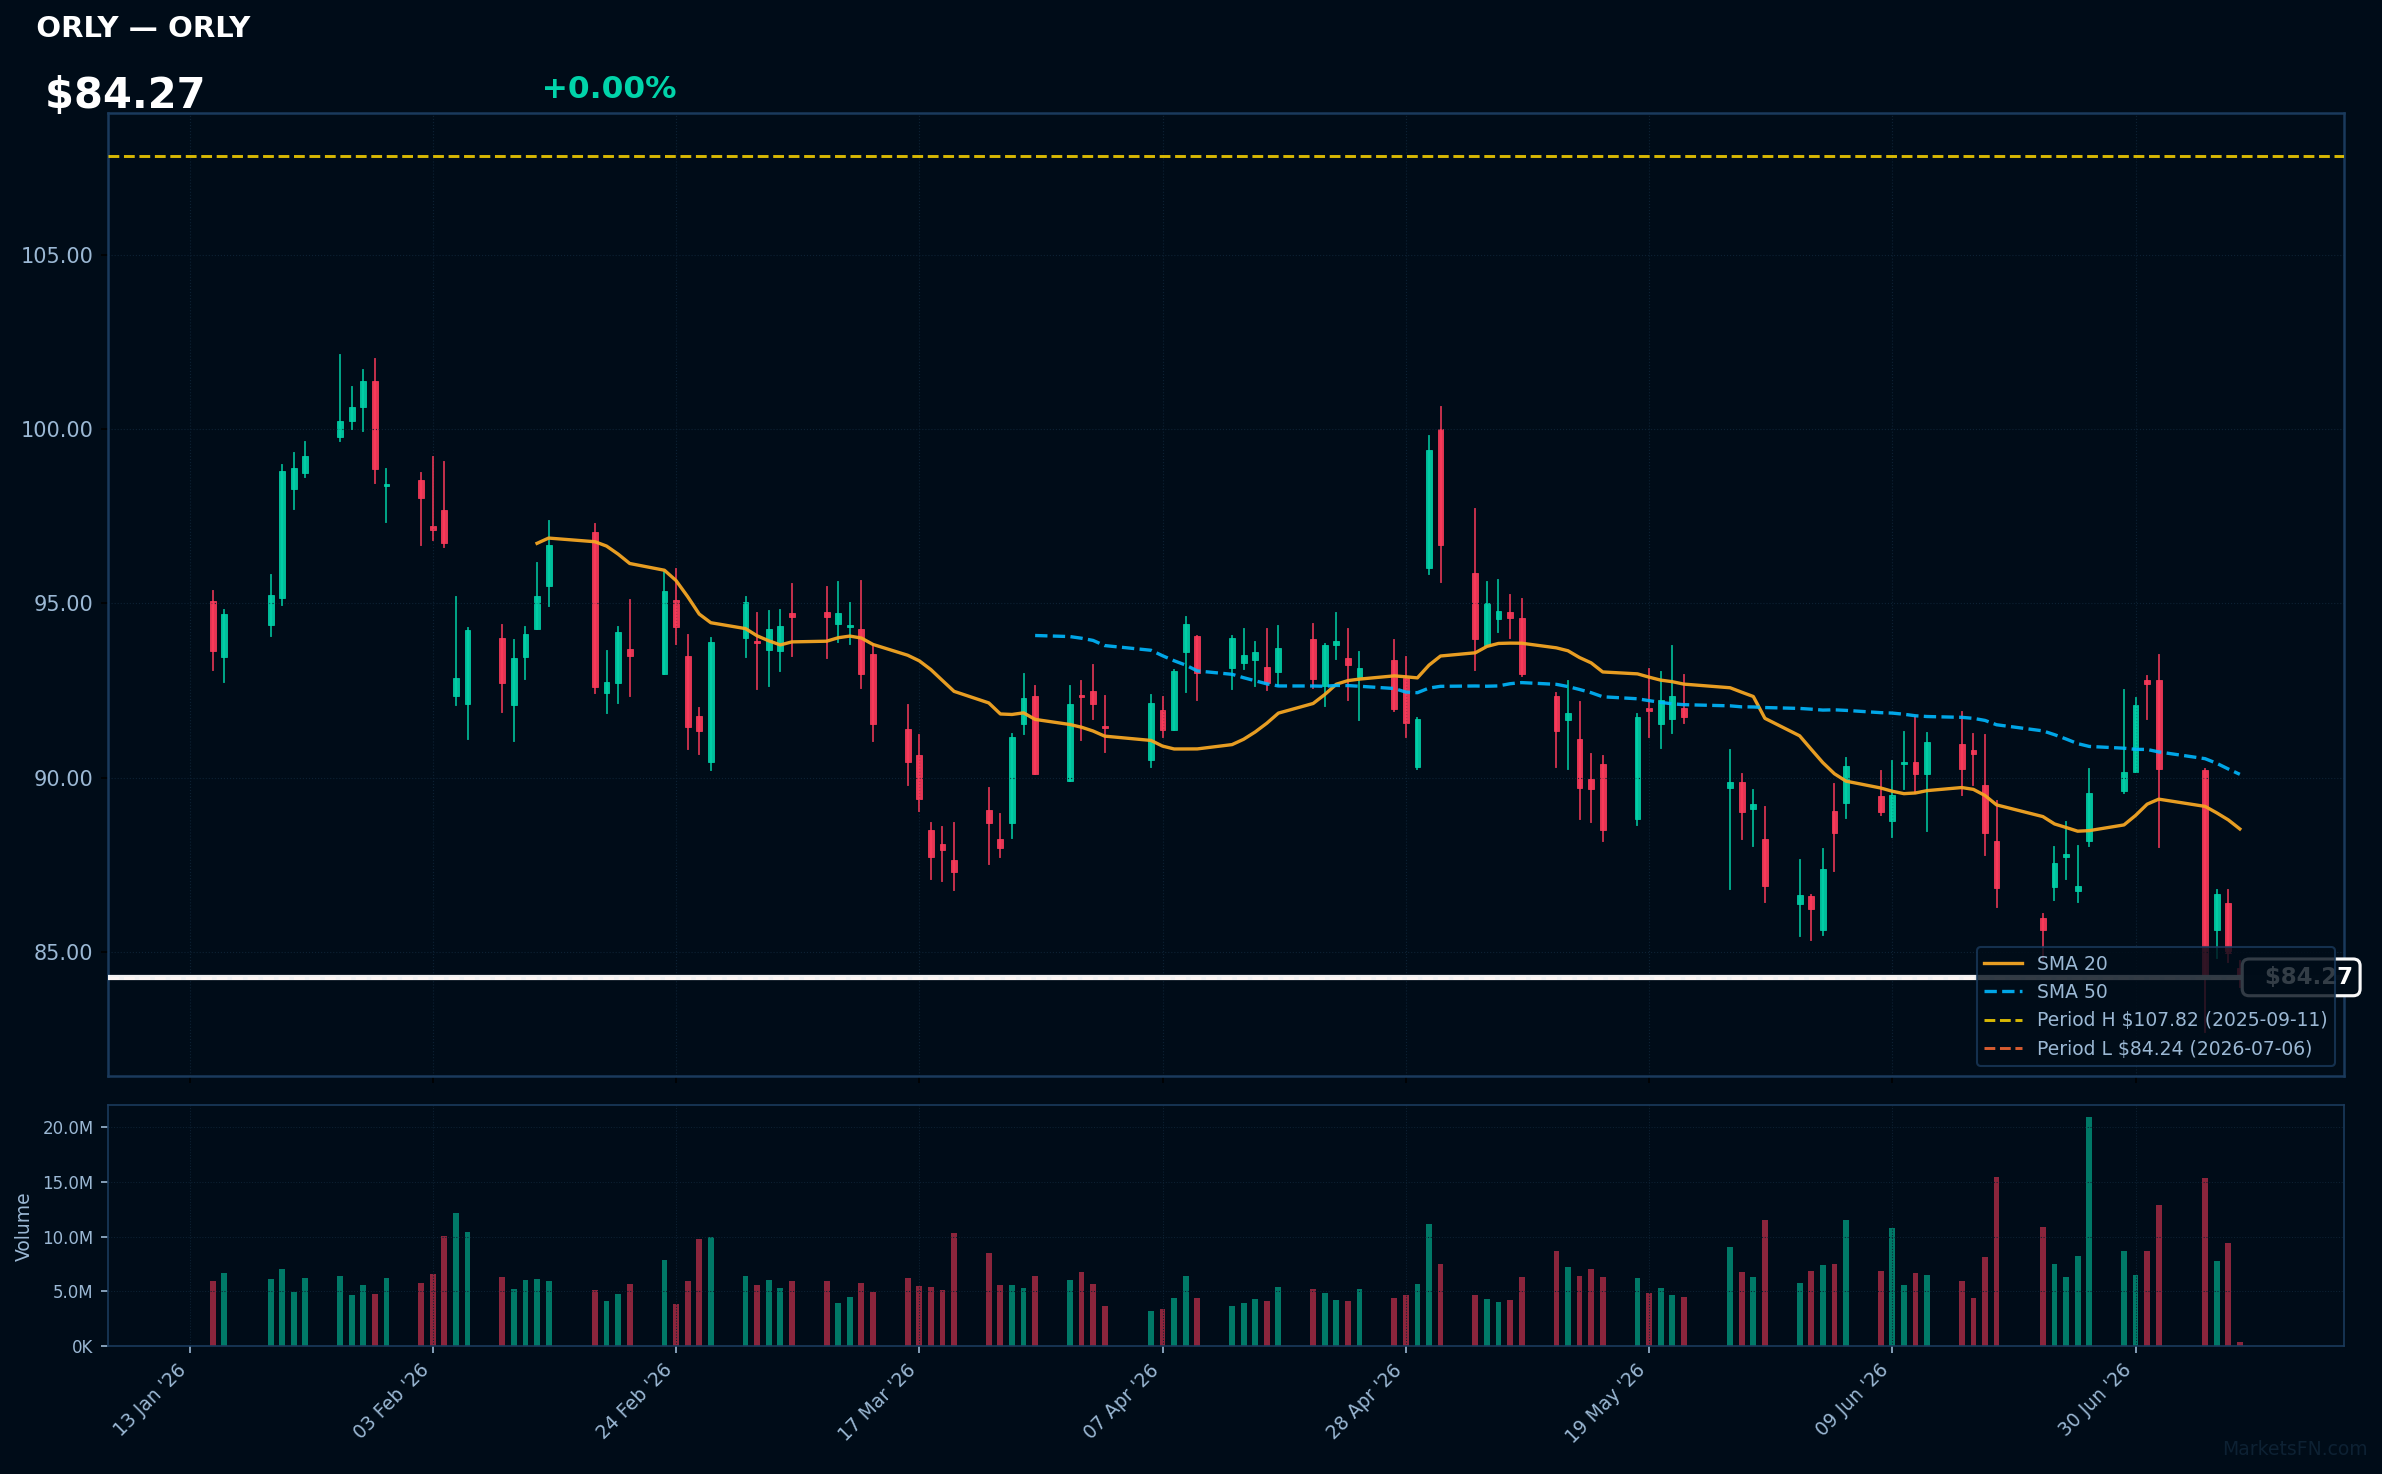
ORLY | O'Reilly Automotive, Inc | Consumer Cyclical | Price Last: $84.28 | % Realized: -8.97% | RSI: 39.7 | % above MA200: -10.8% | Trend: Below MA20, MA50, MA200
O'Reilly Automotive, Inc (ORLY) operates a network of retail stores selling automotive aftermarket parts, tools, and supplies. Investors care due to its exposure to the large and growing vehicle maintenance market, driven by increasing vehicle age and miles driven.
ORLY's technicals indicate a sustained downtrend with price ($84.27) below MA20, MA50, and MA200. RSI(14) at 39.7 suggests bearish momentum. Testing major support at its 52-Week low, a -9.0% 52-Week return reinforces the negative trend.
Related headlines
- Why Did REE, HTZ, ORLY Stocks Slump To 52-Week Lows Today?
- O'Reilly Stock Sinks on Report of Possible NAPA Bid
- GPC Stock Pops 13%, ORLY Falls 5% OReilly Makes Cash Bid For Genuine Parts $10B Auto Unit, Says Report
- O'Reilly Automotive, Inc. Announces Dates for Its Second Quarter 2026 Earnings Release and Conference Call
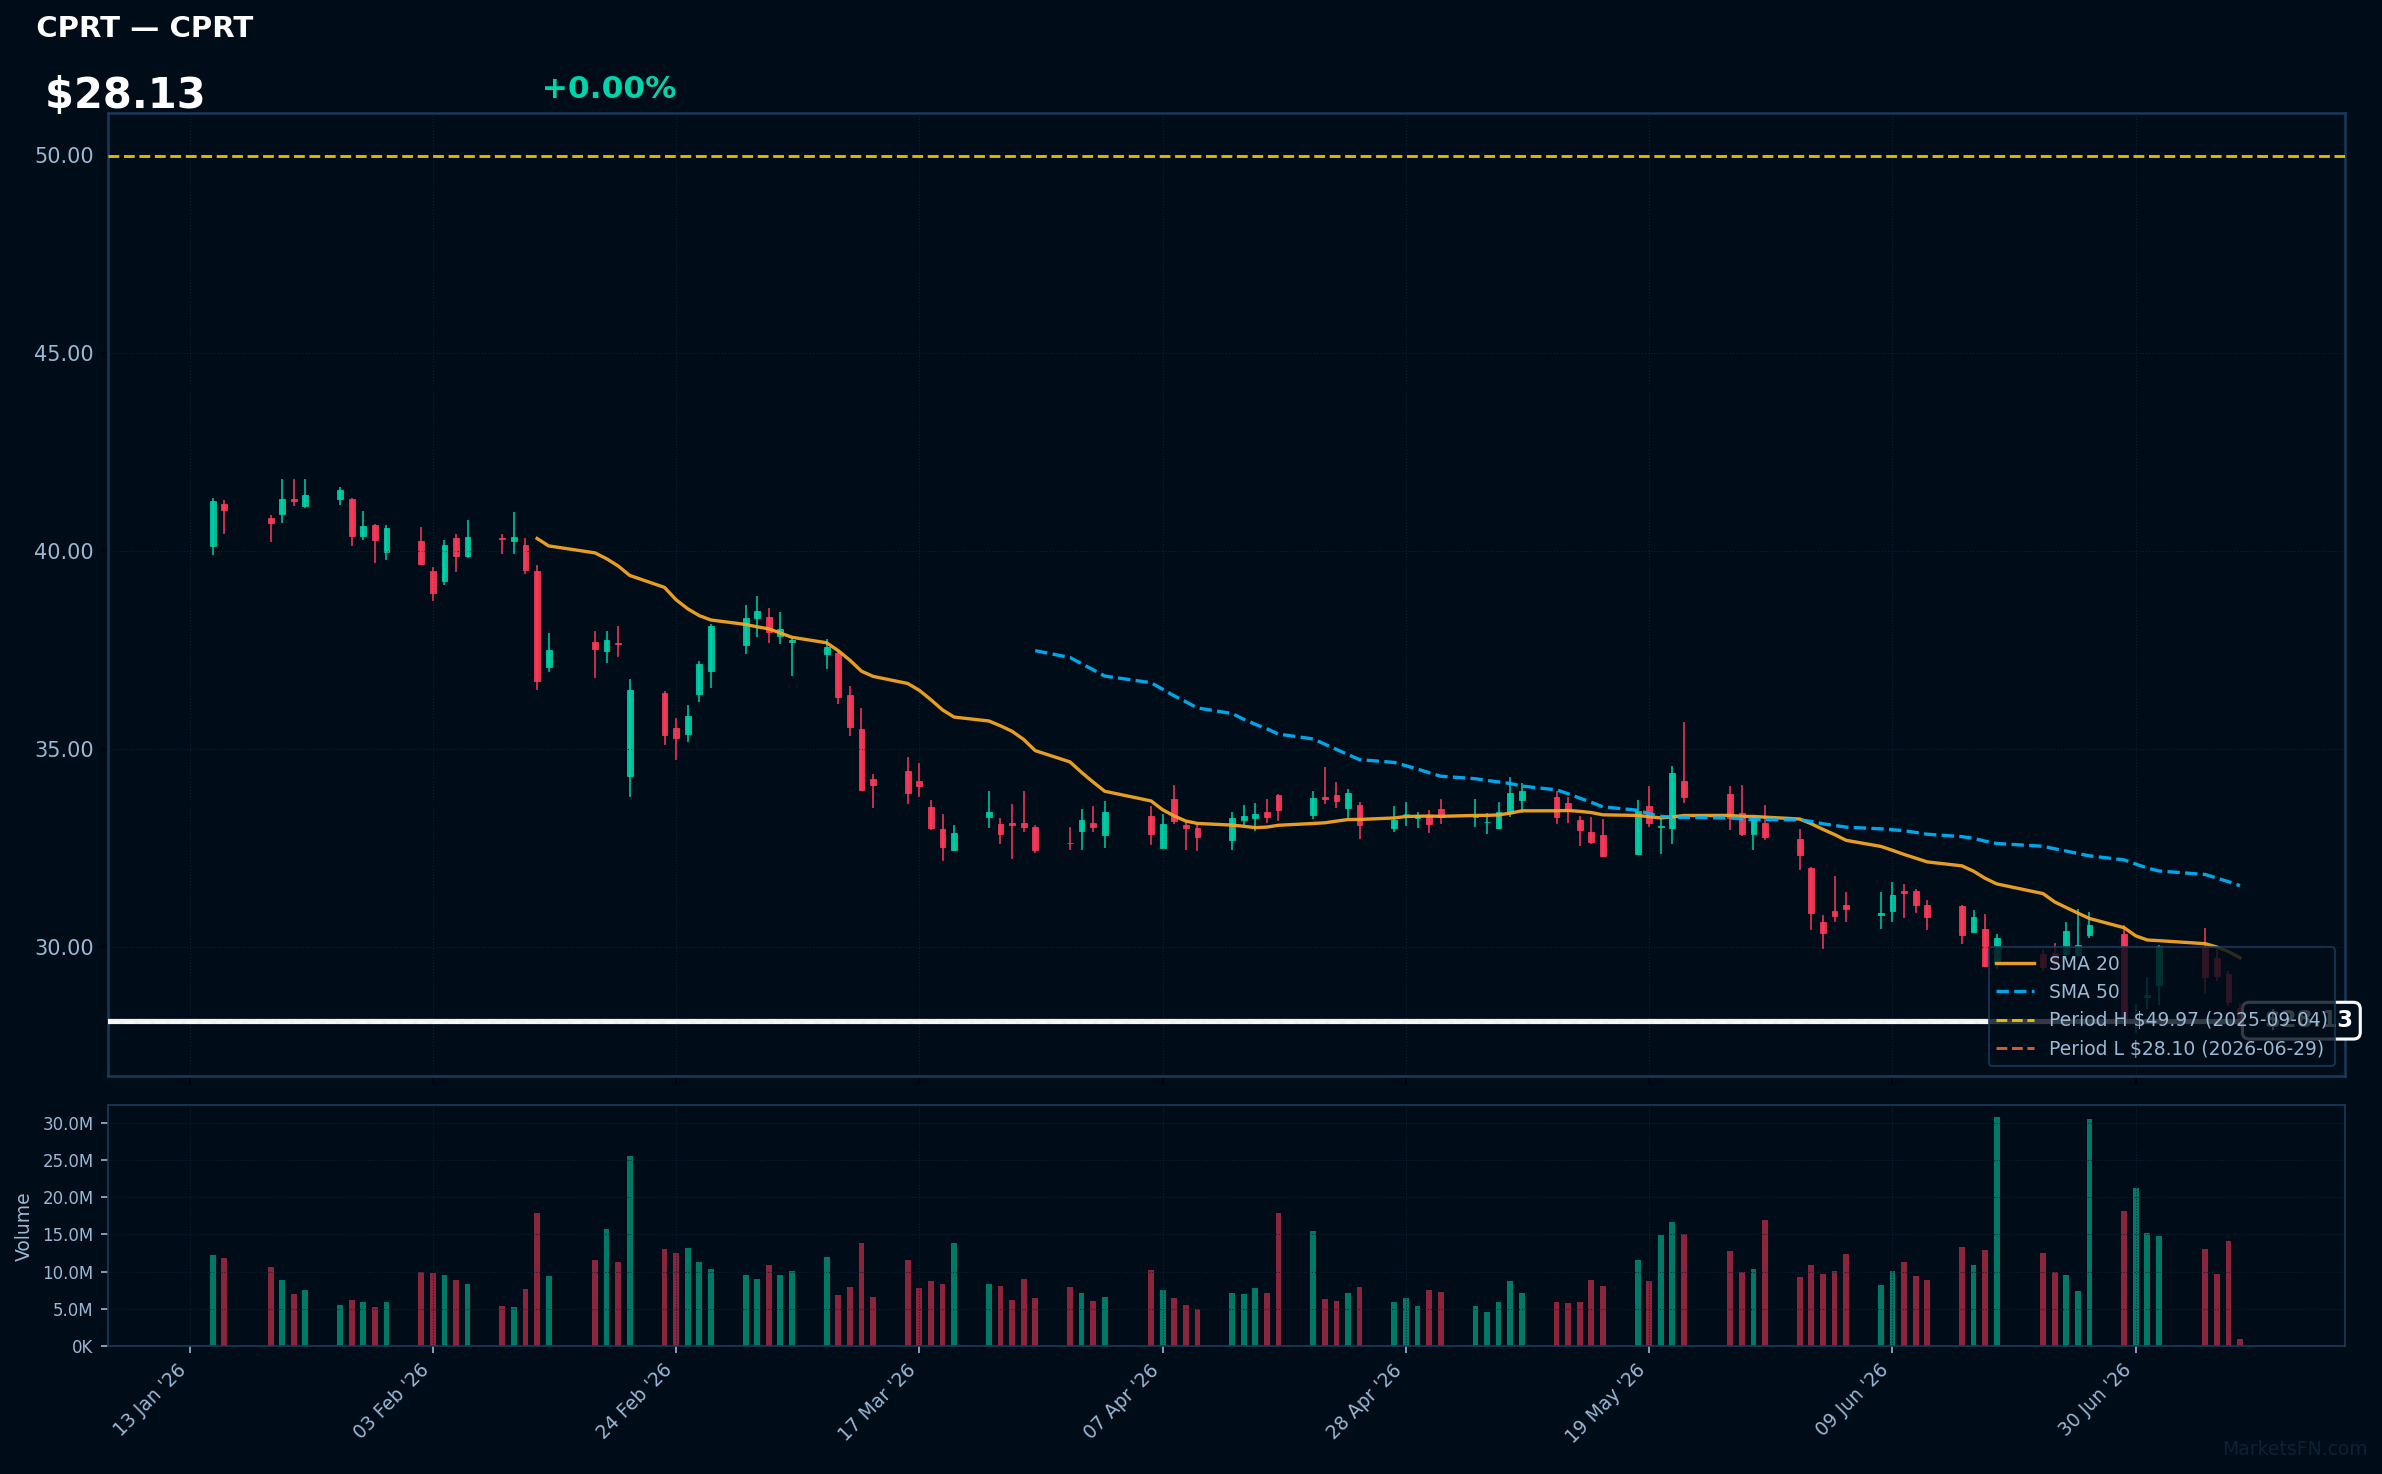
CPRT | Copart, Inc | Industrials | Price Last: $28.13 | % Realized: -40.95% | RSI: 37.4 | % above MA200: -24.4% | Trend: Below MA20, MA50, MA200
Copart, Inc (CPRT) operates online vehicle auction platforms, providing salvage and used vehicle sales. Investors should care about its market share, revenue growth, and ability to adapt to changing vehicle sourcing and auction dynamics.
CPRT's technicals indicate a sustained downtrend with price ($28.13) below MA20, MA50, and MA200. RSI(14) at 37.4 suggests bearish momentum, and proximity to 52-Week low (0.1% above) signals testing major support, potentially a warning sign.
Related headlines
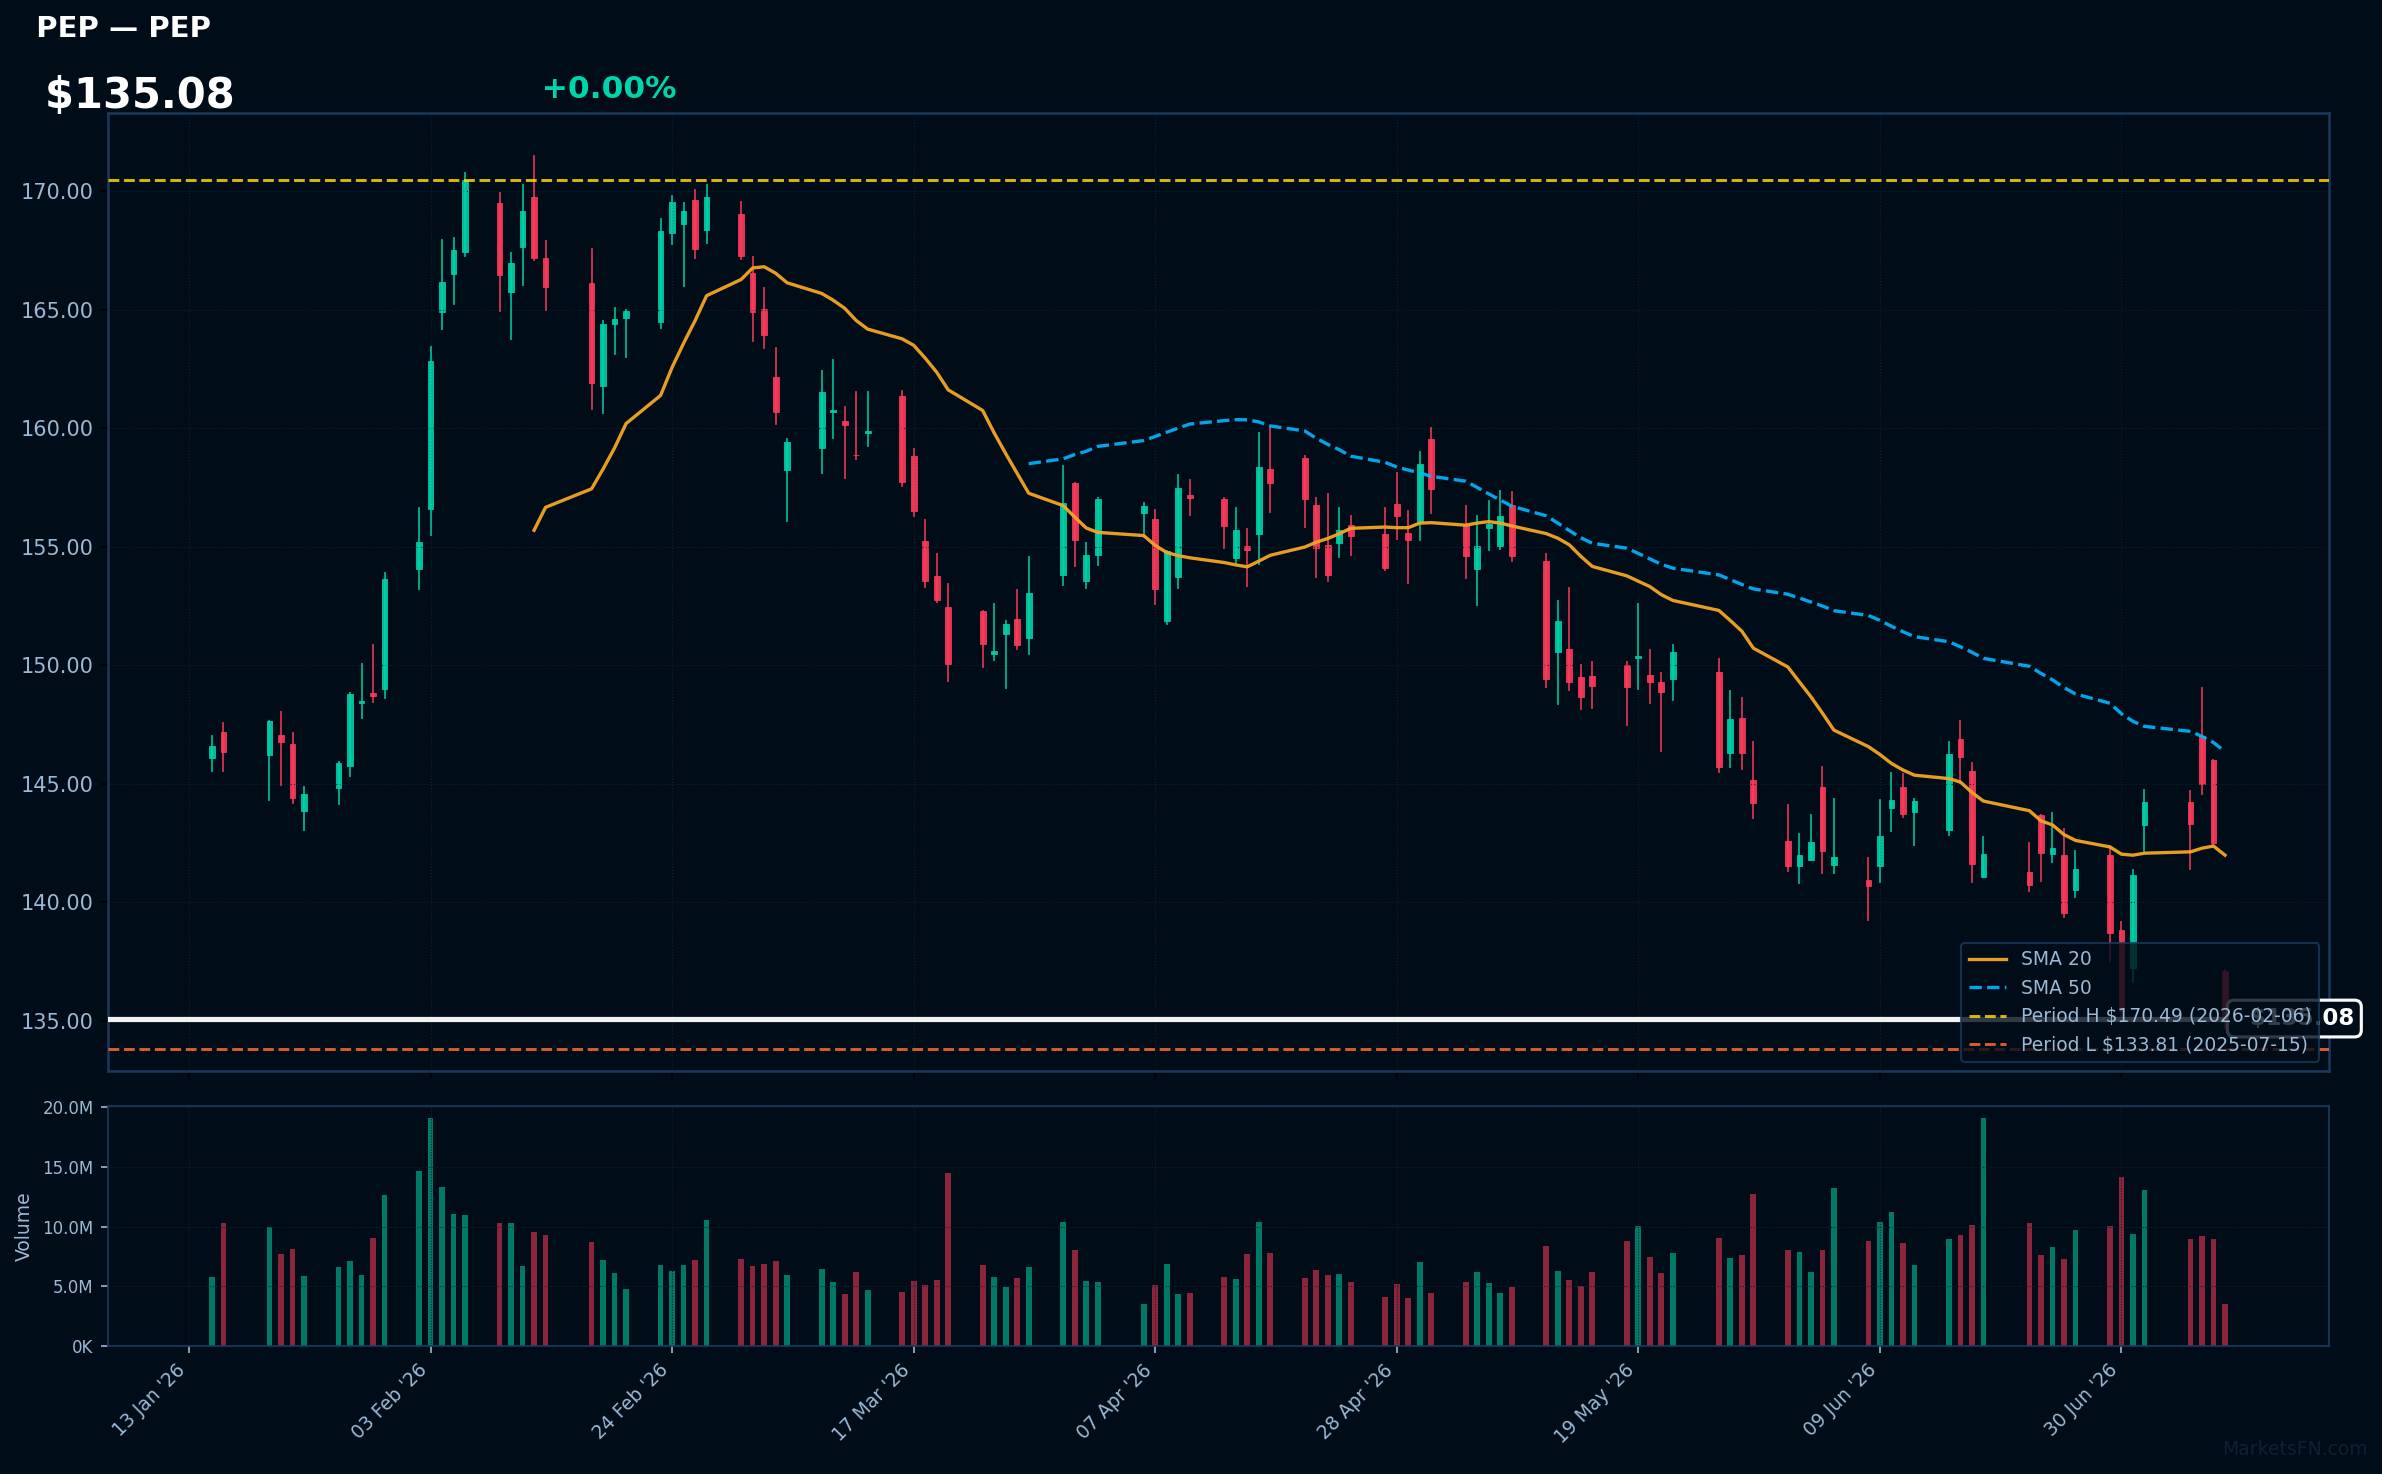
PEP | PepsiCo Inc | Consumer Defensive | Price Last: $135.11 | % Realized: +0.47% | RSI: 37.6 | % above MA200: -10.0% | Trend: Below MA20, MA50, MA200
PepsiCo Inc is a global food and beverage leader with brands like Pepsi, Lay's, and Gatorade, generating revenue through beverage sales, snack foods, and other categories. Investors care about its diversified portfolio and market share in the consumer staples sector.
PepsiCo's technicals indicate a sustained downtrend with price ($135.08) below MA20, MA50, and MA200. RSI(14) at 37.6 suggests bearish momentum, and the stock is 1.0% above its 52-Week low, testing major support, a potential warning sign.
Related headlines
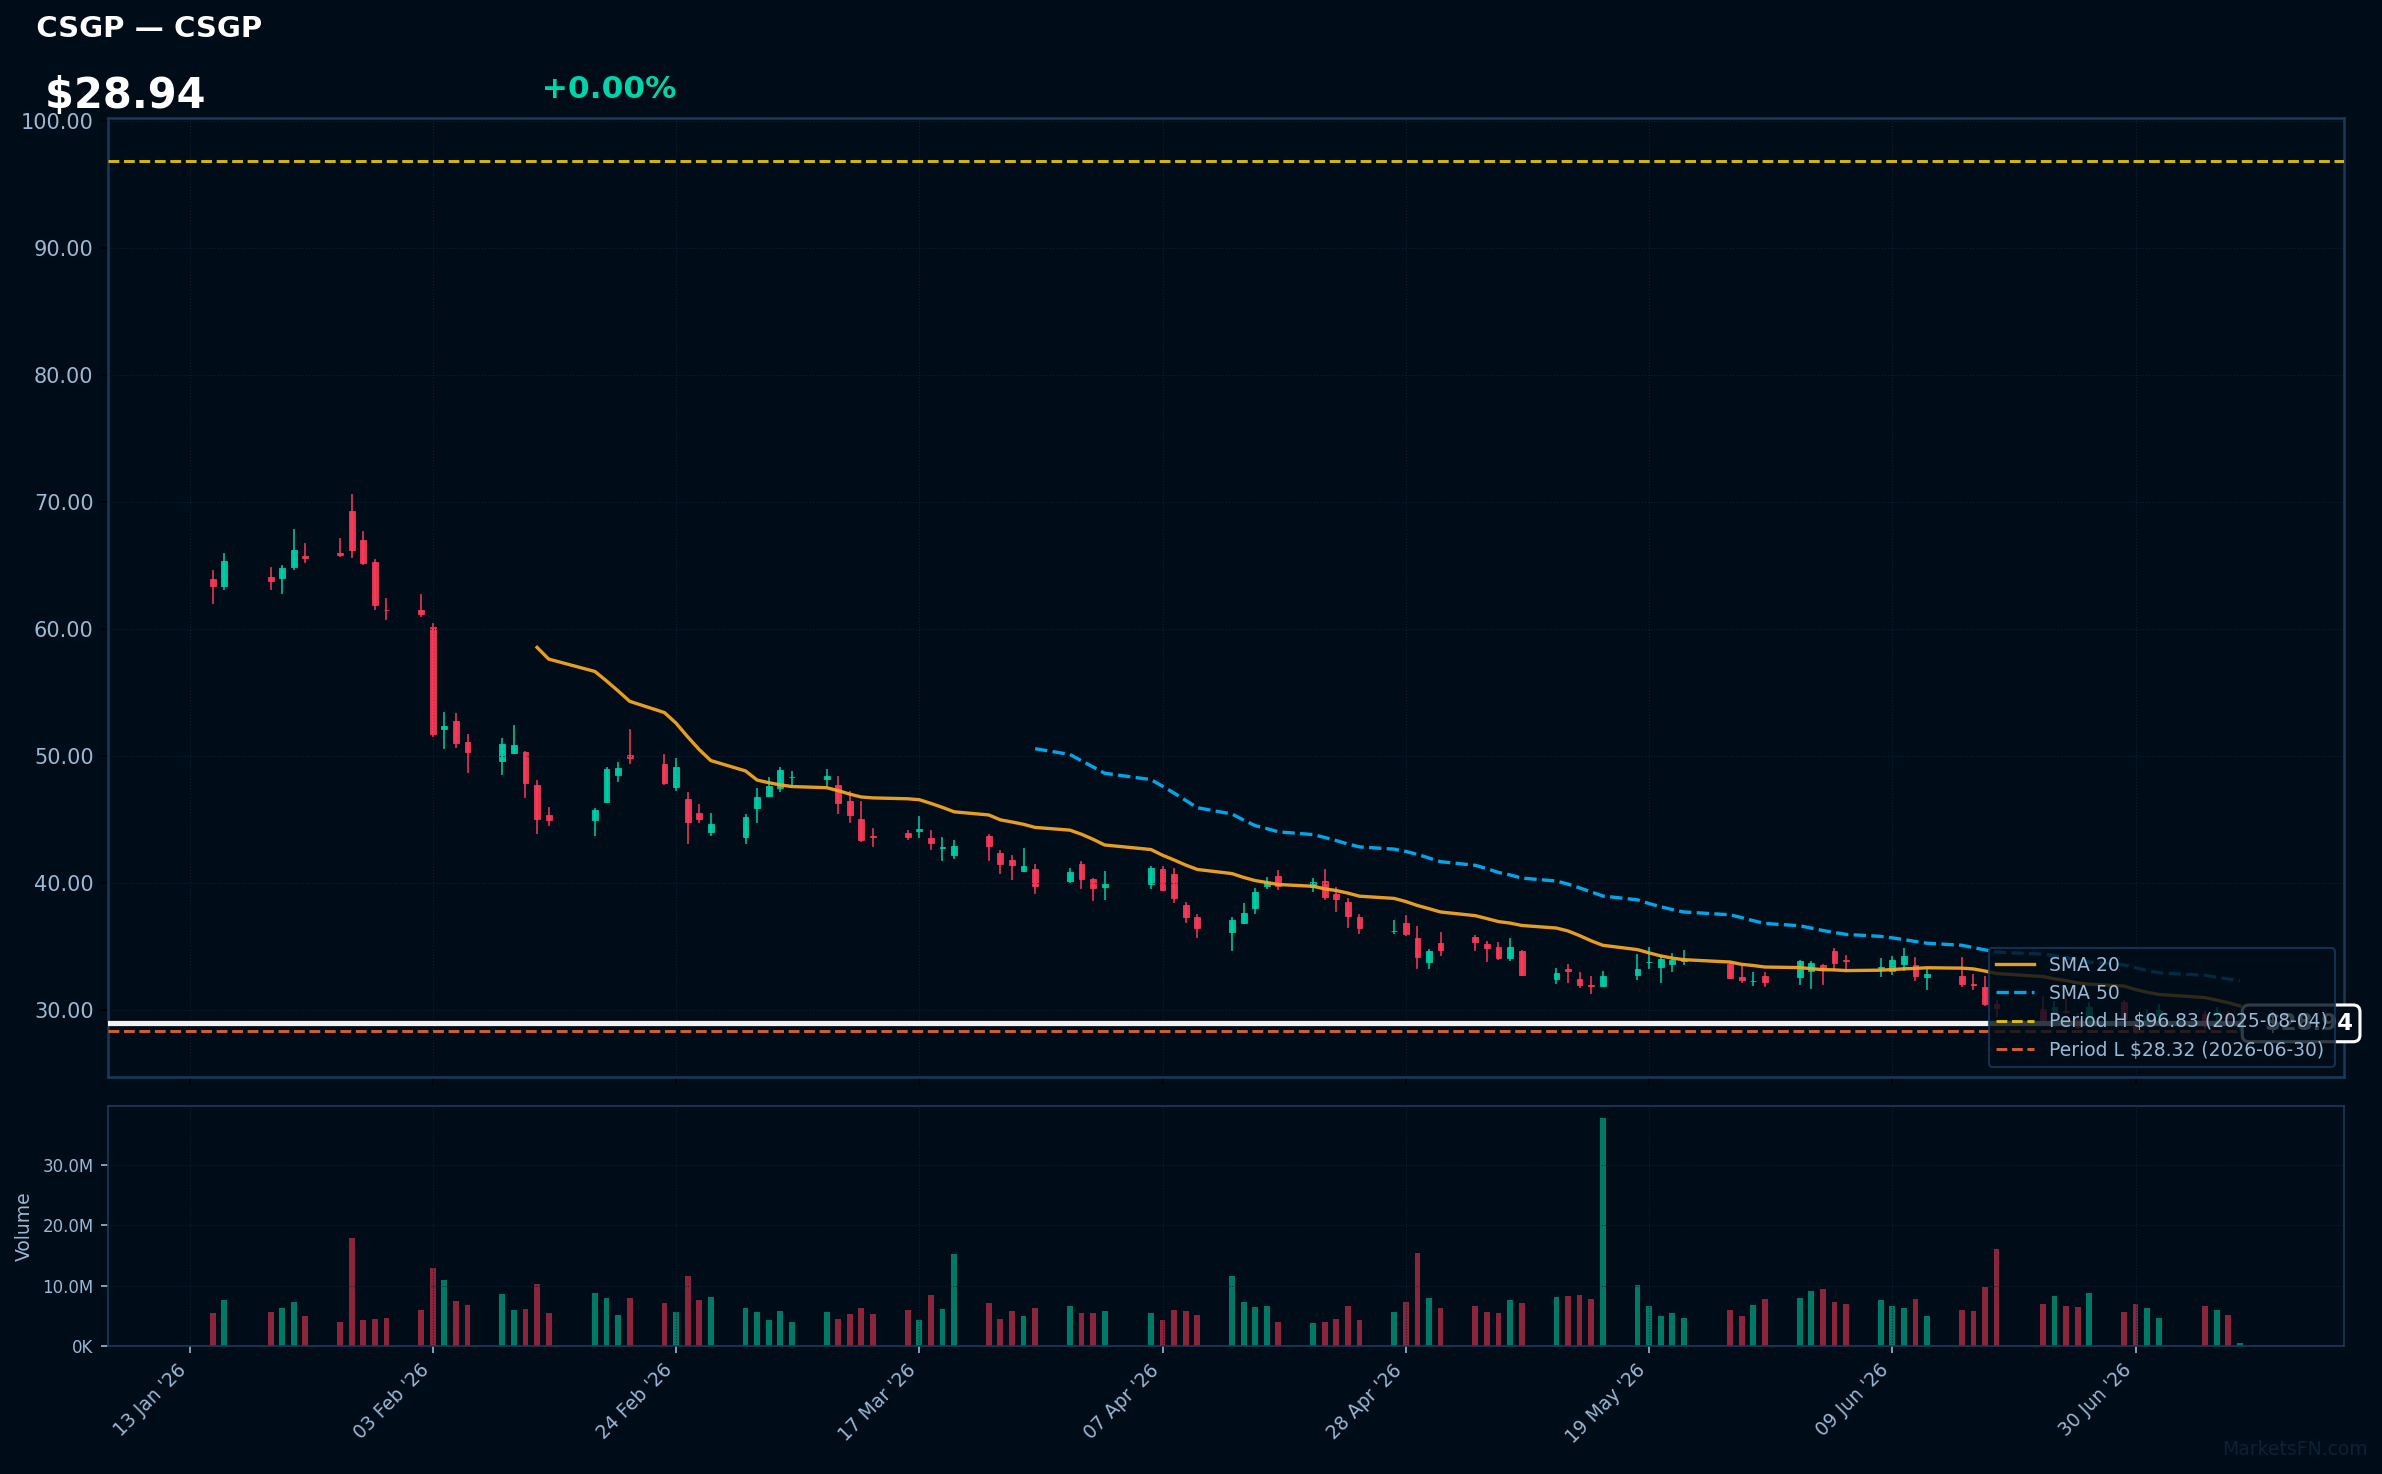
CSGP | Costar Group, Inc | Real Estate | Price Last: $28.94 | % Realized: -65.75% | RSI: 40.8 | % above MA200: -45.4% | Trend: Below MA20, MA50, MA200
Costar Group, Inc provides commercial real estate information, analytics, and online marketplaces. Investors should care because it dominates the CRE data space, offering insights that drive investment decisions.
CSGP's technical situation is bearish, with RSI(14) at 40.8, price below all key MAs (MA20, MA50, MA200), and a 52-Week low proximity of 2.2%, indicating a sustained downtrend and testing major support.
Related headlines
- CoStar Group Announces Launch of CoStar Platform in France
- CoStar Group to Report Financial Results for Second Quarter on July 28, 2026
- CoStar Group Invests in Wikicasa, Italys Agent-Backed Real Estate Marketplace
- CoStar Group Stockholders Overwhelmingly Reelect Director Nominees and Support Say-on-Pay at Annual Meeting of Stockholders
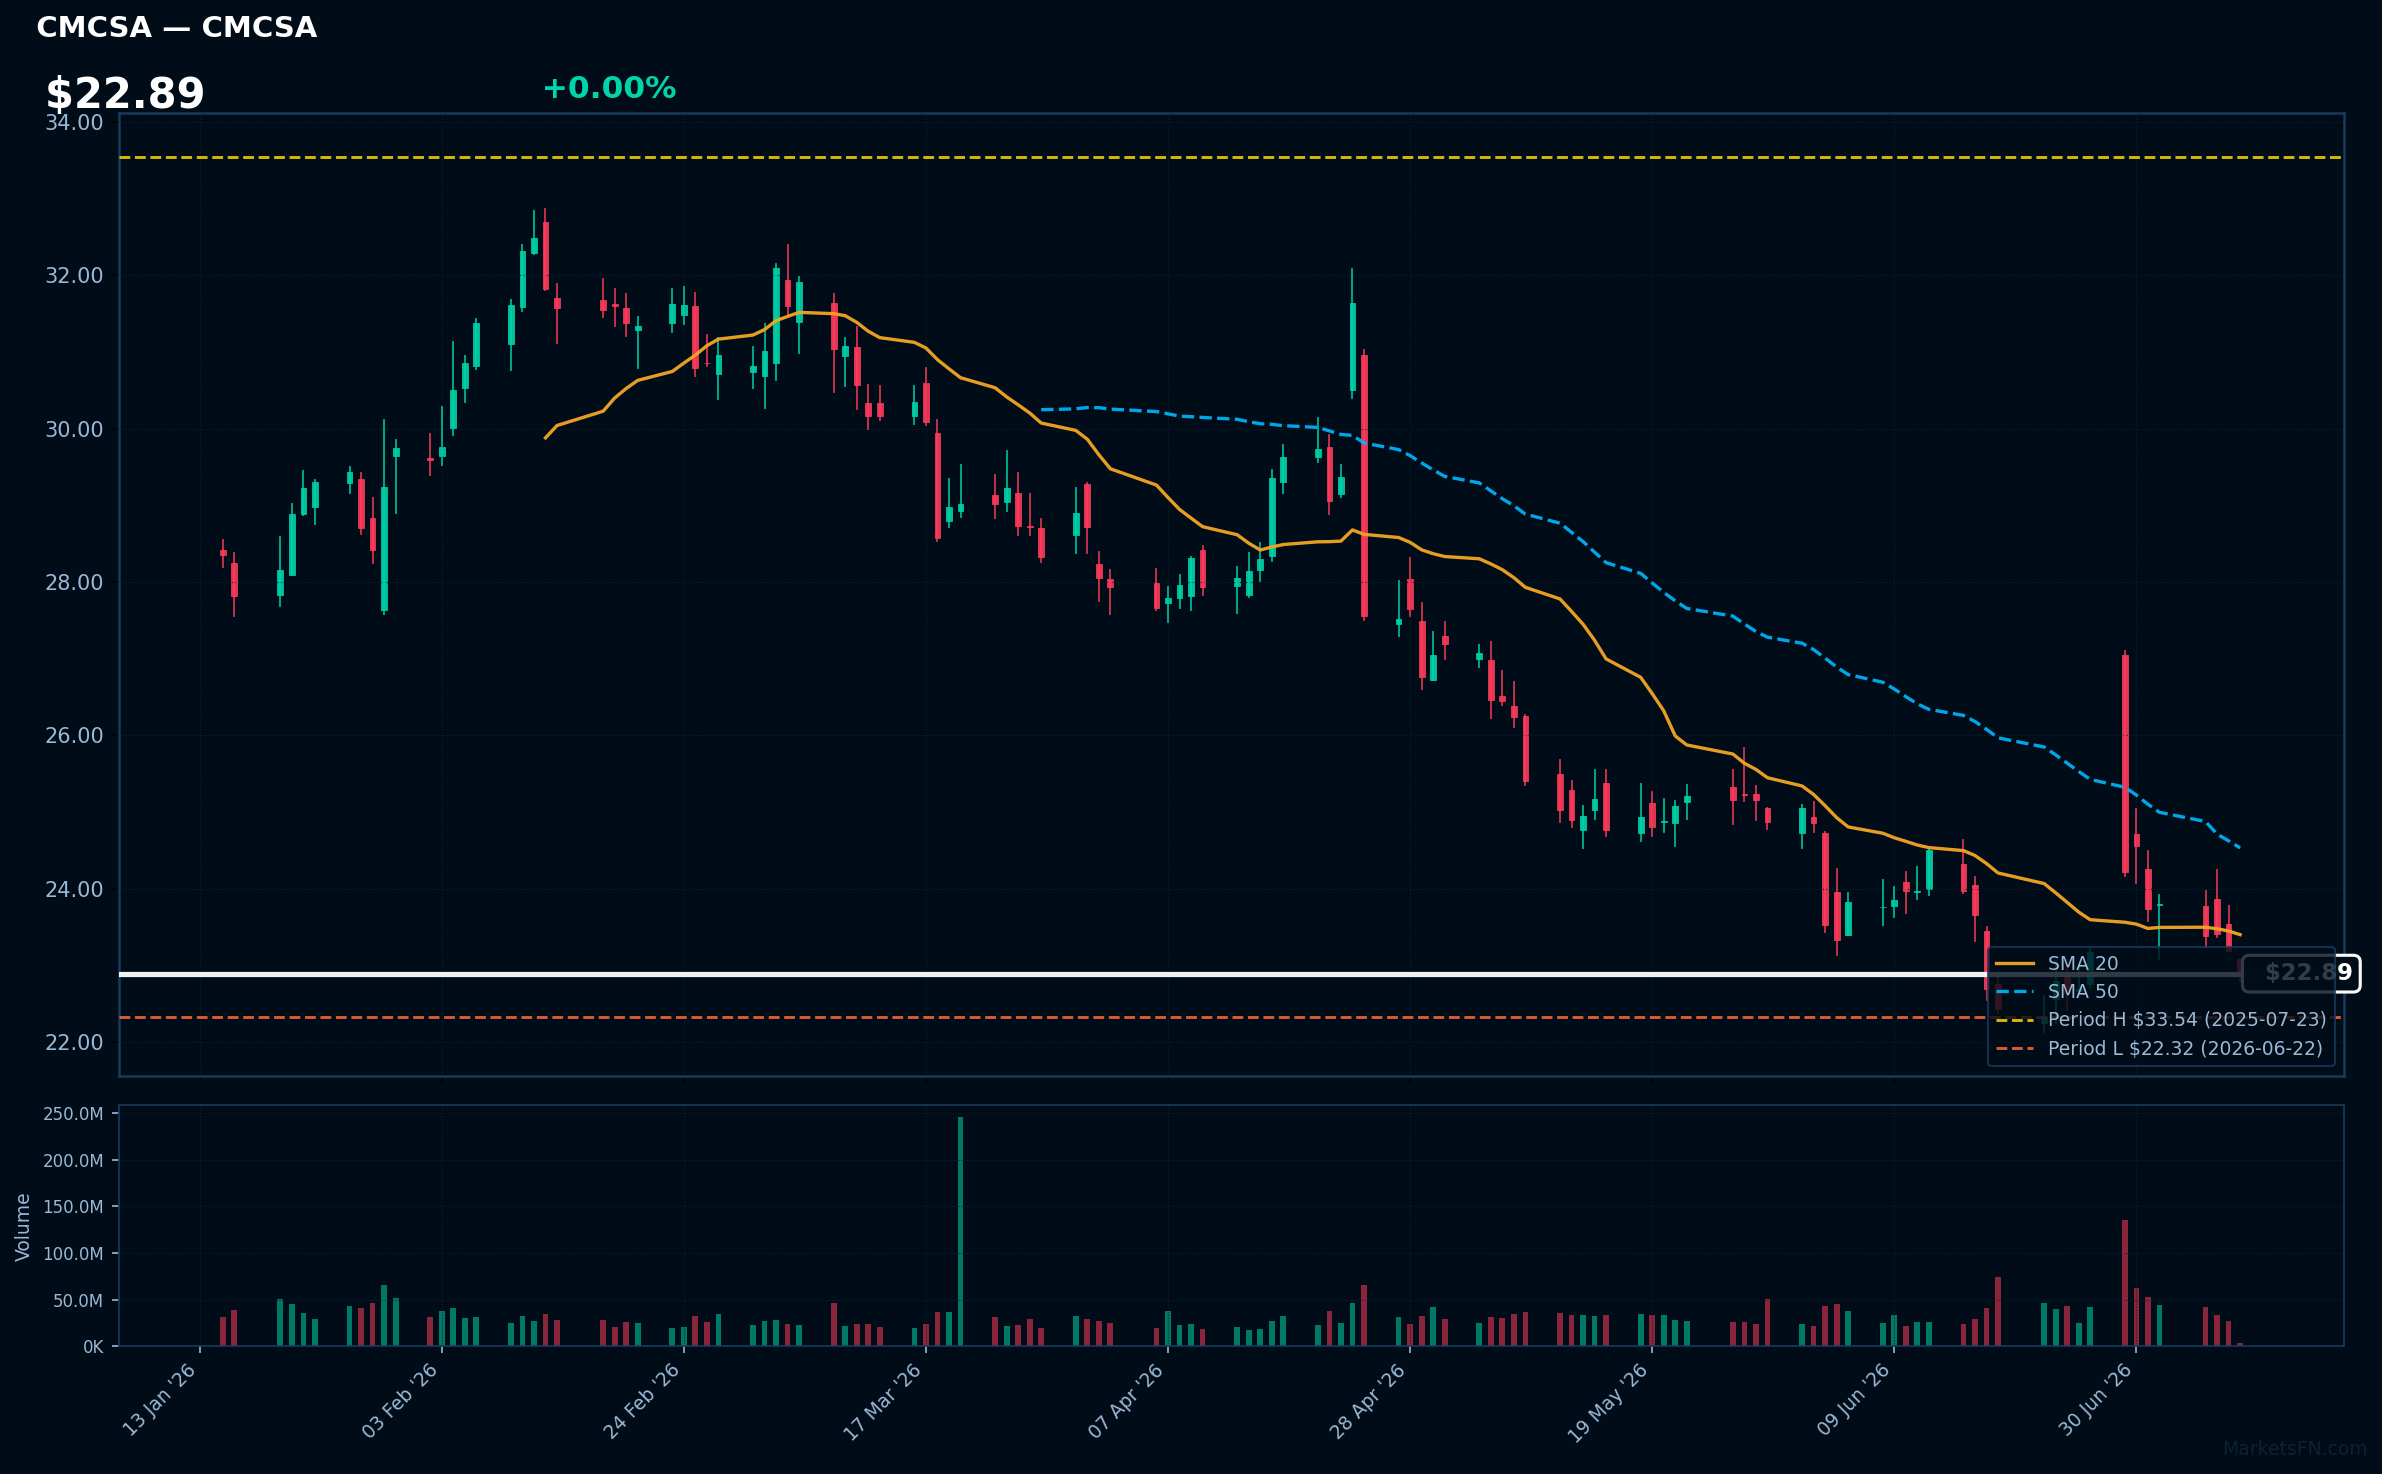
CMCSA | Comcast Corp | Communication Services | Price Last: $22.91 | % Realized: -31.39% | RSI: 40.0 | % above MA200: -16.4% | Trend: Below MA20, MA50, MA200
Comcast Corp is a media and telecommunications conglomerate providing cable television, internet, and phone services, as well as owning NBCUniversal, a major media company with film, television, and theme park assets, making it a significant player in both consumer connectivity and content creation.
Comcast Corp's current technical situation is bearish, with an RSI(14) of 40.0 indicating weak momentum, and a sustained downtrend as price ($22.89) remains below MA20, MA50, and MA200, with the stock 2.6% above its 52-Week low, testing major support.
Related headlines
Market Commentary
The Nasdaq 100 stocks listed are near 52-week extremes, with some companies like CSX Corp and Electronic Arts, Inc nearing their 52-week highs, while others like O'Reilly Automotive, Inc and Copart, Inc are close to their 52-week lows. This indicates a significant price movement, potentially driven by underlying sector trends or company-specific news.
The technology sector is a significant component of the Nasdaq 100, and the stocks near 52-week extremes reflect various macro themes. Companies like Apple Inc and Fortinet Inc, near their 52-week highs, may be influenced by demand for tech products and cybersecurity solutions. Conversely, stocks like PepsiCo Inc and Comcast Corp, near their 52-week lows, may be impacted by consumer trends and media industry dynamics.
Key levels to watch include the 52-week highs and lows for these stocks. A breakout or breakdown from these levels could be triggered by earnings reports, industry announcements, or broader market trends. Monitoring these levels and potential catalysts will be crucial in understanding the future direction of these Nasdaq 100 stocks.
Methodology: All 101 Nasdaq 100 constituents screened. 52-week high = highest daily close over the past 252 trading days (approx. 1 year). 52-week low = lowest daily close over the same period. Distance = (current price / extreme − 1) × 100. Technical indicators computed on up to 1 year of daily OHLCV data.
Disclaimer: For informational purposes only. Not investment advice. Past performance is not indicative of future results.

