S&P 500: Massimi e Minimi a 52 Settimane
· market-analysis · MarketsFN Team
S&P 500 52-Week Highs & Lows Radar: Apple (AAPL), Intuit (INTU) and more
Screening all 503 S&P 500 constituents for stocks nearest to their 52-week high and their 52-week low. Data as of May 21, 2026. % Realized = 52-week total return.
Legend: RSI > 70 = overbought · RSI < 30 = oversold · Green % Realized = positive 52W return · Red = negative.
📈 Nearest to 52-Week High
Sectors represented: Technology (2), Financial (2), Basic Materials (1)
| Ticker | Company | Sector | Price Last | % Realized | 52-Week High Date | RSI | % above MA200 | Trend |
|---|---|---|---|---|---|---|---|---|
| AAPL | Apple Inc | Technology | $304.49 | +50.67% | 2026-05-21 | 75.9 | +16.6% | Above MA20, MA50, MA200 |
| MS | Morgan Stanley | Financial | $198.85 | +58.70% | 2026-05-21 | 65.5 | +17.5% | Above MA20, MA50, MA200 |
| LIN | Linde Plc | Basic Materials | $515.39 | +13.15% | 2026-05-21 | 58.9 | +11.0% | Above MA20, MA50, MA200 |
| GS | Goldman Sachs Group, Inc | Financial | $982.37 | +65.53% | 2026-05-21 | 64.0 | +16.0% | Above MA20, MA50, MA200 |
| PANW | Palo Alto Networks Inc | Technology | $250.35 | +38.12% | 2026-05-21 | 81.2 | +33.8% | Above MA20, MA50, MA200 |
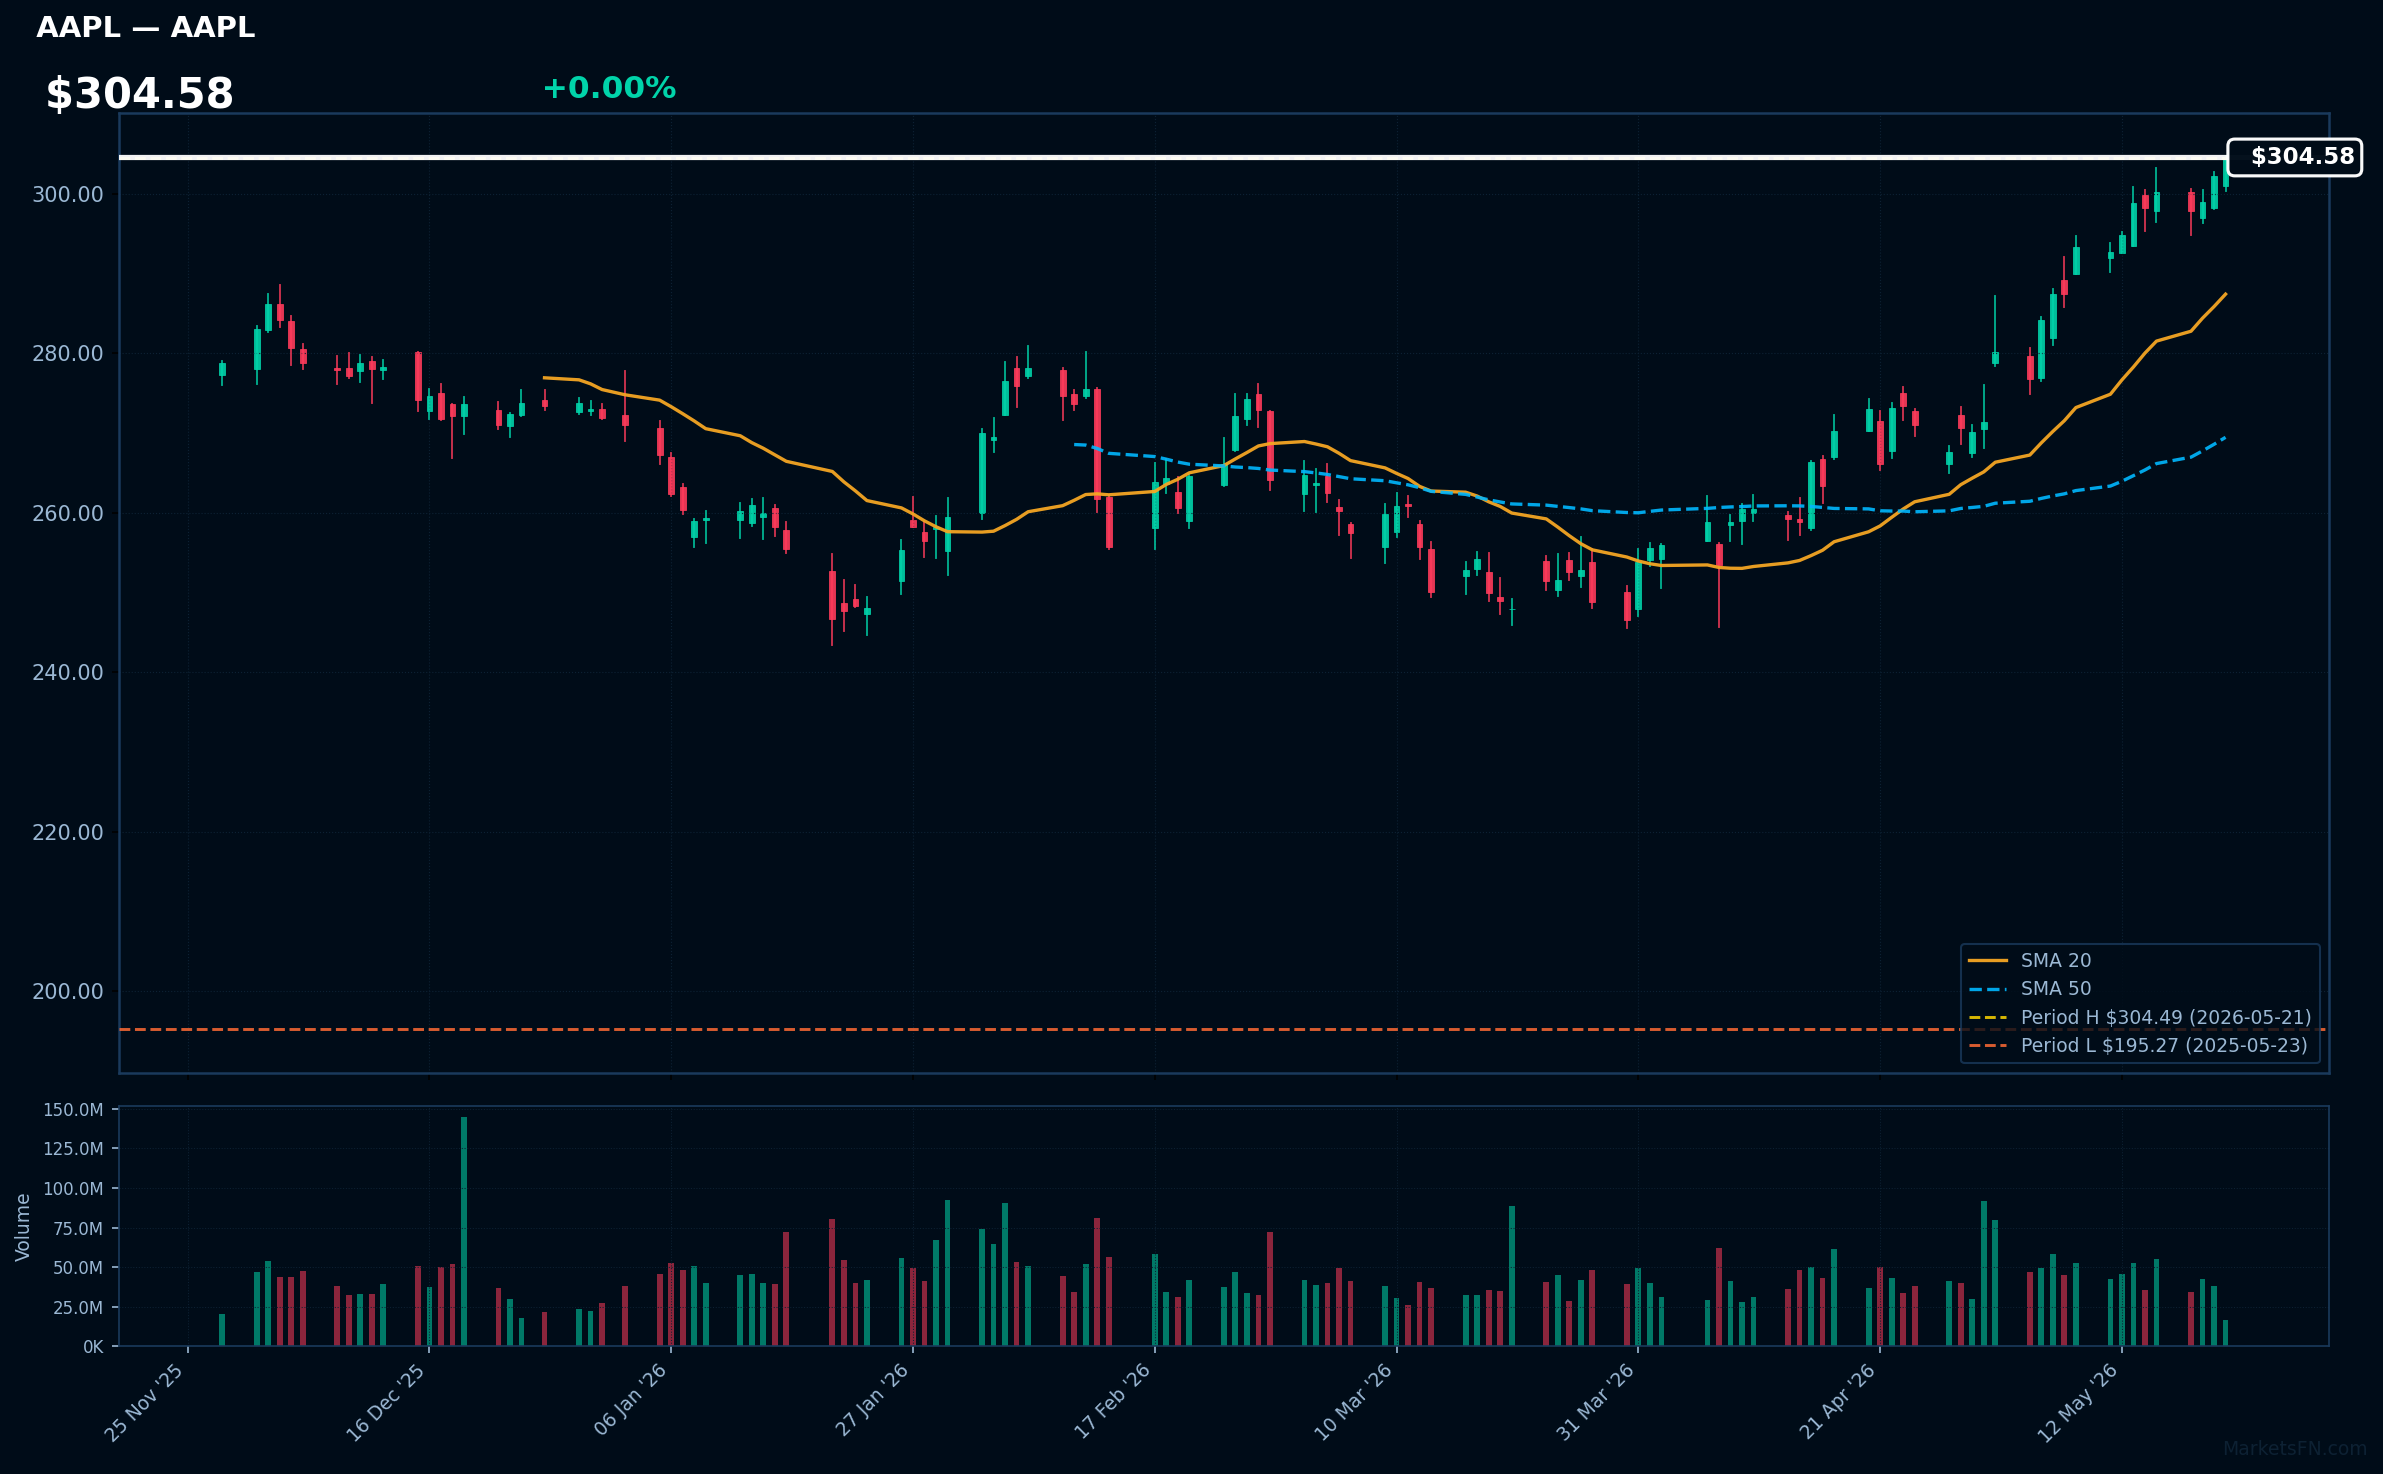
AAPL | Apple Inc | Technology | Price Last: $304.49 | % Realized: +50.67% | RSI: 75.9 | % above MA200: +16.6% | Trend: Above MA20, MA50, MA200
Commentary unavailable.
Related headlines
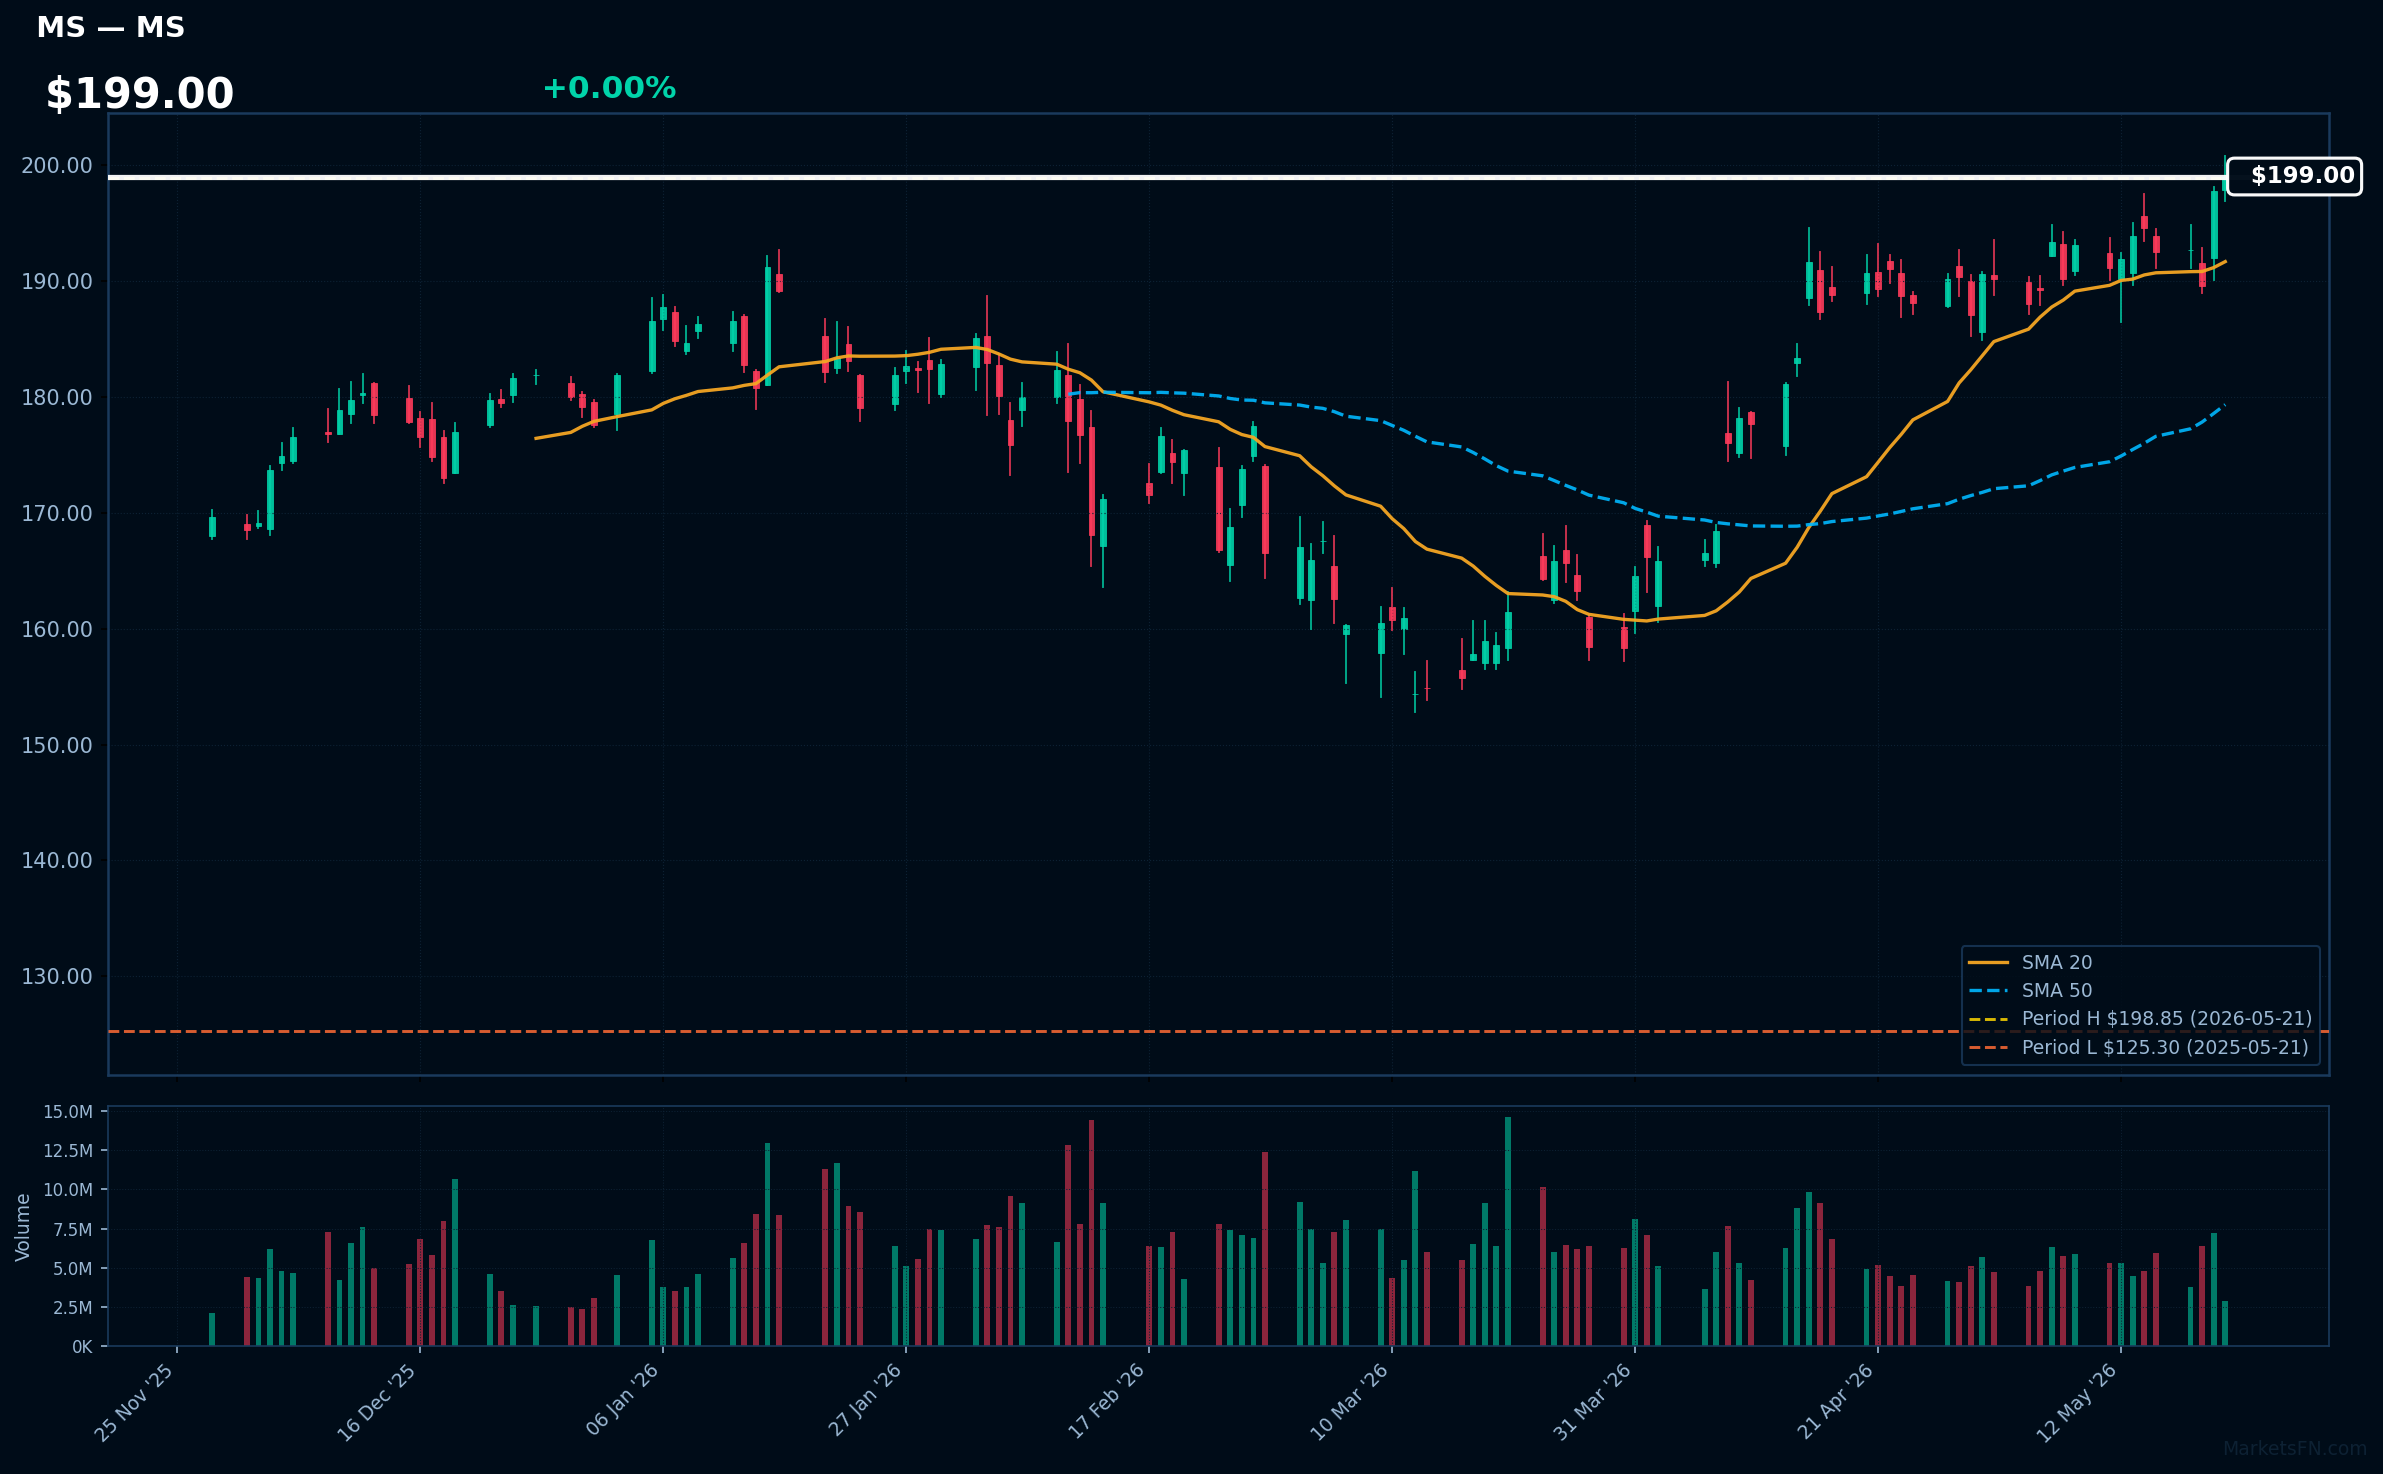
MS | Morgan Stanley | Financial | Price Last: $198.85 | % Realized: +58.70% | RSI: 65.5 | % above MA200: +17.5% | Trend: Above MA20, MA50, MA200
Commentary unavailable.
Related headlines
- Inside SpaceX's IPO: Goldman Sachs takes prestigious lead spot while Morgan Stanley plays a major role for retail investors
- Peak valuation leaves IT hardware vulnerable to downgrades, Morgan Stanley warns
- Evercore's Kiely, Morgan Stanley's Cheng Talk AI Deals
- Morgan Stanley pushes into crypto with Solana staking ETF filing
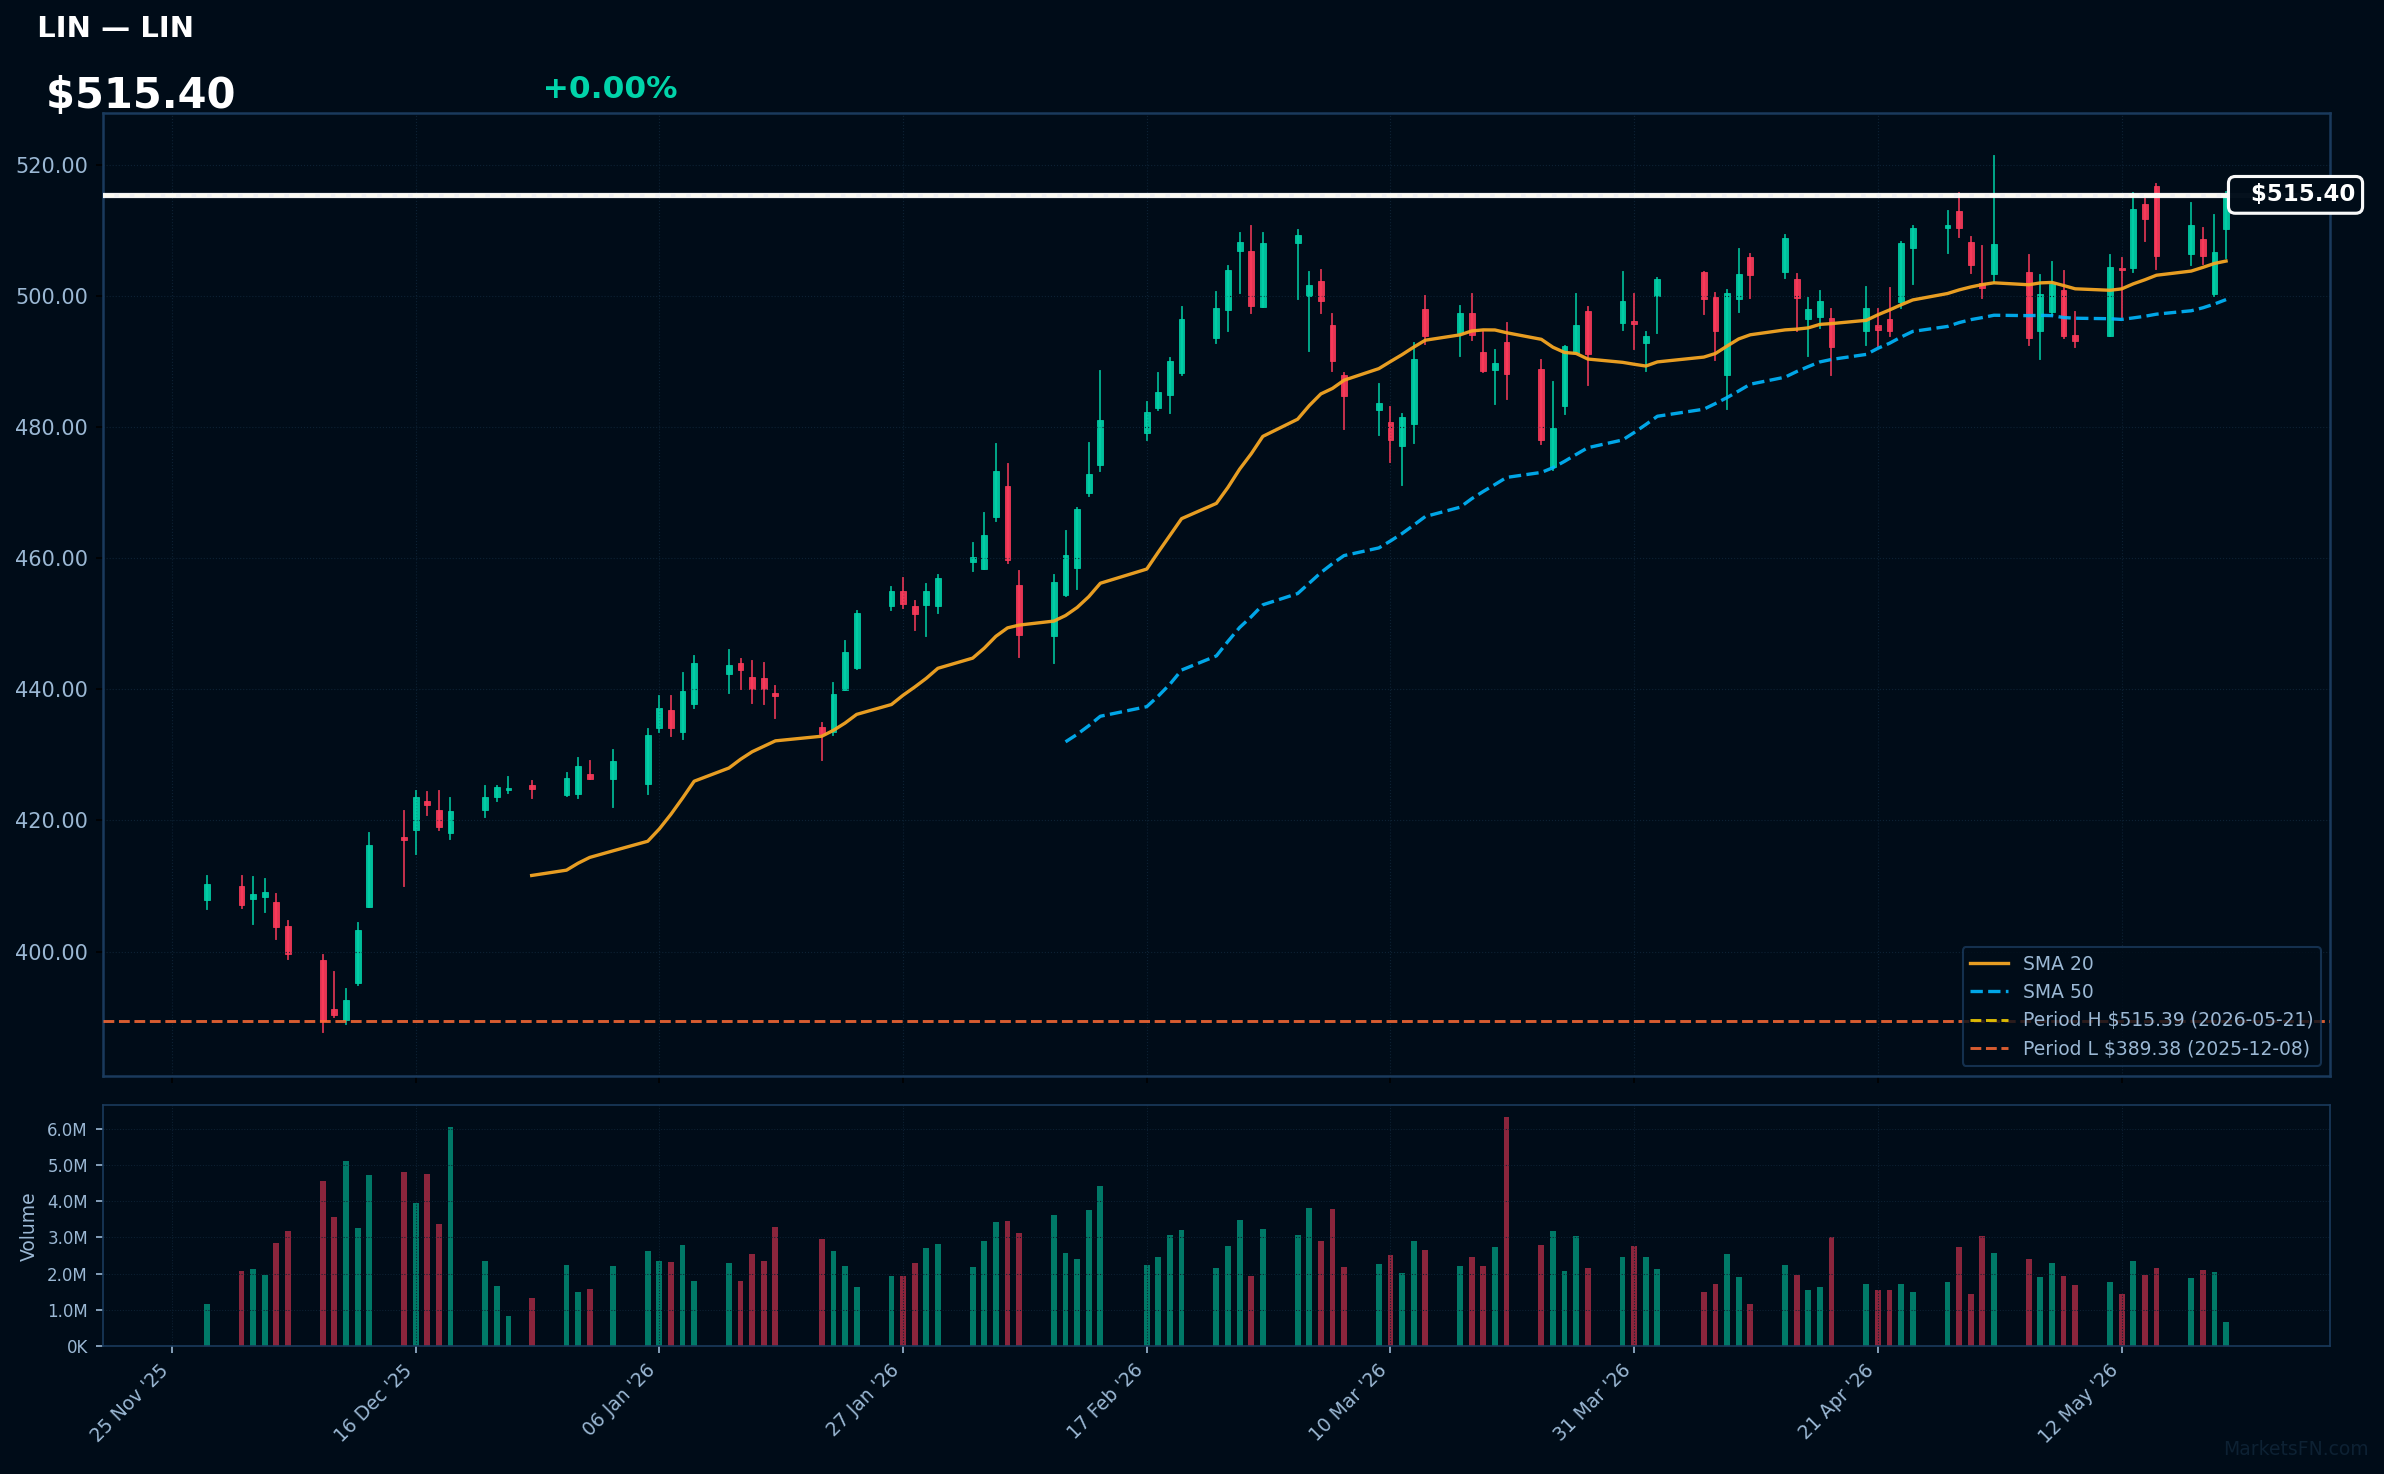
LIN | Linde Plc | Basic Materials | Price Last: $515.39 | % Realized: +13.15% | RSI: 58.9 | % above MA200: +11.0% | Trend: Above MA20, MA50, MA200
Commentary unavailable.
Related headlines
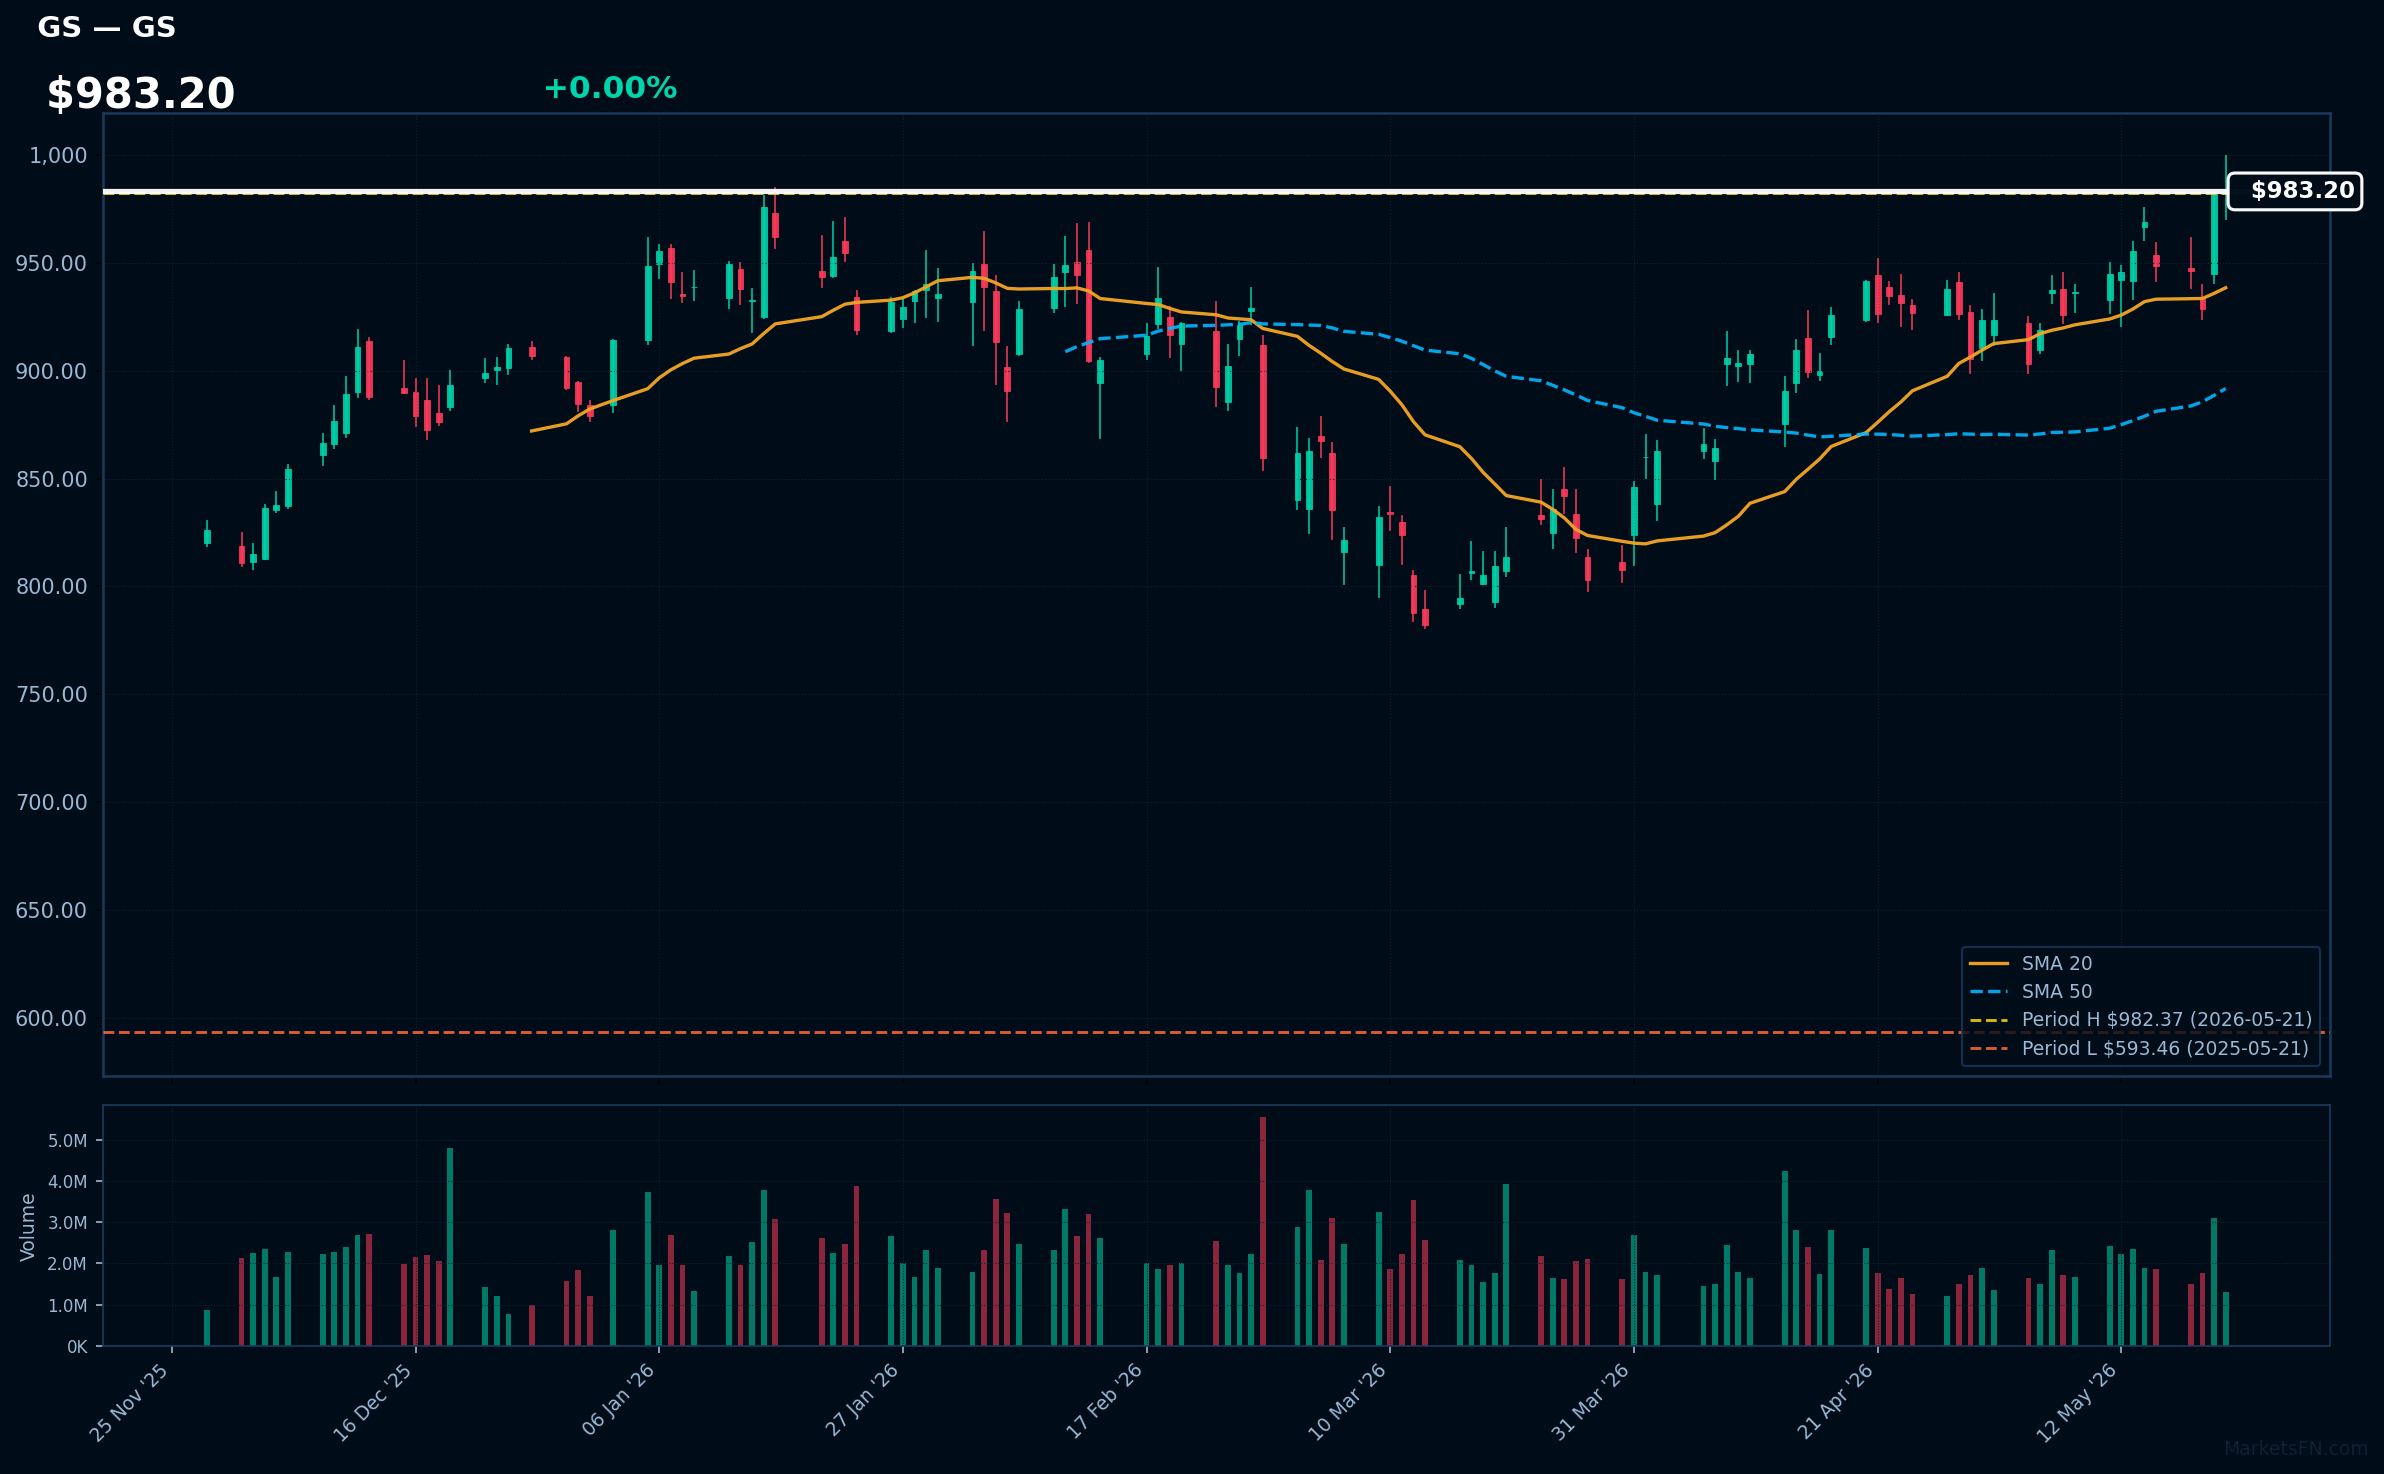
GS | Goldman Sachs Group, Inc | Financial | Price Last: $982.37 | % Realized: +65.53% | RSI: 64.0 | % above MA200: +16.0% | Trend: Above MA20, MA50, MA200
Commentary unavailable.
Related headlines
- Goldman Chases SpaceX's $75 Billion IPO Prize
- Inside SpaceX's IPO: Goldman Sachs takes prestigious lead spot while Morgan Stanley plays a major role for retail investors
- Blockchain.com Files Confidentially for IPO as Crypto Listings Regain Momentum
- As Iran war drags on, this is how quickly global oil stocks are being depleted - and travel season is starting soon
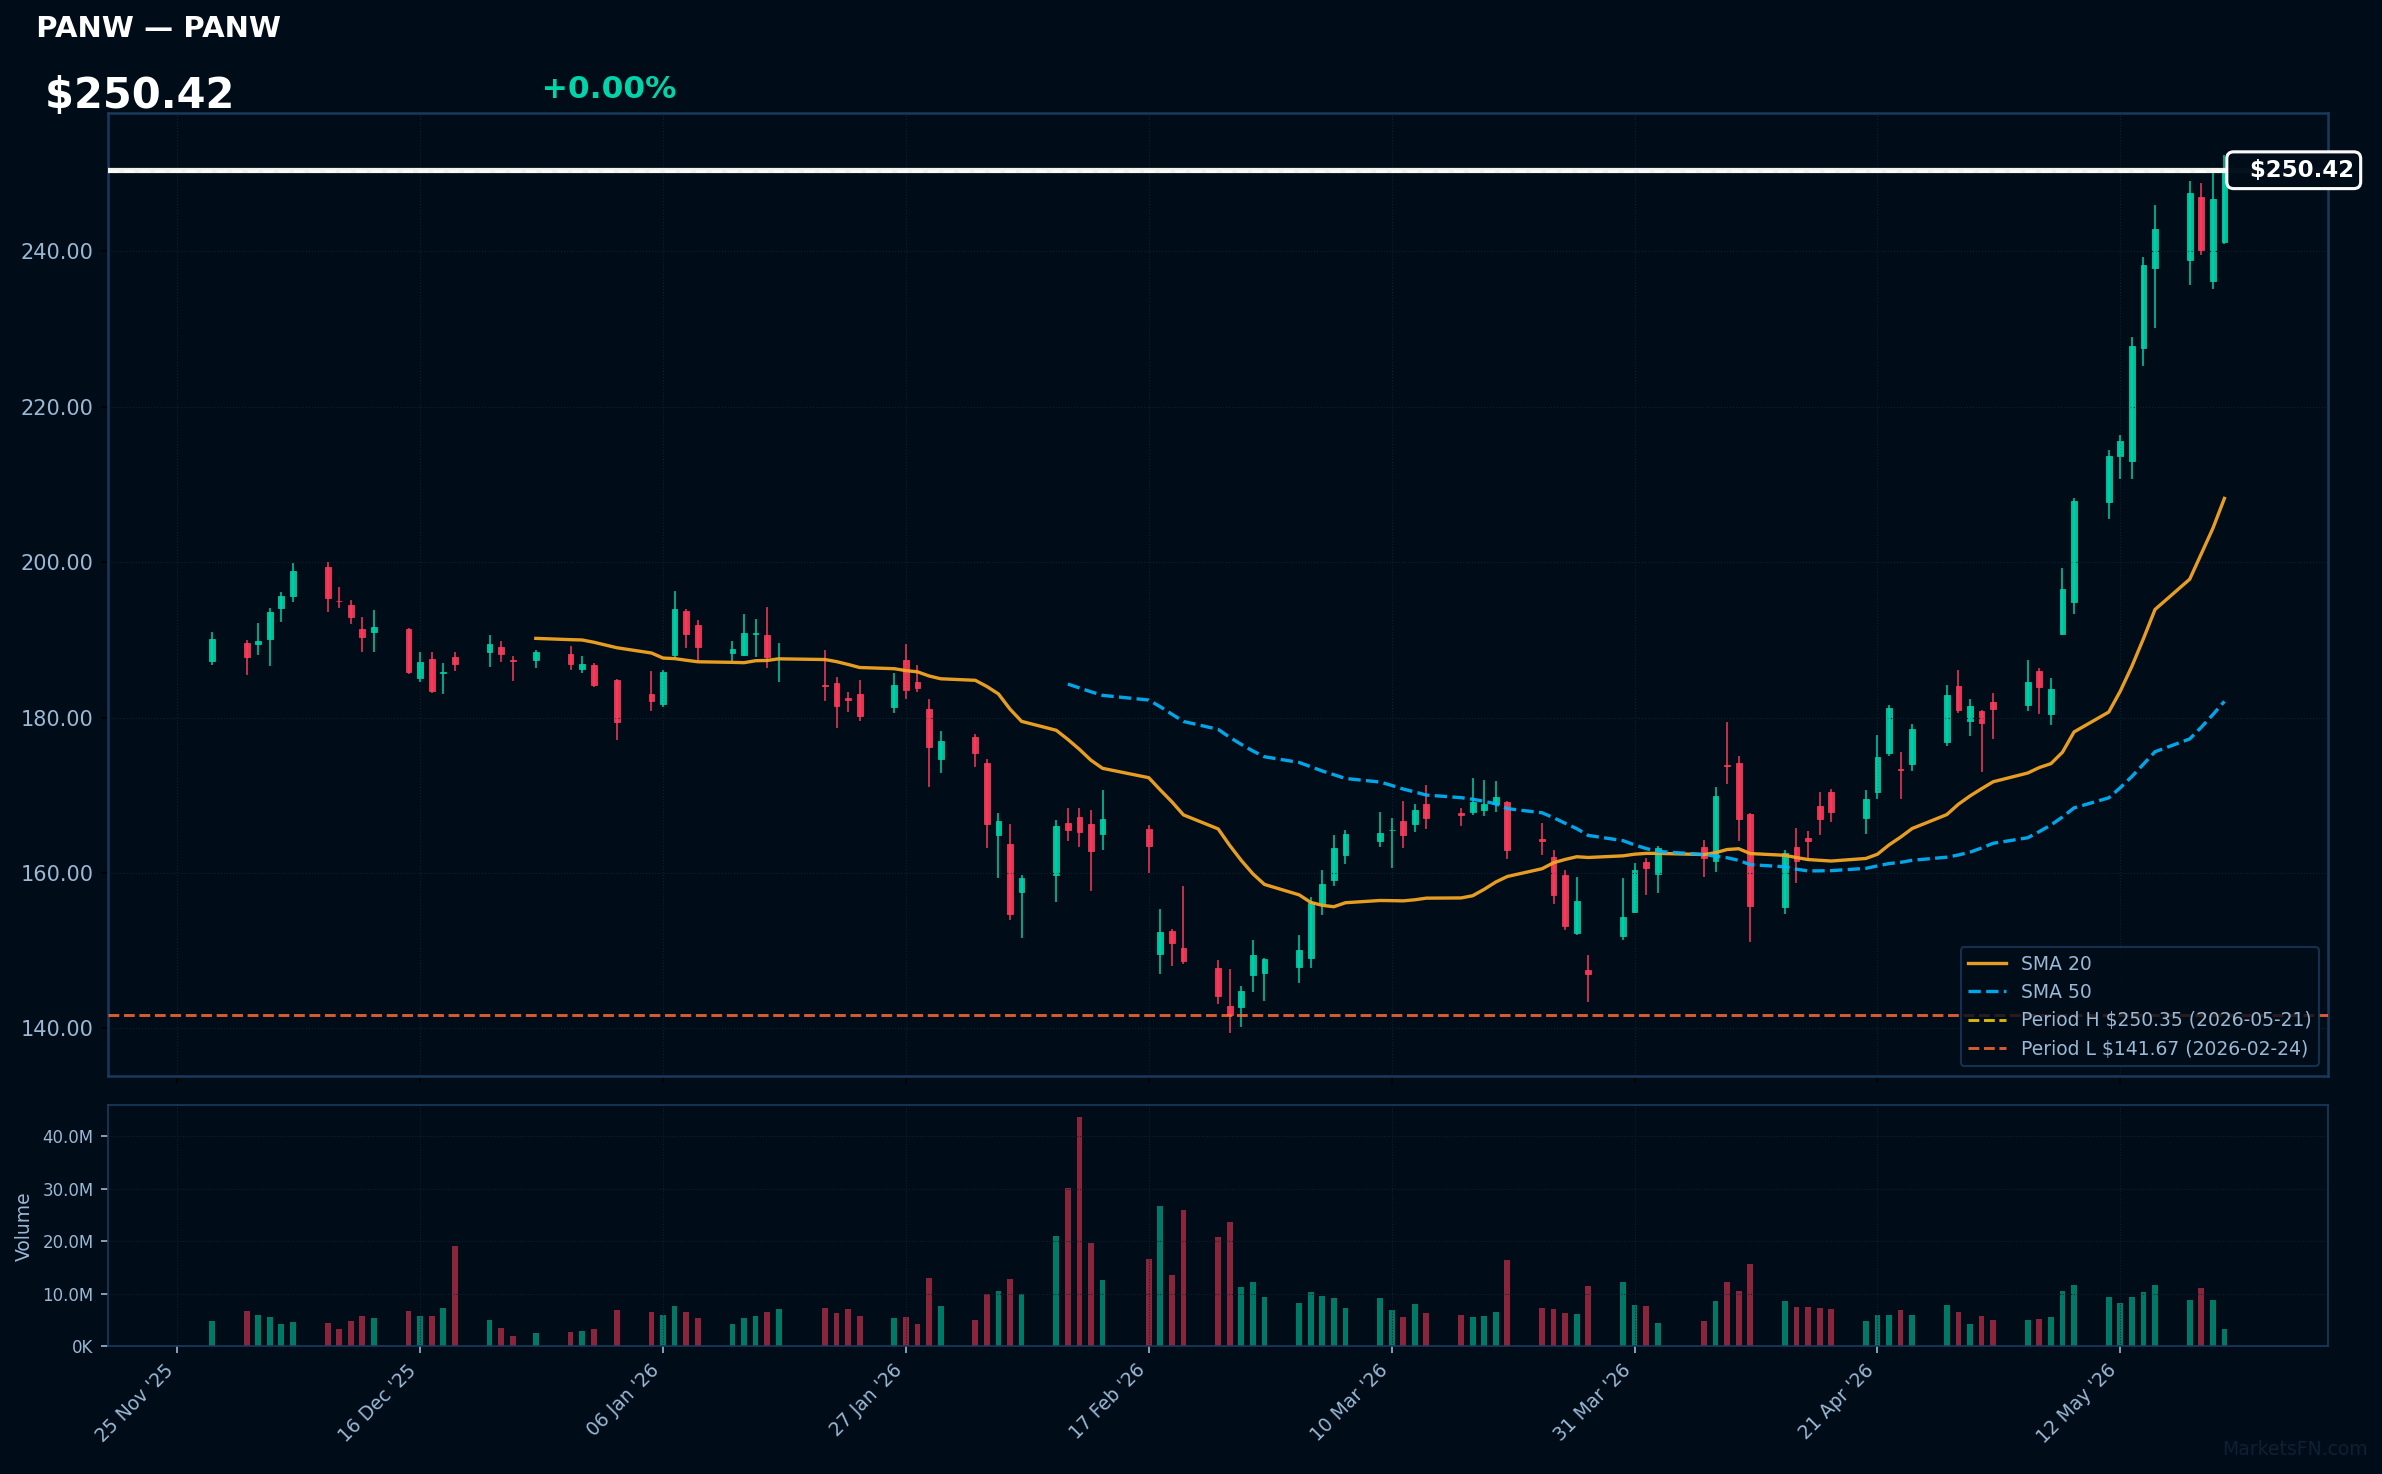
PANW | Palo Alto Networks Inc | Technology | Price Last: $250.35 | % Realized: +38.12% | RSI: 81.2 | % above MA200: +33.8% | Trend: Above MA20, MA50, MA200
Commentary unavailable.
Related headlines
- Watch Palo Alto Gain Over 2,650% Via Institutional Inflows
- Interview: Governments are losing the AI cybersecurity race, and Palo Alto Networks thinks it has the answer
- Palo Alto Networks hits a big milestone. Why cybersecurity stocks are so hot right now.
- Cybersecurity Stocks: Rosenblatt Hikes CrowdStrike, Palo Alto Price Targets
📉 Nearest to 52-Week Low
Sectors represented: Technology (2), Consumer Defensive (2), Financial (1)
| Ticker | Company | Sector | Price Last | % Realized | 52-Week Low Date | RSI | % above MA200 | Trend |
|---|---|---|---|---|---|---|---|---|
| INTU | Intuit Inc | Technology | $306.64 | -53.54% | 2026-05-21 | 28.5 | -45.4% | Below MA20, MA50, MA200 |
| LDOS | Leidos Holdings Inc | Technology | $123.11 | -22.54% | 2026-05-21 | 24.1 | -30.3% | Below MA20, MA50, MA200 |
| CPB | Campbells Co | Consumer Defensive | $19.78 | -42.20% | 2026-05-21 | 34.9 | -28.2% | Below MA20, MA50, MA200 |
| CAG | Conagra Brands Inc | Consumer Defensive | $13.22 | -41.21% | 2026-05-21 | 33.2 | -23.9% | Below MA20, MA50, MA200 |
| MKTX | MarketAxess Holdings Inc | Financial | $135.91 | -38.12% | 2026-05-21 | 26.9 | -21.2% | Below MA20, MA50, MA200 |
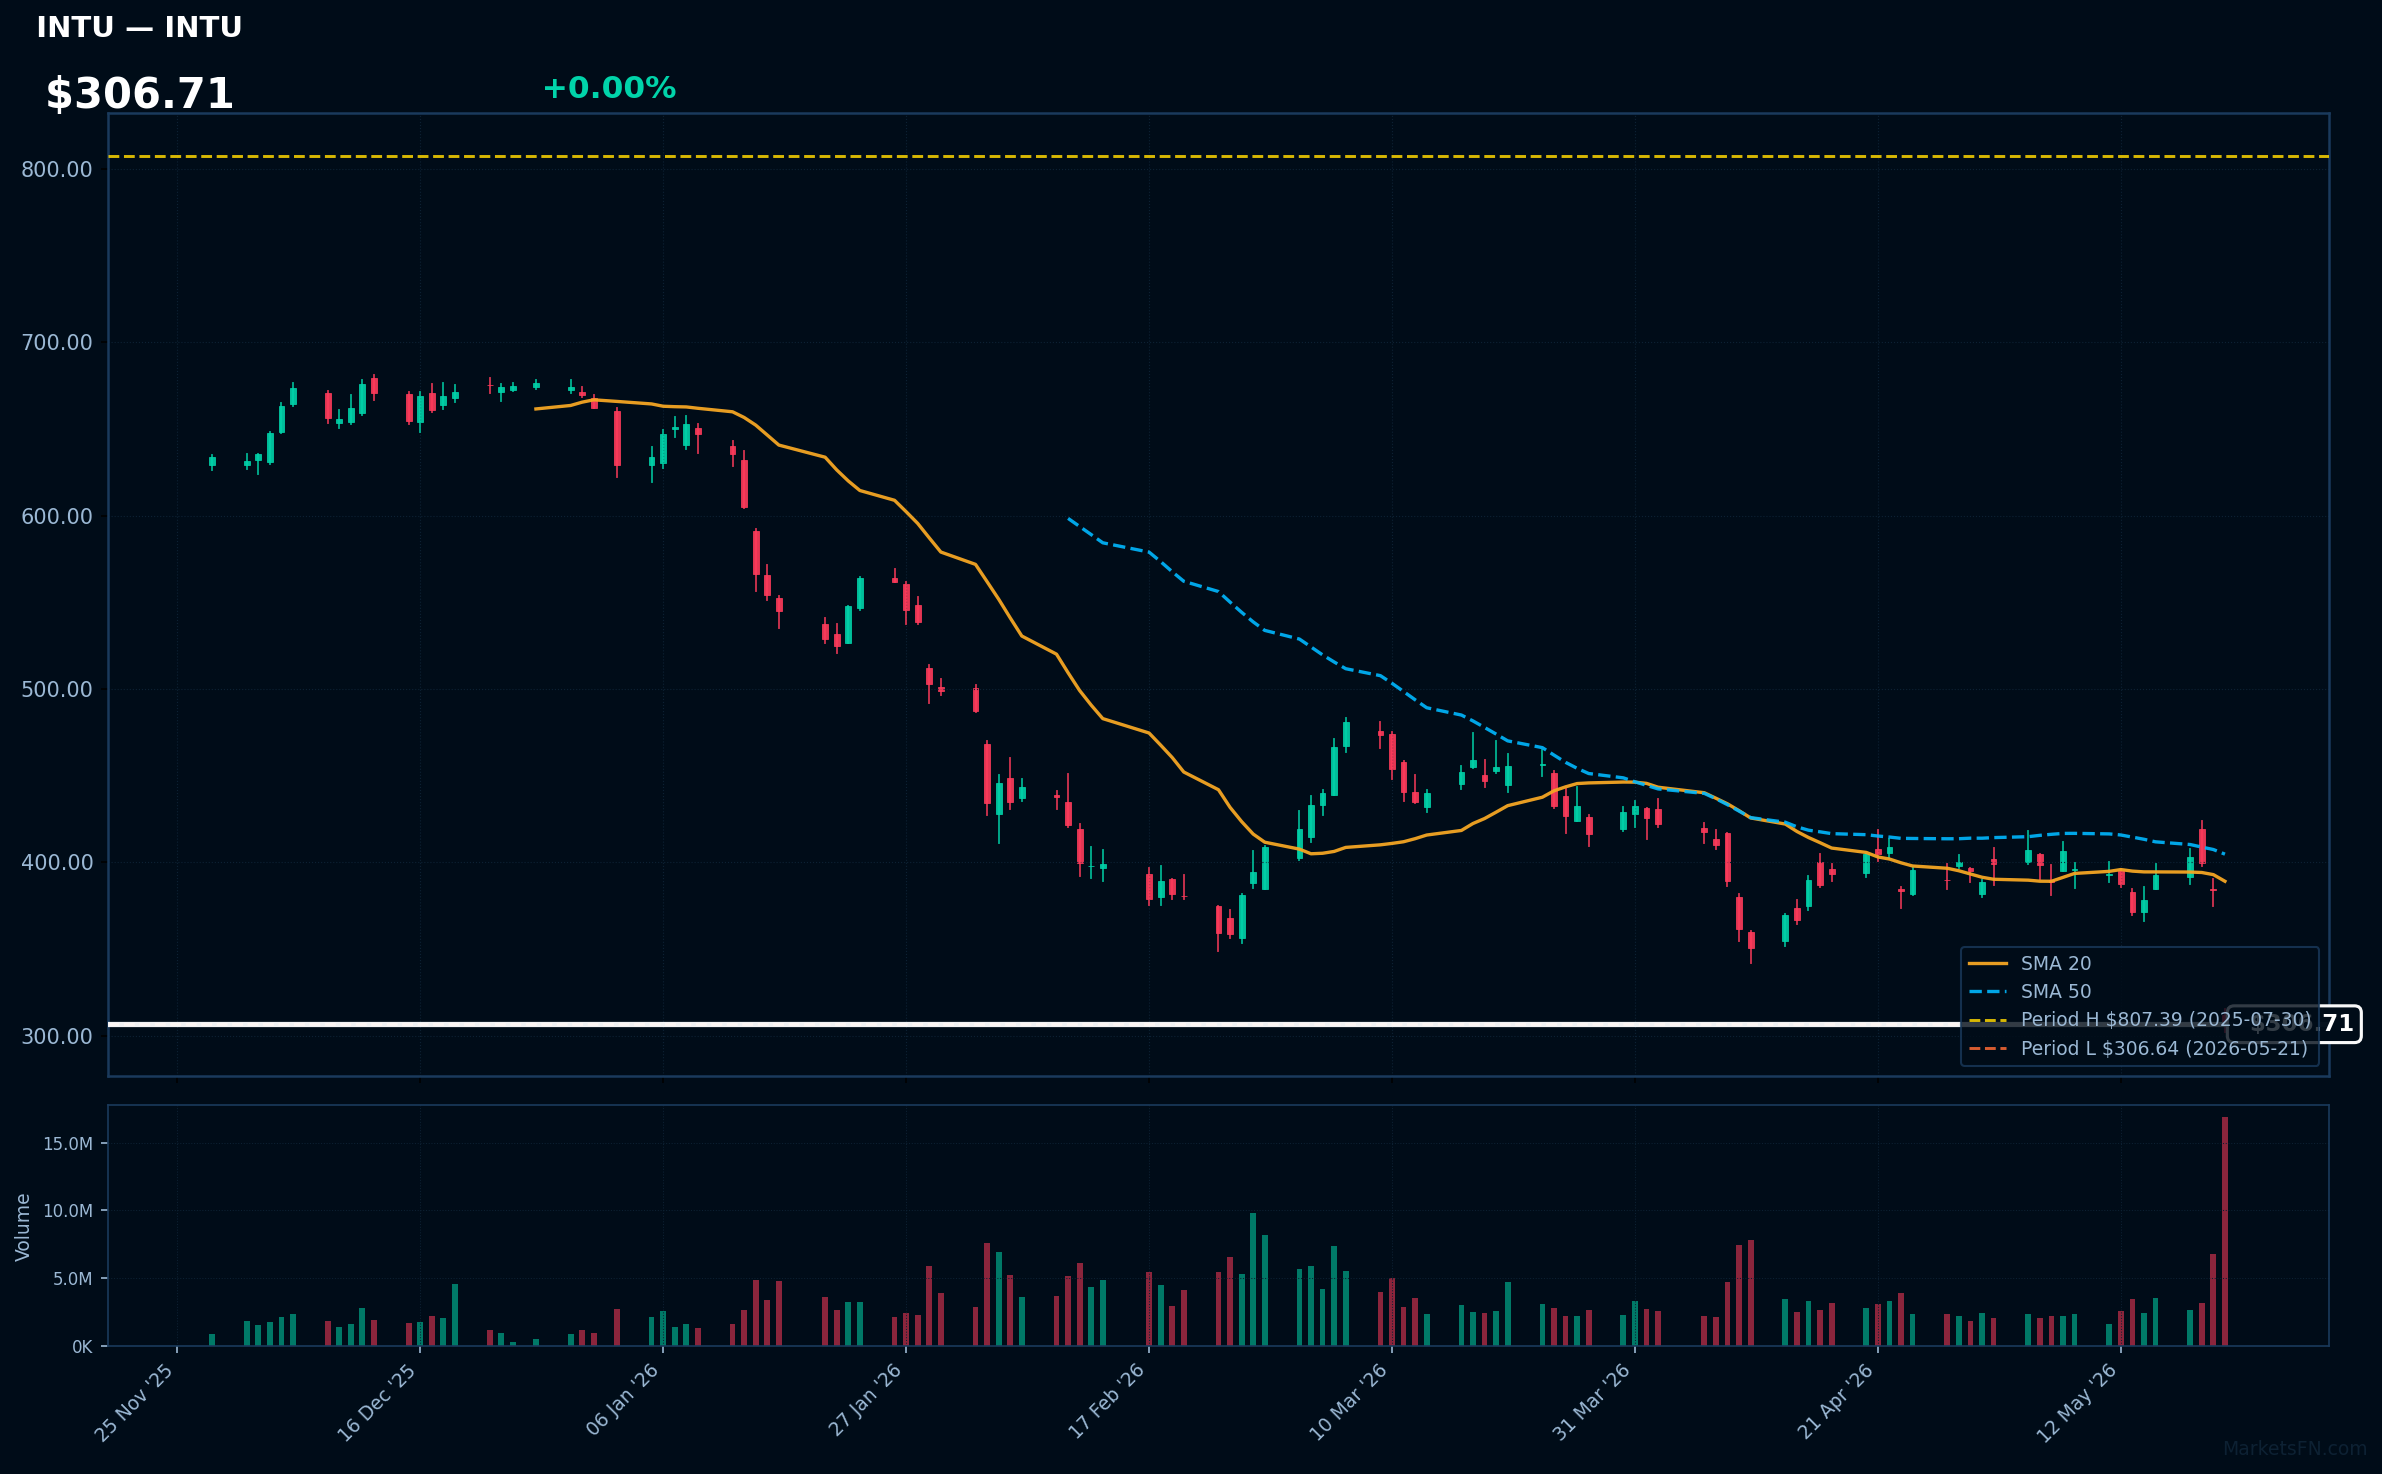
INTU | Intuit Inc | Technology | Price Last: $306.64 | % Realized: -53.54% | RSI: 28.5 | % above MA200: -45.4% | Trend: Below MA20, MA50, MA200
Commentary unavailable.
Related headlines
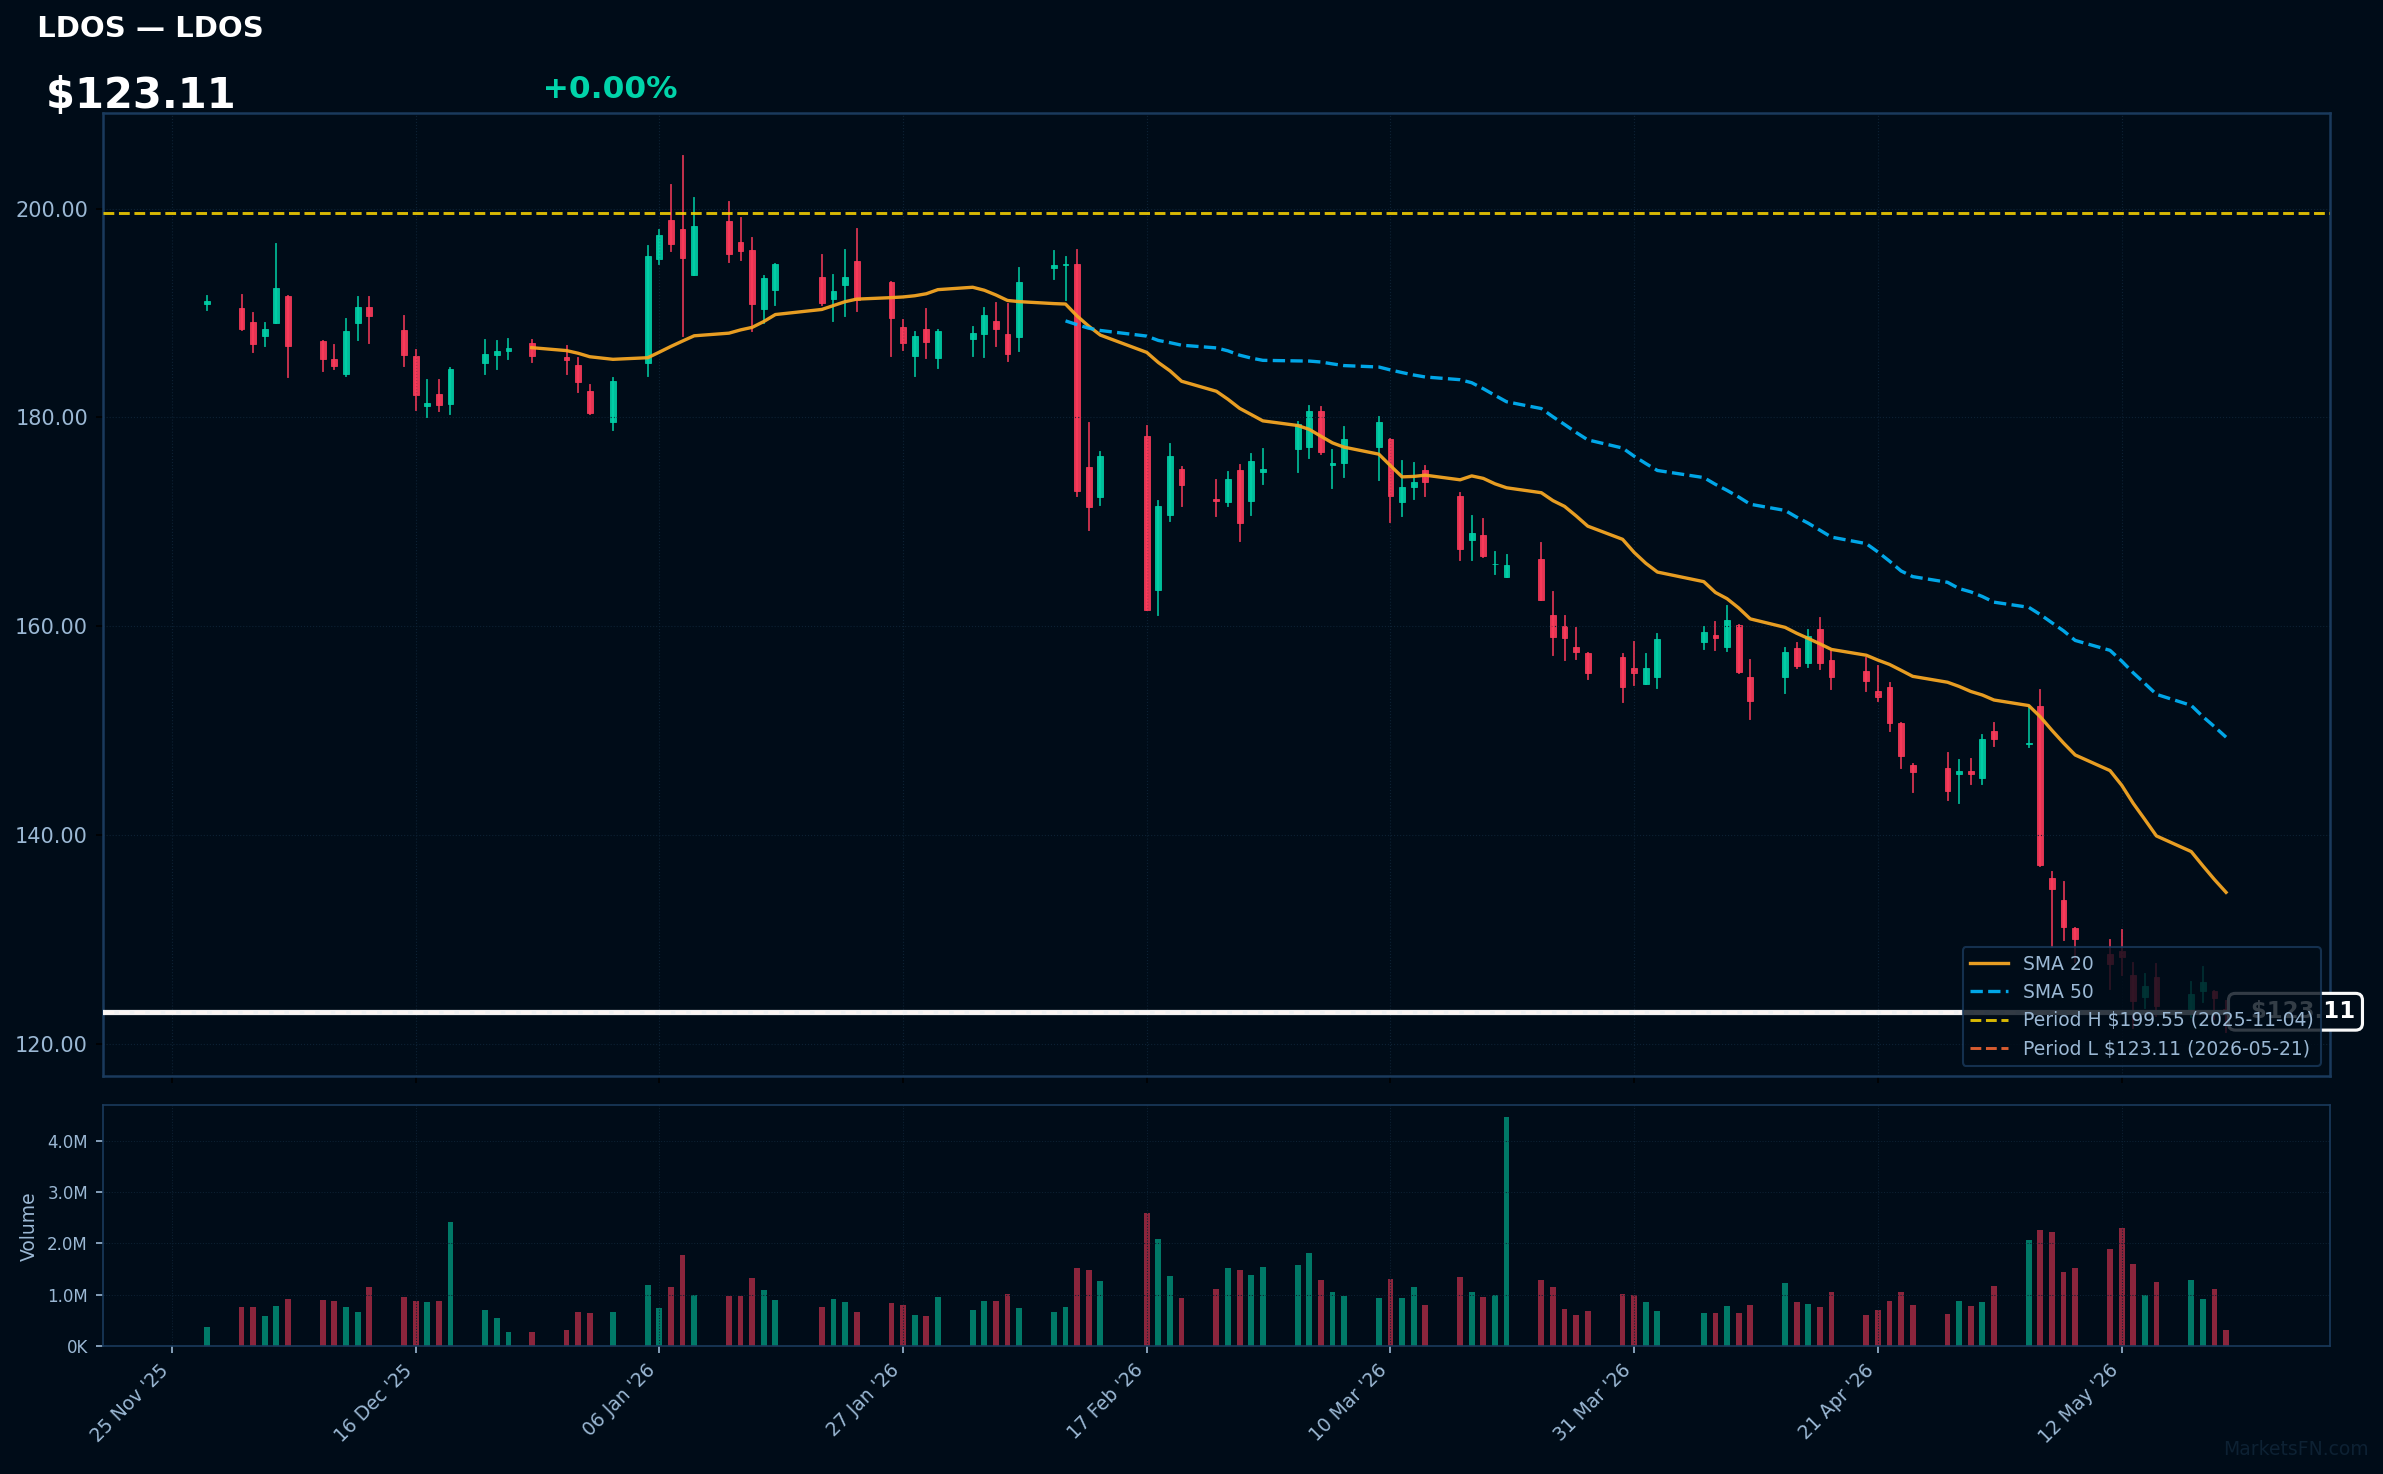
LDOS | Leidos Holdings Inc | Technology | Price Last: $123.11 | % Realized: -22.54% | RSI: 24.1 | % above MA200: -30.3% | Trend: Below MA20, MA50, MA200
Commentary unavailable.
Related headlines
- Leidos to help strengthen global IT operations for the U.S. Department of State under Evolve contract
- Leidos to build initial 3,000 low-cost containerized munitions through Department of War framework agreement
- Leidos receives $2.7 billion hypersonic weapons contract
- Leidos to Accelerate Hypersonic Weapons Production for U.S. Army and Navy
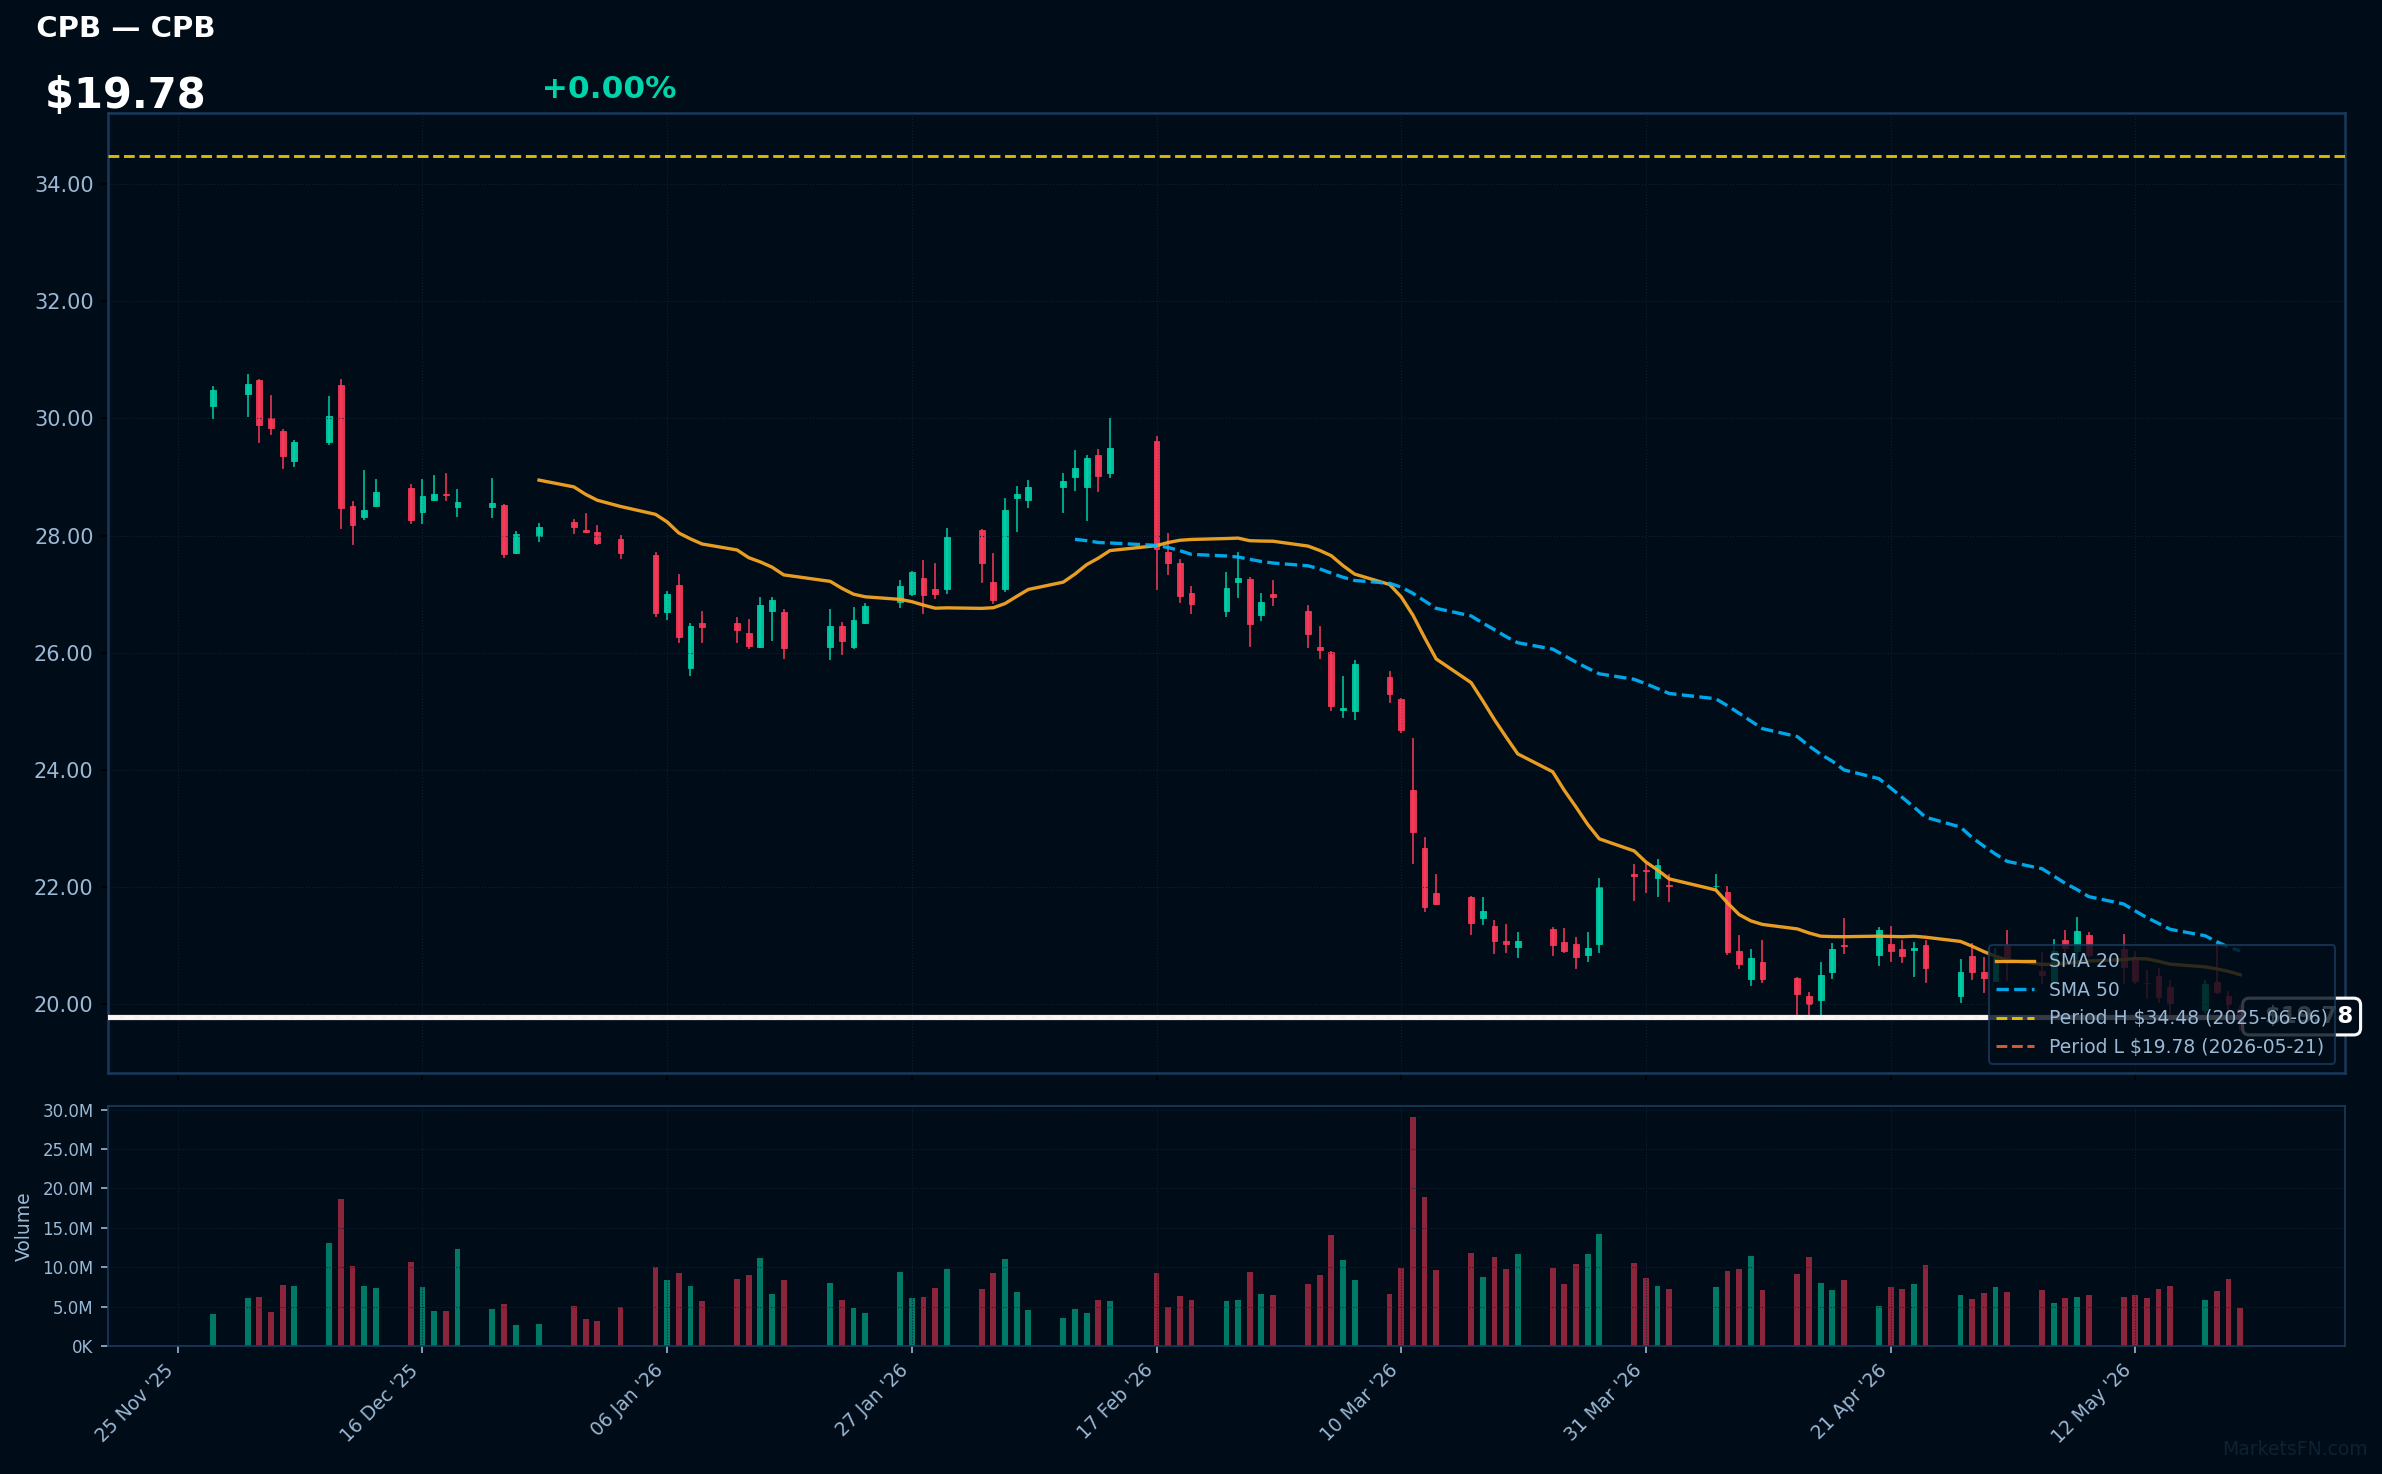
CPB | Campbells Co | Consumer Defensive | Price Last: $19.78 | % Realized: -42.20% | RSI: 34.9 | % above MA200: -28.2% | Trend: Below MA20, MA50, MA200
Commentary unavailable.
Related headlines
- Healthier Generation and The Campbells Company Receive Halo Award for Full Futures: A School Nutrition Partnership
- Campbells brings iconic soup name to sauces
- Wells Fargo downgrades Conagra, Campbells and General Mills on profit risks
- Campbells on quest to rebuild snacks margin after second-quarter slide
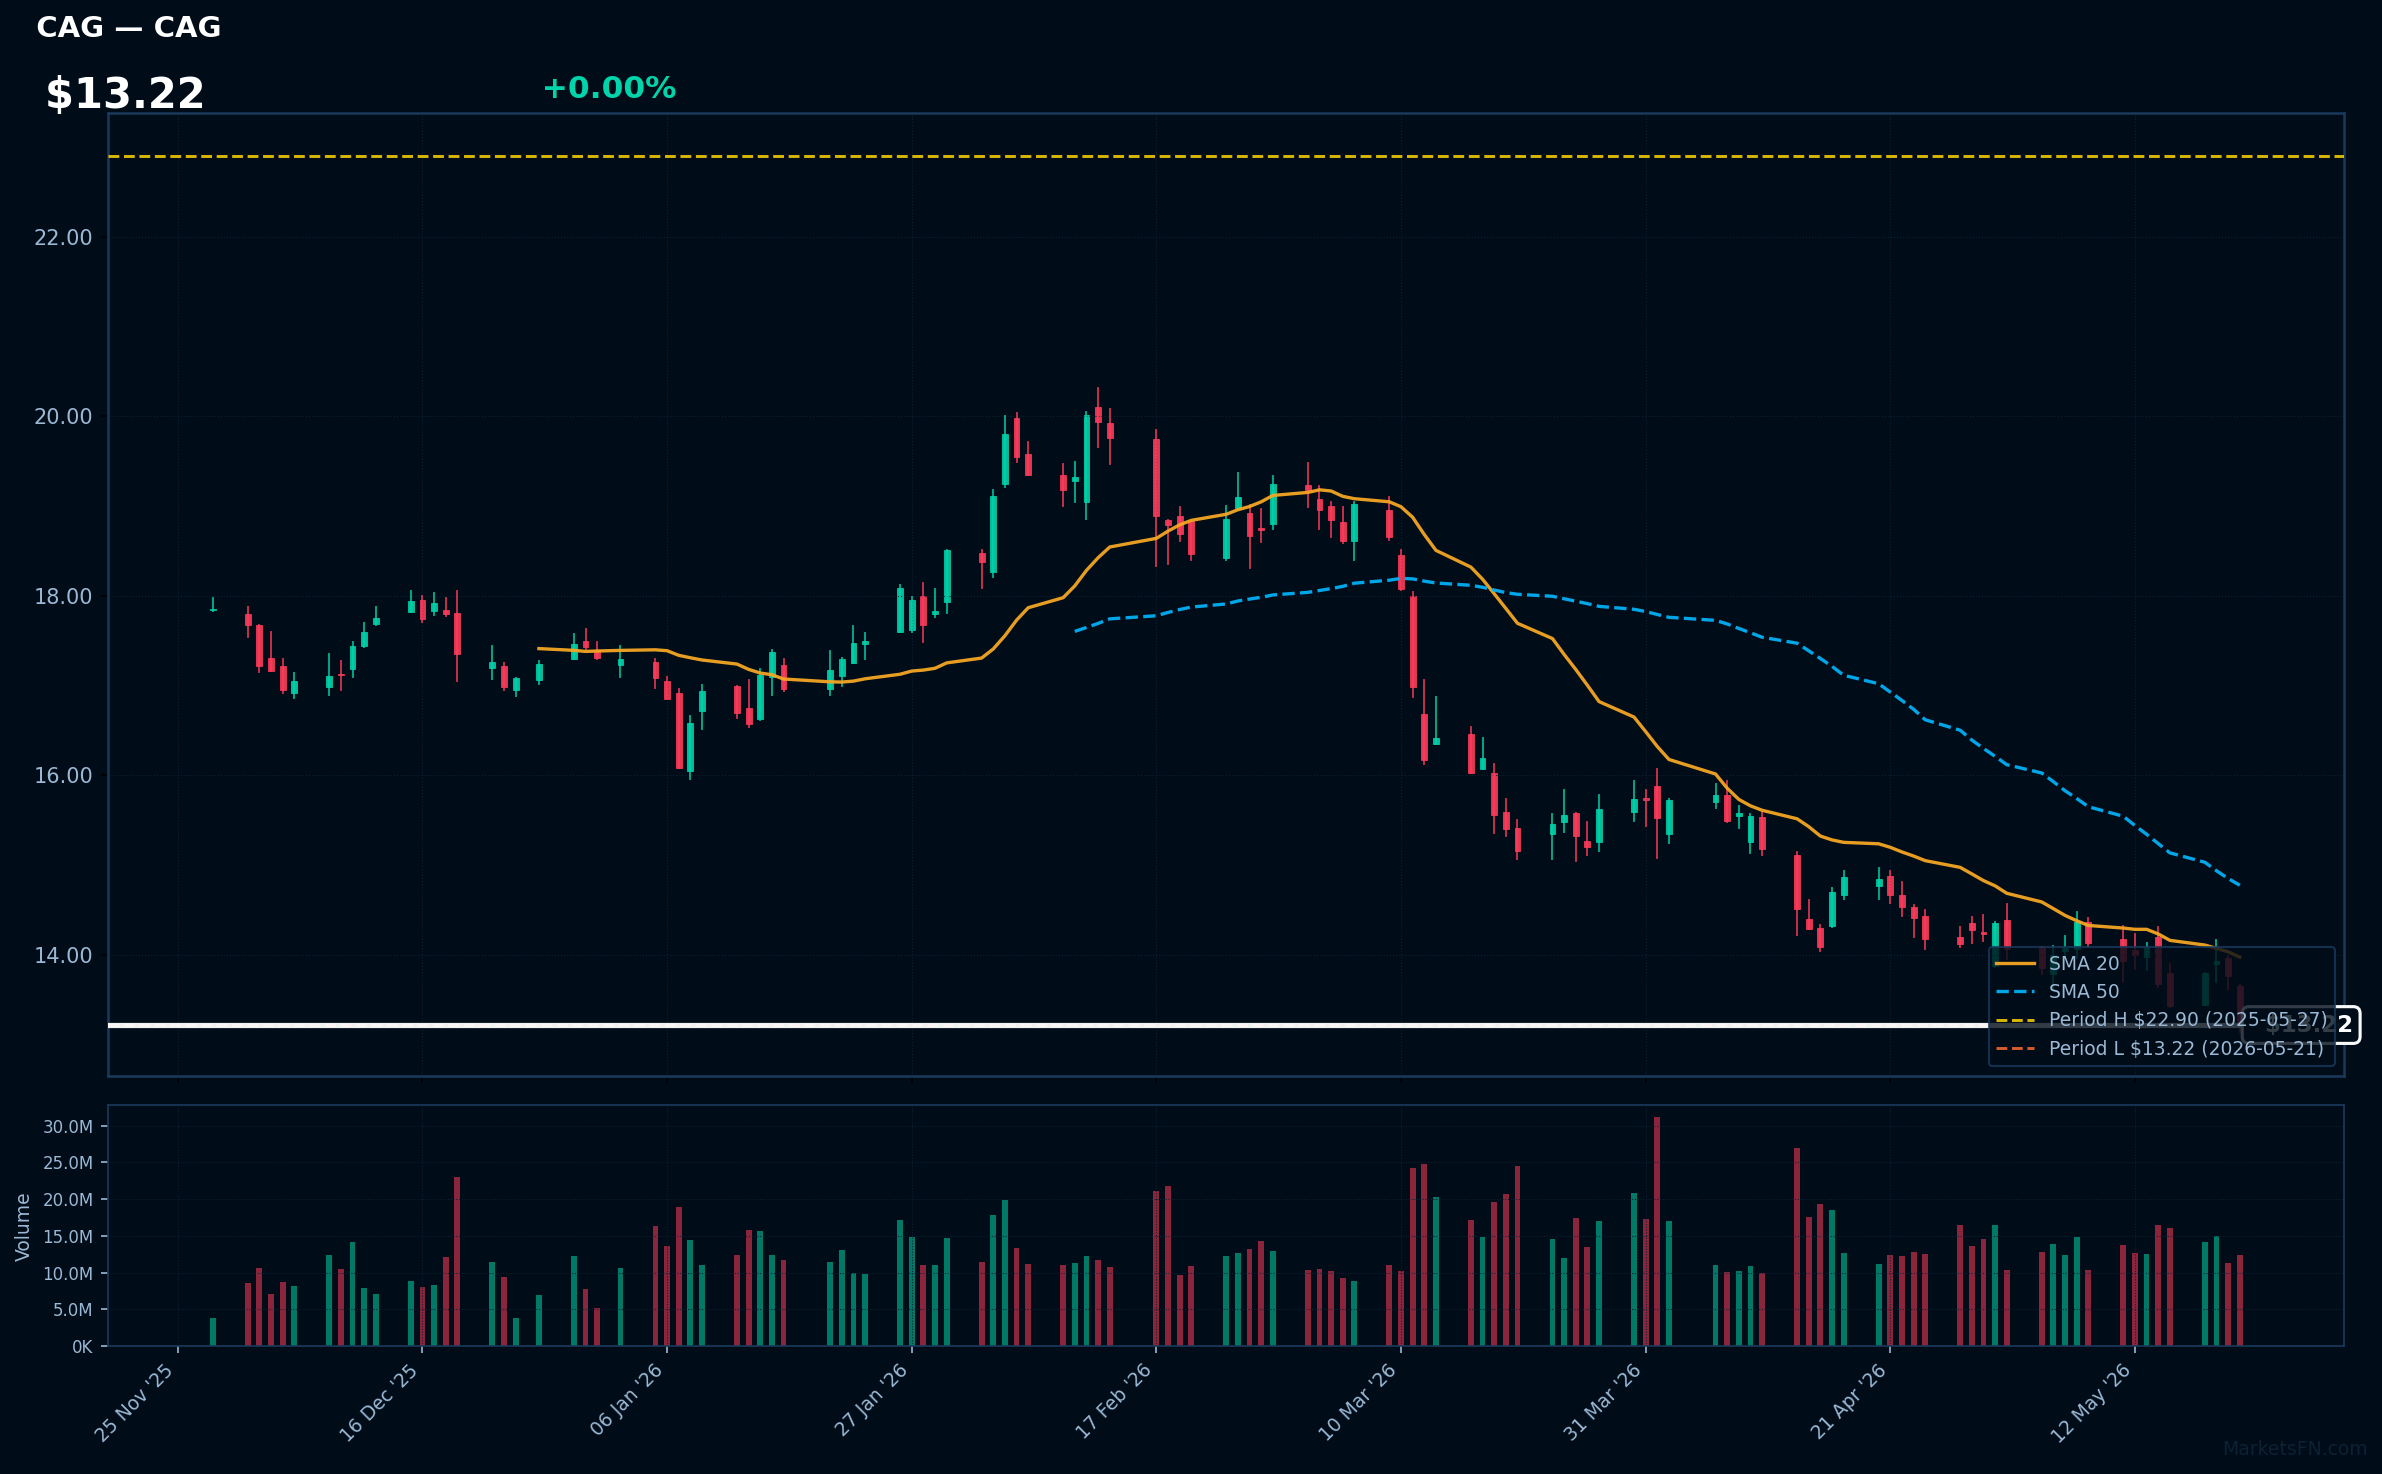
CAG | Conagra Brands Inc | Consumer Defensive | Price Last: $13.22 | % Realized: -41.21% | RSI: 33.2 | % above MA200: -23.9% | Trend: Below MA20, MA50, MA200
Commentary unavailable.
Related headlines
- Conagra Brands Brings Exciting Array of Snacks, Sweet Treats to 2026 Sweets & Snacks Expo
- Conagra Brands Celebrates America's 250th Birthday with Folds of Honor Partnership
- Conagra Brands Releases Fiscal 2025 Citizenship Report, Detailing Progress Across Key Sustainability Priorities
- Conagra Stock Is Down 17% This Year. Two Insiders Snapped Up Shares Anyway.
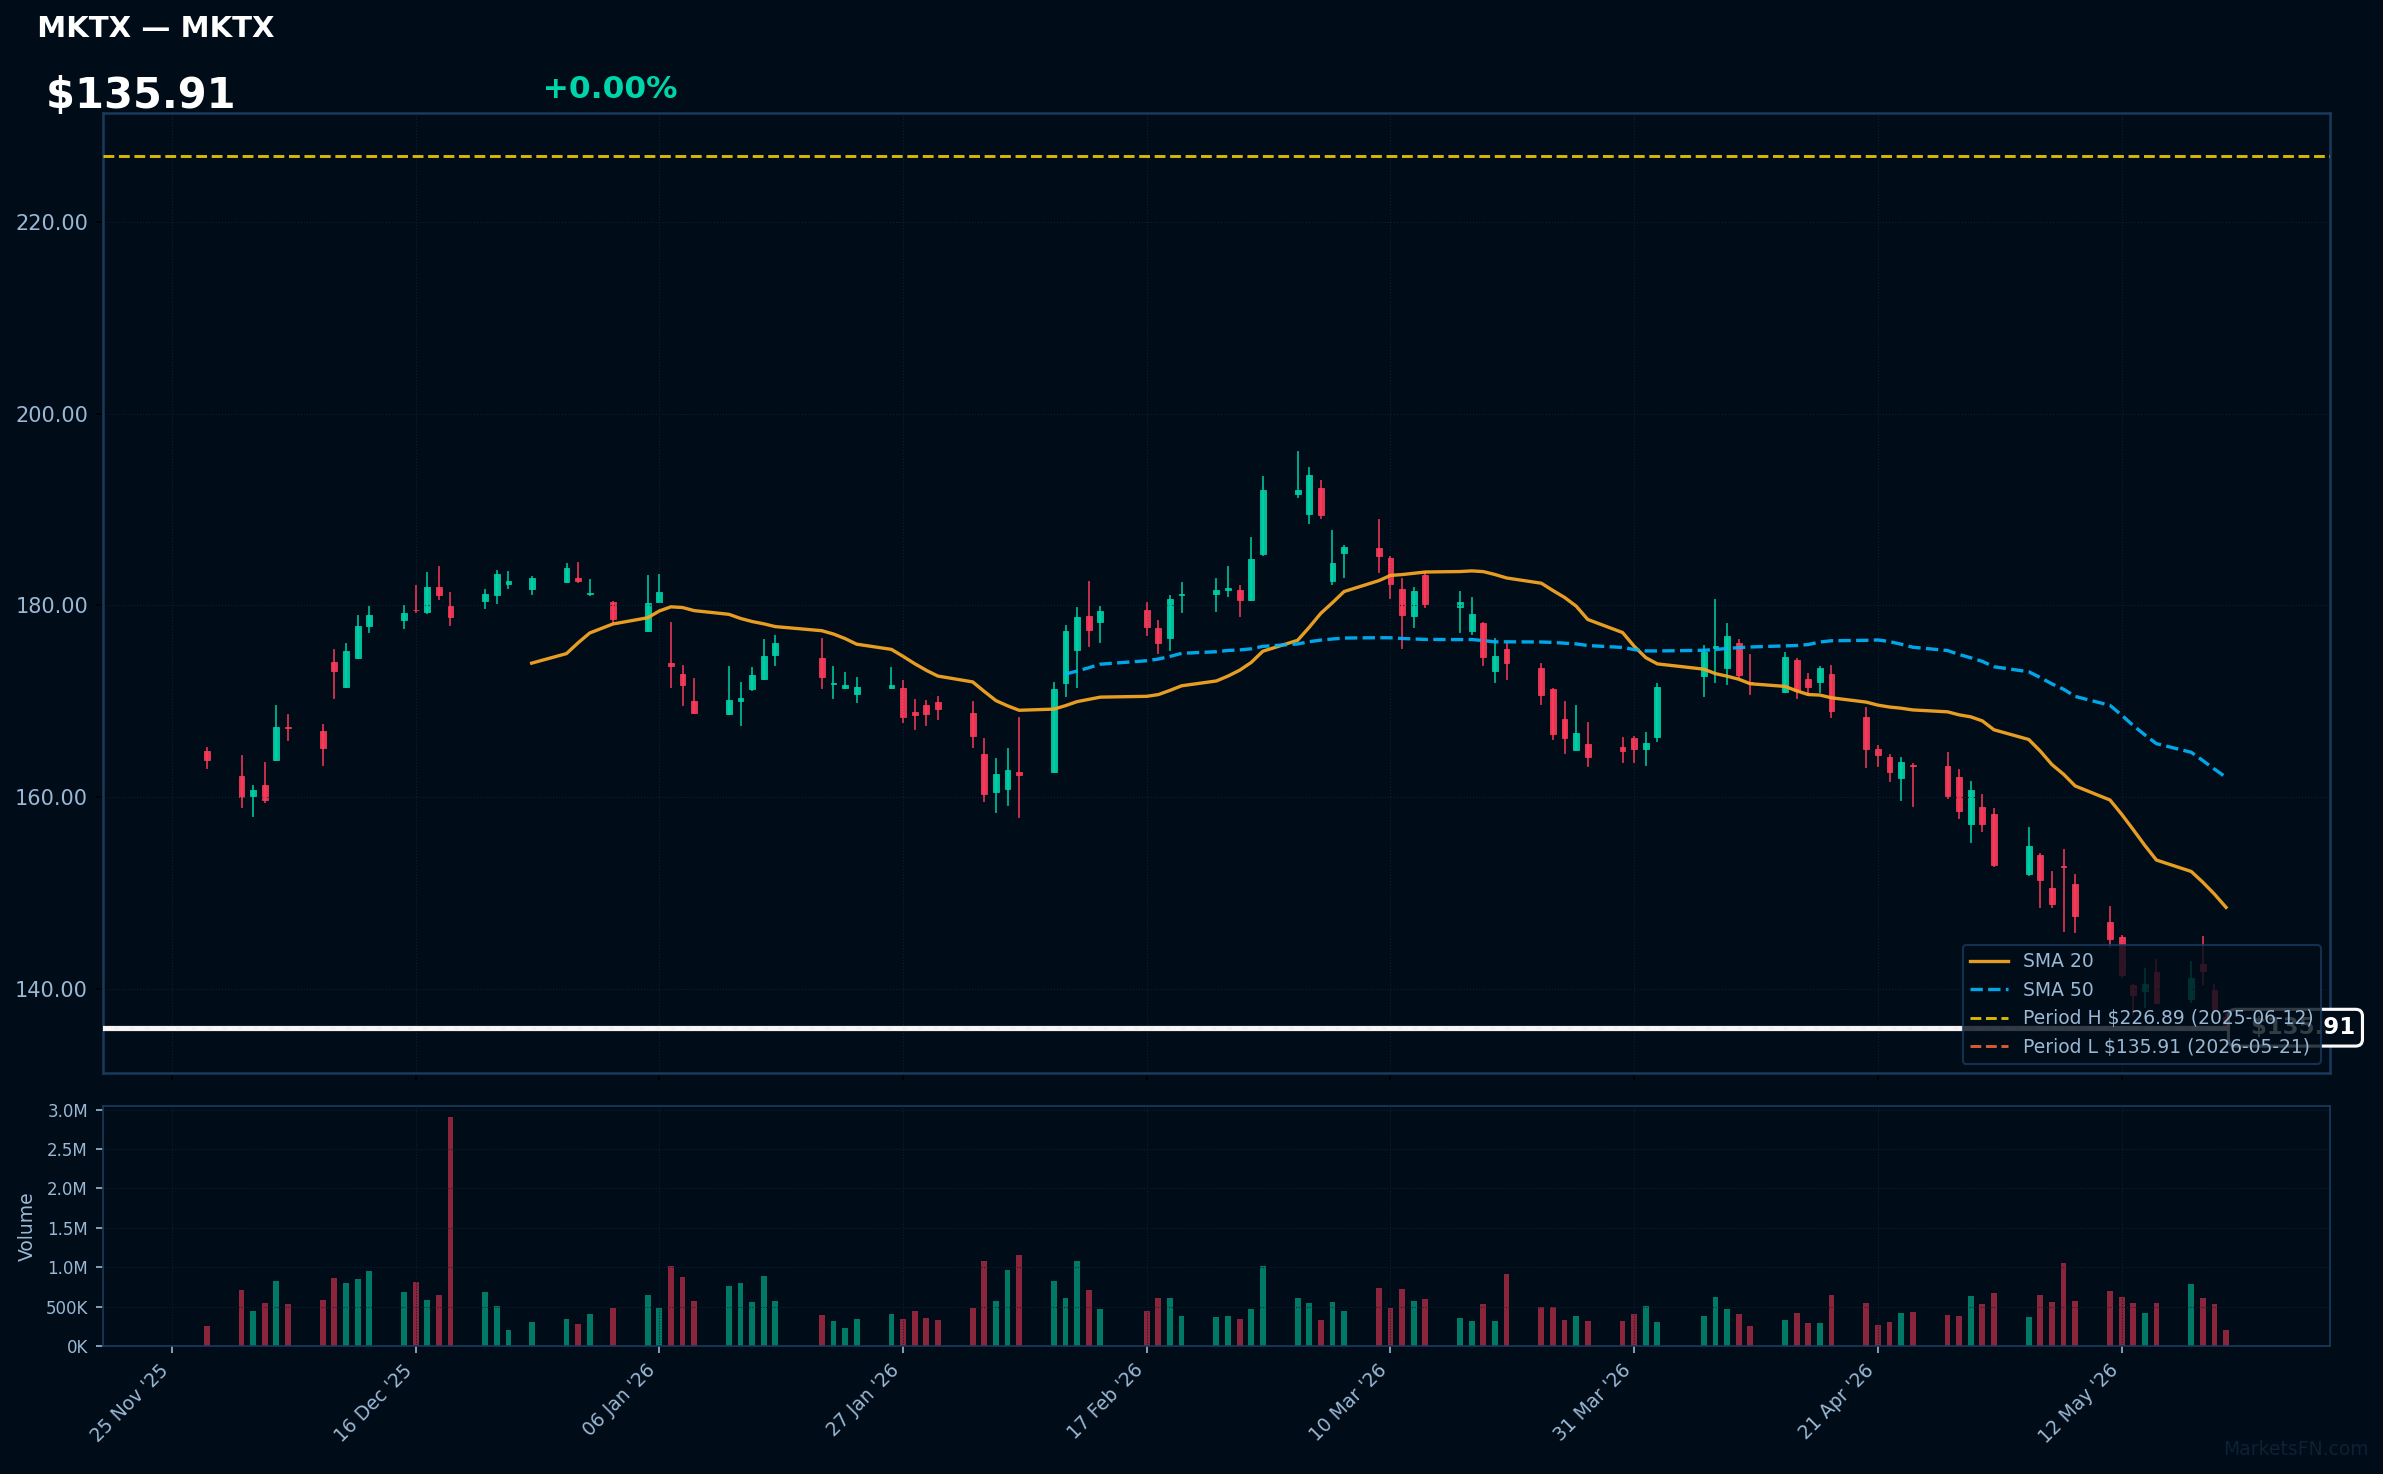
MKTX | MarketAxess Holdings Inc | Financial | Price Last: $135.91 | % Realized: -38.12% | RSI: 26.9 | % above MA200: -21.2% | Trend: Below MA20, MA50, MA200
Commentary unavailable.
Related headlines
Market Commentary
Commentary unavailable.
Methodology: All 503 S&P 500 constituents screened. 52-week high = highest daily close over the past 252 trading days (approx. 1 year). 52-week low = lowest daily close over the same period. Distance = (current price / extreme − 1) × 100. Technical indicators computed on up to 1 year of daily OHLCV data.
Disclaimer: For informational purposes only. Not investment advice. Past performance is not indicative of future results.