S&P 500: Massimi e Minimi a 52 Settimane
· market-analysis · MarketsFN Team
S&P 500 Radar dei massimi e minimi a 52 settimane — May 07, 2026
Analisi di tutti i 503 S&P 500 componenti per le azioni più vicine al loro 52-week high e al loro 52-week low. Dati al May 07, 2026.
Legenda: Distanza verde = azione vicina al suo massimo annuale. Distanza arancione = azione che sta sondando i minimi annuali. RSI > 70 = overbought, RSI < 30 = oversold.
📈 Più vicino al massimo a 52 settimane
Settori rappresentati: Technology (2), Communication Services (2), Consumer Cyclical (1)
| Simbolo | Azienda | Settore | Prezzo | % dal massimo | Massimo periodo | Data massimo | RSI | vs MA200 | Tendenza |
|---|---|---|---|---|---|---|---|---|---|
| AAPL | Apple Inc | Technology | $287.51 | +0.00% | $287.51 | 2026-05-06 | 69.4 | +12.2% | Above MA20, MA50, MA200 |
| GOOGL | Alphabet Inc | Communication Services | $398.04 | +0.00% | $398.04 | 2026-05-06 | 83.5 | +40.1% | Above MA20, MA50, MA200 |
| GOOG | Alphabet Inc | Communication Services | $395.14 | +0.00% | $395.14 | 2026-05-06 | 82.8 | +39.0% | Above MA20, MA50, MA200 |
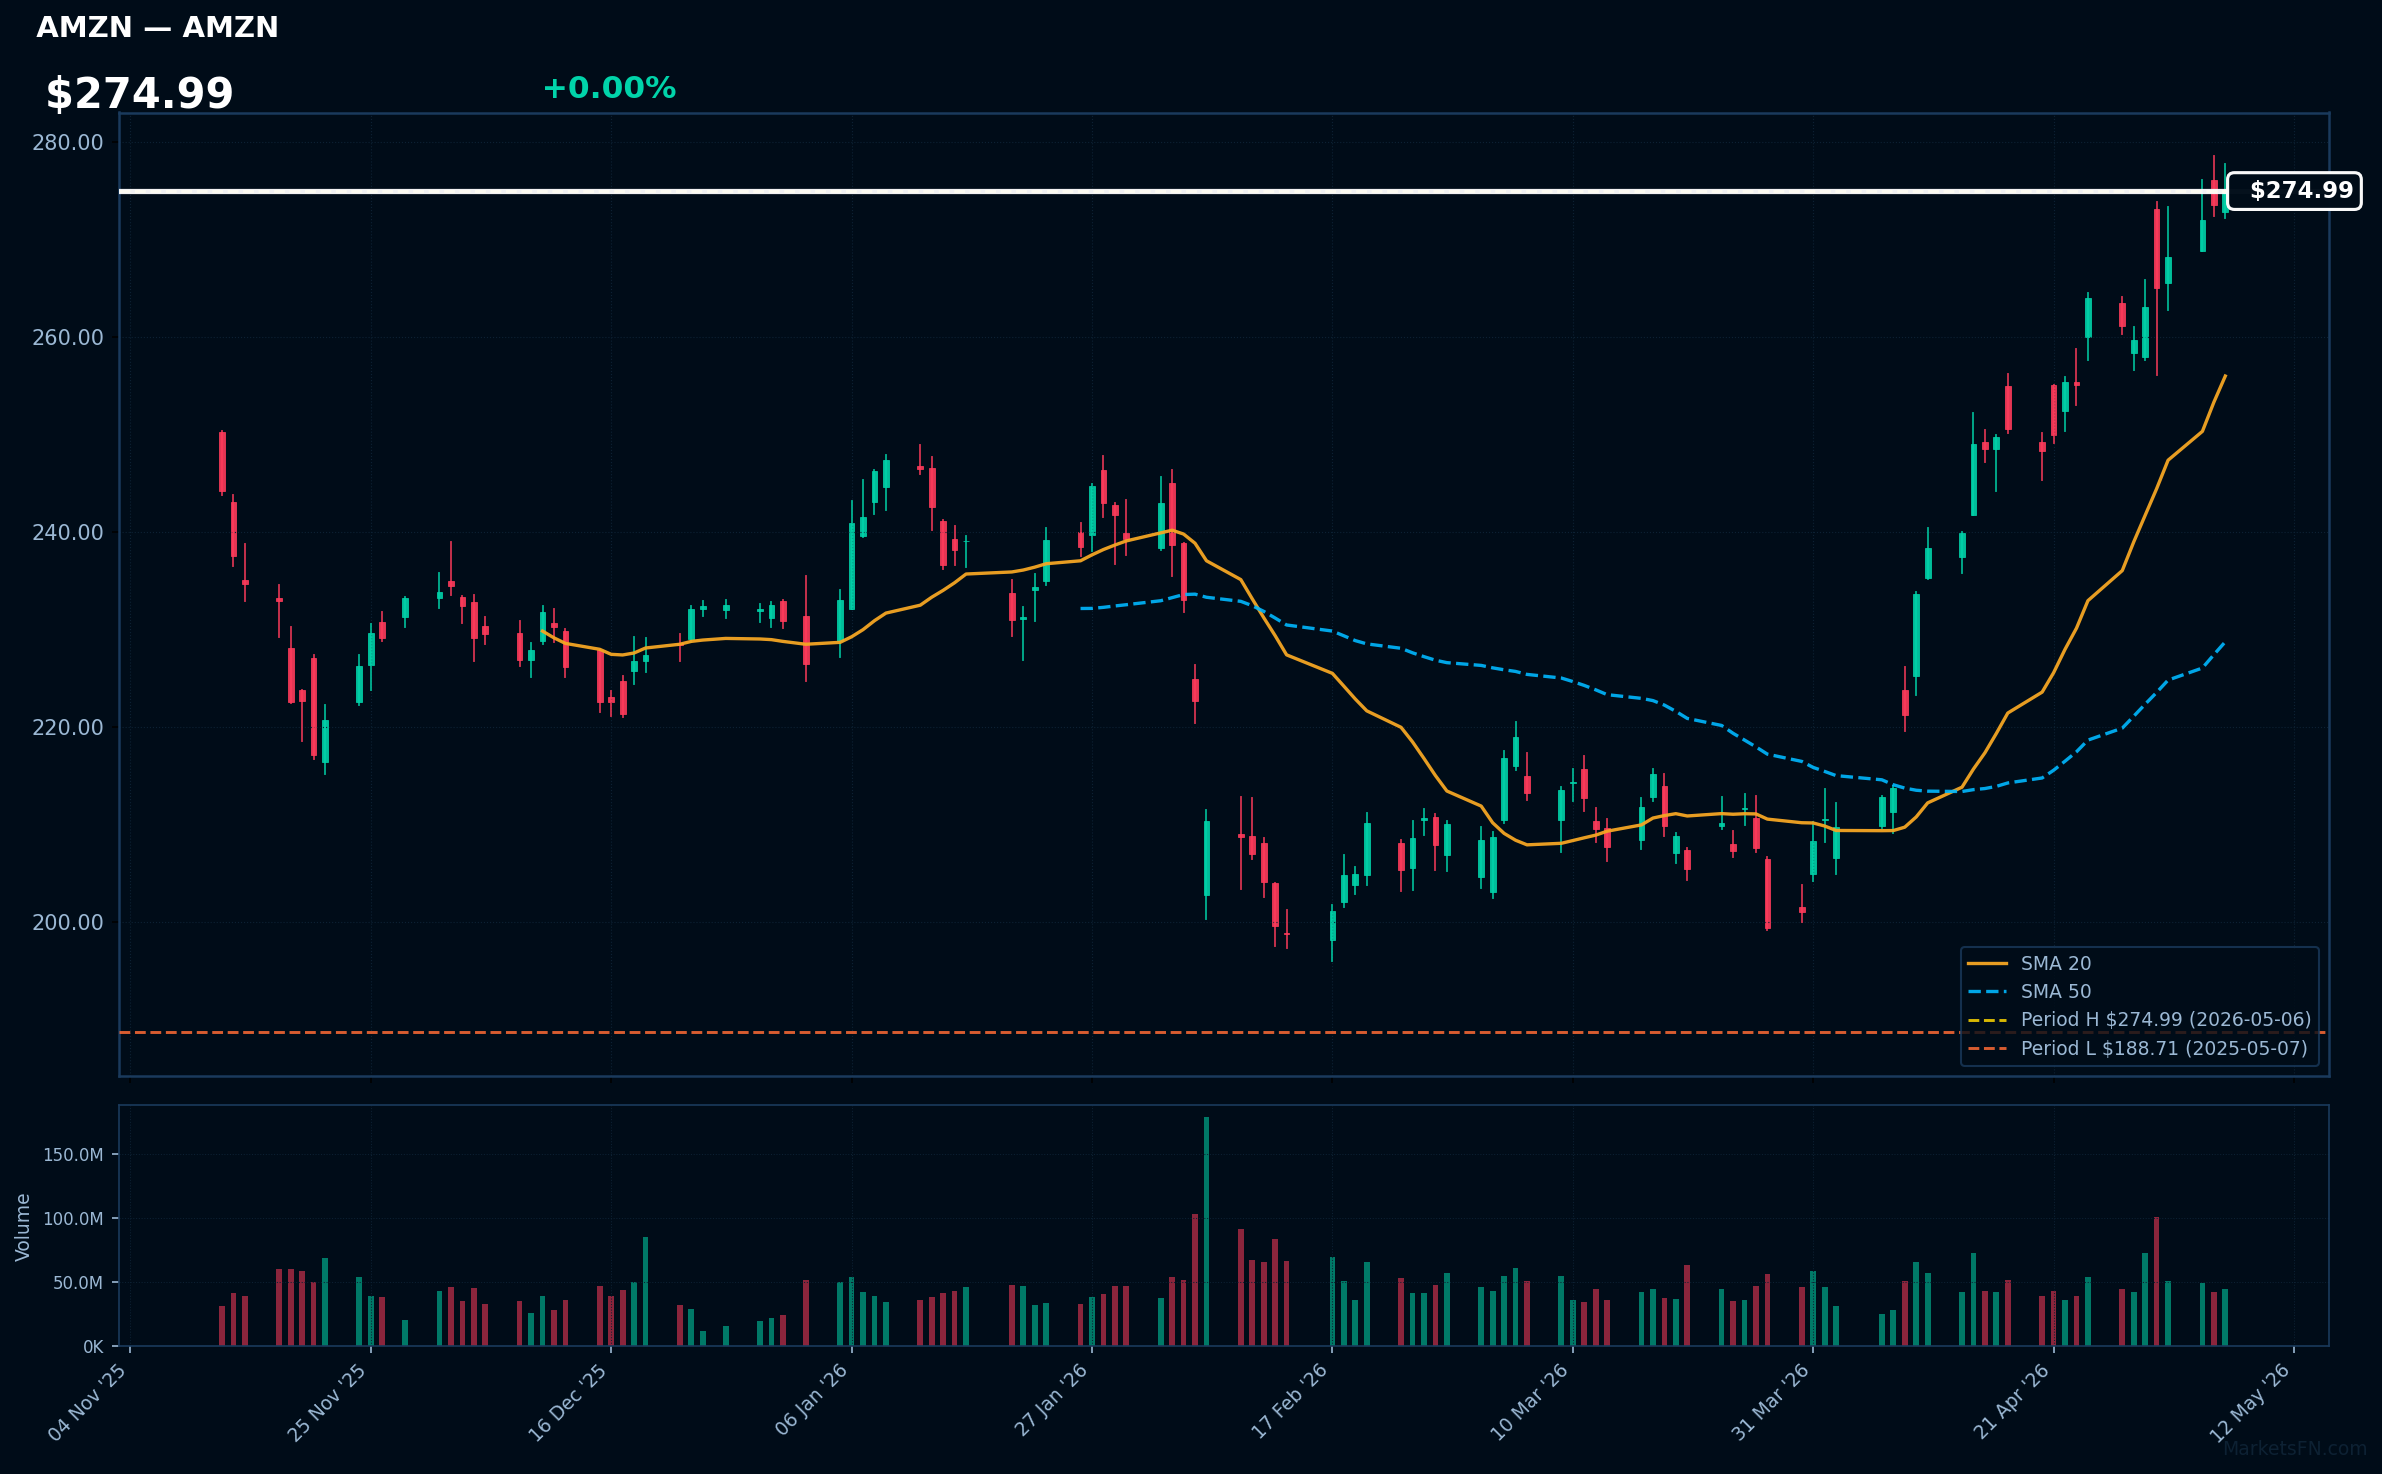
| AMZN | Amazon.com Inc | Consumer Cyclical | $274.99 | +0.00% | $274.99 | 2026-05-06 | 81.1 | +20.6% | Above MA20, MA50, MA200 |
| AMD | Advanced Micro Devices Inc | Technology | $421.39 | +0.00% | $421.39 | 2026-05-06 | 81.2 | +96.4% | Above MA20, MA50, MA200 |
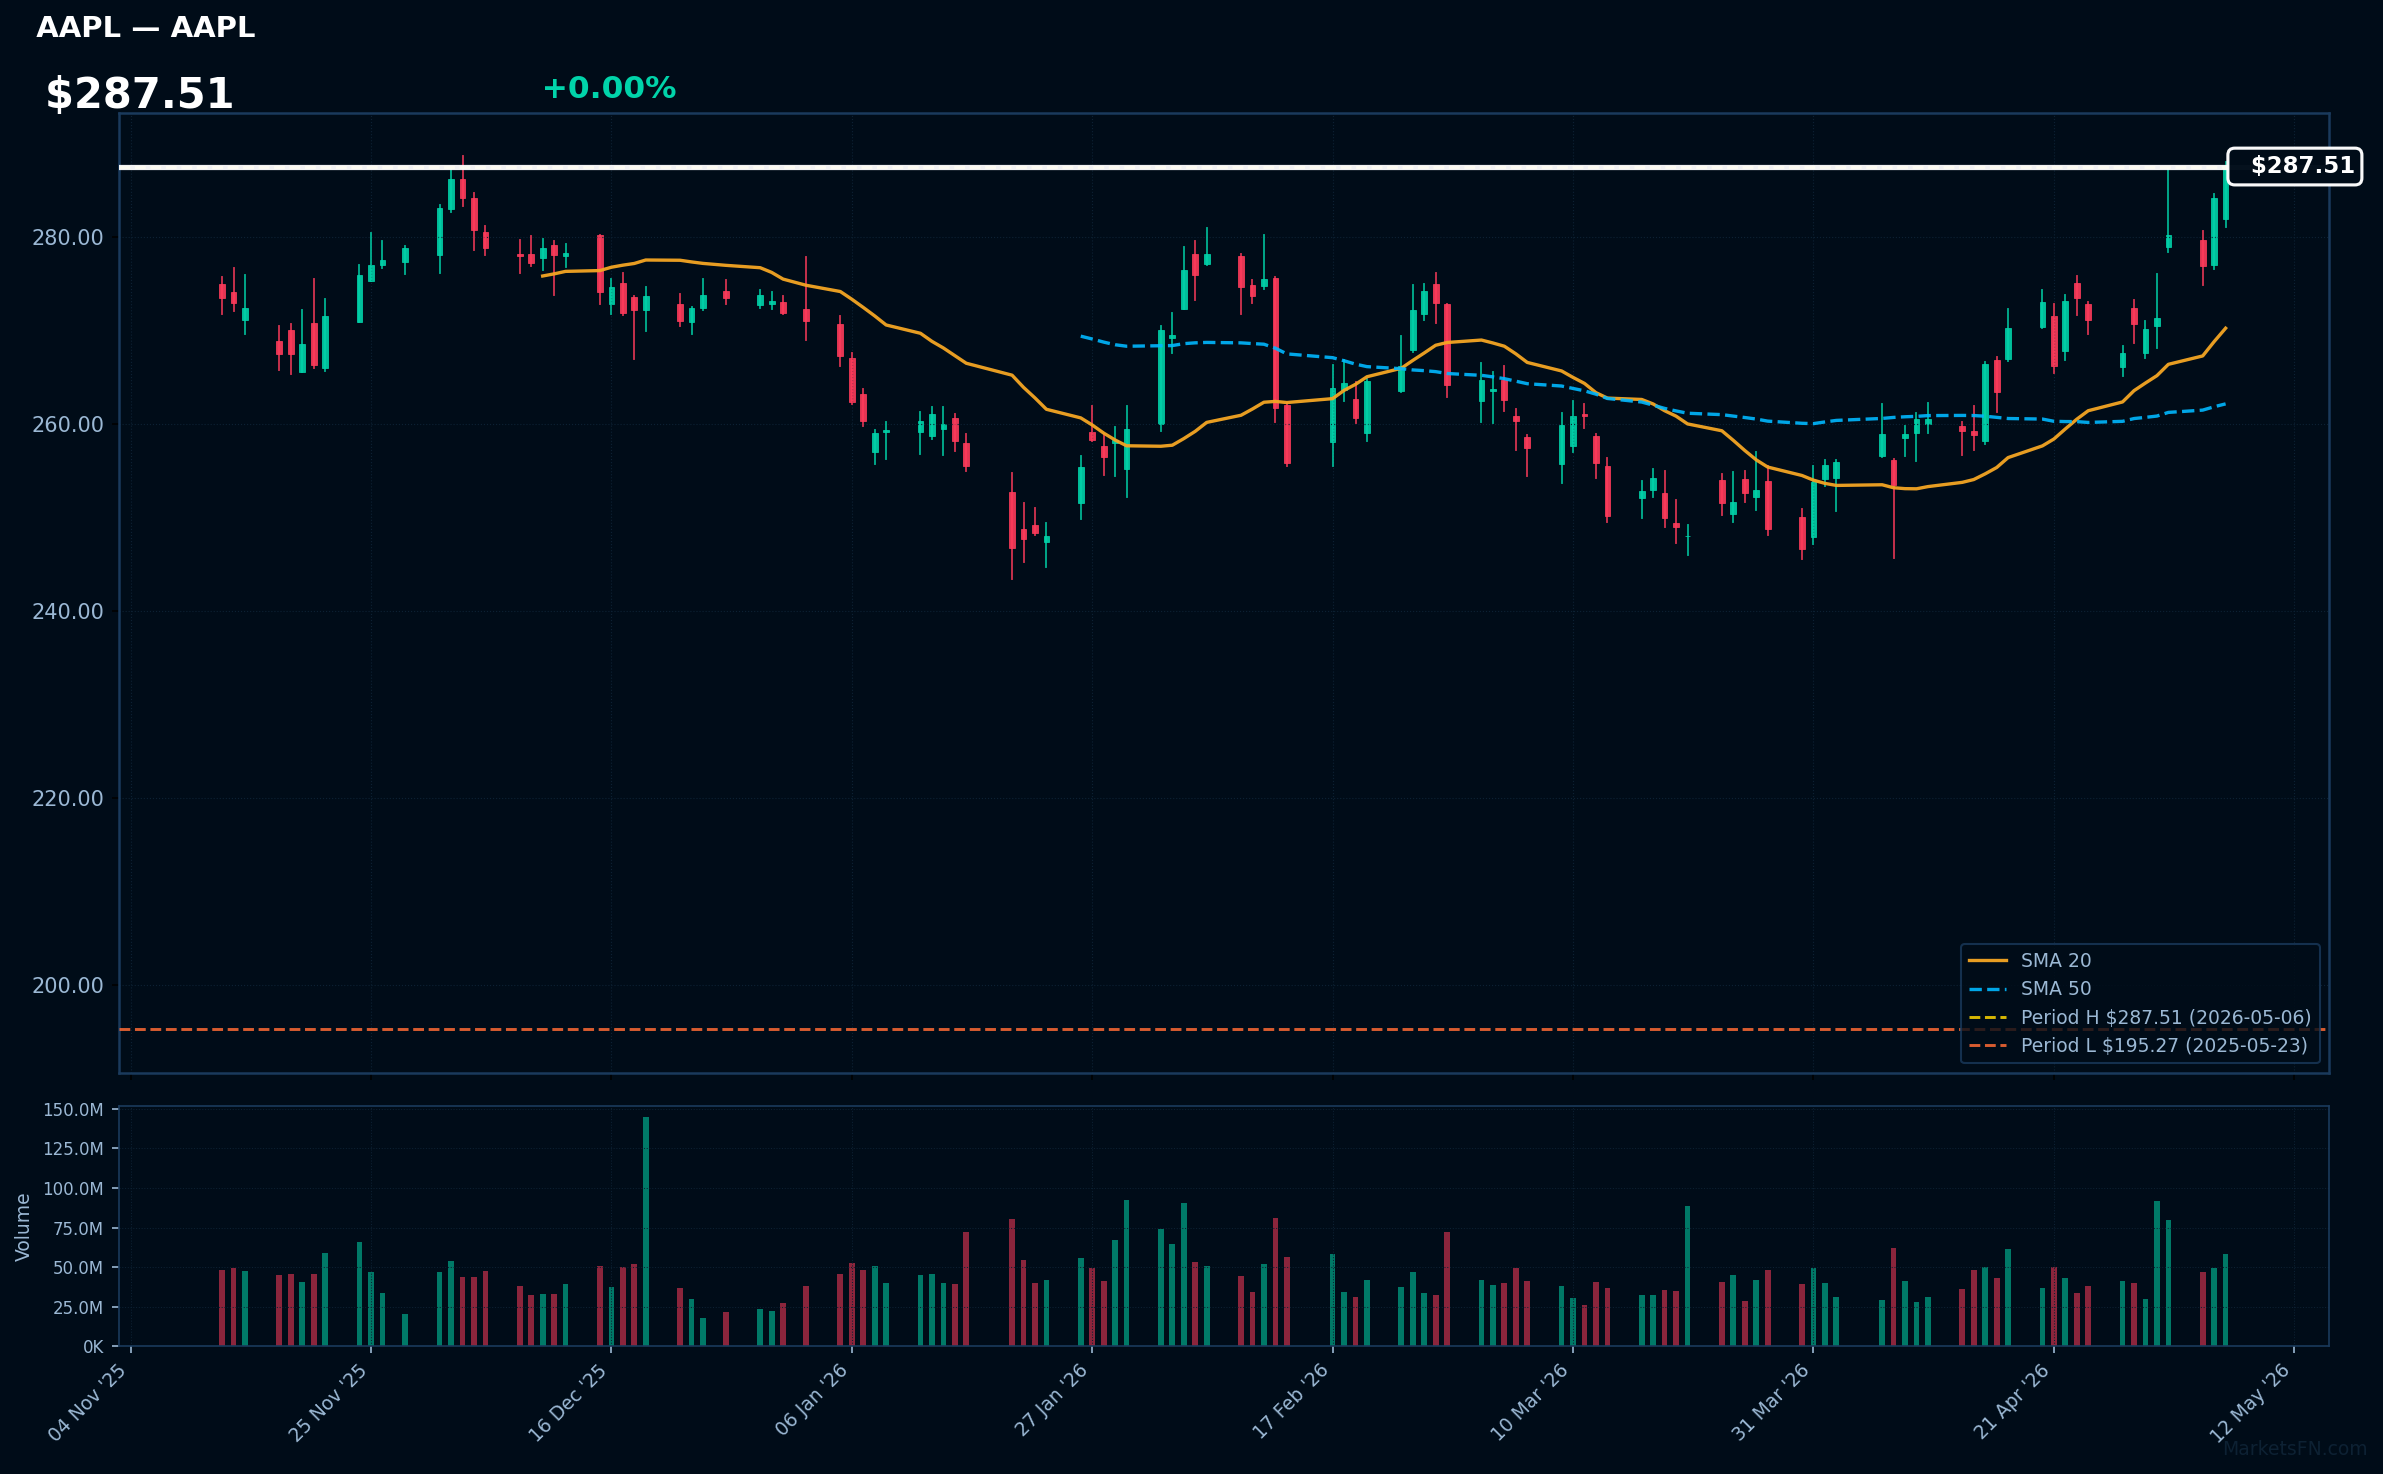
AAPL | Apple Inc | Technology | Prezzo: $287.51 | Massimo a 52 settimane: $287.51 (2026-05-06) | Distanza: +0.00% | RSI: 69.4 | vs MA200: +12.2% | Tendenza: Above MA20, MA50, MA200
Apple Inc. designs, manufactures, and markets smartphones, personal computers, tablets, wearables, and accessories worldwide. The company offers iPhone, a line of smartphones; Mac, a line of personal computers; iPad, a line of multi-purpose tablets; and wearables, home, and accessories comprising AirPods, Apple Vision Pro, Apple TV, Apple Watch, Beats products, and HomePod, as well as Apple branded and third-party accessories. It also provides AppleCare support and cloud services; and operates various platforms, including the App Store that allow customers to discover and download applications and digital content, such as books, music, video, games, and podcasts, as well as advertising services…
Titoli recenti (ultime 12h)
- Coke Keeps Beating Pepsi. Warren Buffett's Bet Has Paid Off.
- Anthropic Is Making Its Claude Chatbot More Appealing to Consumers
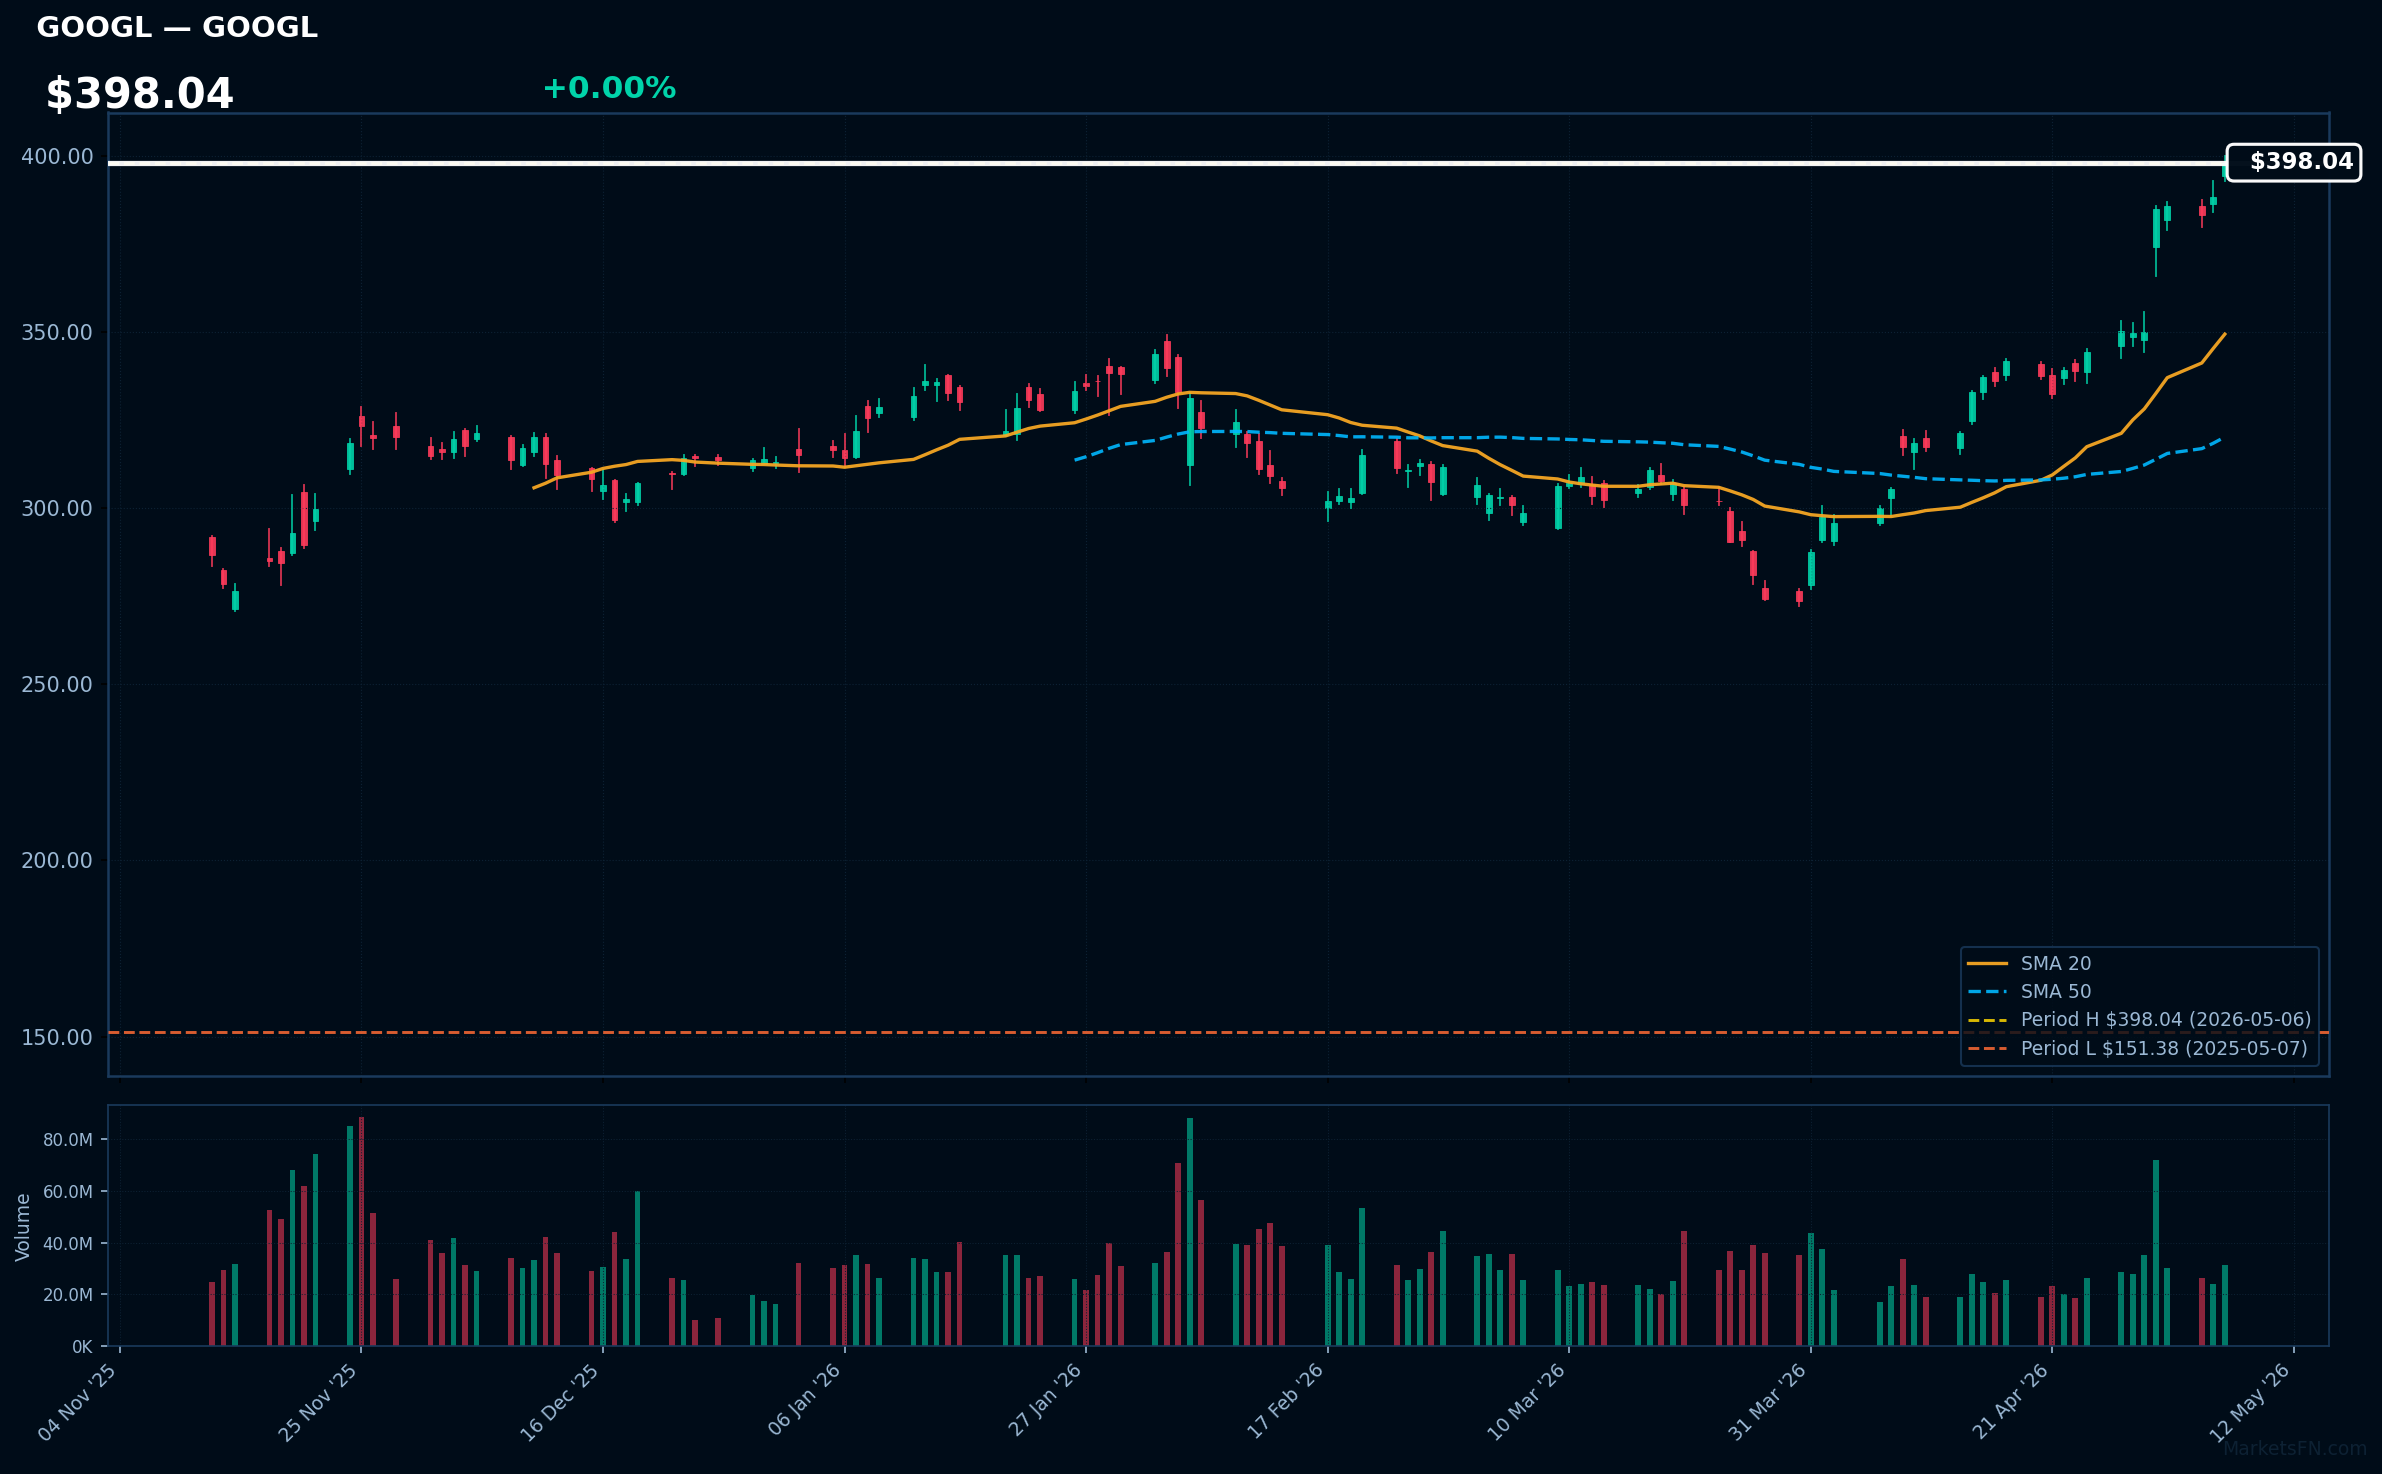
GOOGL | Alphabet Inc | Communication Services | Prezzo: $398.04 | Massimo a 52 settimane: $398.04 (2026-05-06) | Distanza: +0.00% | RSI: 83.5 | vs MA200: +40.1% | Tendenza: Above MA20, MA50, MA200
Alphabet Inc. offers various products and platforms in the United States, Europe, the Middle East, Africa, the Asia-Pacific, Canada, and Latin America. It operates through Google Services, Google Cloud, and Other Bets segments. The Google Services segment provides products and services, including ads, Android, Chrome, devices, Gmail, Google Drive, Google Maps, Google Photos, Google Play, Search, and YouTube. It is also involved in the sale of apps and in-app purchases and digital content in Google Play and YouTube; and devices, as well as the provision of YouTube consumer subscription services, such as YouTube TV, YouTube Music and Premium, NFL Sunday…
Titoli recenti (ultime 12h)
- Quantum Motion raises $160 million to build quantum computers from standard silicon transistors
- Meta seeks to challenge Google, Amazon, and TikTok Shop with consumer AI agents
- Kimi Chatbot Maker Moonshot AI Valued at $20 Billion in Meituan-Led Round
- Top Trump Aide Says Administration Wont Pick Winners in AI Race
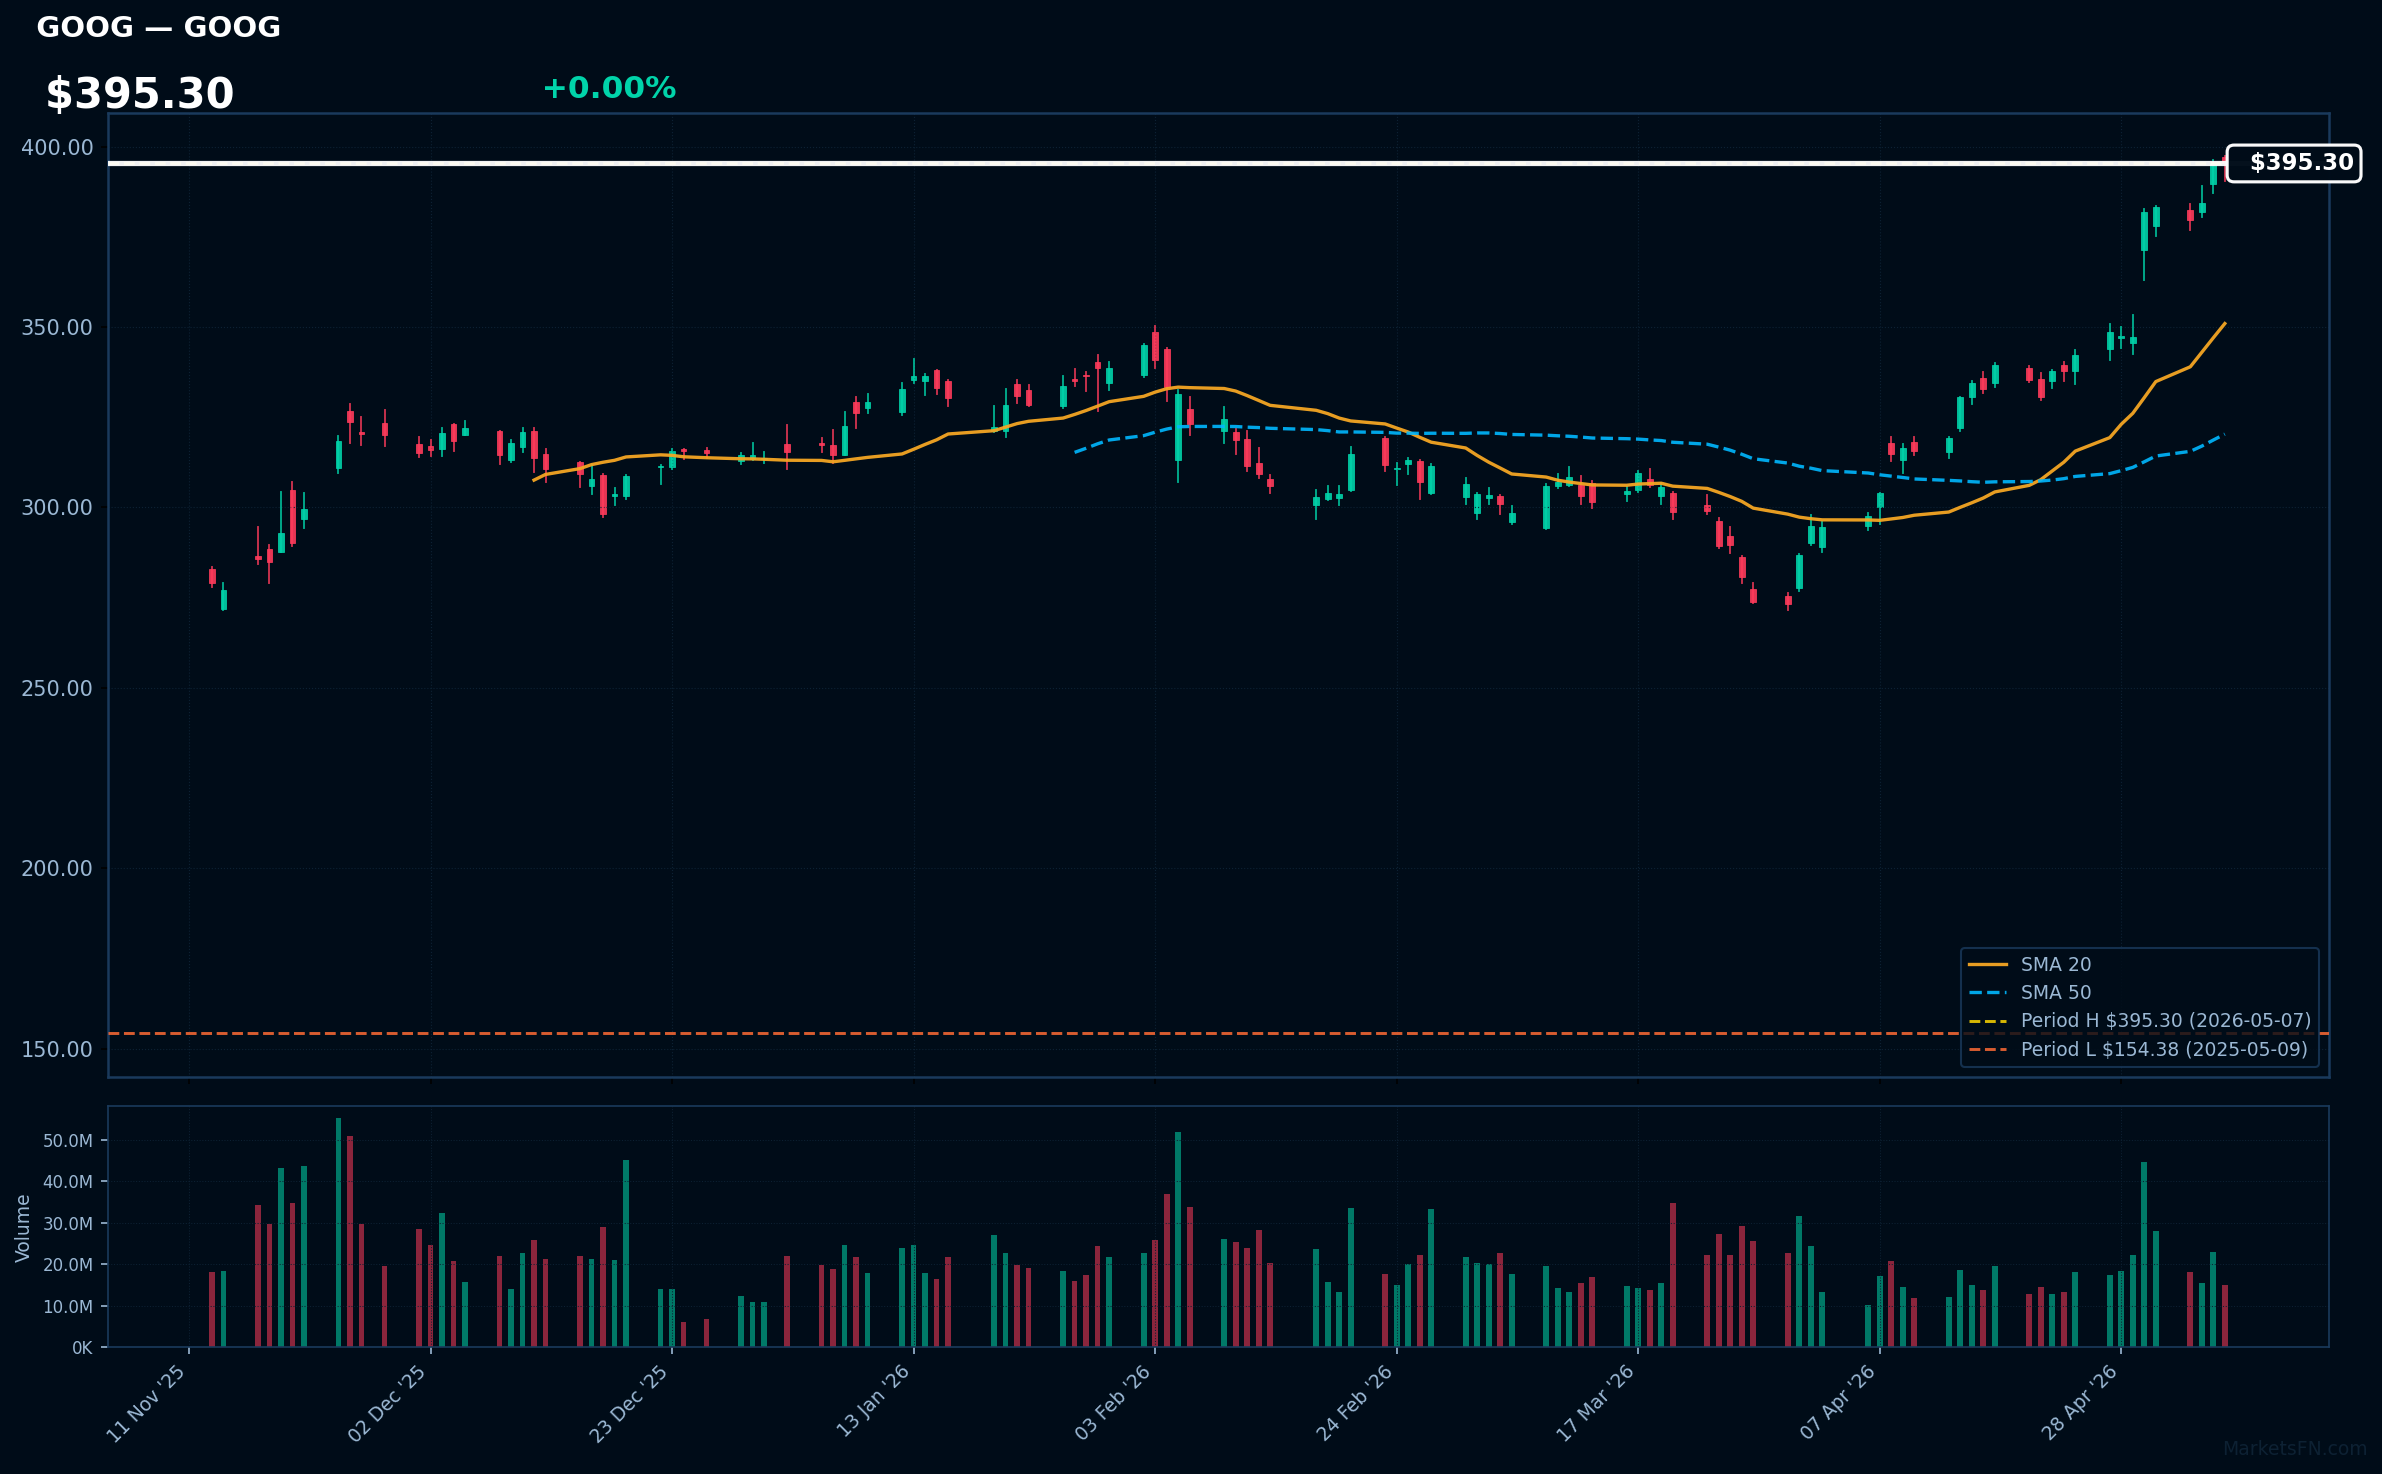
GOOG | Alphabet Inc | Communication Services | Prezzo: $395.14 | Massimo a 52 settimane: $395.14 (2026-05-06) | Distanza: +0.00% | RSI: 82.8 | vs MA200: +39.0% | Tendenza: Above MA20, MA50, MA200
Alphabet Inc. offers various products and platforms in the United States, Europe, the Middle East, Africa, the Asia-Pacific, Canada, and Latin America. It operates through Google Services, Google Cloud, and Other Bets segments. The Google Services segment provides products and services, including ads, Android, Chrome, devices, Gmail, Google Drive, Google Maps, Google Photos, Google Play, Search, and YouTube. It is also involved in the sale of apps and in-app purchases and digital content in Google Play and YouTube; and devices, as well as the provision of YouTube consumer subscription services, such as YouTube TV, YouTube Music and Premium, NFL Sunday…
Titoli recenti (ultime 12h)
- Quantum Motion raises $160 million to build quantum computers from standard silicon transistors
- Meta seeks to challenge Google, Amazon, and TikTok Shop with consumer AI agents
- Kimi Chatbot Maker Moonshot AI Valued at $20 Billion in Meituan-Led Round
- Top Trump Aide Says Administration Wont Pick Winners in AI Race
📉 Più vicino al 52-Week Low
Settori rappresentati: Healthcare (2), Consumer Cyclical (1), Technology (1), Financial (1)
| Simbolo | Azienda | Settore | Prezzo | % sopra Basso | Basso del Periodo | Data del Basso | RSI | vs MA200 | Tendenza |
|---|---|---|---|---|---|---|---|---|---|
| ABT | Abbott Laboratories | Healthcare | $86.30 | +0.00% | $86.30 | 2026-05-06 | 23.3 | -28.1% | Sotto MA20, MA50, MA200 |
| MCD | McDonald's Corp | Consumer Cyclical | $284.10 | +0.00% | $284.10 | 2026-05-04 | 30.9 | -8.1% | Sotto MA20, MA50, MA200 |
| ACN | Accenture plc | Technology | $174.57 | +0.00% | $174.57 | 2026-05-06 | 33.5 | -26.9% | Sotto MA20, MA50, MA200 |
| MDT | Medtronic Plc | Healthcare | $77.60 | +0.00% | $77.60 | 2026-05-06 | 27.3 | -17.4% | Sotto MA20, MA50, MA200 |
| AON | Aon plc | Financial | $308.27 | +0.00% | $308.27 | 2026-05-06 | 37.9 | -10.5% | Sotto MA20, MA50, MA200 |
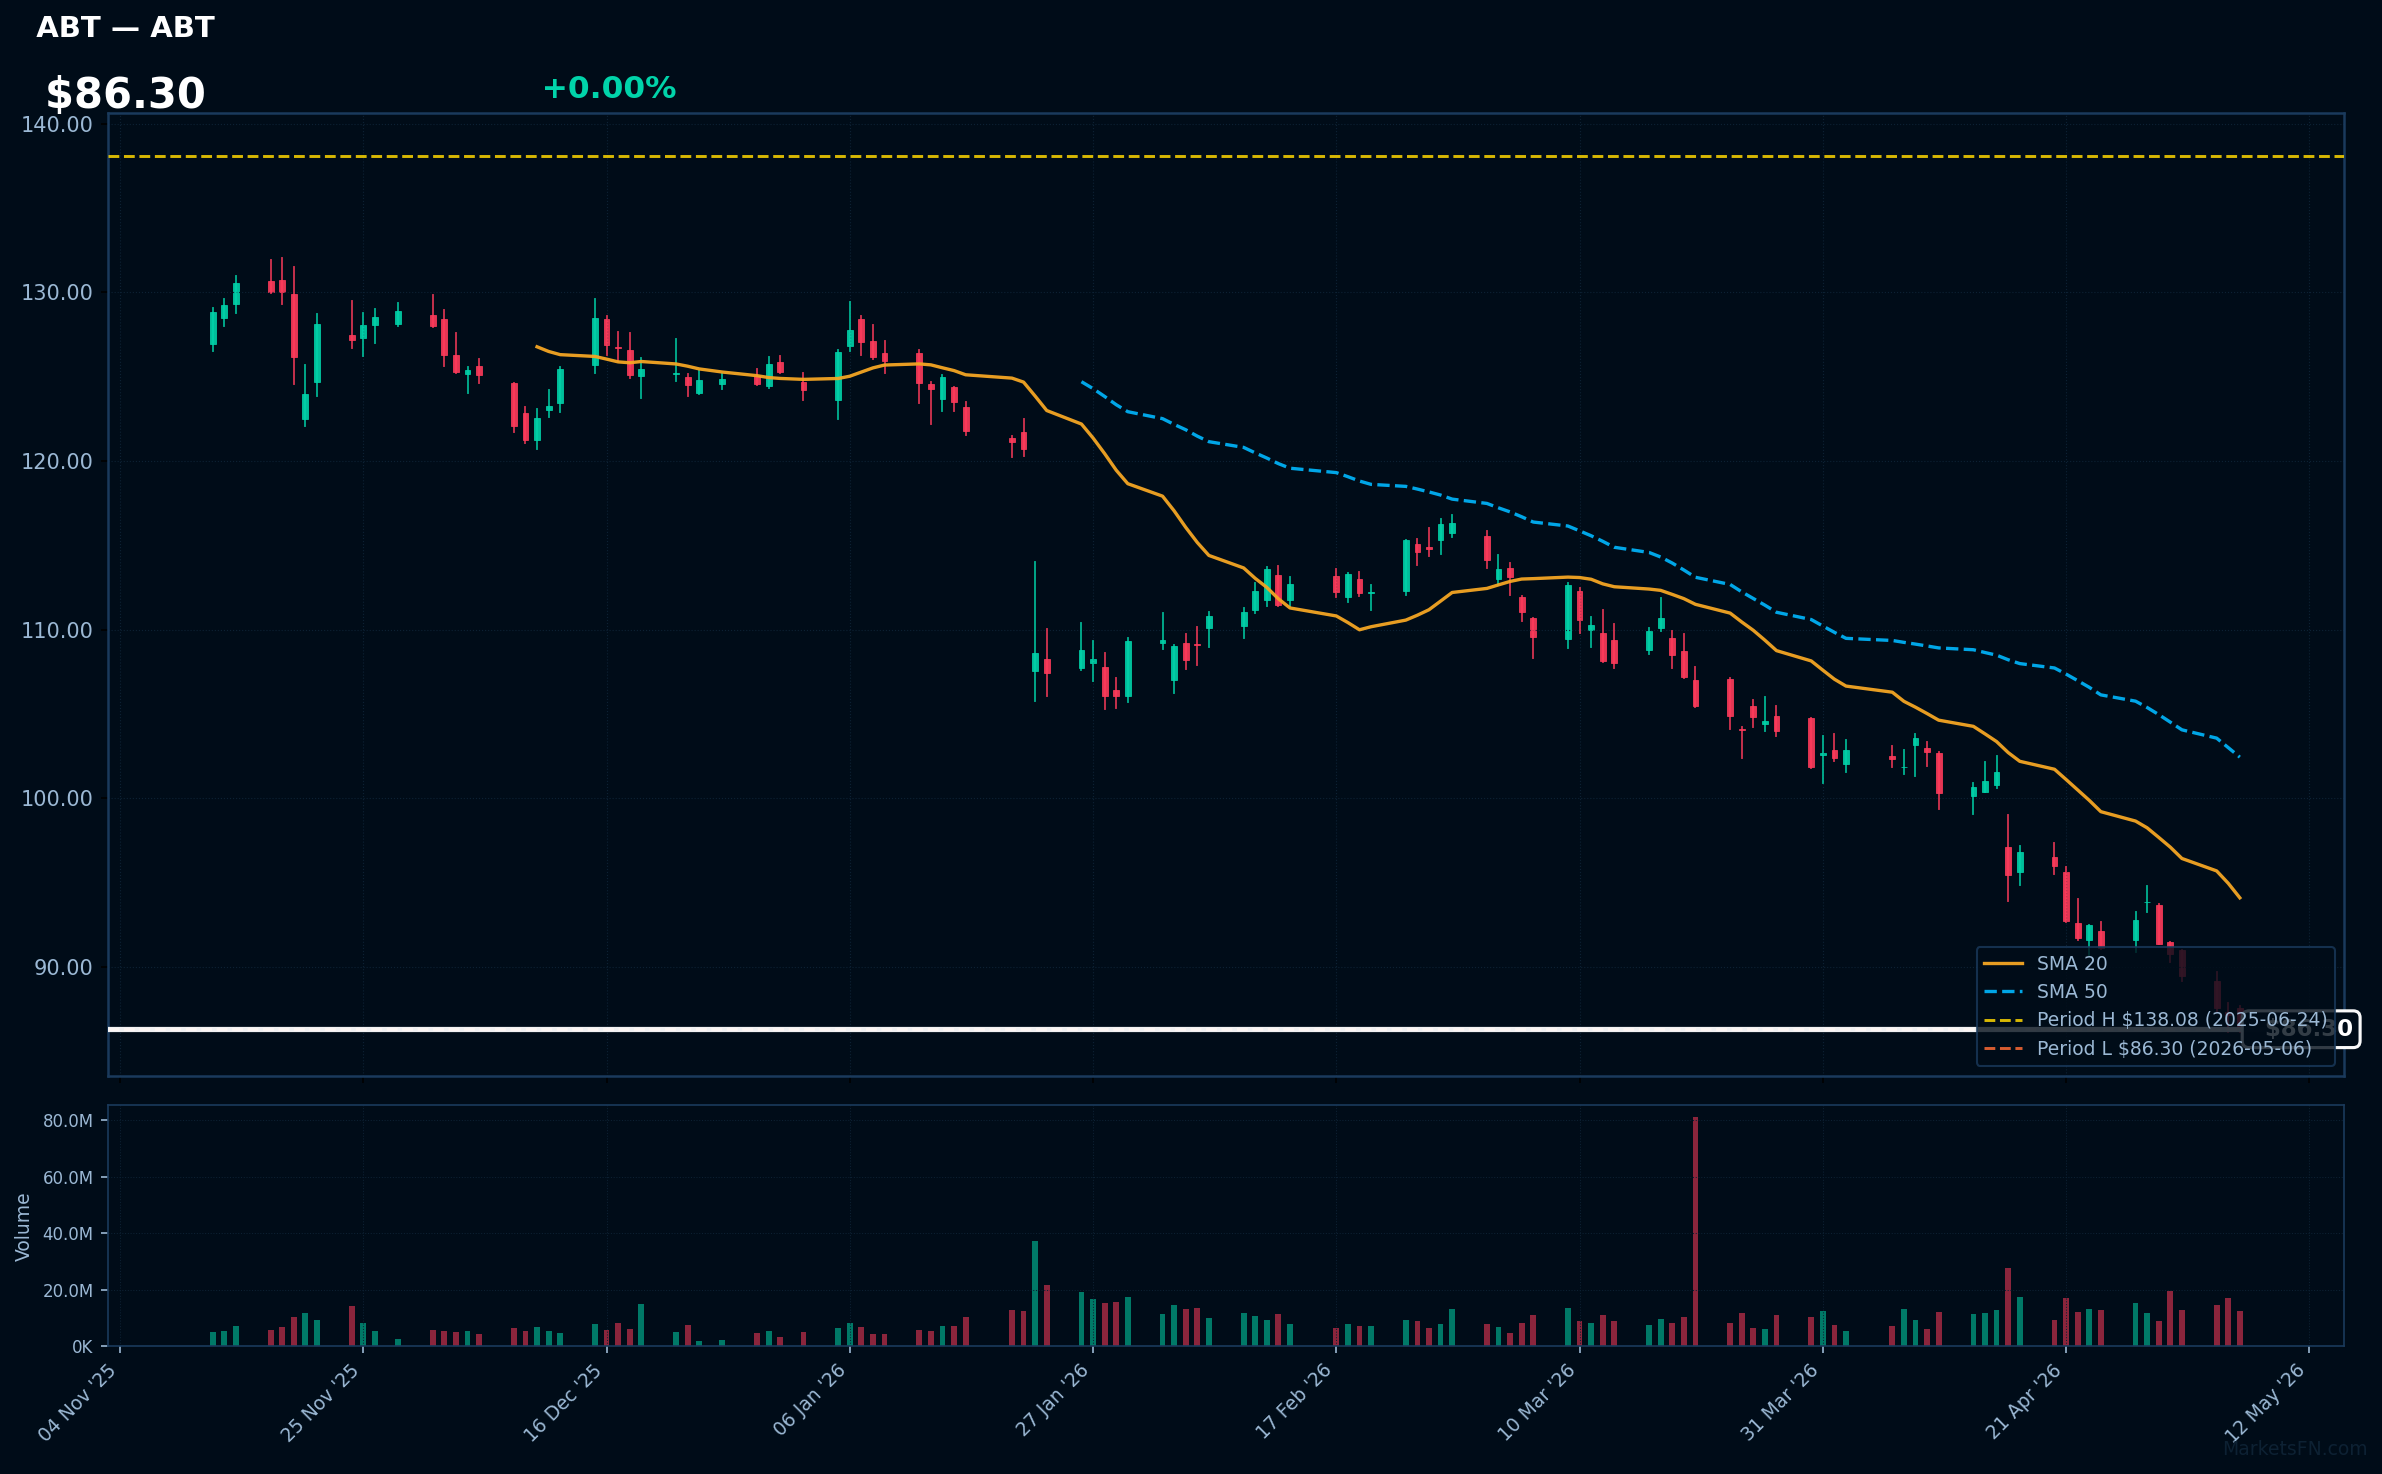
ABT | Abbott Laboratories | Healthcare | Prezzo: $86.30 | 52-Week Low: $86.30 (2026-05-06) | Distanza: +0.00% | RSI: 23.3 | vs MA200: -28.1% | Tendenza: Sotto MA20, MA50, MA200
Abbott Laboratories, insieme alle sue controllate, scopre, sviluppa, produce e vende prodotti per la salute in tutto il mondo. Opera in quattro segmenti: Prodotti Farmaceutici Stabiliti, Prodotti Diagnostici, Prodotti Nutrizionali e Dispositivi Medici. L'azienda offre farmaci generici per il trattamento dell'insufficienza esocrina pancreatica, della sindrome dell'intestino irritabile o dello spasmo biliare, della colestasi intraepatica o dei sintomi depressivi, del disturbo ginecologico, della terapia ormonale sostitutiva, della dislipidemia, dell'ipertensione, dell'ipotiroidismo, dell'ipertrigliceridemia, della malattia di Ménière e della vertigine vestibolare, del dolore, della febbre, dell'infiammazione e dell'emicrania, nonché fornisce anti-infettivi claritromicina, vaccino influenzale e prodotti per regolare il ritmo fisiologico del colon. Fornisce anche sistemi di laboratorio e medicina trasfusionale nelle aree…
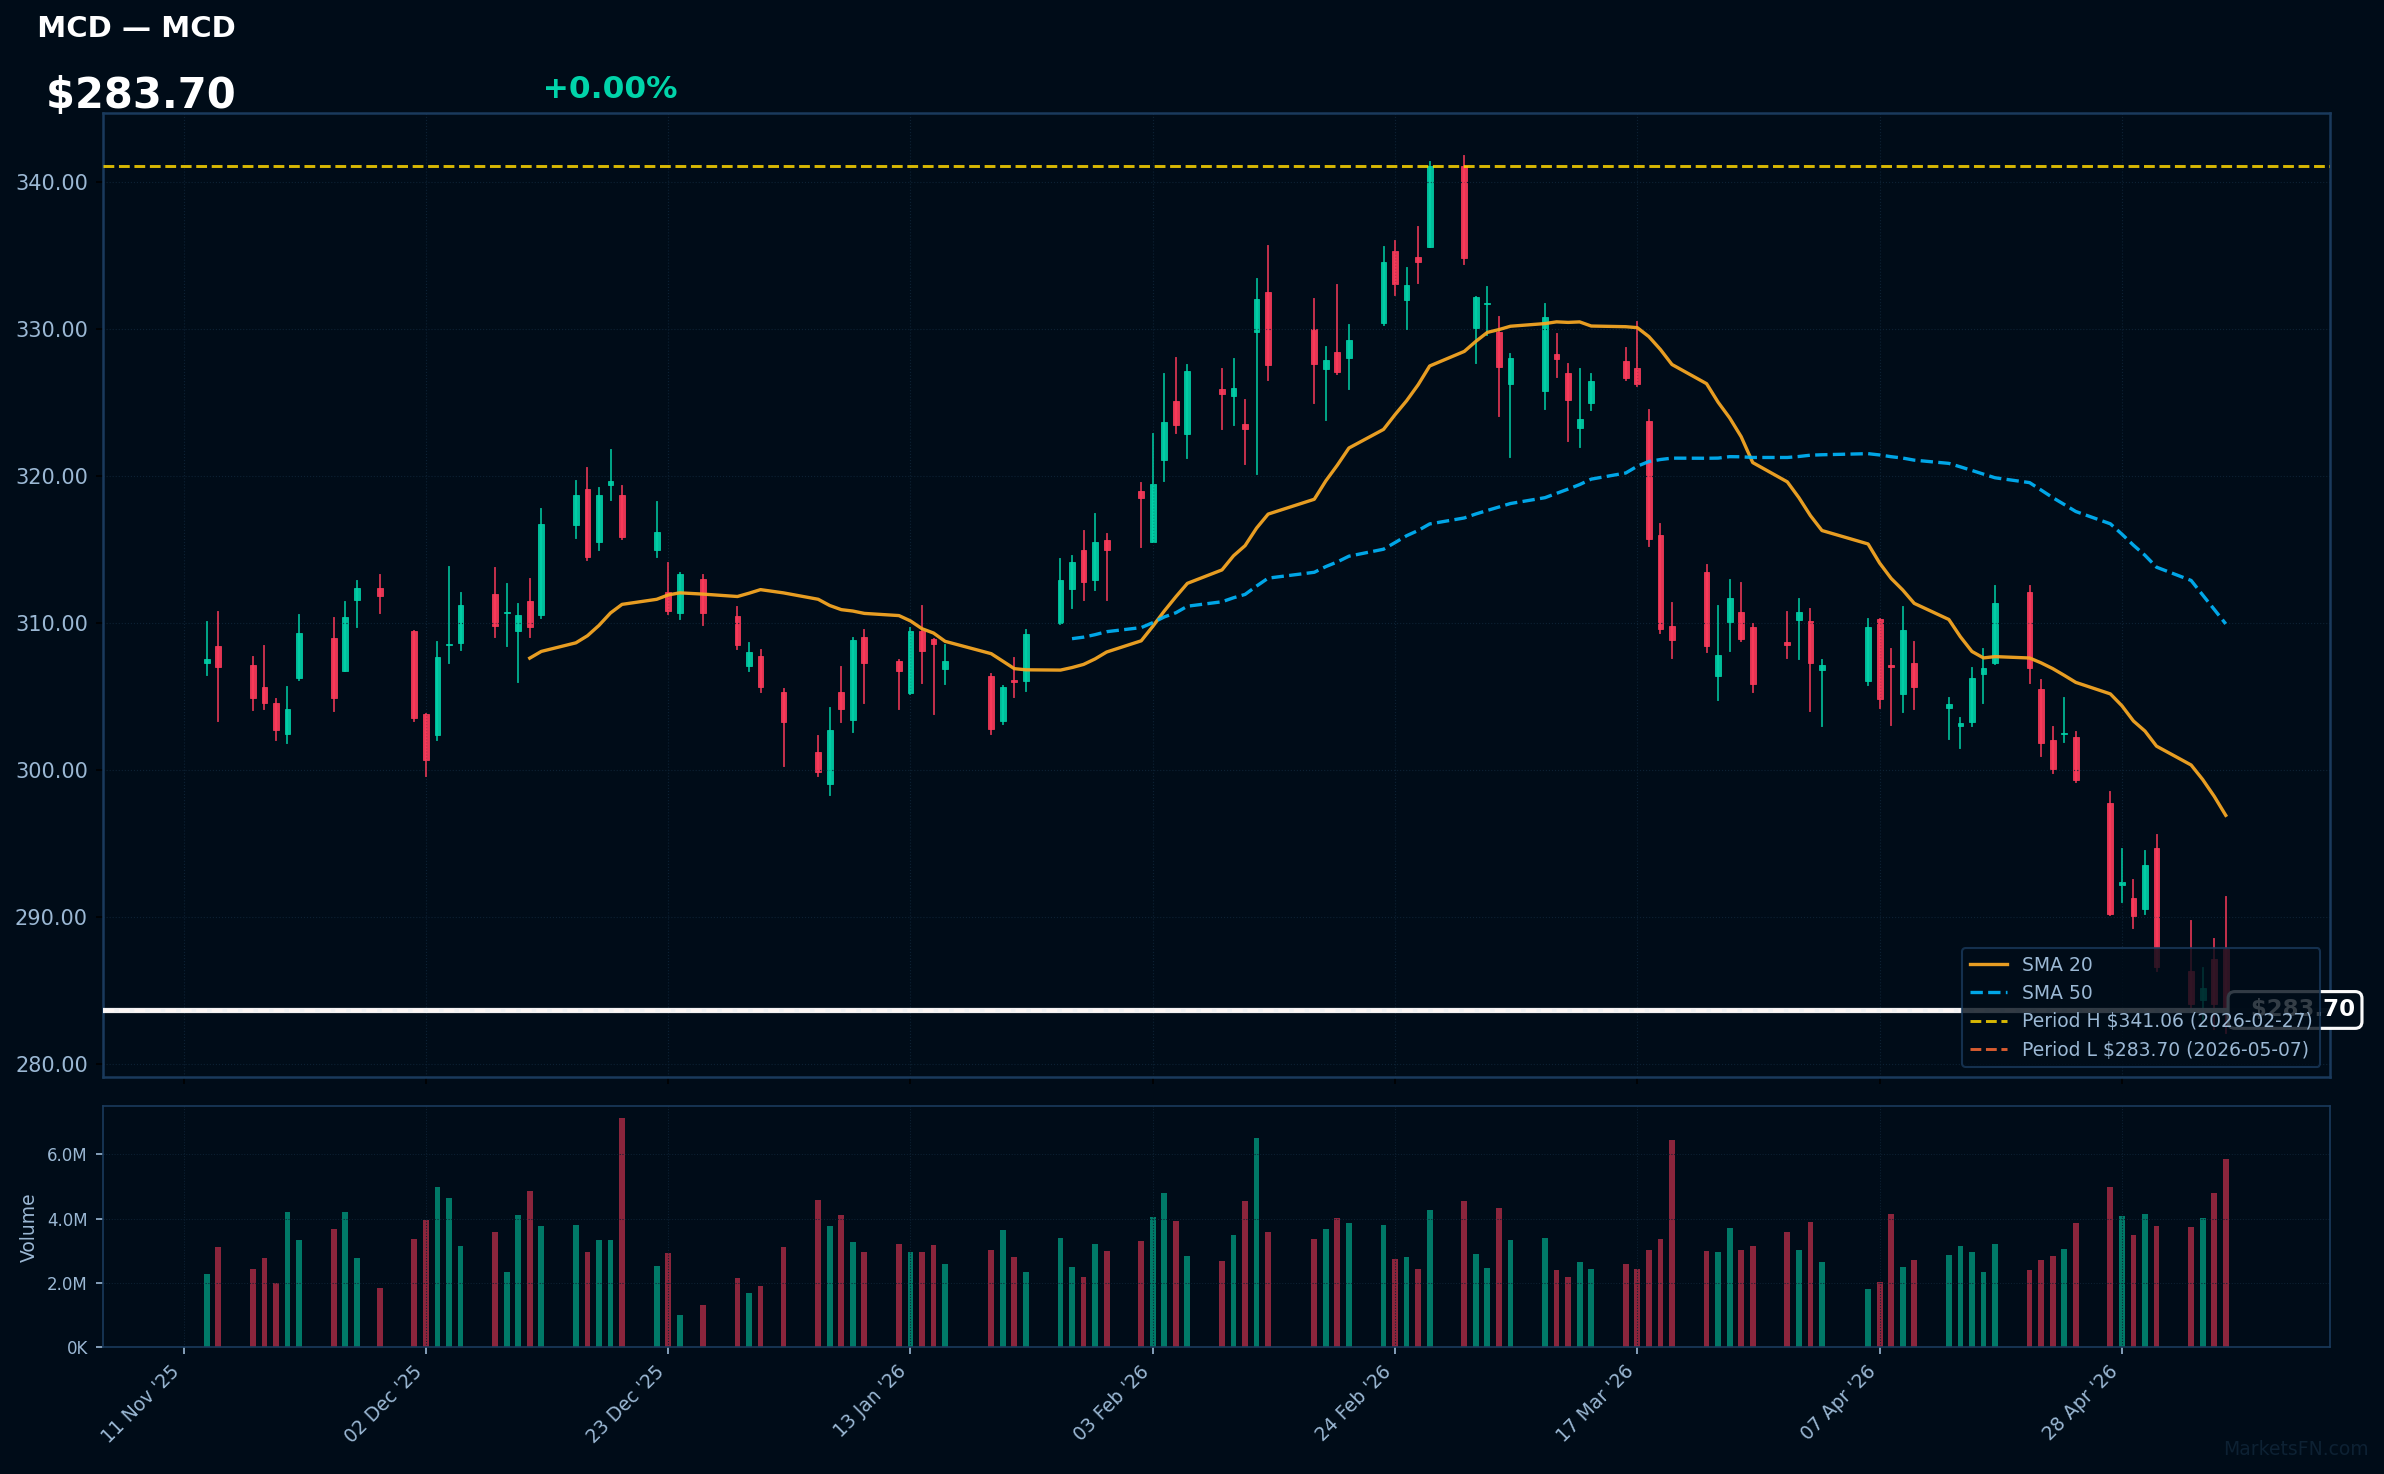
MCD | McDonald's Corp | Consumer Cyclical | Prezzo: $284.10 | 52-Week Low: $284.10 (2026-05-04) | Distanza: +0.00% | RSI: 30.9 | vs MA200: -8.1% | Tendenza: Sotto MA20, MA50, MA200
McDonald's Corporation possiede, gestisce e concede in franchising ristoranti con il marchio McDonald's negli Stati Uniti e a livello internazionale. Offre cibo e bevande, inclusi hamburger e cheeseburger, vari panini con pollo, patatine fritte, frullati, dessert surgelati, sundaes, coni soft serve, biscotti, torte, bibite analcoliche, caffè e altre bevande; e colazione completa o limitata, nonché vende vari altri prodotti durante promozioni a tempo limitato. L'azienda possiede e gestisce ristoranti in franchising con varie strutture, tra cui franchising convenzionale, licenza di sviluppo o affiliato. McDonald's Corporation è stata fondata nel 1940 e ha sede a Chicago, Illinois.
Titoli recenti (ultime 12h)
- Stock Market Today: S&P 500 and Nasdaq consolidate at record highs, Dow just shy of fresh peak as oil prices pull back on hopes of end to Iran war; earnings optimism buoys sentiment.
- McDonald's Leaned on Value Meals and New Menu Items for Growth. Thursday's Earnings Report Will Tell Whether It Worked.
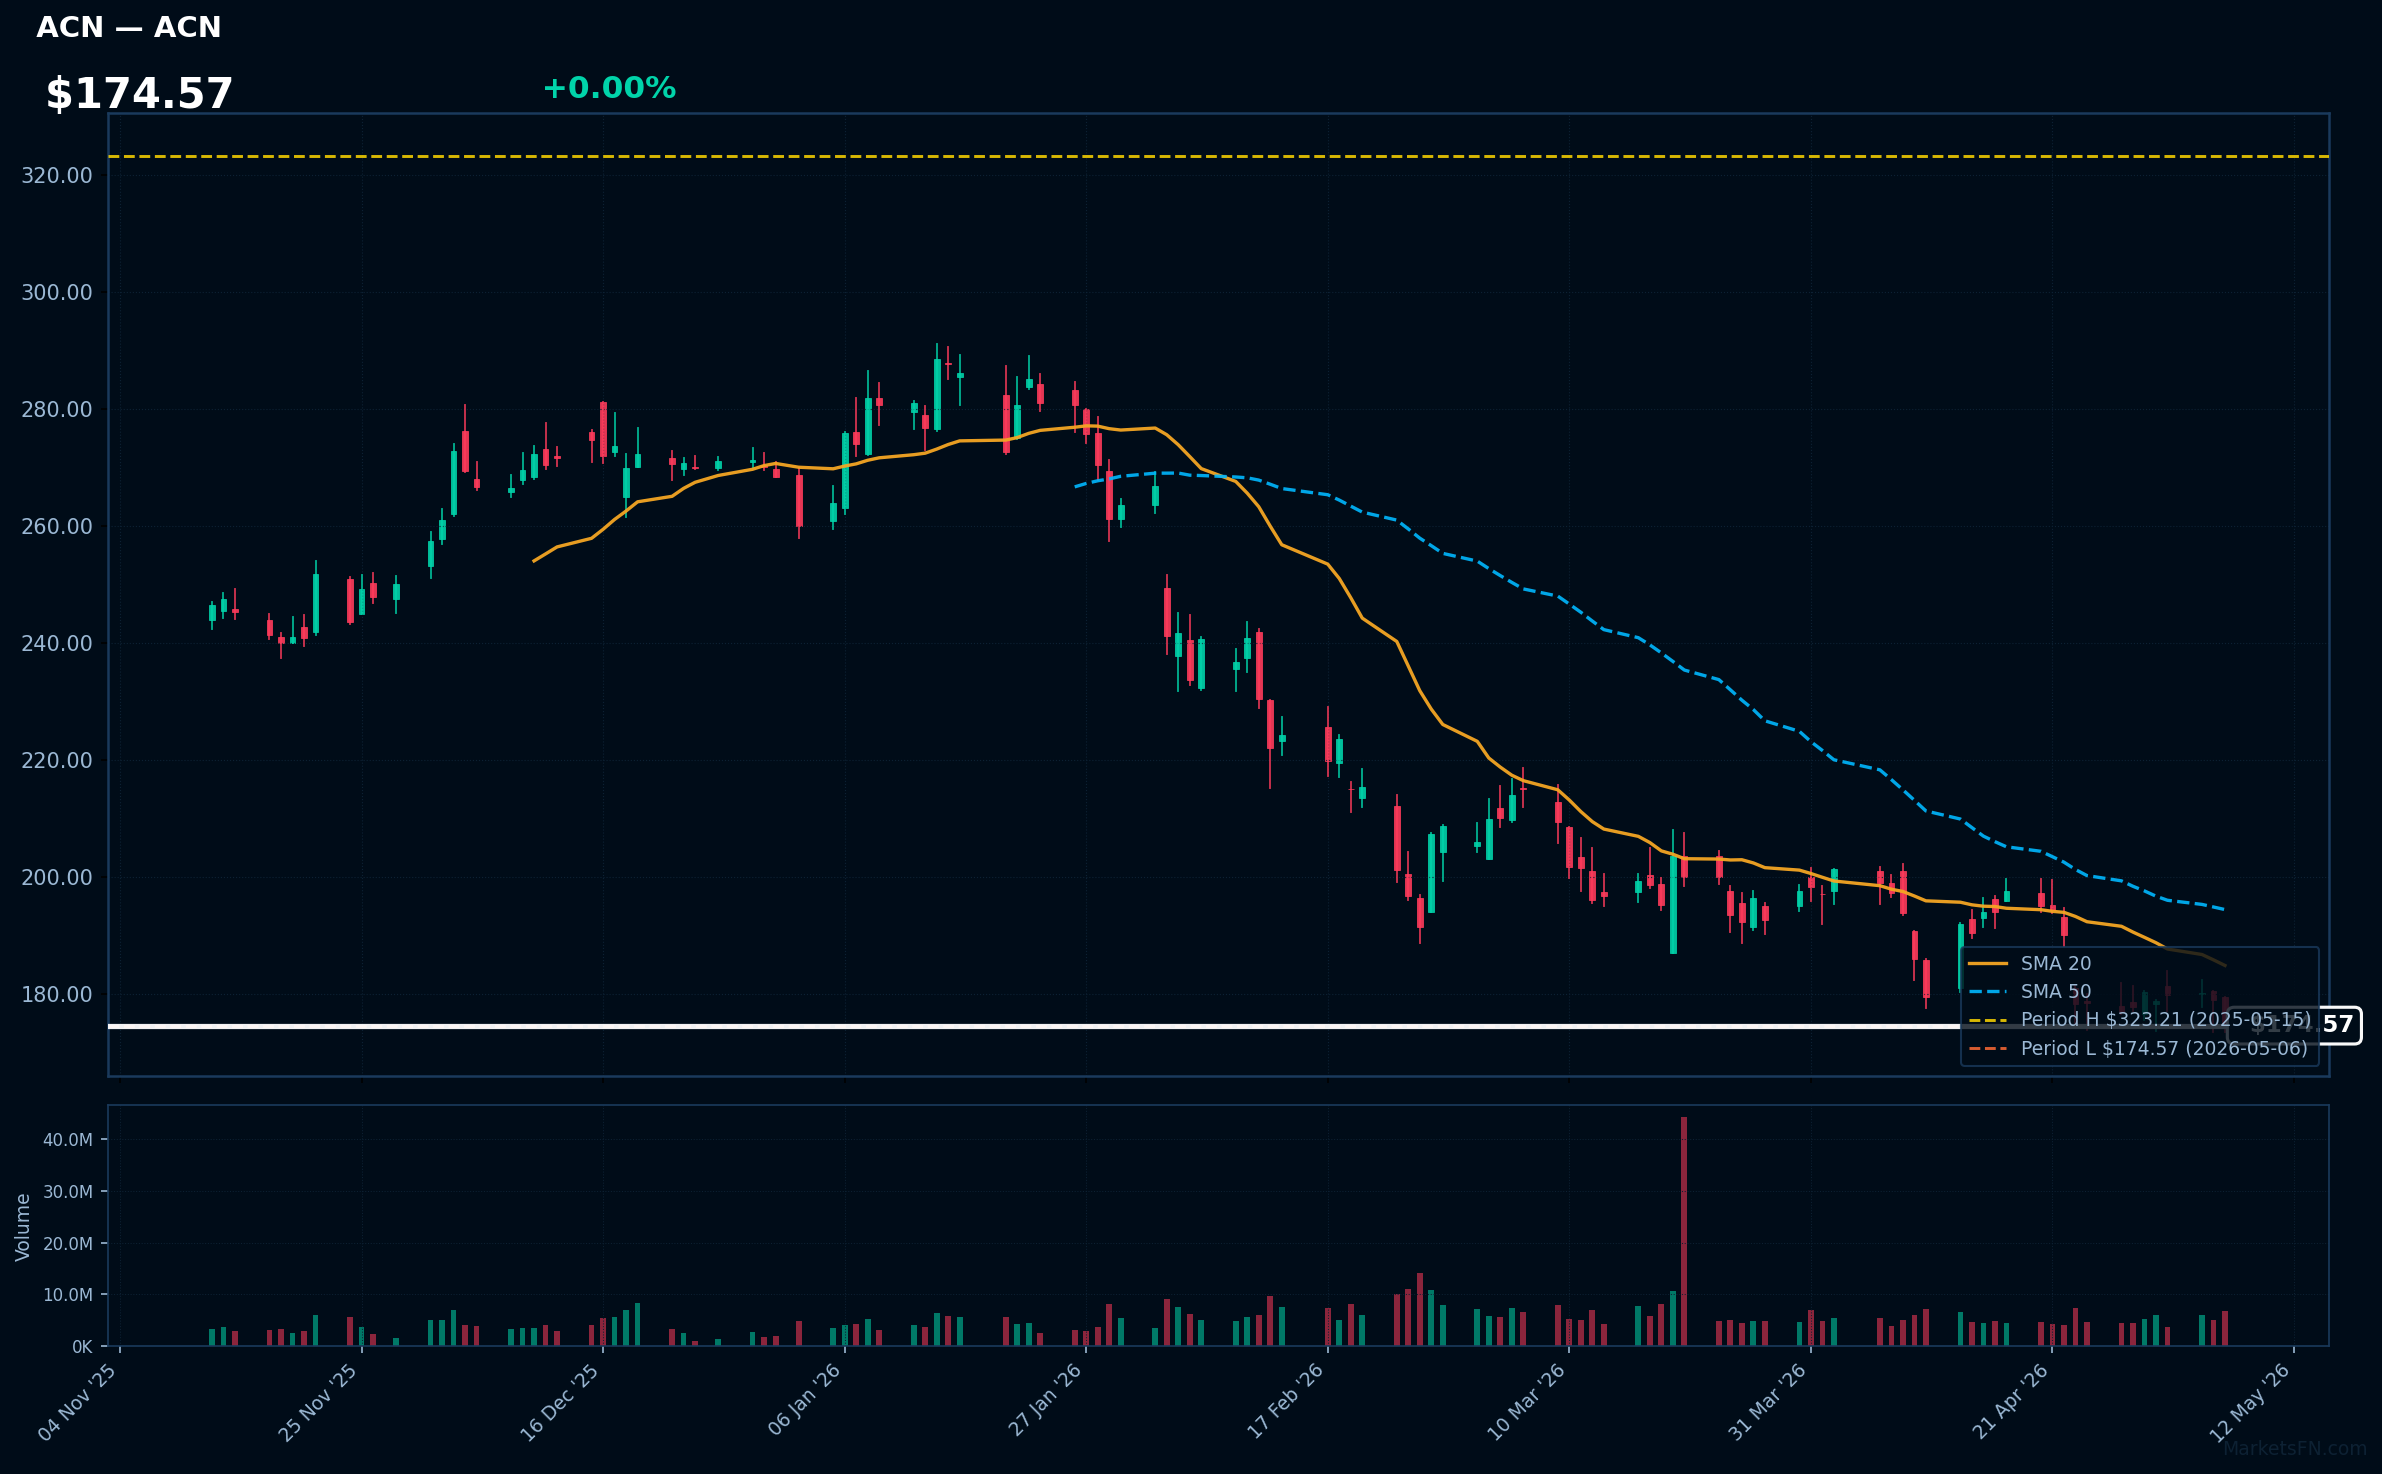
ACN | Accenture plc | Technology | Prezzo: $174.57 | 52-Week Low: $174.57 (2026-05-06) | Distanza: +0.00% | RSI: 33.5 | vs MA200: -26.9% | Tendenza: Sotto MA20, MA50, MA200
Accenture plc fornisce servizi di strategia e consulenza, industry X, song, e tecnologia e operazioni nelle Americhe, in Europa, in Medio Oriente, in Africa e nella regione Asia Pacifico. Offre integrazione di sistemi e gestione delle applicazioni; sicurezza; piattaforma intelligente; infrastrutture; ingegneria software; dati, AI, cloud; e servizi di automazione e consegna globale. L'azienda gestisce anche processi aziendali per funzioni aziendali specifiche, tra cui finanza e contabilità, approvvigionamento e acquisti, catena di fornitura, marketing e vendite, e risorse umane, nonché servizi specifici del settore, come piattaforma di fiducia e sicurezza, servizi bancari, assicurativi, di rete e sanitari; e progetta, produce e assembla apparecchiature di automazione, robotica e altri…
Titoli recenti (ultime 12h)
- Accenture Partners with the WTA to Help Build the Future of Womens Tennis

MDT | Medtronic Plc | Healthcare | Prezzo: $77.60 | 52-Week Low: $77.60 (2026-05-06) | Distanza: +0.00% | RSI: 27.3 | vs MA200: -17.4% | Tendenza: Sotto MA20, MA50, MA200
Medtronic plc sviluppa, produce e vende terapie mediche basate su dispositivi per sistemi sanitari, medici, clinici e pazienti negli Stati Uniti, in Irlanda e a livello internazionale. Il segmento Portfolio Cardiovascolare offre pacemaker cardiaci impiantabili, defibrillatori cardioverter e dispositivi di terapia di resincronizzazione cardiaca; prodotti per ablazione cardiaca; sistemi di monitoraggio cardiaco impiantabili; prodotti TYRX; e software di monitoraggio remoto e incentrato sul paziente. Fornisce anche valvole aortiche,
Commento di Mercato
The S&P 500 stocks approaching 52-week extremes highlight divergent market dynamics. Tech leaders like AAPL, GOOGL, GOOG, AMZN, and AMD at or near highs signal strong momentum in growth sectors, potentially reflecting investor optimism around innovation and economic recovery. Conversely, defensive stocks such as ABT, MCD, ACN, MDT, and AON near lows indicate sector-specific vulnerabilities, possibly due to inflationary pressures or reduced consumer demand, underscoring a broader market bifurcation.
Sector rotation appears evident, with capital shifting toward technology amid macro themes like AI advancements and digital adoption, driving these stocks to highs. Meanwhile, staples and healthcare sectors face headwinds from rising interest rates and economic uncertainty, contributing to their lows. This pattern suggests a preference for high-growth plays over traditional safe havens, influenced by post-pandemic recovery and monetary policy shifts.
Key levels to watch include potential breakouts above current highs for tech stocks, which could trigger further rallies, or rebounds from lows in defensive names signaling oversold conditions. Catalysts such as upcoming earnings reports from these companies and key economic data, like inflation figures or Fed decisions, may sway these positions, offering opportunities for strategic adjustments in portfolios.
Methodology: All 503 S&P 500 constituents screened. 52-week high = highest daily close over the past 252 trading days (approx. 1 year). 52-week low = lowest daily close over the same period. Distance = (current price / extreme − 1) × 100. Technical indicators computed on up to 1 year of daily OHLCV data.
Disclaimer: Per scopi informativi solamente. Non costituisce consiglio di investimento. Le performance passate non sono indicative dei risultati futuri.
Related Articles
- S&P 500: Massimi e Minimi a 52 Settimane — S&P 500 stocks nearest to their 52-week high and low. Bloomberg-style charts, RSI/MA analysis and Gr
- S&P 500: Massimi e Minimi a 52 Settimane — S&P 500 stocks nearest to their 52-week high and low. Bloomberg-style charts, RSI/MA analysis and Gr
- Nasdaq 100: Massimi e Minimi a 52 Settimane — Nasdaq 100 stocks nearest to their 52-week high and low. Bloomberg-style charts, RSI/MA analysis and
- S&P 500: Massimi e Minimi a 52 Settimane — S&P 500 stocks nearest to their 52-week high and low. Bloomberg-style charts, RSI/MA analysis and Gr
- Nasdaq 100: Massimi e Minimi a 52 Settimane — Nasdaq 100 stocks nearest to their 52-week high and low. Bloomberg-style charts, RSI/MA analysis and