S&P 500 52-Week Highs & Lows Radar: GE Aerospace (GE), Palantir (PLTR) and more
· Stocks · MarketsFN Team
S&P 500 52-Week Highs & Lows Radar: GE Aerospace (GE), Palantir (PLTR) and more
Screening all 503 S&P 500 constituents for stocks nearest to their 52-week high and their 52-week low. Data as of June 22, 2026. % Realized = 52-week total return.
Legend: RSI > 70 = overbought · RSI < 30 = oversold · Green % Realized = positive 52W return · Red = negative.
📈 Nearest to 52-Week High
Sectors represented: Industrials (2), Financial (2), Technology (1)
| Ticker | Company | Sector | Price Last | % Realized | 52-Week High Date | RSI | % above MA200 | Trend |
|---|---|---|---|---|---|---|---|---|
| GE | GE Aerospace | Industrials | $358.60 | +44.71% | 2026-06-22 | 71.7 | +17.2% | Above MA20, MA50, MA200 |
| MS | Morgan Stanley | Financial | $226.06 | +68.70% | 2026-06-22 | 70.7 | +28.5% | Above MA20, MA50, MA200 |
| GS | Goldman Sachs Group, Inc | Financial | $1105.54 | +70.90% | 2026-06-22 | 66.4 | +25.8% | Above MA20, MA50, MA200 |
| CAT | Caterpillar Inc | Industrials | $1009.42 | +175.62% | 2026-06-22 | 68.3 | +49.9% | Above MA20, MA50, MA200 |
| TXN | Texas Instruments Inc | Technology | $329.36 | +63.54% | 2026-06-22 | 63.6 | +56.1% | Above MA20, MA50, MA200 |
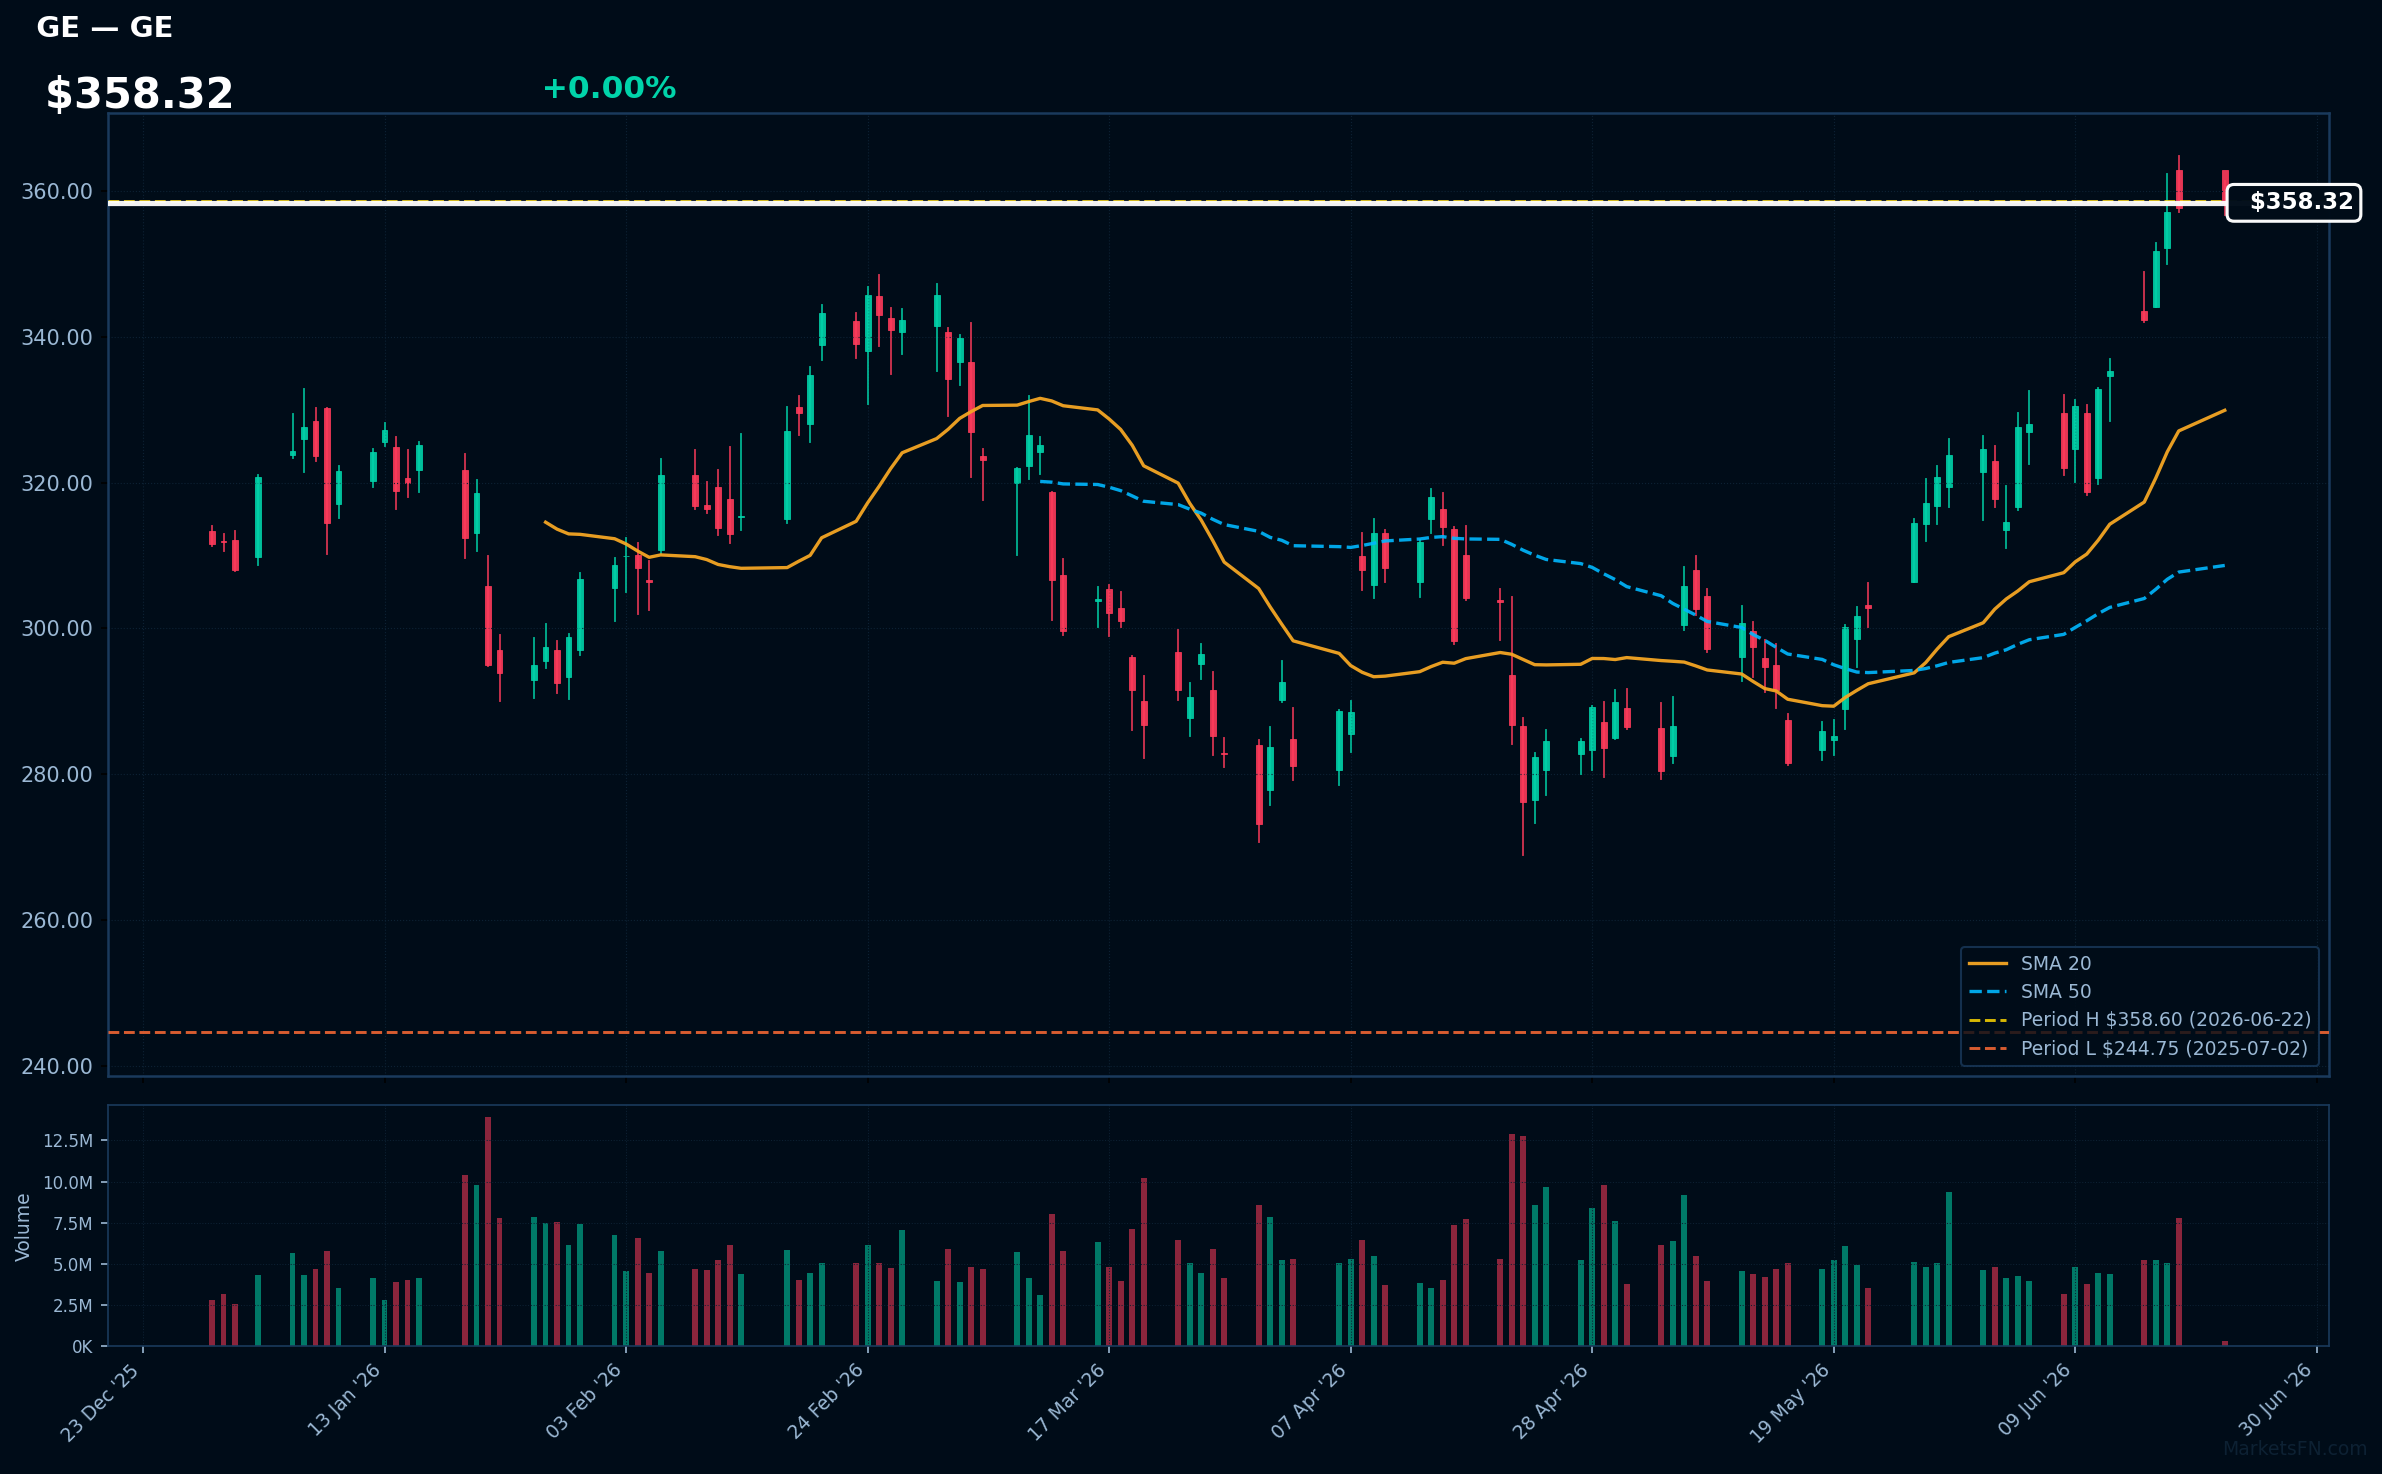
GE | GE Aerospace | Industrials | Price Last: $358.60 | % Realized: +44.71% | RSI: 71.7 | % above MA200: +17.2% | Trend: Above MA20, MA50, MA200
GE Aerospace is a leader in the aerospace industry, manufacturing commercial and military jet engines, components, and integrated systems. Investors should care about its technological advancements, market share, and order backlog, which drive revenue growth and profitability.
GE Aerospace's technicals indicate strong momentum: RSI(14) is 71.7, nearing overbought territory. The stock is in a sustained uptrend with price > MA20 > MA50 > MA200, and is 0.0% below its 52-Week high, suggesting a potential breakout.
Related headlines
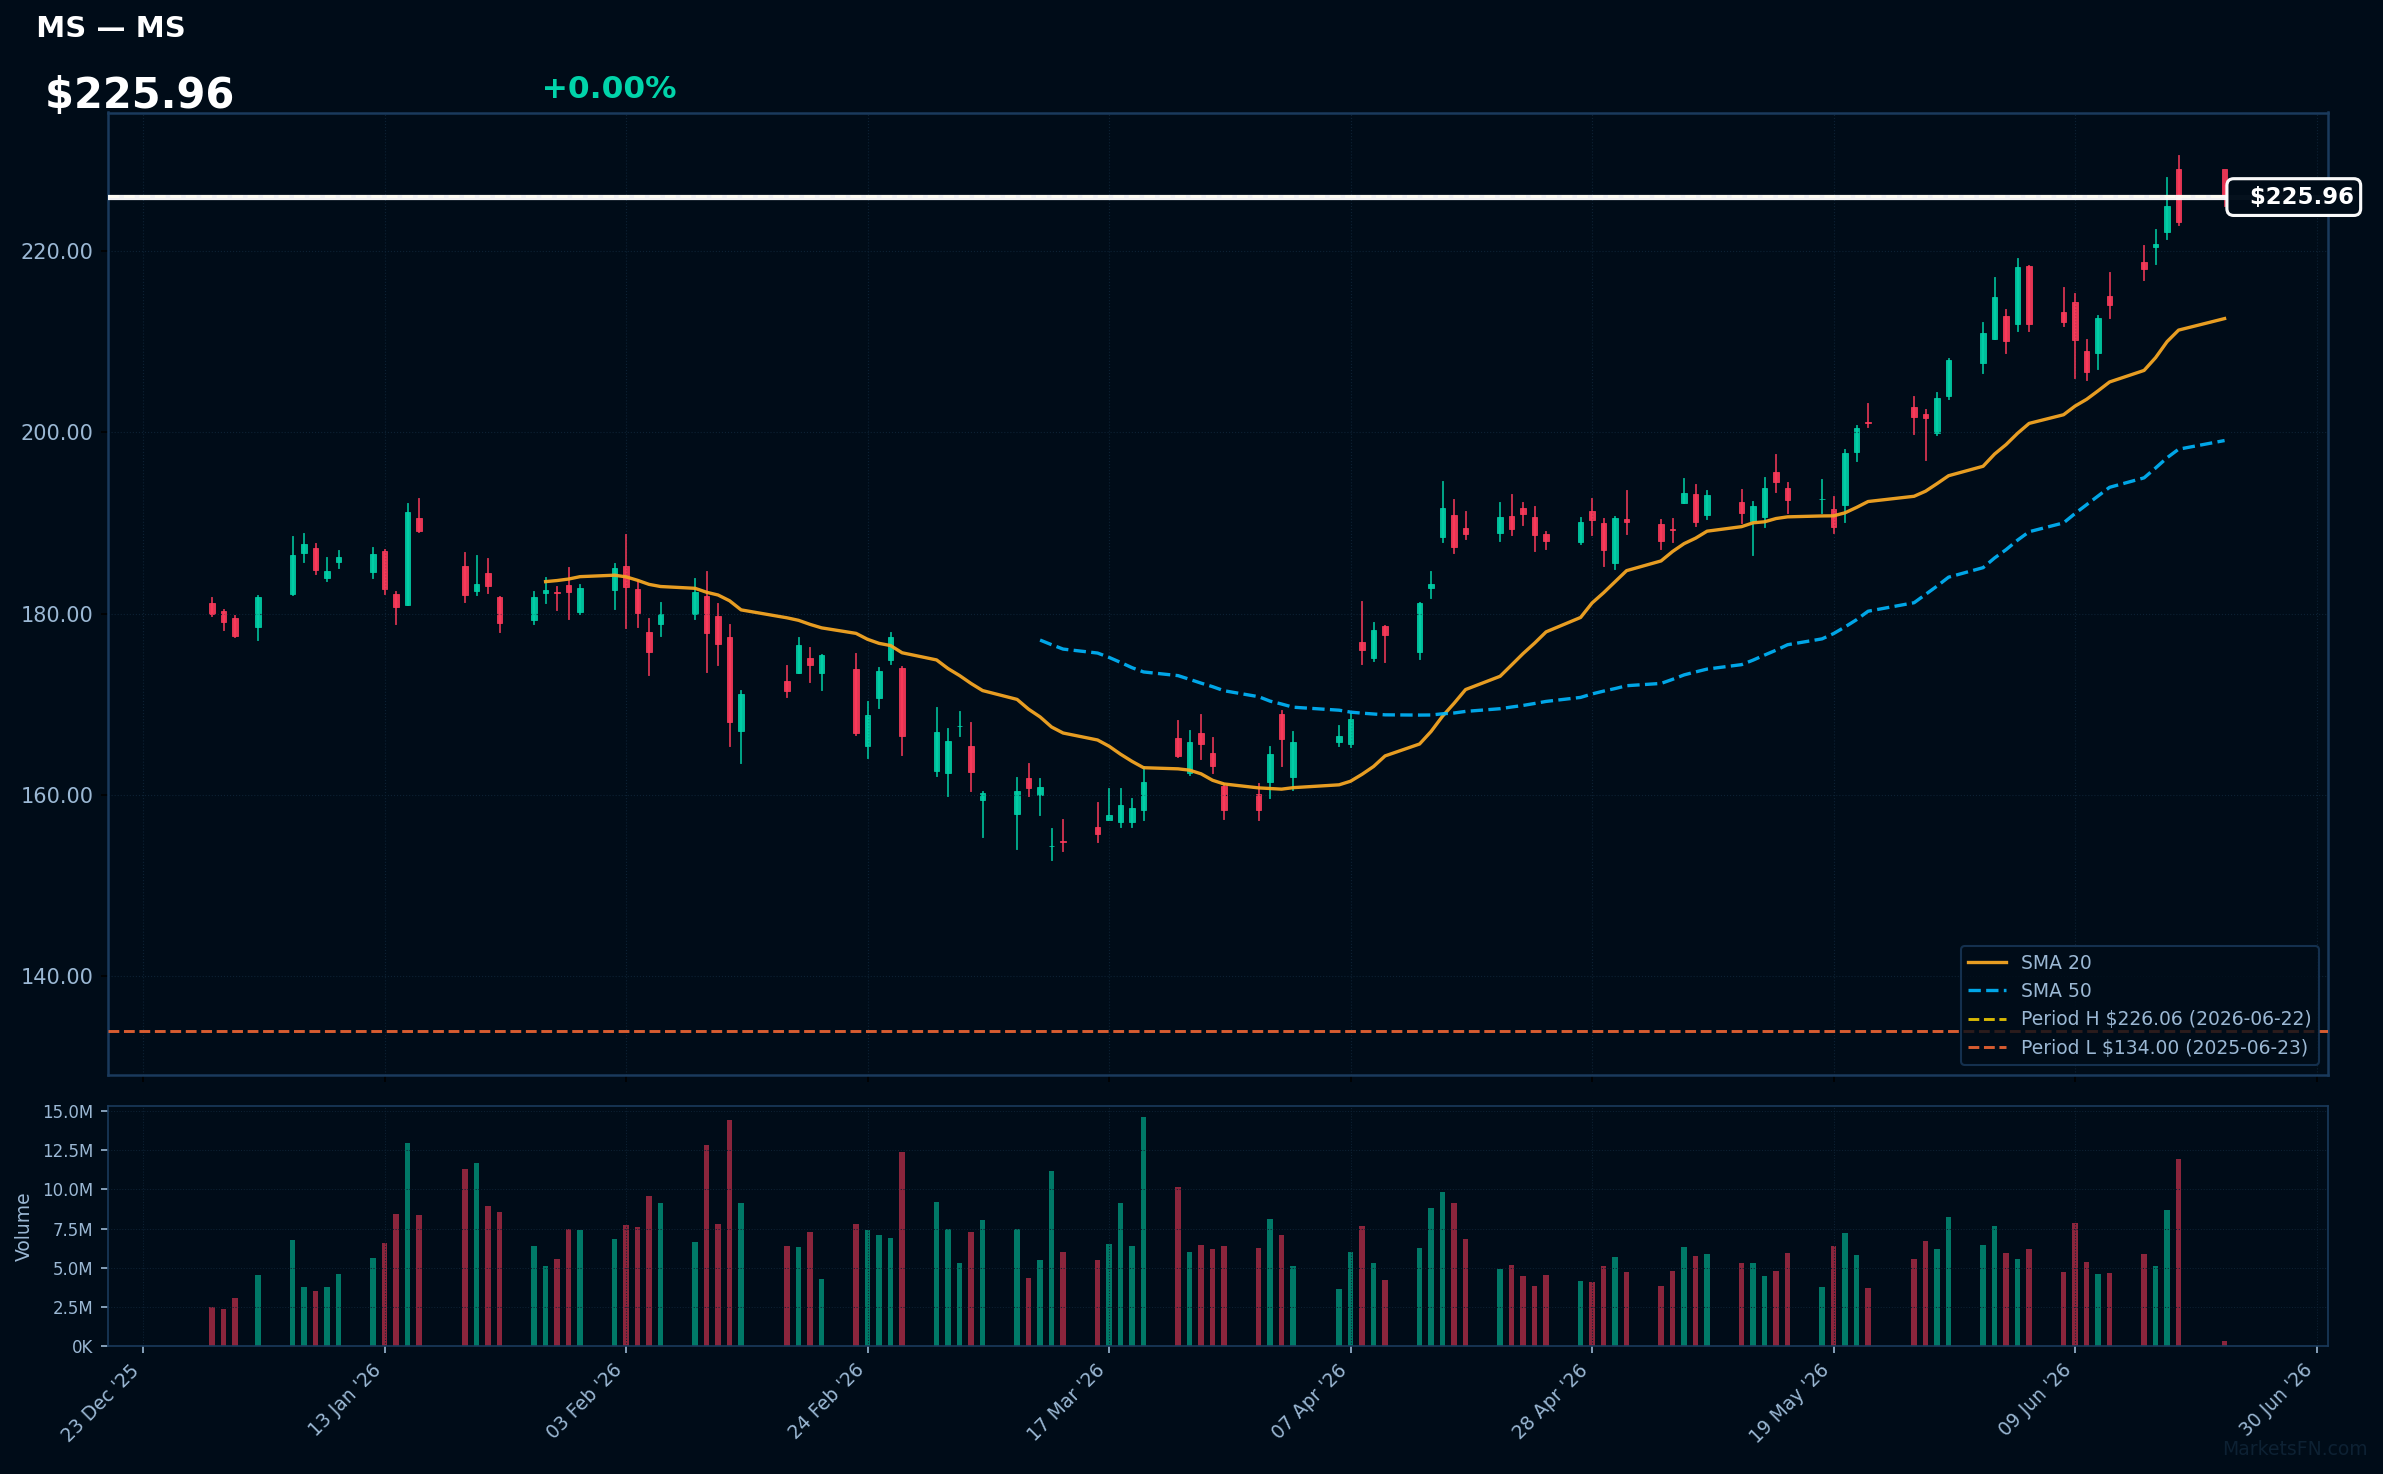
MS | Morgan Stanley | Financial | Price Last: $226.06 | % Realized: +68.70% | RSI: 70.7 | % above MA200: +28.5% | Trend: Above MA20, MA50, MA200
Morgan Stanley is a global financial services firm providing investment banking, wealth management, and investment management services. Investors should care about its diversified revenue streams and market position, which drive long-term growth.
Morgan Stanley's RSI is 70.7, indicating strong momentum. The stock is in a sustained uptrend with price > MA20 > MA50 > MA200, and is 0.0% below its 52-Week high, suggesting a potential breakout.
Related headlines
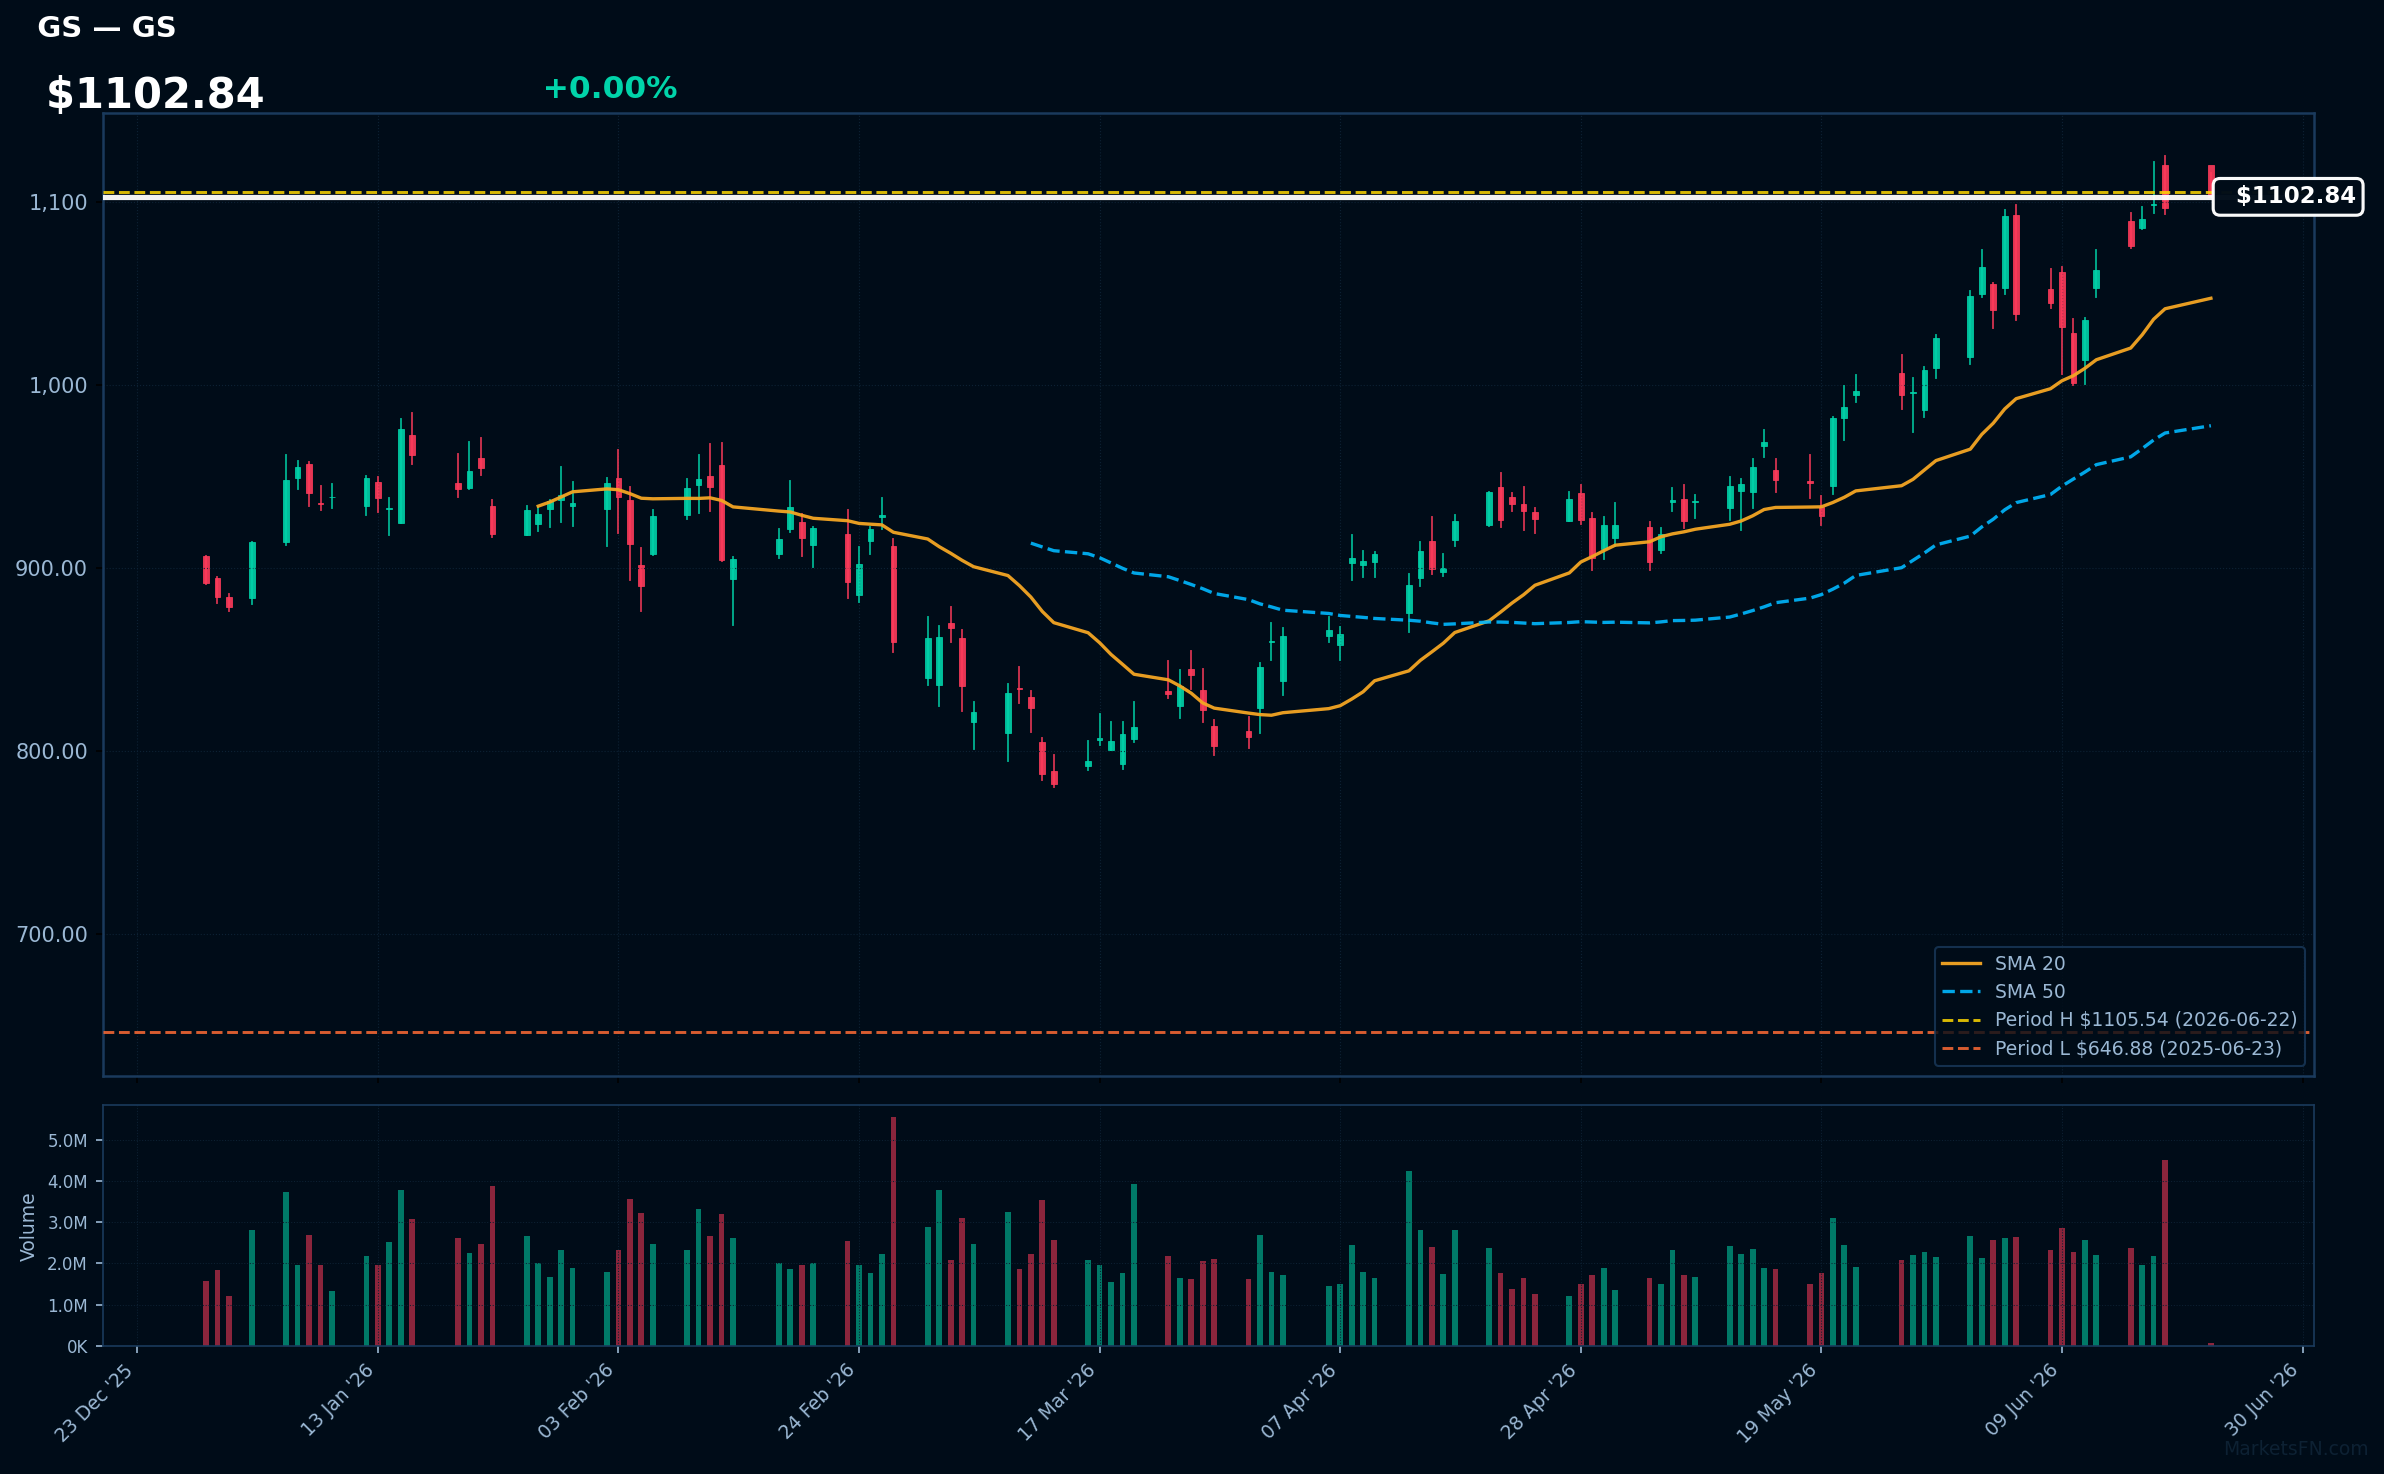
GS | Goldman Sachs Group, Inc | Financial | Price Last: $1105.54 | % Realized: +70.90% | RSI: 66.4 | % above MA200: +25.8% | Trend: Above MA20, MA50, MA200
Goldman Sachs Group, Inc is a global investment bank and financial services company, providing a wide range of financial services to corporations, governments, and high-net-worth individuals. Investors care about its performance as it reflects the overall health of global financial markets.
The stock is in a sustained uptrend with a bullish MA alignment: price ($1102.84) > MA20 > MA50 > MA200. RSI(14) is 66.4, nearing overbought territory. The stock is 0.0% below its 52-Week high, indicating potential breakout level, with a 70.9% return over the 52-Week period.
Related headlines
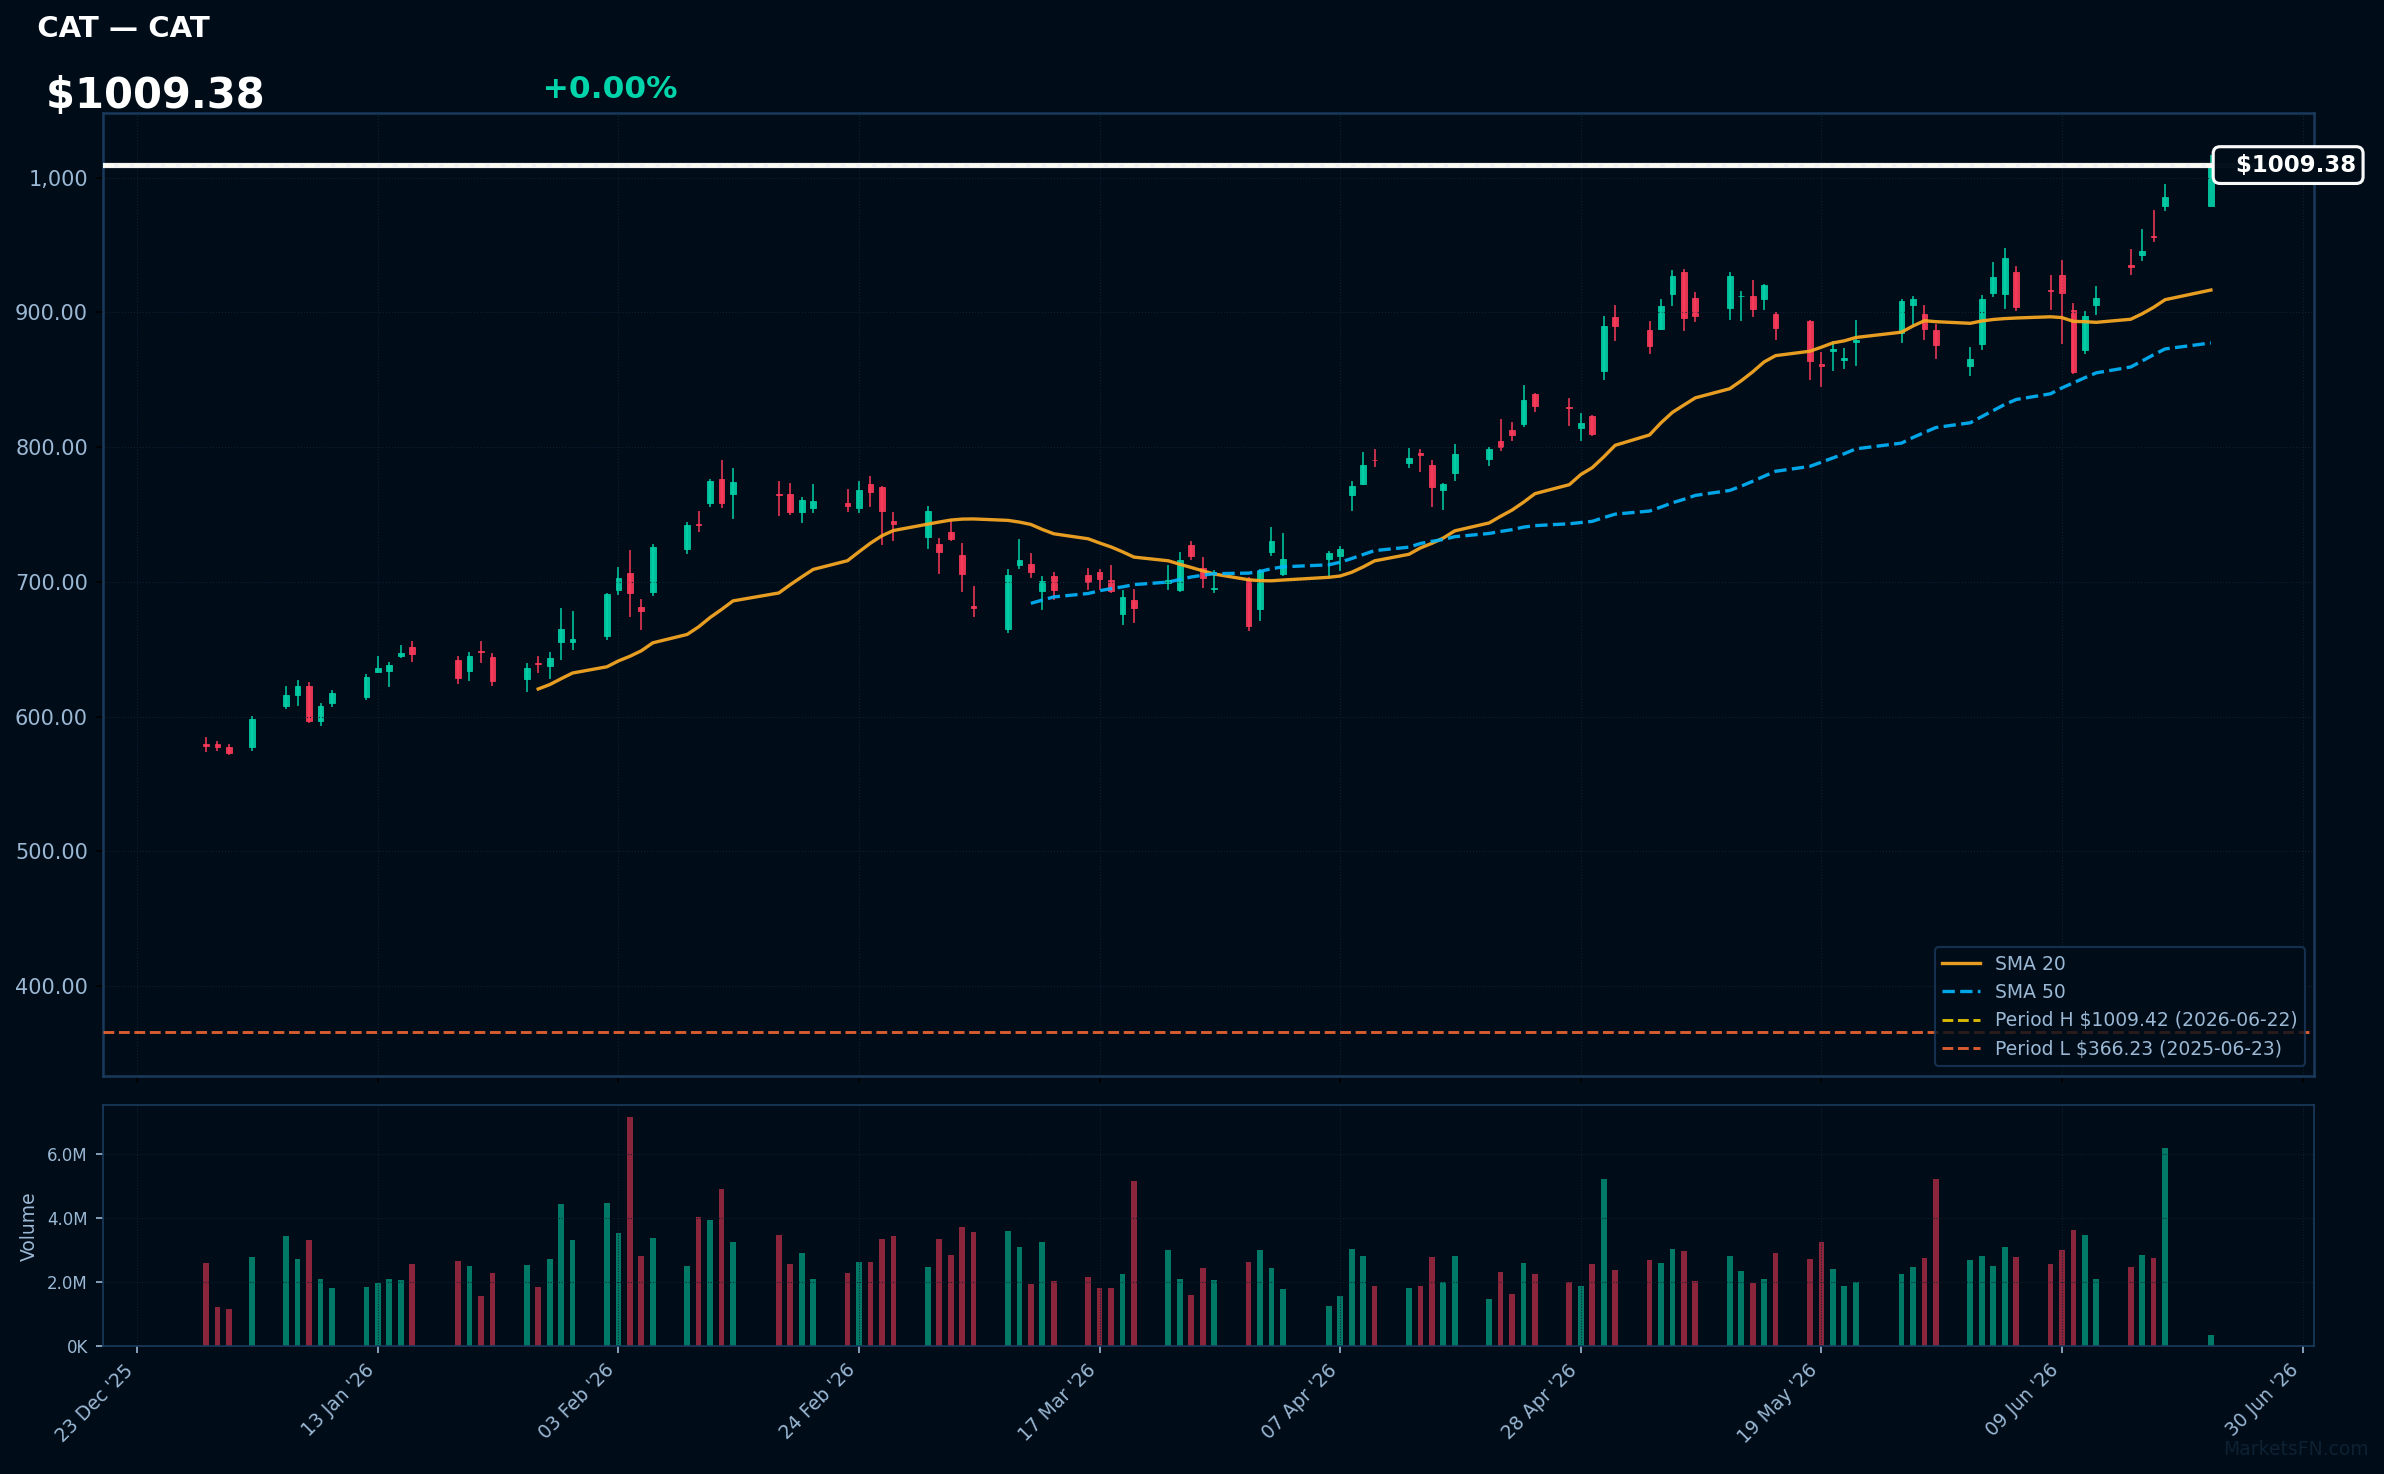
CAT | Caterpillar Inc | Industrials | Price Last: $1009.42 | % Realized: +175.62% | RSI: 68.3 | % above MA200: +49.9% | Trend: Above MA20, MA50, MA200
Caterpillar Inc is a leading manufacturer of heavy machinery used in construction, mining, and energy sectors. Investors should care because its performance is closely tied to global infrastructure spending and commodity prices, making it a key indicator of economic activity.
Caterpillar Inc is in a sustained uptrend with bullish MA alignment (price > MA20 > MA50 > MA200) and RSI(14) at 68.3, indicating strong momentum. The stock is 0.0% below its 52-Week high, near a potential breakout level, with a 175.6% return over the 52-Week period.
Related headlines
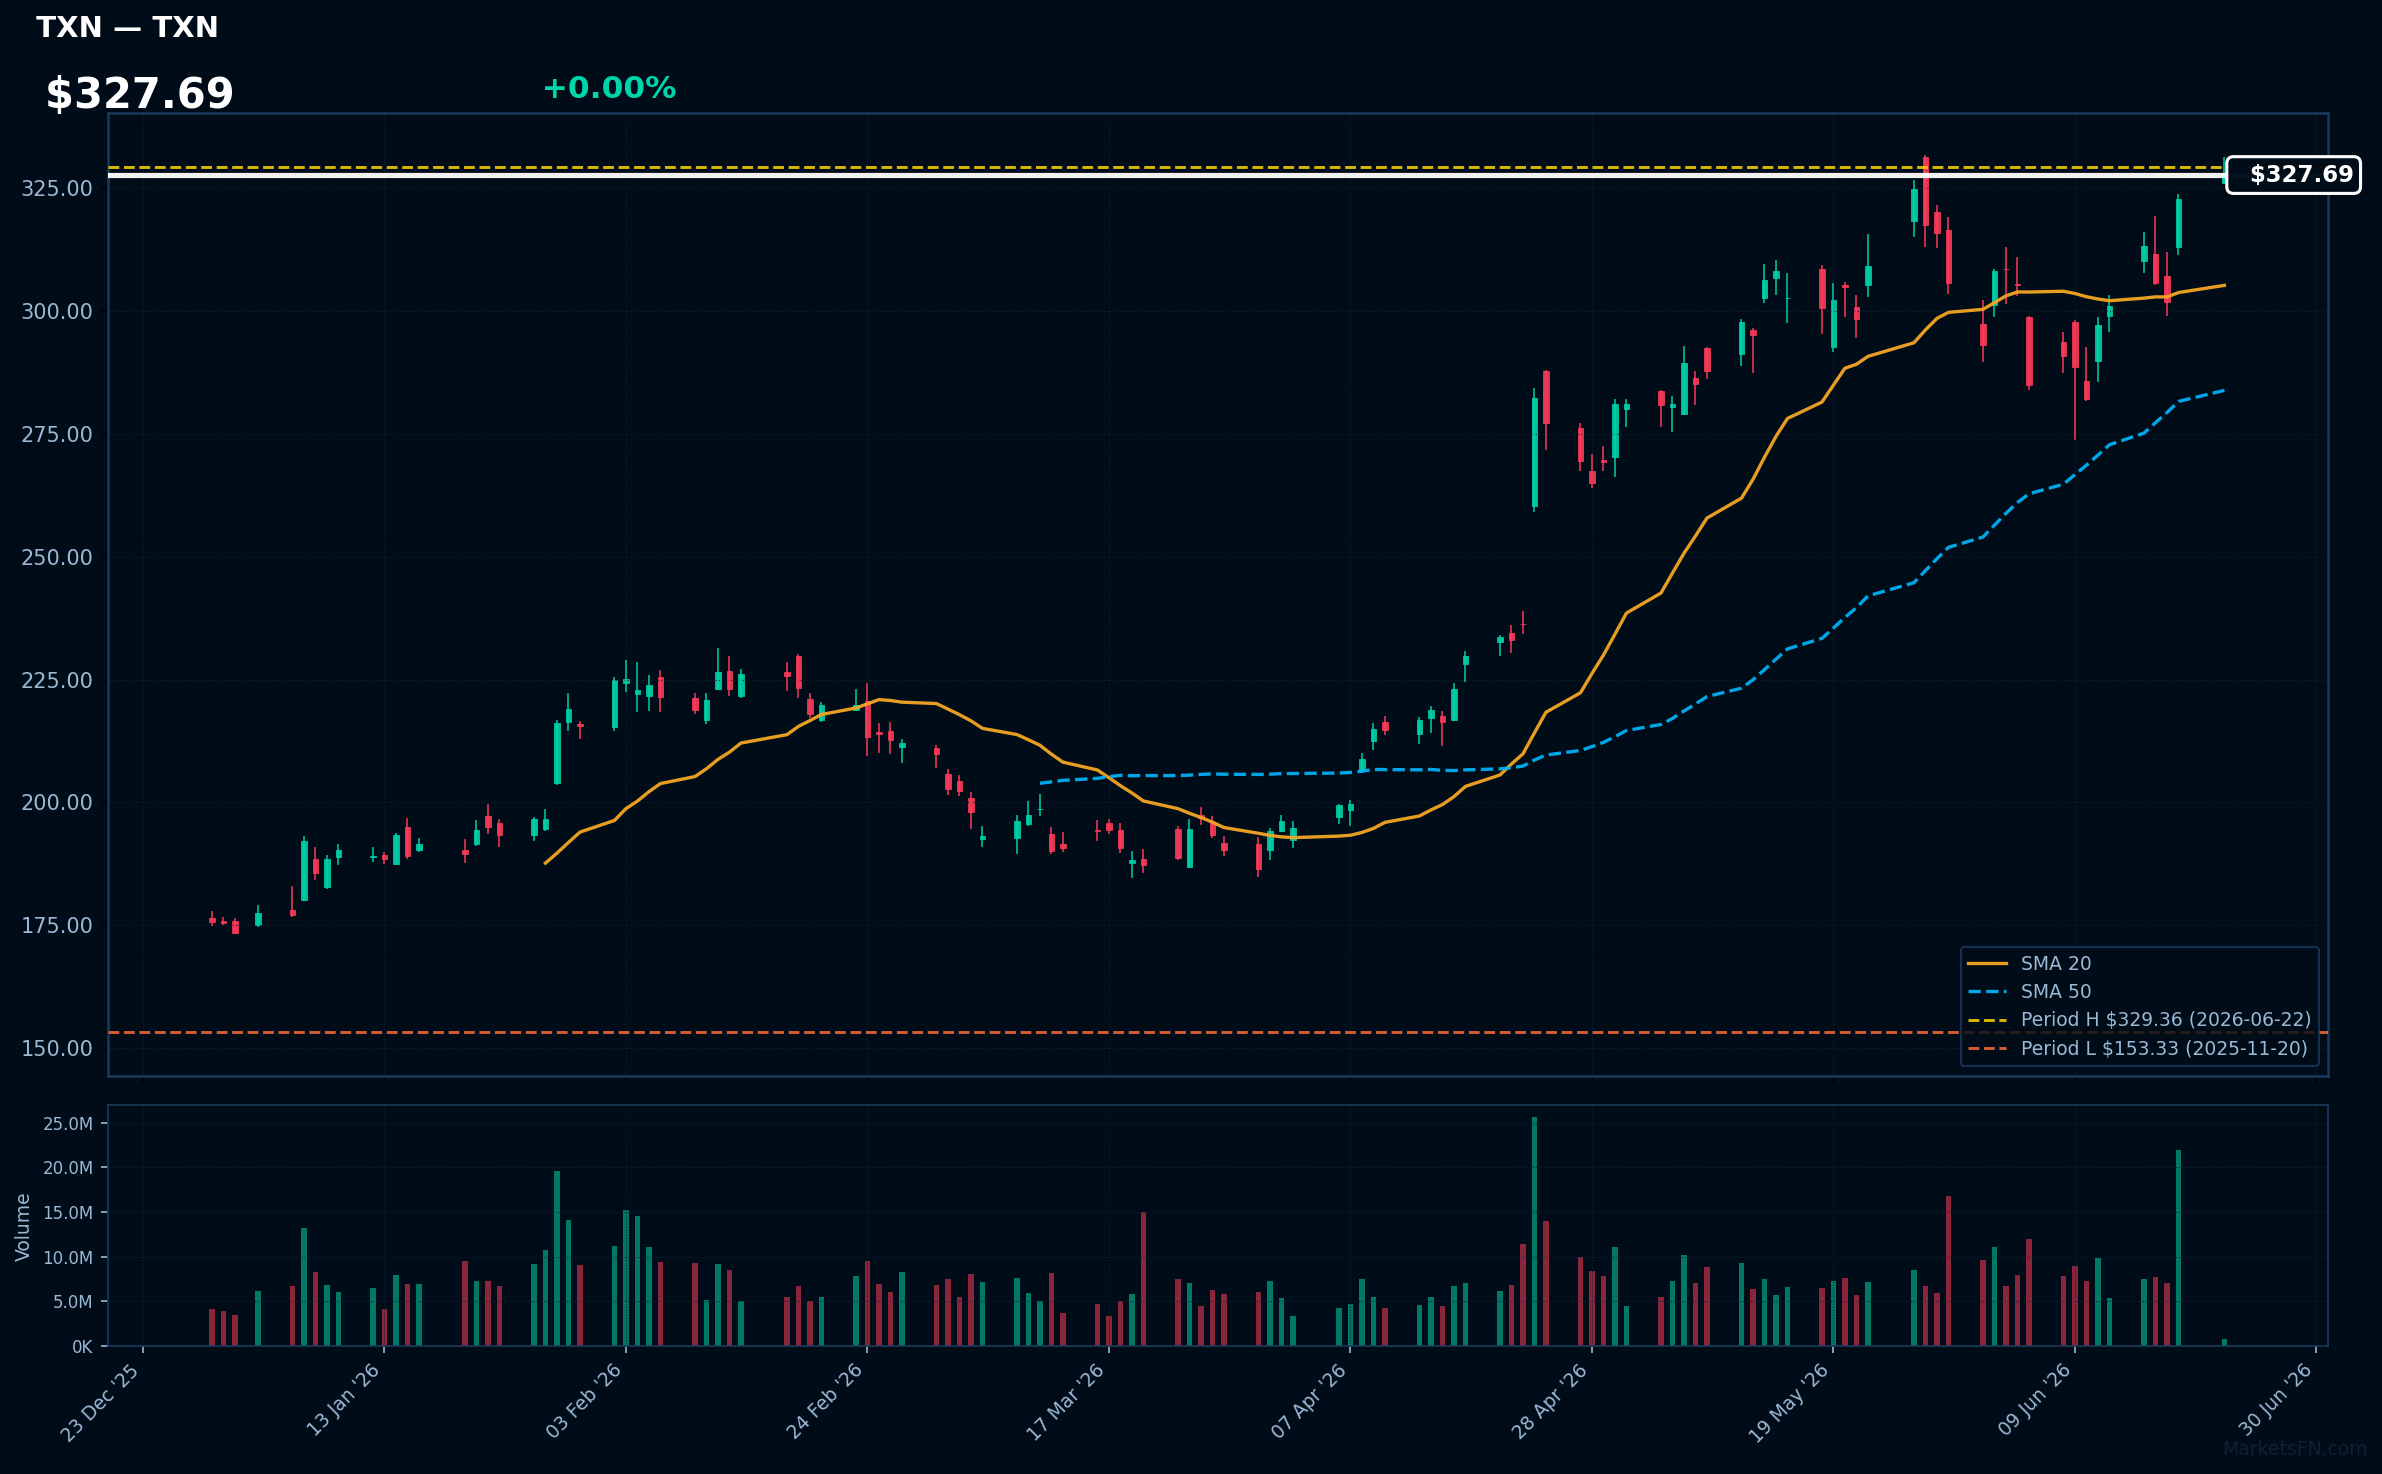
TXN | Texas Instruments Inc | Technology | Price Last: $329.36 | % Realized: +63.54% | RSI: 63.6 | % above MA200: +56.1% | Trend: Above MA20, MA50, MA200
Texas Instruments Inc designs and manufactures analog and embedded processing semiconductors for various applications, including automotive, industrial, and consumer electronics. Investors should care about its role in powering emerging tech and its exposure to diverse, high-growth markets.
The stock exhibits bullish MA alignment with price > MA20 > MA50 > MA200, RSI(14) at 63.6, and is 0.0% below its 52-Week high, indicating sustained uptrend and potential breakout momentum, not a warning sign.
Related headlines
📉 Nearest to 52-Week Low
Sectors represented: Technology (4), Healthcare (1)
| Ticker | Company | Sector | Price Last | % Realized | 52-Week Low Date | RSI | % above MA200 | Trend |
|---|---|---|---|---|---|---|---|---|
| PLTR | Palantir Technologies Inc | Technology | $127.36 | -8.98% | 2026-06-22 | 40.3 | -20.3% | Below MA20, MA50, MA200 |
| CRM | Salesforce Inc | Technology | $151.10 | -42.64% | 2026-06-22 | 30.3 | -30.0% | Below MA20, MA50, MA200 |
| INTU | Intuit Inc | Technology | $262.98 | -65.51% | 2026-06-22 | 30.3 | -49.6% | Below MA20, MA50, MA200 |
| BSX | Boston Scientific Corp | Healthcare | $44.58 | -56.45% | 2026-06-22 | 25.9 | -44.9% | Below MA20, MA50, MA200 |
| ACN | Accenture plc | Technology | $123.95 | -57.98% | 2026-06-22 | 19.7 | -45.0% | Below MA20, MA50, MA200 |
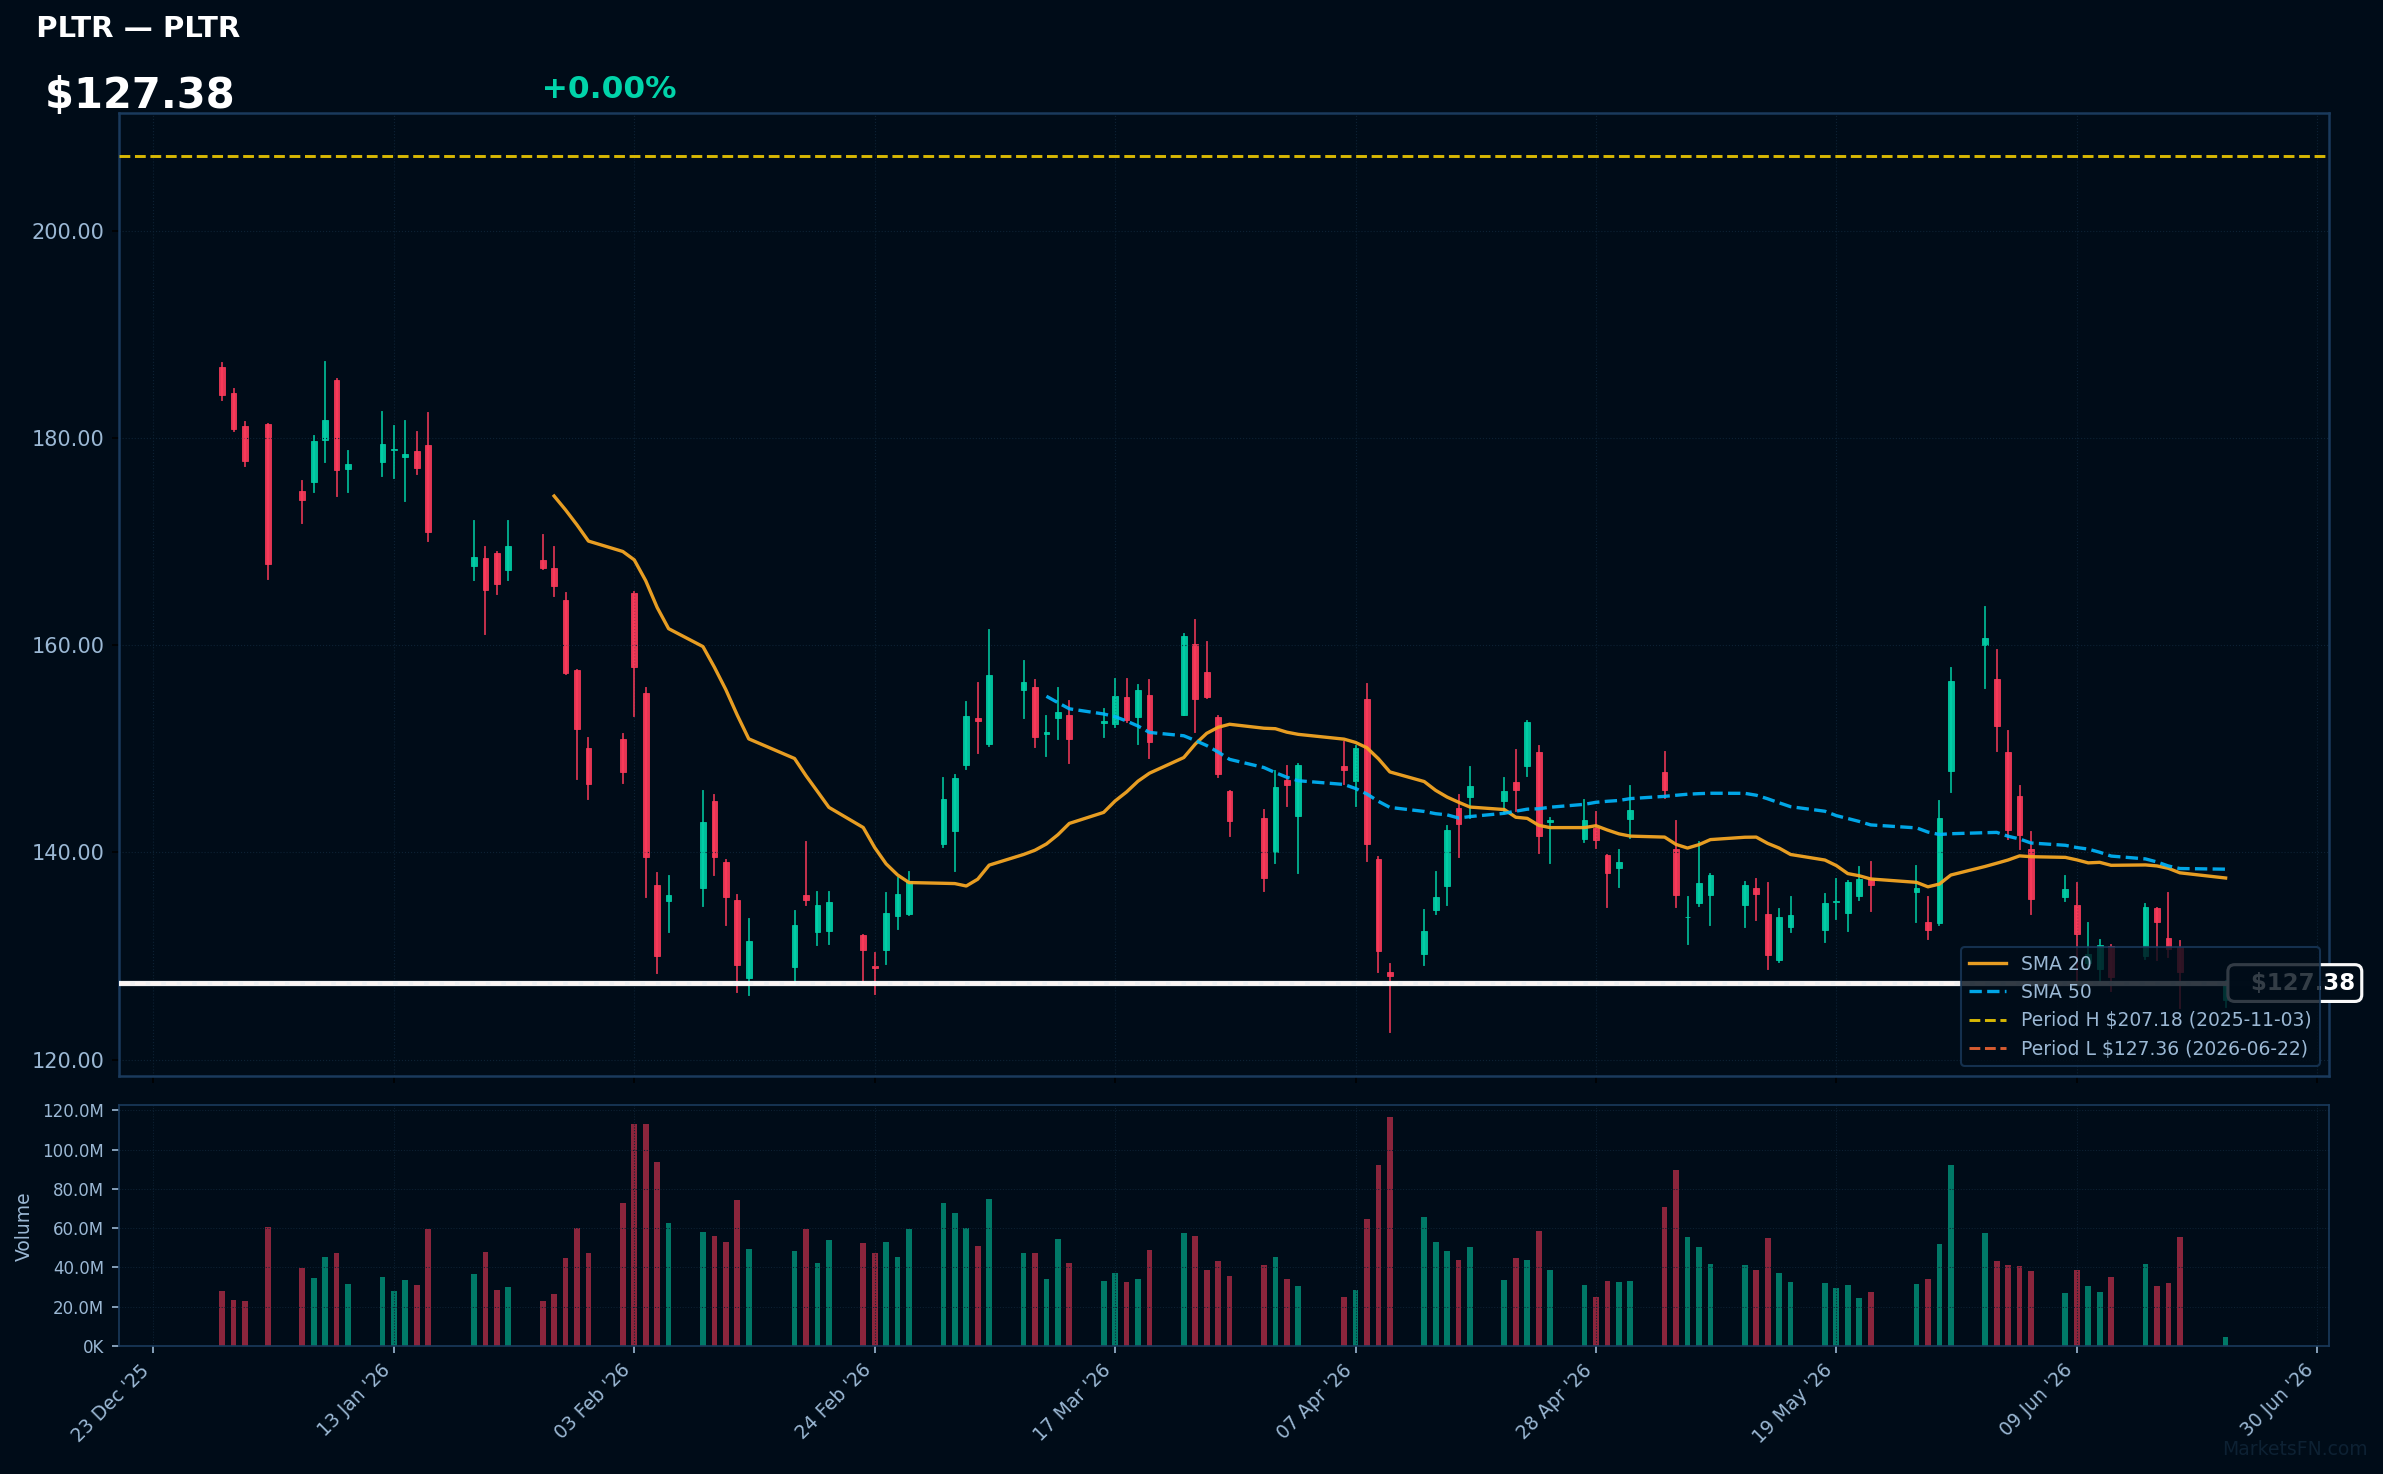
PLTR | Palantir Technologies Inc | Technology | Price Last: $127.36 | % Realized: -8.98% | RSI: 40.3 | % above MA200: -20.3% | Trend: Below MA20, MA50, MA200
Palantir Technologies Inc provides data integration and analytics software to governments and corporations, enabling them to make data-driven decisions. Investors should care because its software is used in critical applications such as defense, finance, and healthcare.
PLTR is in a sustained downtrend with price ($127.38) below MA20, MA50, and MA200. RSI(14) is 40.3, nearing oversold territory. The stock is testing major support at its 52-Week low, having returned -9.0% over the 52-Week period, indicating potential further downside.
Related headlines
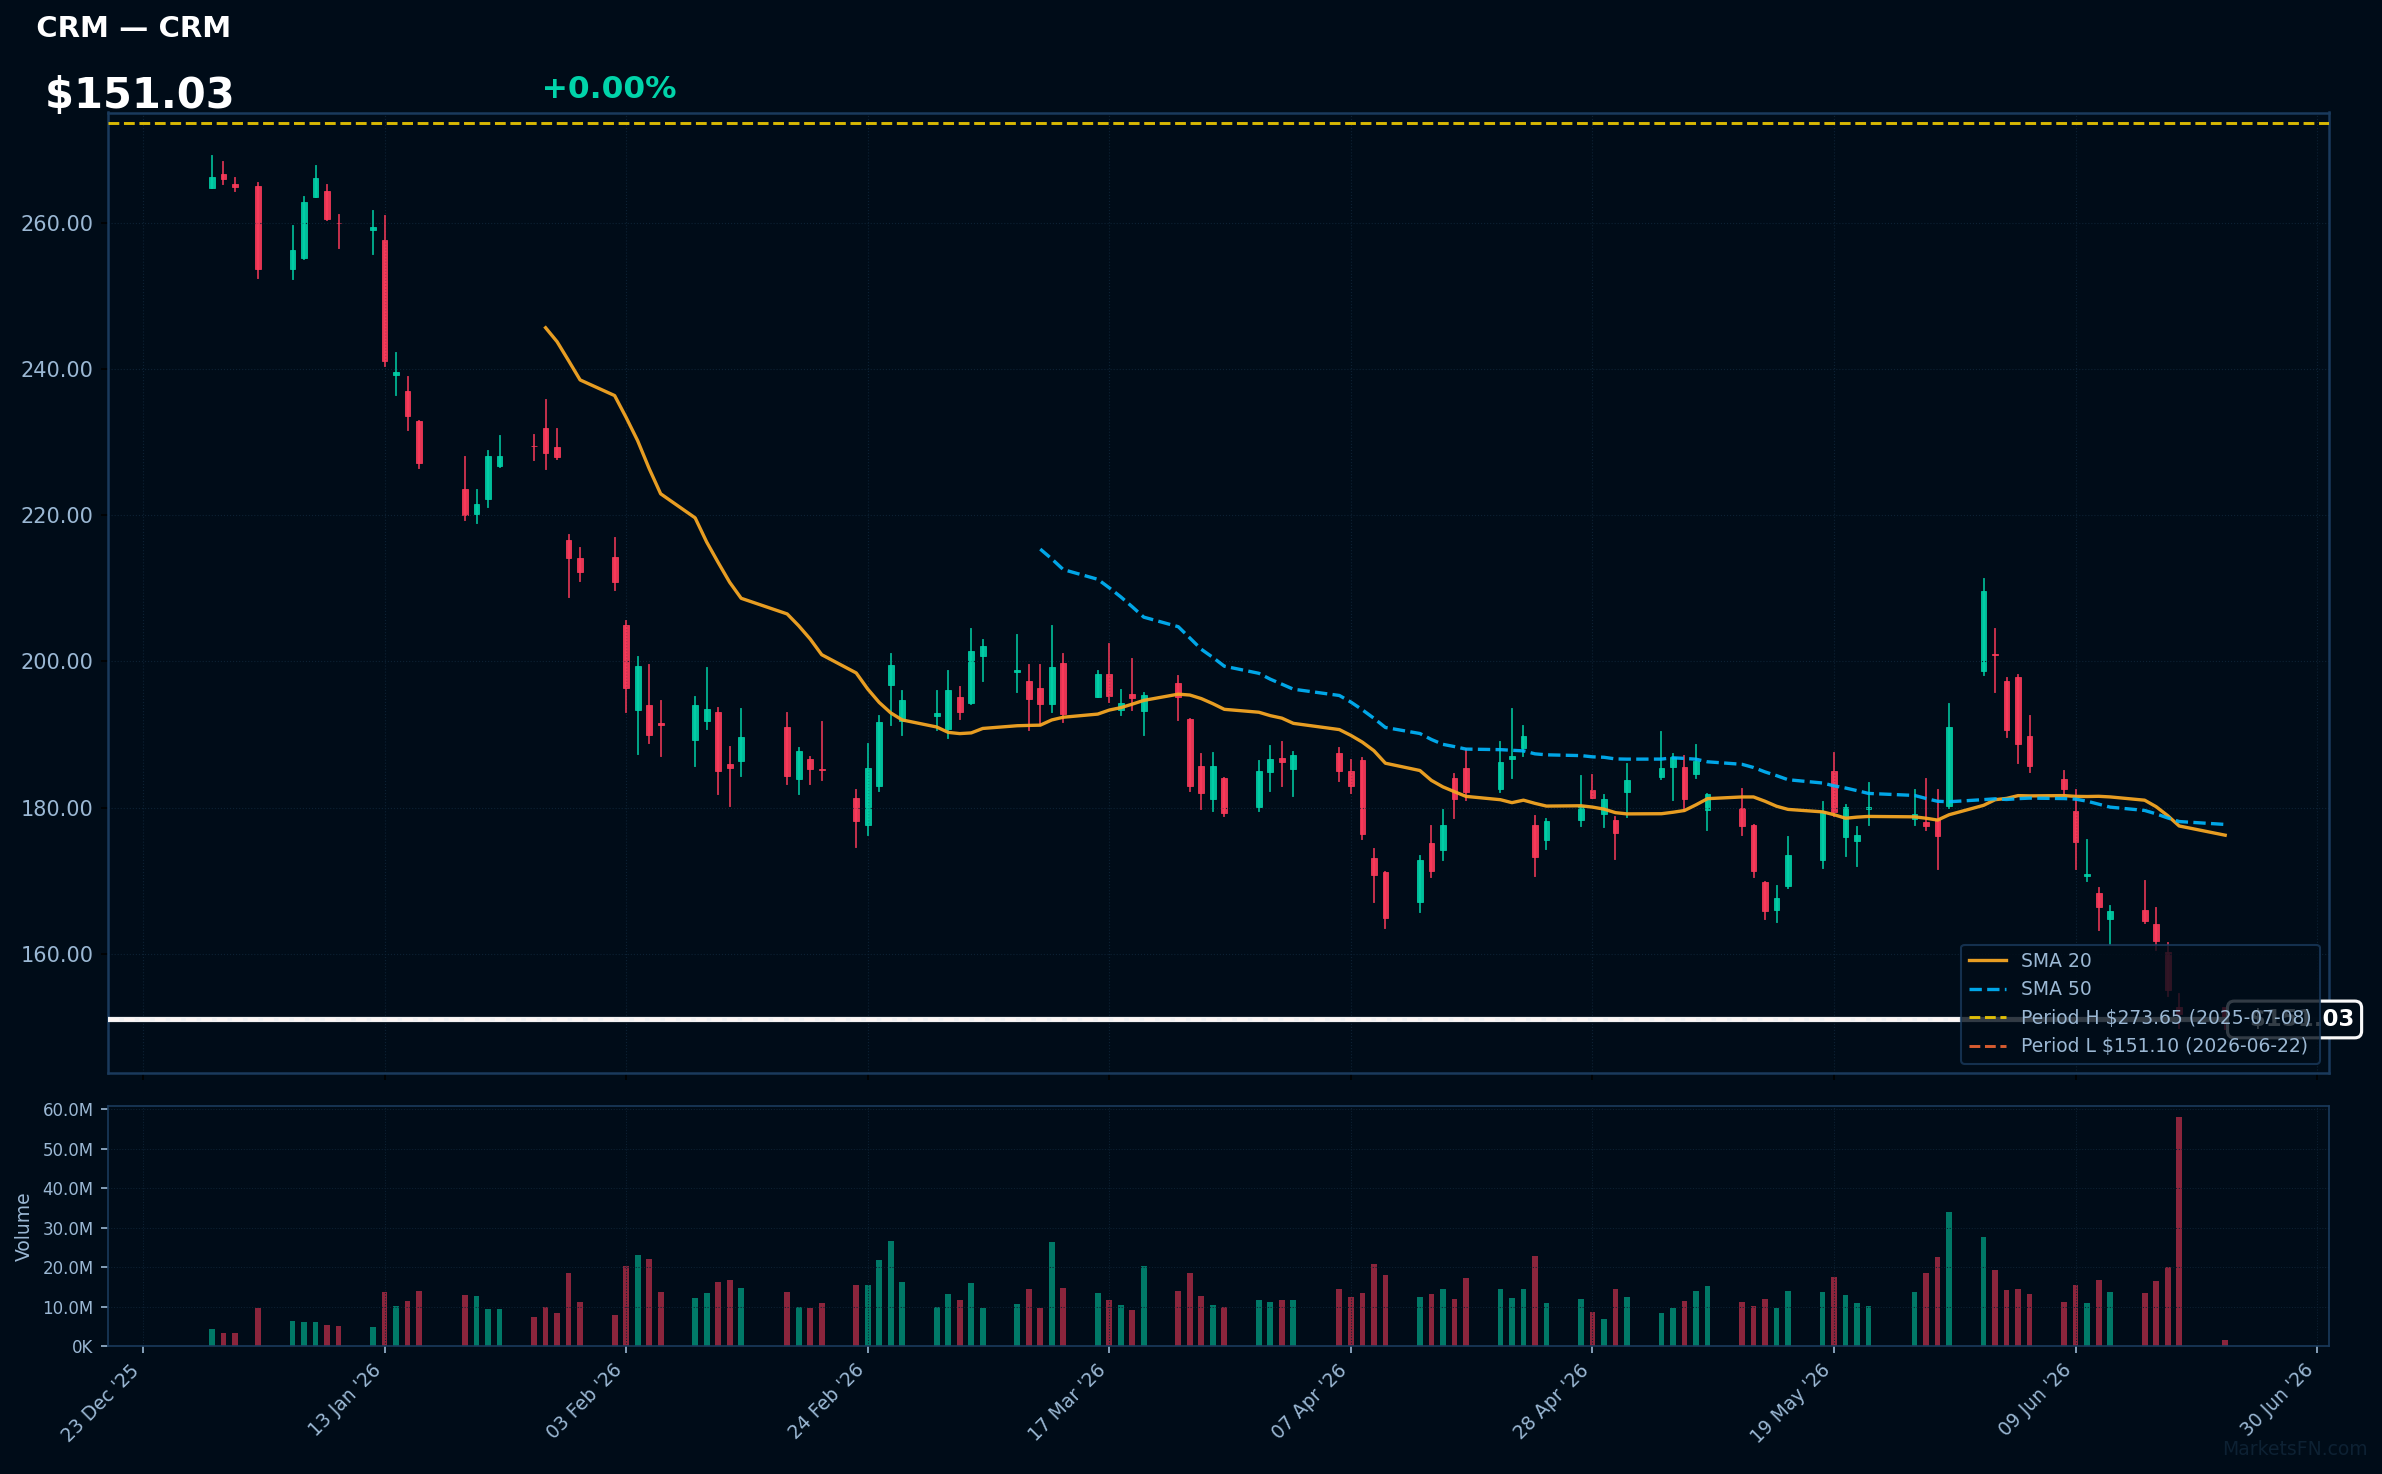
CRM | Salesforce Inc | Technology | Price Last: $151.10 | % Realized: -42.64% | RSI: 30.3 | % above MA200: -30.0% | Trend: Below MA20, MA50, MA200
Salesforce Inc (CRM) is a customer relationship management (CRM) platform provider, enabling businesses to manage sales, marketing, and customer service. Investors care about its cloud-based software growth and market dominance.
Salesforce is testing major support at its 52-Week low with RSI(14) at 30.3, indicating oversold conditions. Bearish MA alignment (price < MA20 < MA50 < MA200) suggests a sustained downtrend, warning of further potential decline.
Related headlines
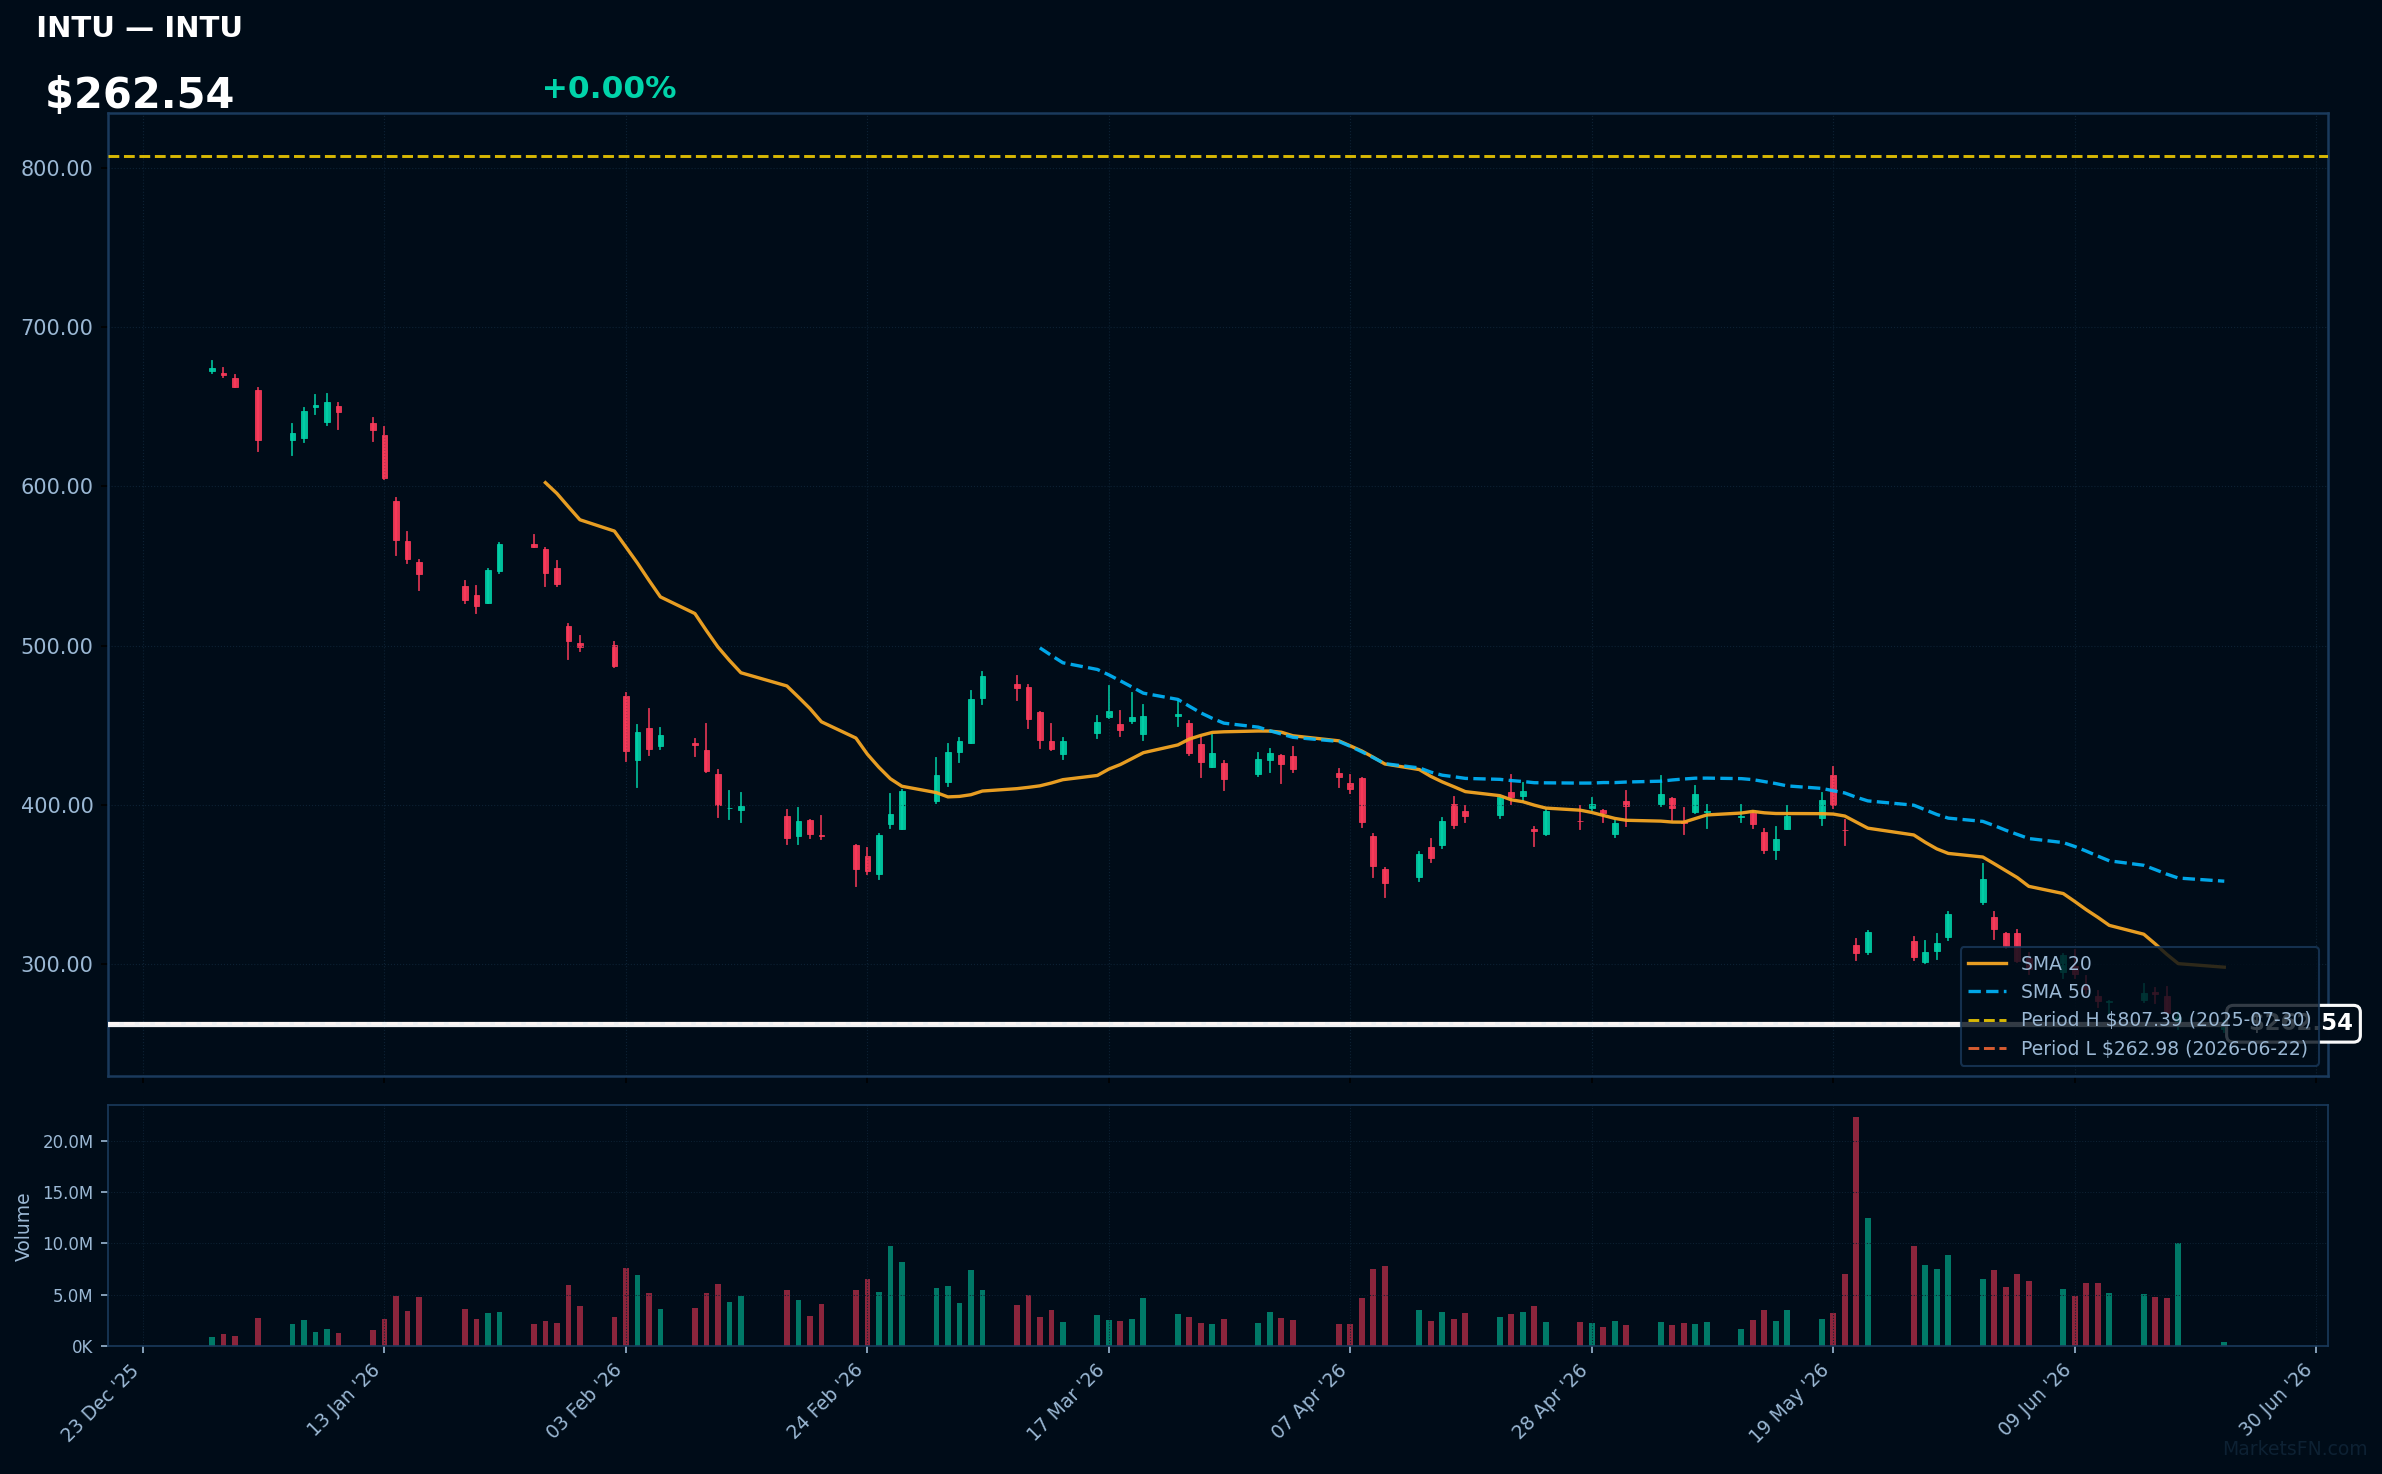
INTU | Intuit Inc | Technology | Price Last: $262.98 | % Realized: -65.51% | RSI: 30.3 | % above MA200: -49.6% | Trend: Below MA20, MA50, MA200
Intuit Inc (INTU) provides financial management solutions, including QuickBooks for small businesses and TurboTax for individual tax preparation, making it a key player in the financial software space with significant exposure to the tax and accounting industries.
INTU's technicals indicate a sustained downtrend with price ($262.54) below MA20, MA50, and MA200. RSI(14) at 30.3 suggests oversold conditions, and being 0.0% above its 52-Week low signals testing major support, potentially a warning sign.
Related headlines
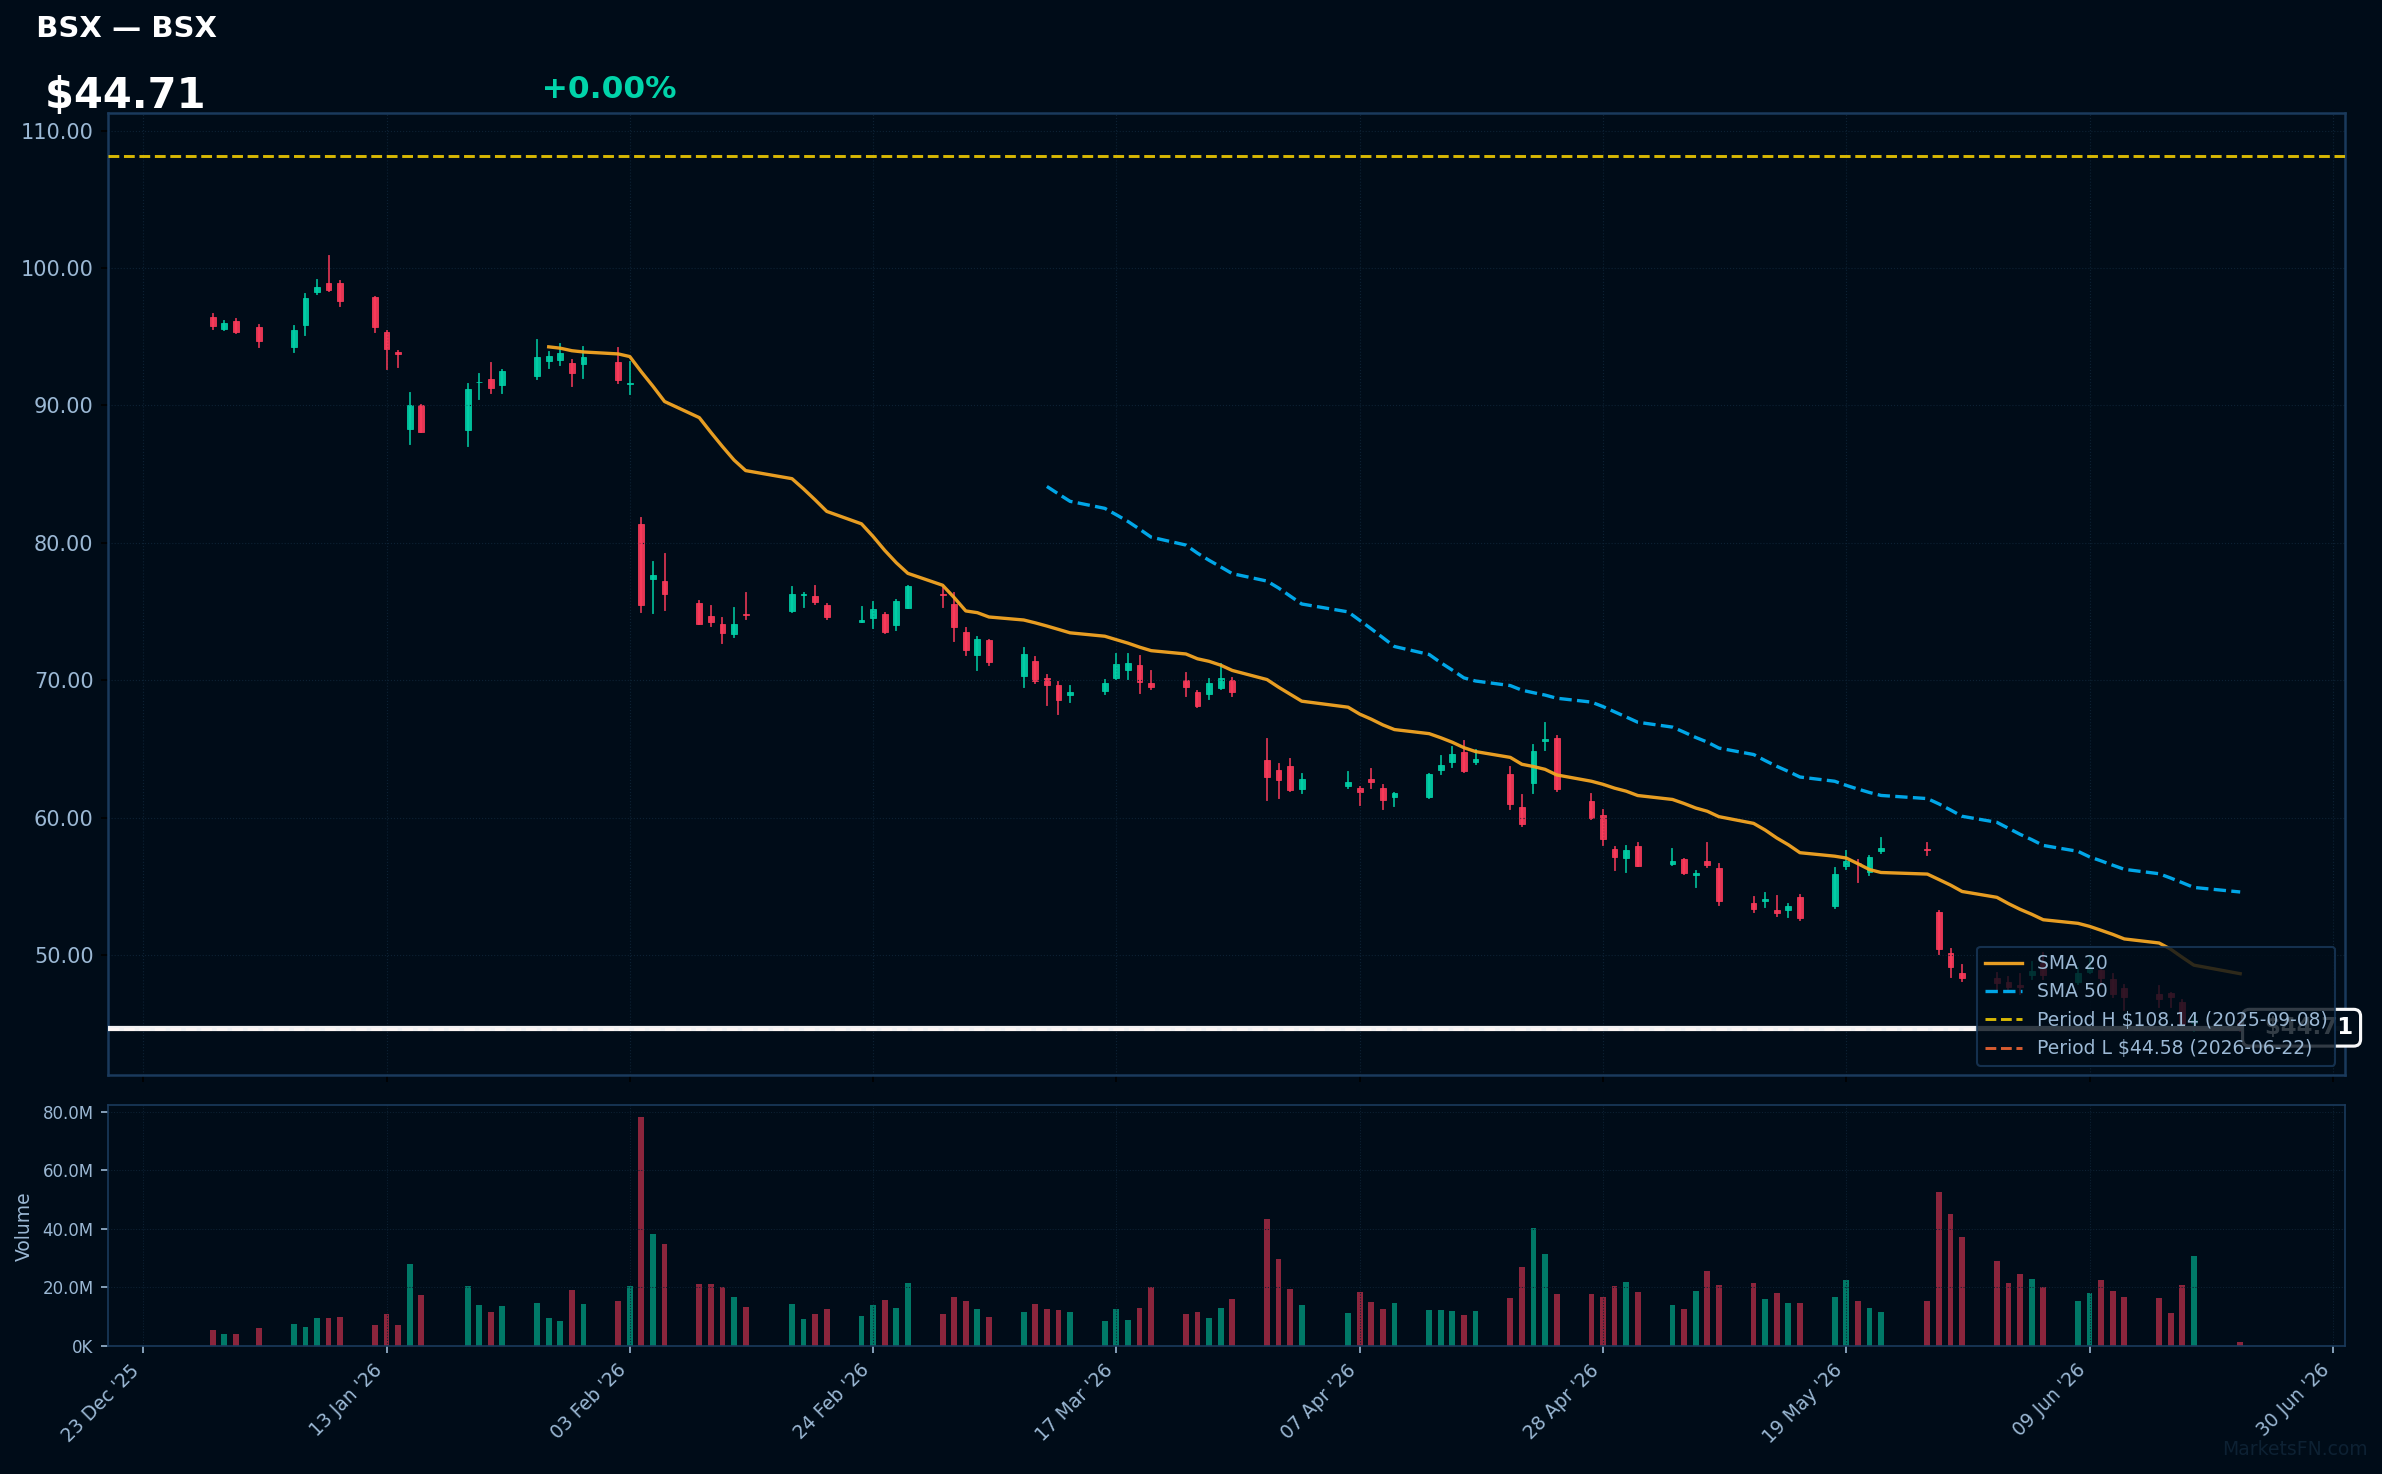
BSX | Boston Scientific Corp | Healthcare | Price Last: $44.58 | % Realized: -56.45% | RSI: 25.9 | % above MA200: -44.9% | Trend: Below MA20, MA50, MA200
Boston Scientific Corp develops and manufactures medical devices, including cardiovascular and neuromodulation products. Investors should care about its innovation pipeline and market share in the medical device industry, which drives revenue growth.
The stock is in a sustained downtrend with RSI(14) at 25.9, indicating oversold conditions. MA alignment is bearish (price < MA20 < MA50 < MA200) and is testing major support at its 52-Week low, a warning sign.
Related headlines
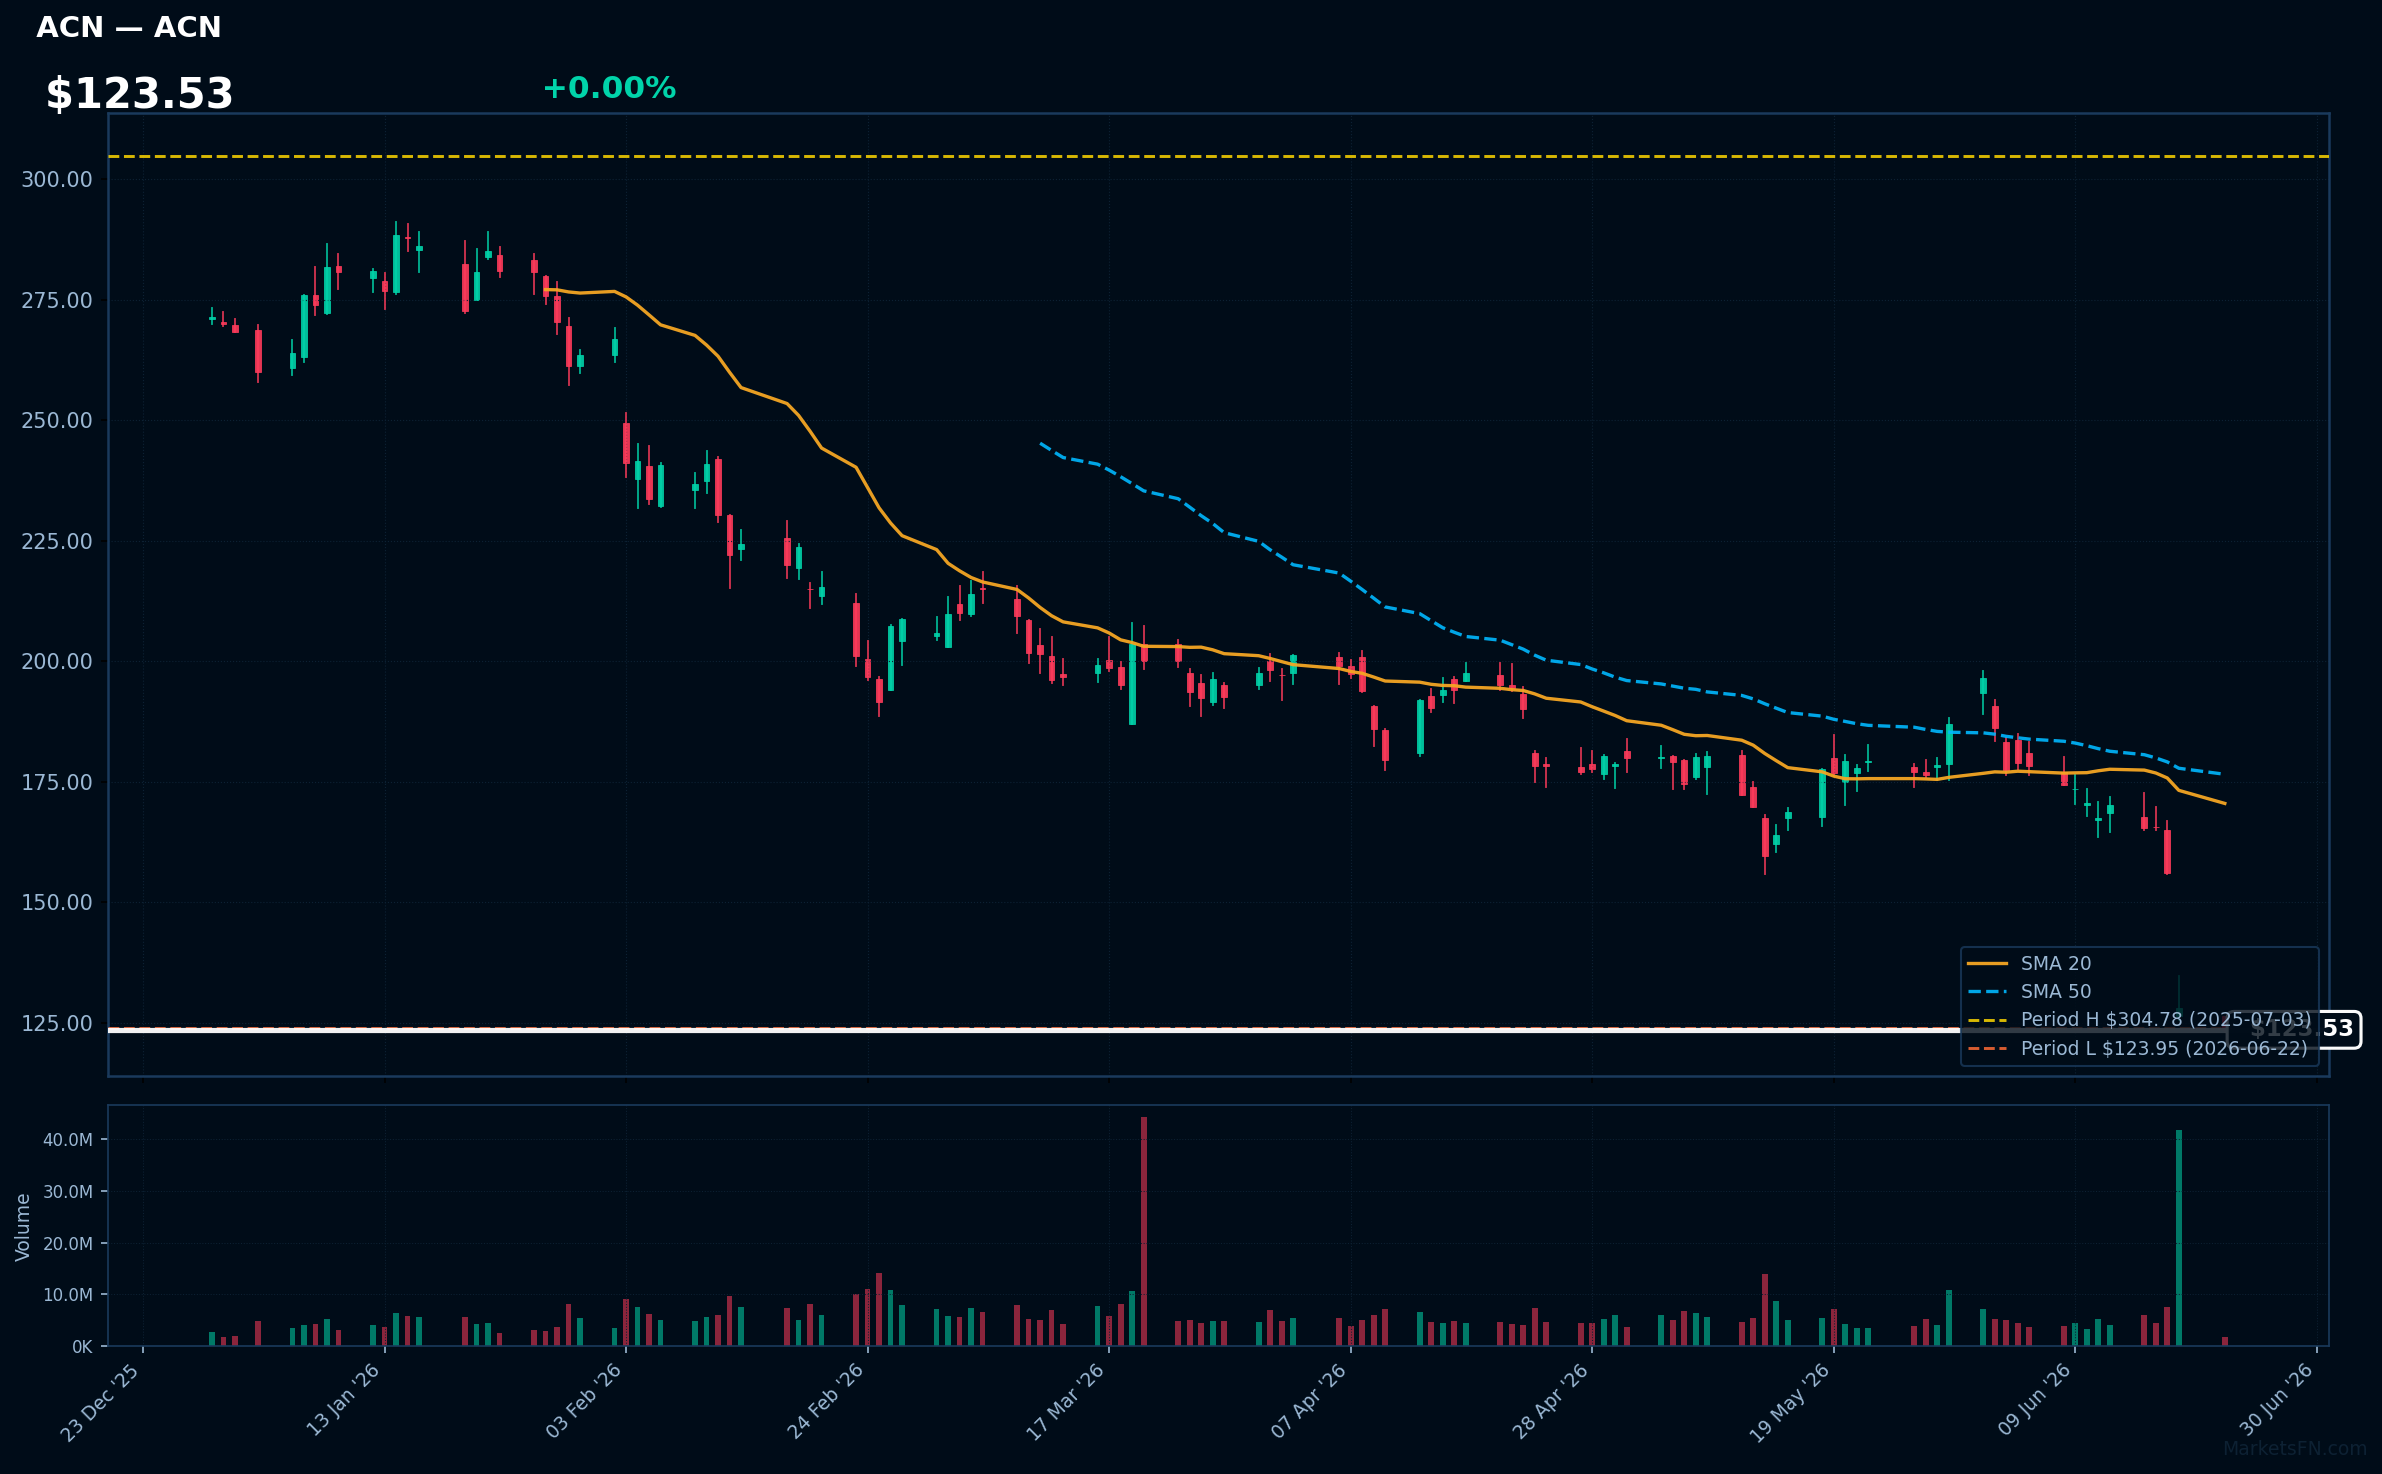
ACN | Accenture plc | Technology | Price Last: $123.95 | % Realized: -57.98% | RSI: 19.7 | % above MA200: -45.0% | Trend: Below MA20, MA50, MA200
Accenture plc is a global professional services company providing strategy, consulting, digital, technology, and operations services. Investors should care about its ability to drive digital transformation and its consulting capabilities, which are key to its revenue growth.
Accenture plc is in a sustained downtrend with price ($123.53) below MA20, MA50, and MA200. The RSI(14) is 19.7, indicating oversold conditions. The stock is at its 52-Week low, having fallen 58.0% over the period, signaling a potential warning sign.
Related headlines
- Accenture downgraded by TD Cowen on AI concerns
- INFRONEER Teams with Accenture to Build New Financial Data and Insights Platform to Advance its Group Management Capabilities in Just Three Months
- Accenture to acquire Dragos, runZero and NetRise for $4.2bn
- Accenture Plummets as Forecast Highlights Pressure on Consultants
Market Commentary
The S&P 500 stocks listed are currently trading near their 52-week extremes, with GE, MS, GS, CAT, and TXN at their 52-week highs and PLTR, CRM, INTU, BSX, and ACN at their 52-week lows. This indicates a significant shift in market sentiment, with the former group potentially driven by strong earnings or positive market trends, while the latter may be experiencing challenges or negative sentiment.
The stocks at 52-week highs are primarily from the financial and industrials sectors, suggesting a potential rotation into these areas. The presence of TXN, a semiconductor stock, also indicates strength in the technology sector. Conversely, the stocks at 52-week lows are from the technology and healthcare sectors, potentially signaling challenges in these areas. Macro themes such as interest rates, economic growth, and industry trends may be driving these price levels.
Key levels to watch include the current prices of these stocks, as a break above or below their 52-week extremes could signal further momentum. Potential catalysts include earnings reports, industry trends, and macroeconomic data releases, which could impact the trajectory of these stocks and the broader market.
Methodology: All 503 S&P 500 constituents screened. 52-week high = highest daily close over the past 252 trading days (approx. 1 year). 52-week low = lowest daily close over the same period. Distance = (current price / extreme − 1) × 100. Technical indicators computed on up to 1 year of daily OHLCV data.
Disclaimer: For informational purposes only. Not investment advice. Past performance is not indicative of future results.