S&P 500 52-Week Highs & Lows Radar: Berkshire Hathaway (BRK-B), Crown Castle (CCI) and more
MarketsFN Team

S&P 500 52-Week Highs & Lows Radar: Berkshire Hathaway (BRK-B), Crown Castle (CCI) and more
Screening all 503 S&P 500 constituents for stocks nearest to their 52-week high and their 52-week low. Data as of August 06, 2026. % Realized = 52-week total return.
Legend: RSI > 70 = overbought · RSI < 30 = oversold · Green % Realized = positive 52W return · Red = negative.
📈 Nearest to 52-Week High
Sectors represented: Financial (3), Industrials (2)
| Ticker | Company | Sector | Price Last | % Realized | 52-Week High Date | RSI | % above MA200 | Trend |
|---|---|---|---|---|---|---|---|---|
| BRK-B | Berkshire Hathaway Inc | Financial | $518.85 | +10.65% | 2026-08-05 | 71.1 | +5.7% | Above MA20, MA50, MA200 |
| JPM | JPMorgan Chase & Co | Financial | $359.24 | +23.30% | 2026-08-05 | 65.8 | +14.9% | Above MA20, MA50, MA200 |
| BAC | Bank Of America Corp | Financial | $63.25 | +39.26% | 2026-08-05 | 68.0 | +17.7% | Above MA20, MA50, MA200 |
| GE | GE Aerospace | Industrials | $381.22 | +40.01% | 2026-08-05 | 66.3 | +20.6% | Above MA20, MA50, MA200 |
| RTX | RTX Corp | Industrials | $222.31 | +42.74% | 2026-08-05 | 75.8 | +17.8% | Above MA20, MA50, MA200 |
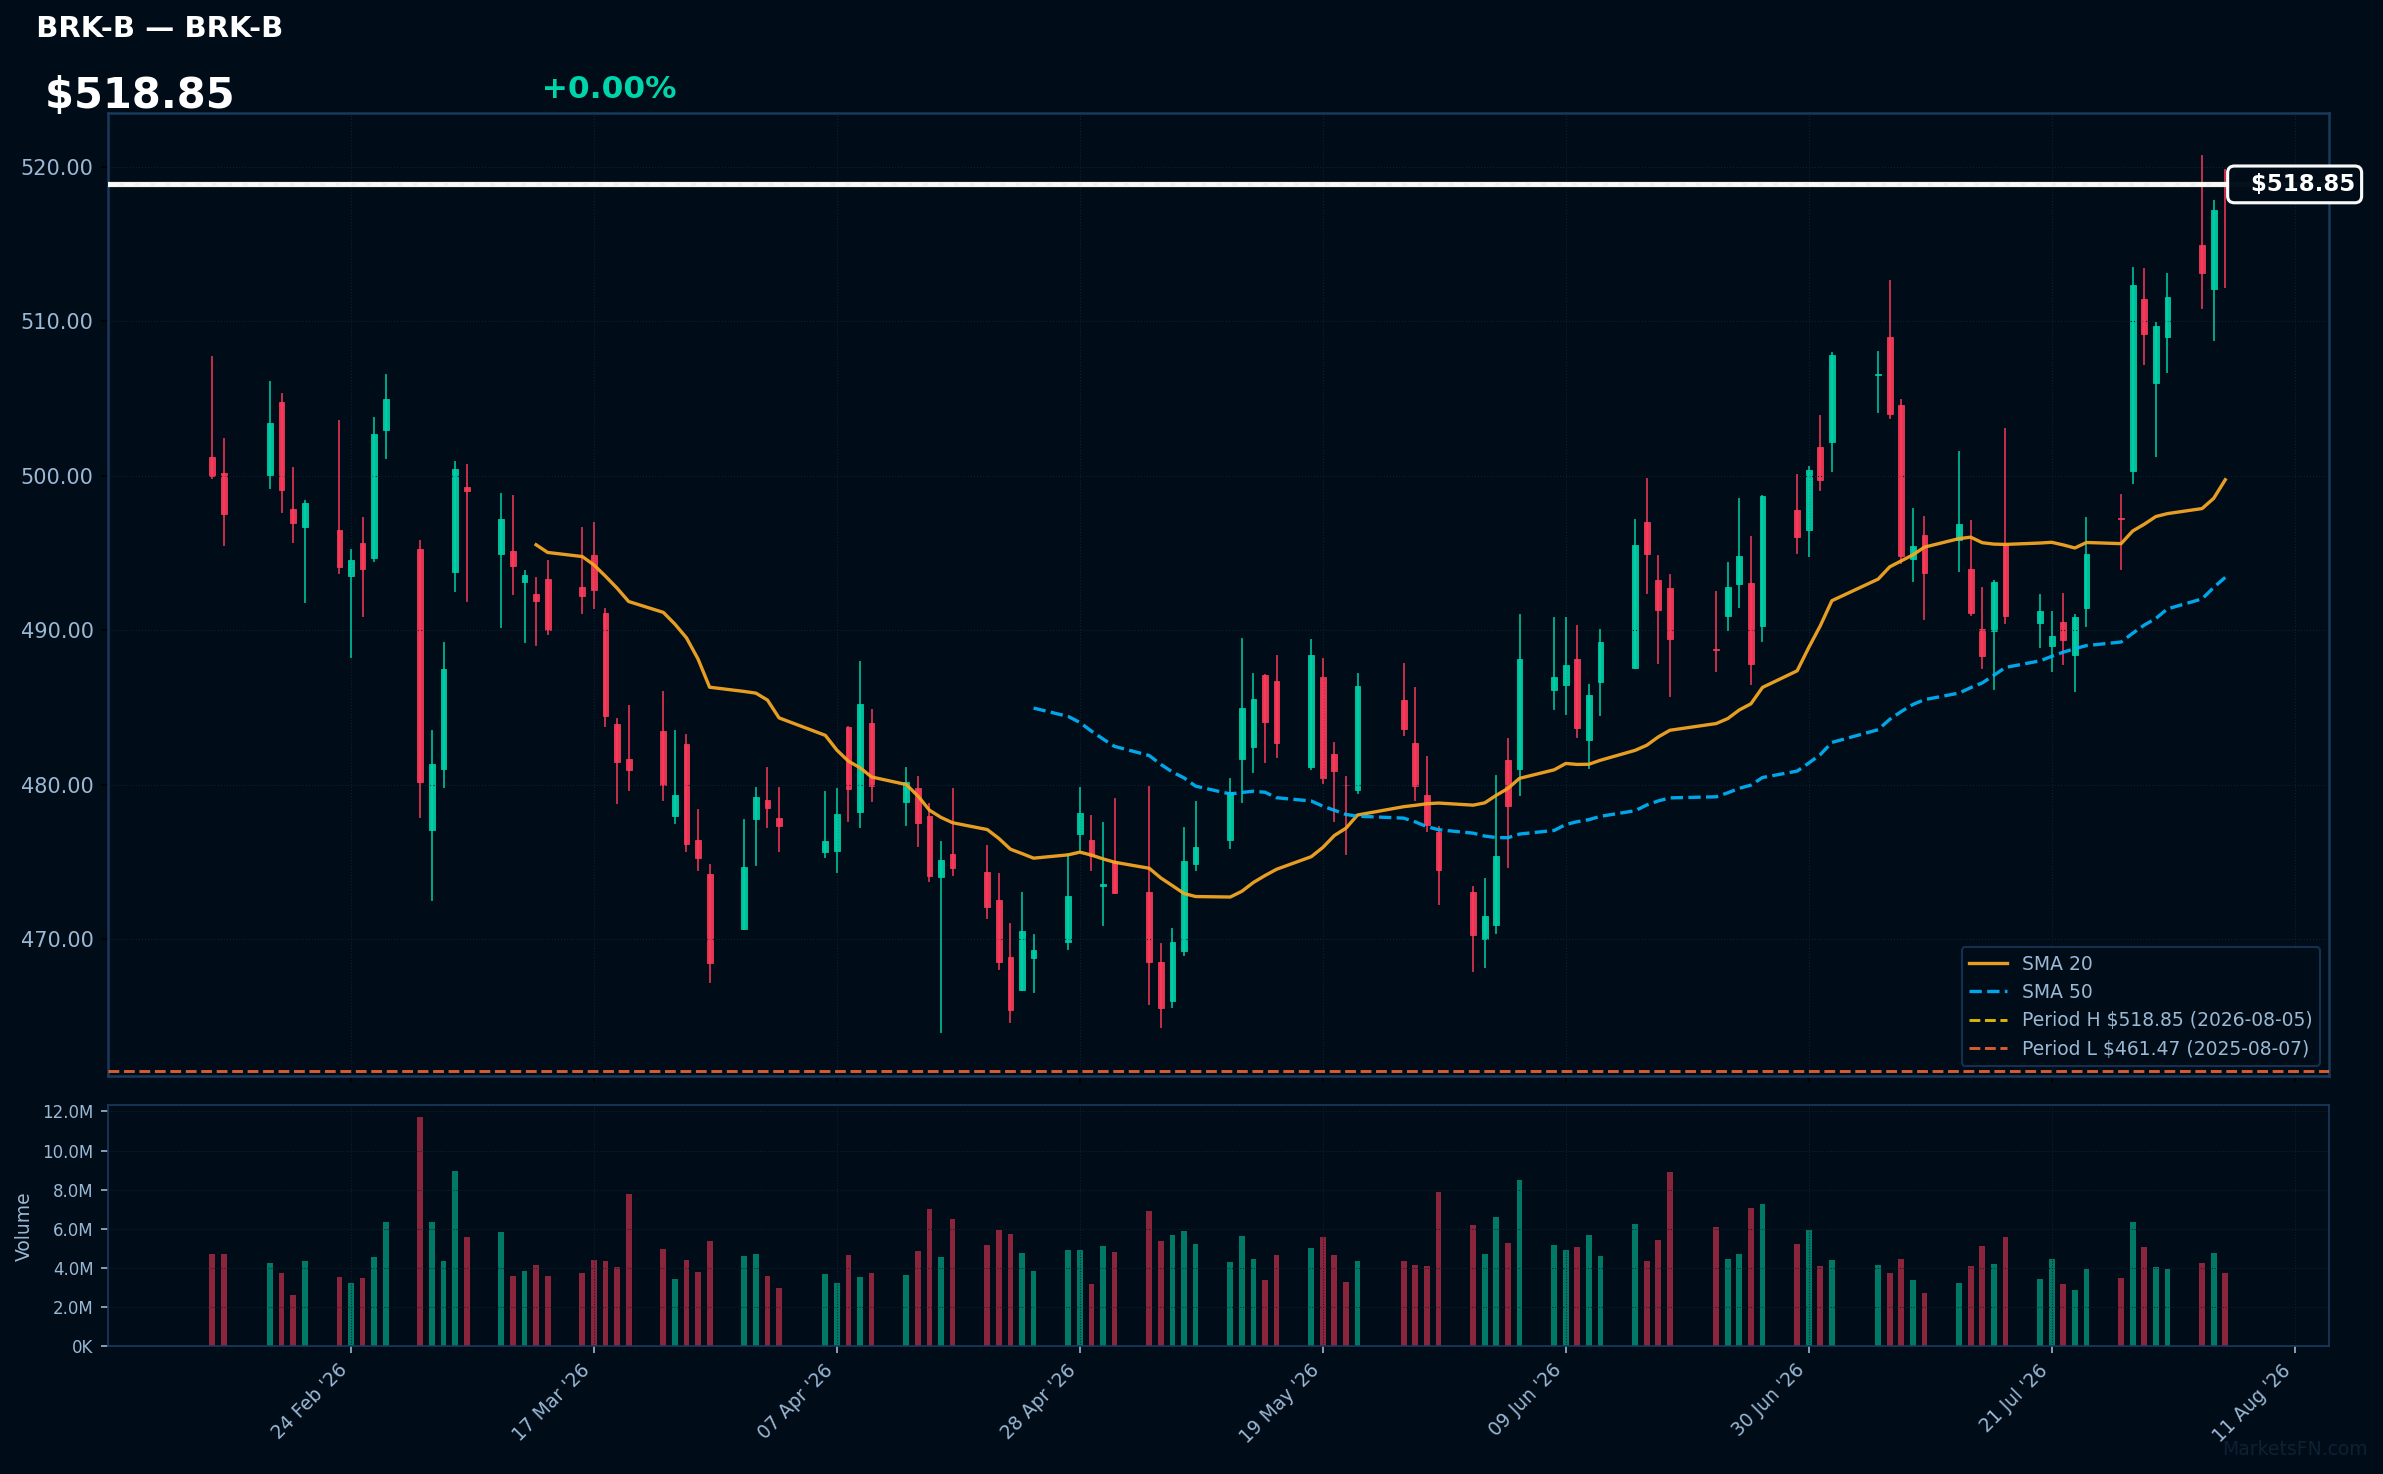
BRK-B | Berkshire Hathaway Inc | Financial | Price Last: $518.85 | % Realized: +10.65% | RSI: 71.1 | % above MA200: +5.7% | Trend: Above MA20, MA50, MA200
Berkshire Hathaway Inc. is a diversified holding company with investments in various sectors, including insurance, utilities, and consumer goods. Investors should care due to its strong management, consistent performance, and ability to generate significant cash flow, making it a reliable long-term investment.
The current technical situation shows bullish momentum, with an RSI(14) of 71.1 and a bullish MA alignment: price > MA20 > MA50 > MA200. The stock is also 0.0% below its 52-Week high, indicating a potential breakout level.
Related headlines
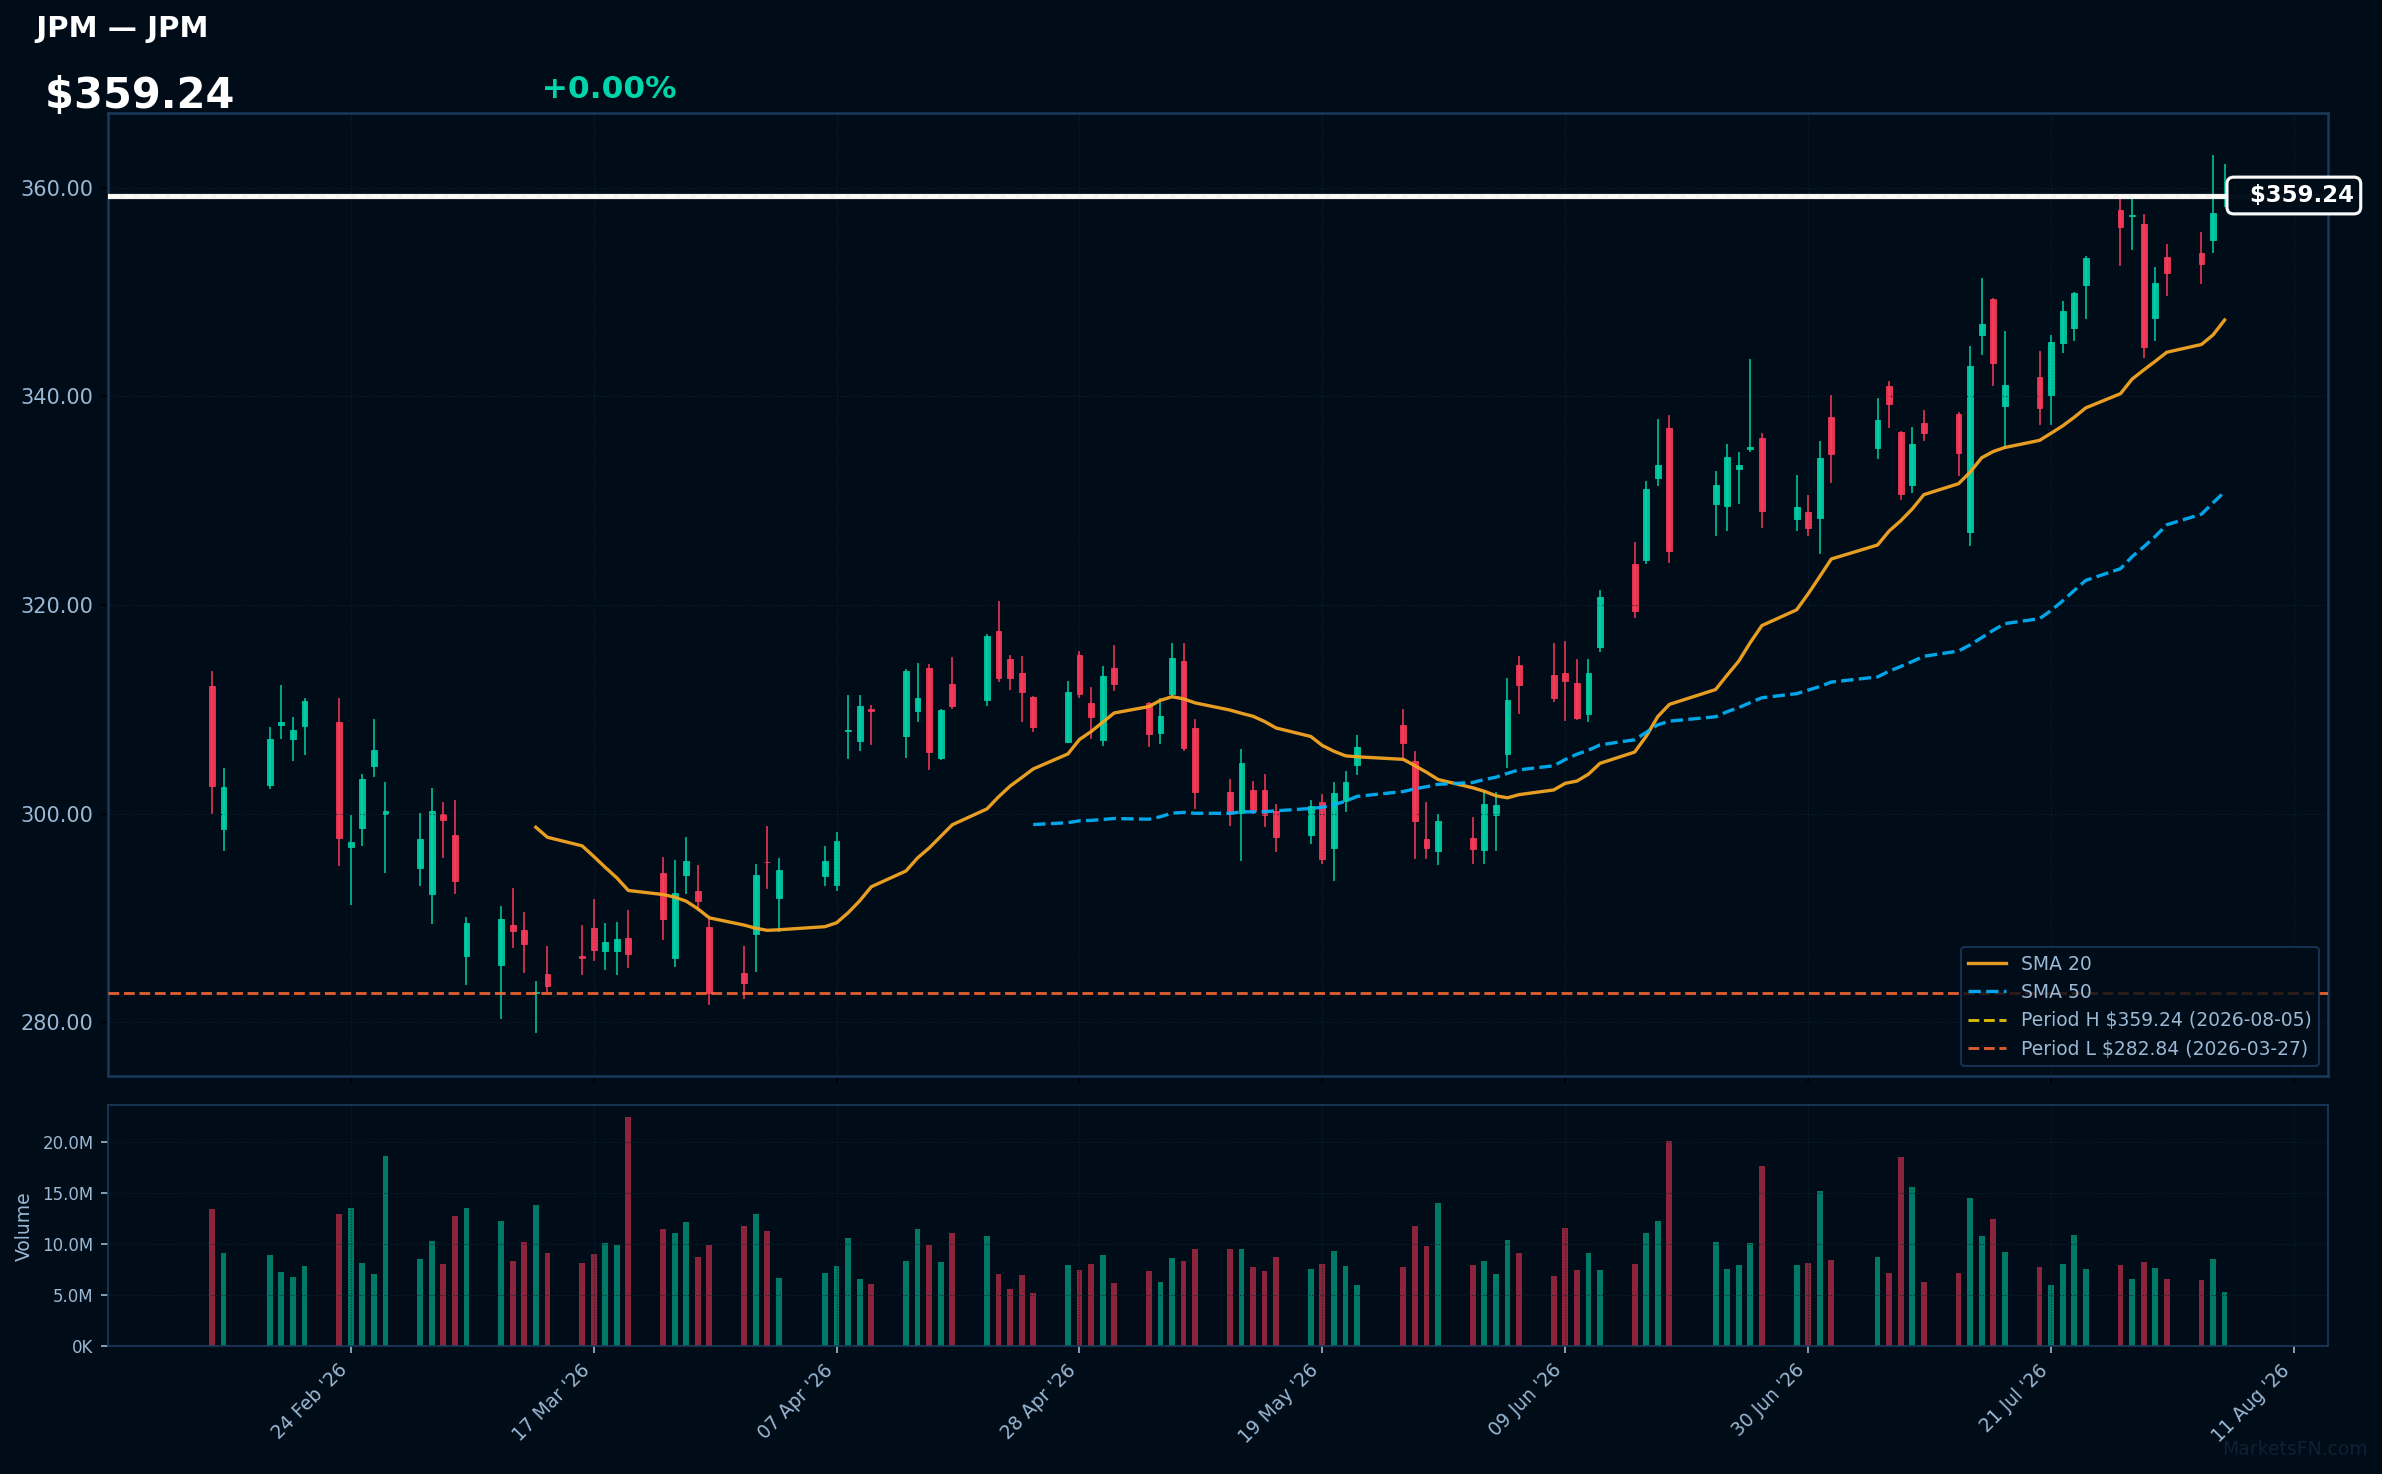
JPM | JPMorgan Chase & Co | Financial | Price Last: $359.24 | % Realized: +23.30% | RSI: 65.8 | % above MA200: +14.9% | Trend: Above MA20, MA50, MA200
JPMorgan Chase & Co is a leading global financial services firm, providing investment banking, financial services, and asset management. Investors should care due to its strong market position and ability to navigate economic cycles effectively, making it a key player in the financial sector.
The current technical situation shows bullish momentum with an RSI(14) of 65.8 and a bullish MA alignment: price > MA20 > MA50 > MA200. The stock is also 0.0% below its 52-Week high, indicating a potential breakout level.
Related headlines
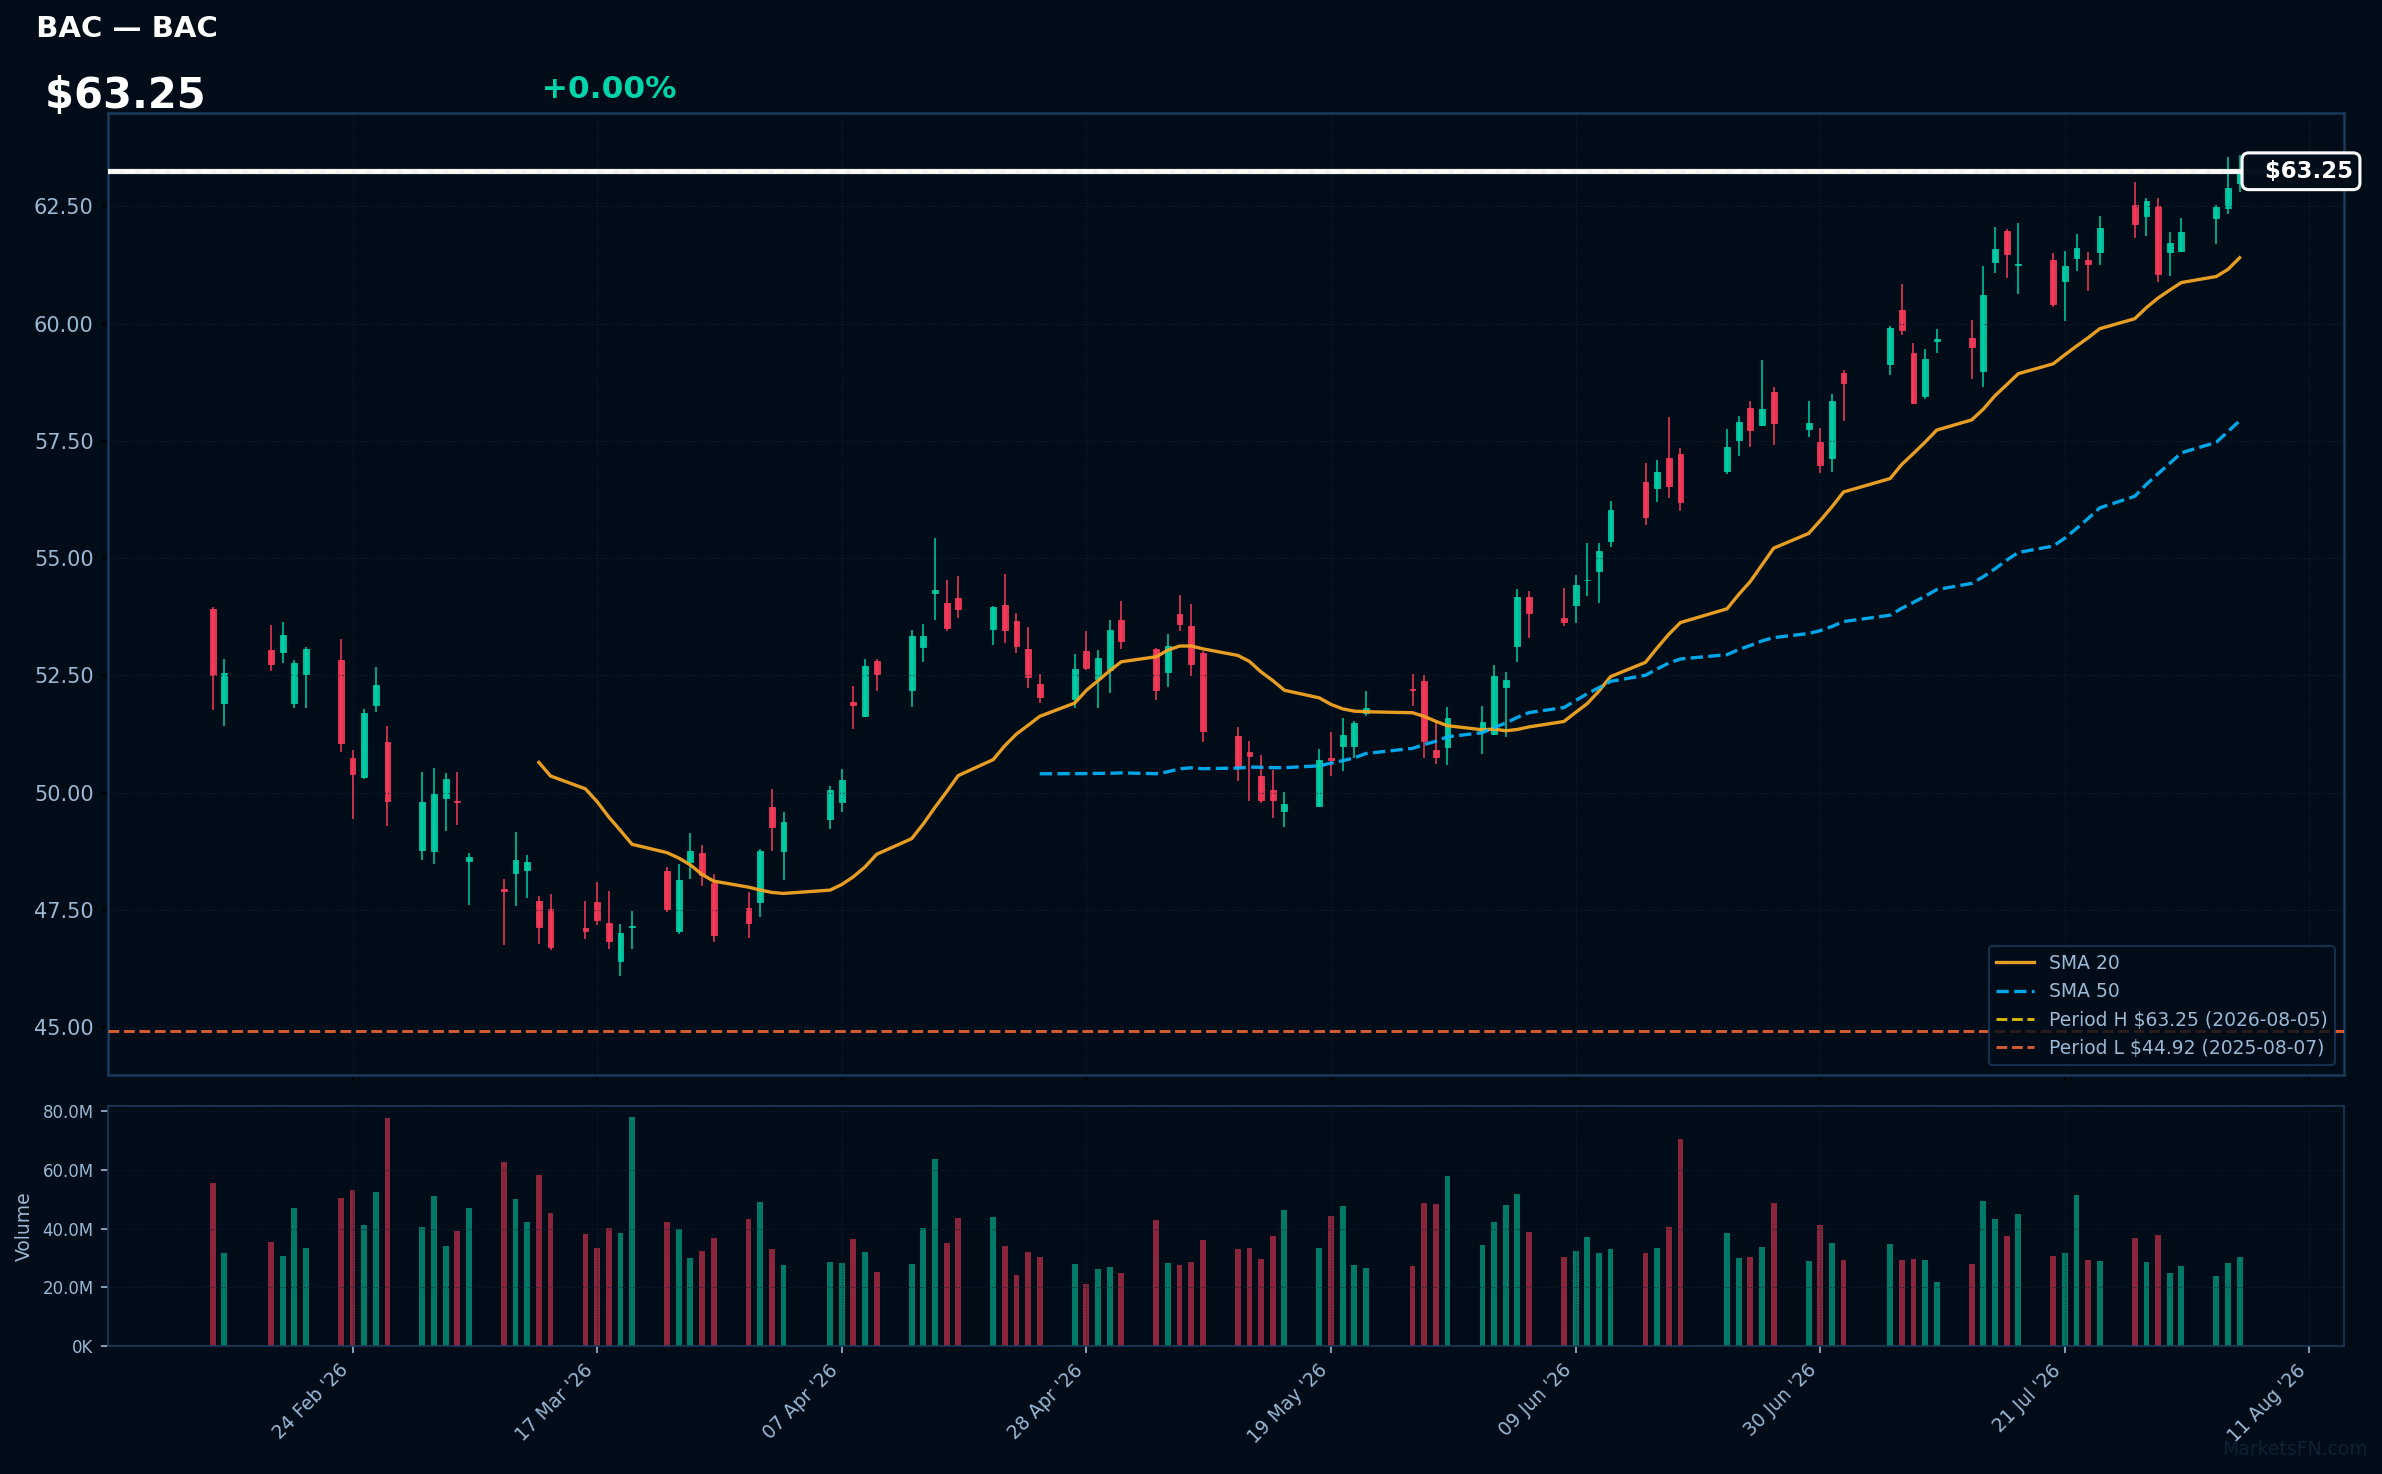
BAC | Bank Of America Corp | Financial | Price Last: $63.25 | % Realized: +39.26% | RSI: 68.0 | % above MA200: +17.7% | Trend: Above MA20, MA50, MA200
Bank Of America Corp (BAC) is a leading financial institution providing banking, investment, and wealth management services. Investors should care due to its significant market presence and potential for growth, especially in a rising interest rate environment that can enhance profitability.
The current technical situation shows bullish momentum with an RSI(14) of 68.0 and a strong MA alignment: price > MA20 > MA50 > MA200. The stock is also 0.0% below its 52-Week high, indicating a potential breakout.
Related headlines
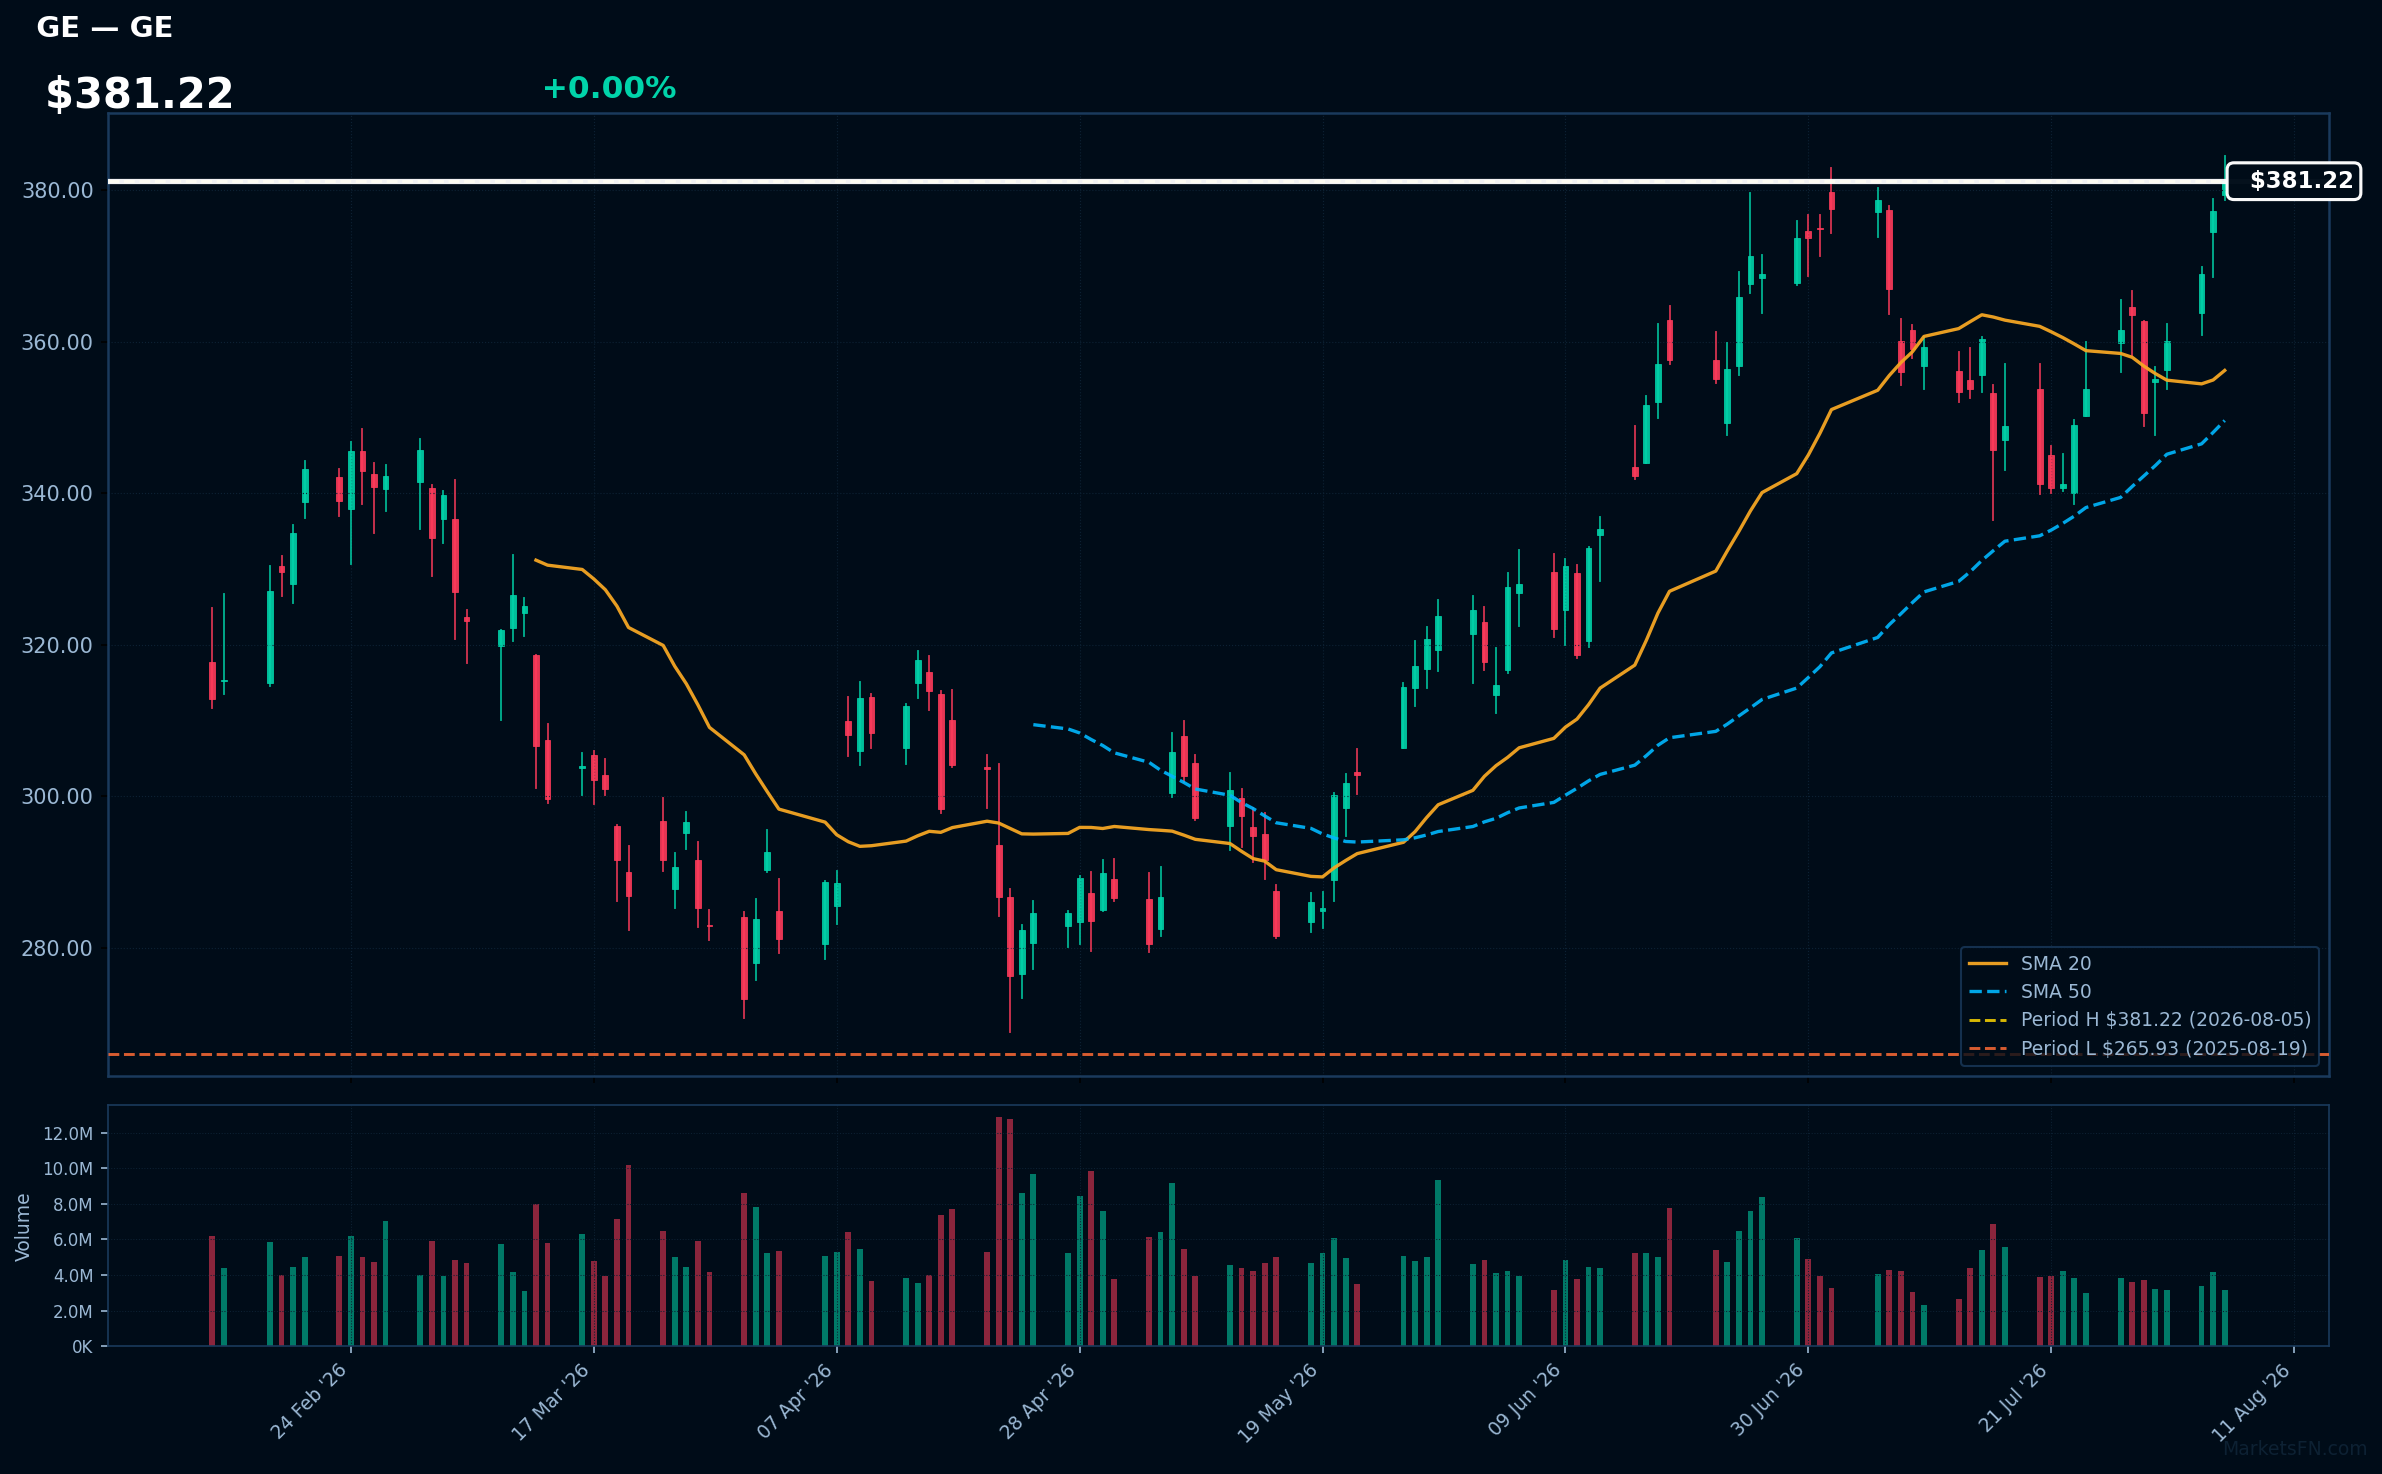
GE | GE Aerospace | Industrials | Price Last: $381.22 | % Realized: +40.01% | RSI: 66.3 | % above MA200: +20.6% | Trend: Above MA20, MA50, MA200
GE Aerospace specializes in jet engines, aircraft systems, and services, playing a crucial role in the aviation industry. Investors should care due to its innovative technologies and strong market position, which drive demand for commercial and military aviation solutions.
The current technical situation indicates bullish momentum, with an RSI of 66.3 and a strong MA alignment: price > MA20 > MA50 > MA200. The stock is also 0.0% below its 52-Week high, suggesting a potential breakout.
Related headlines
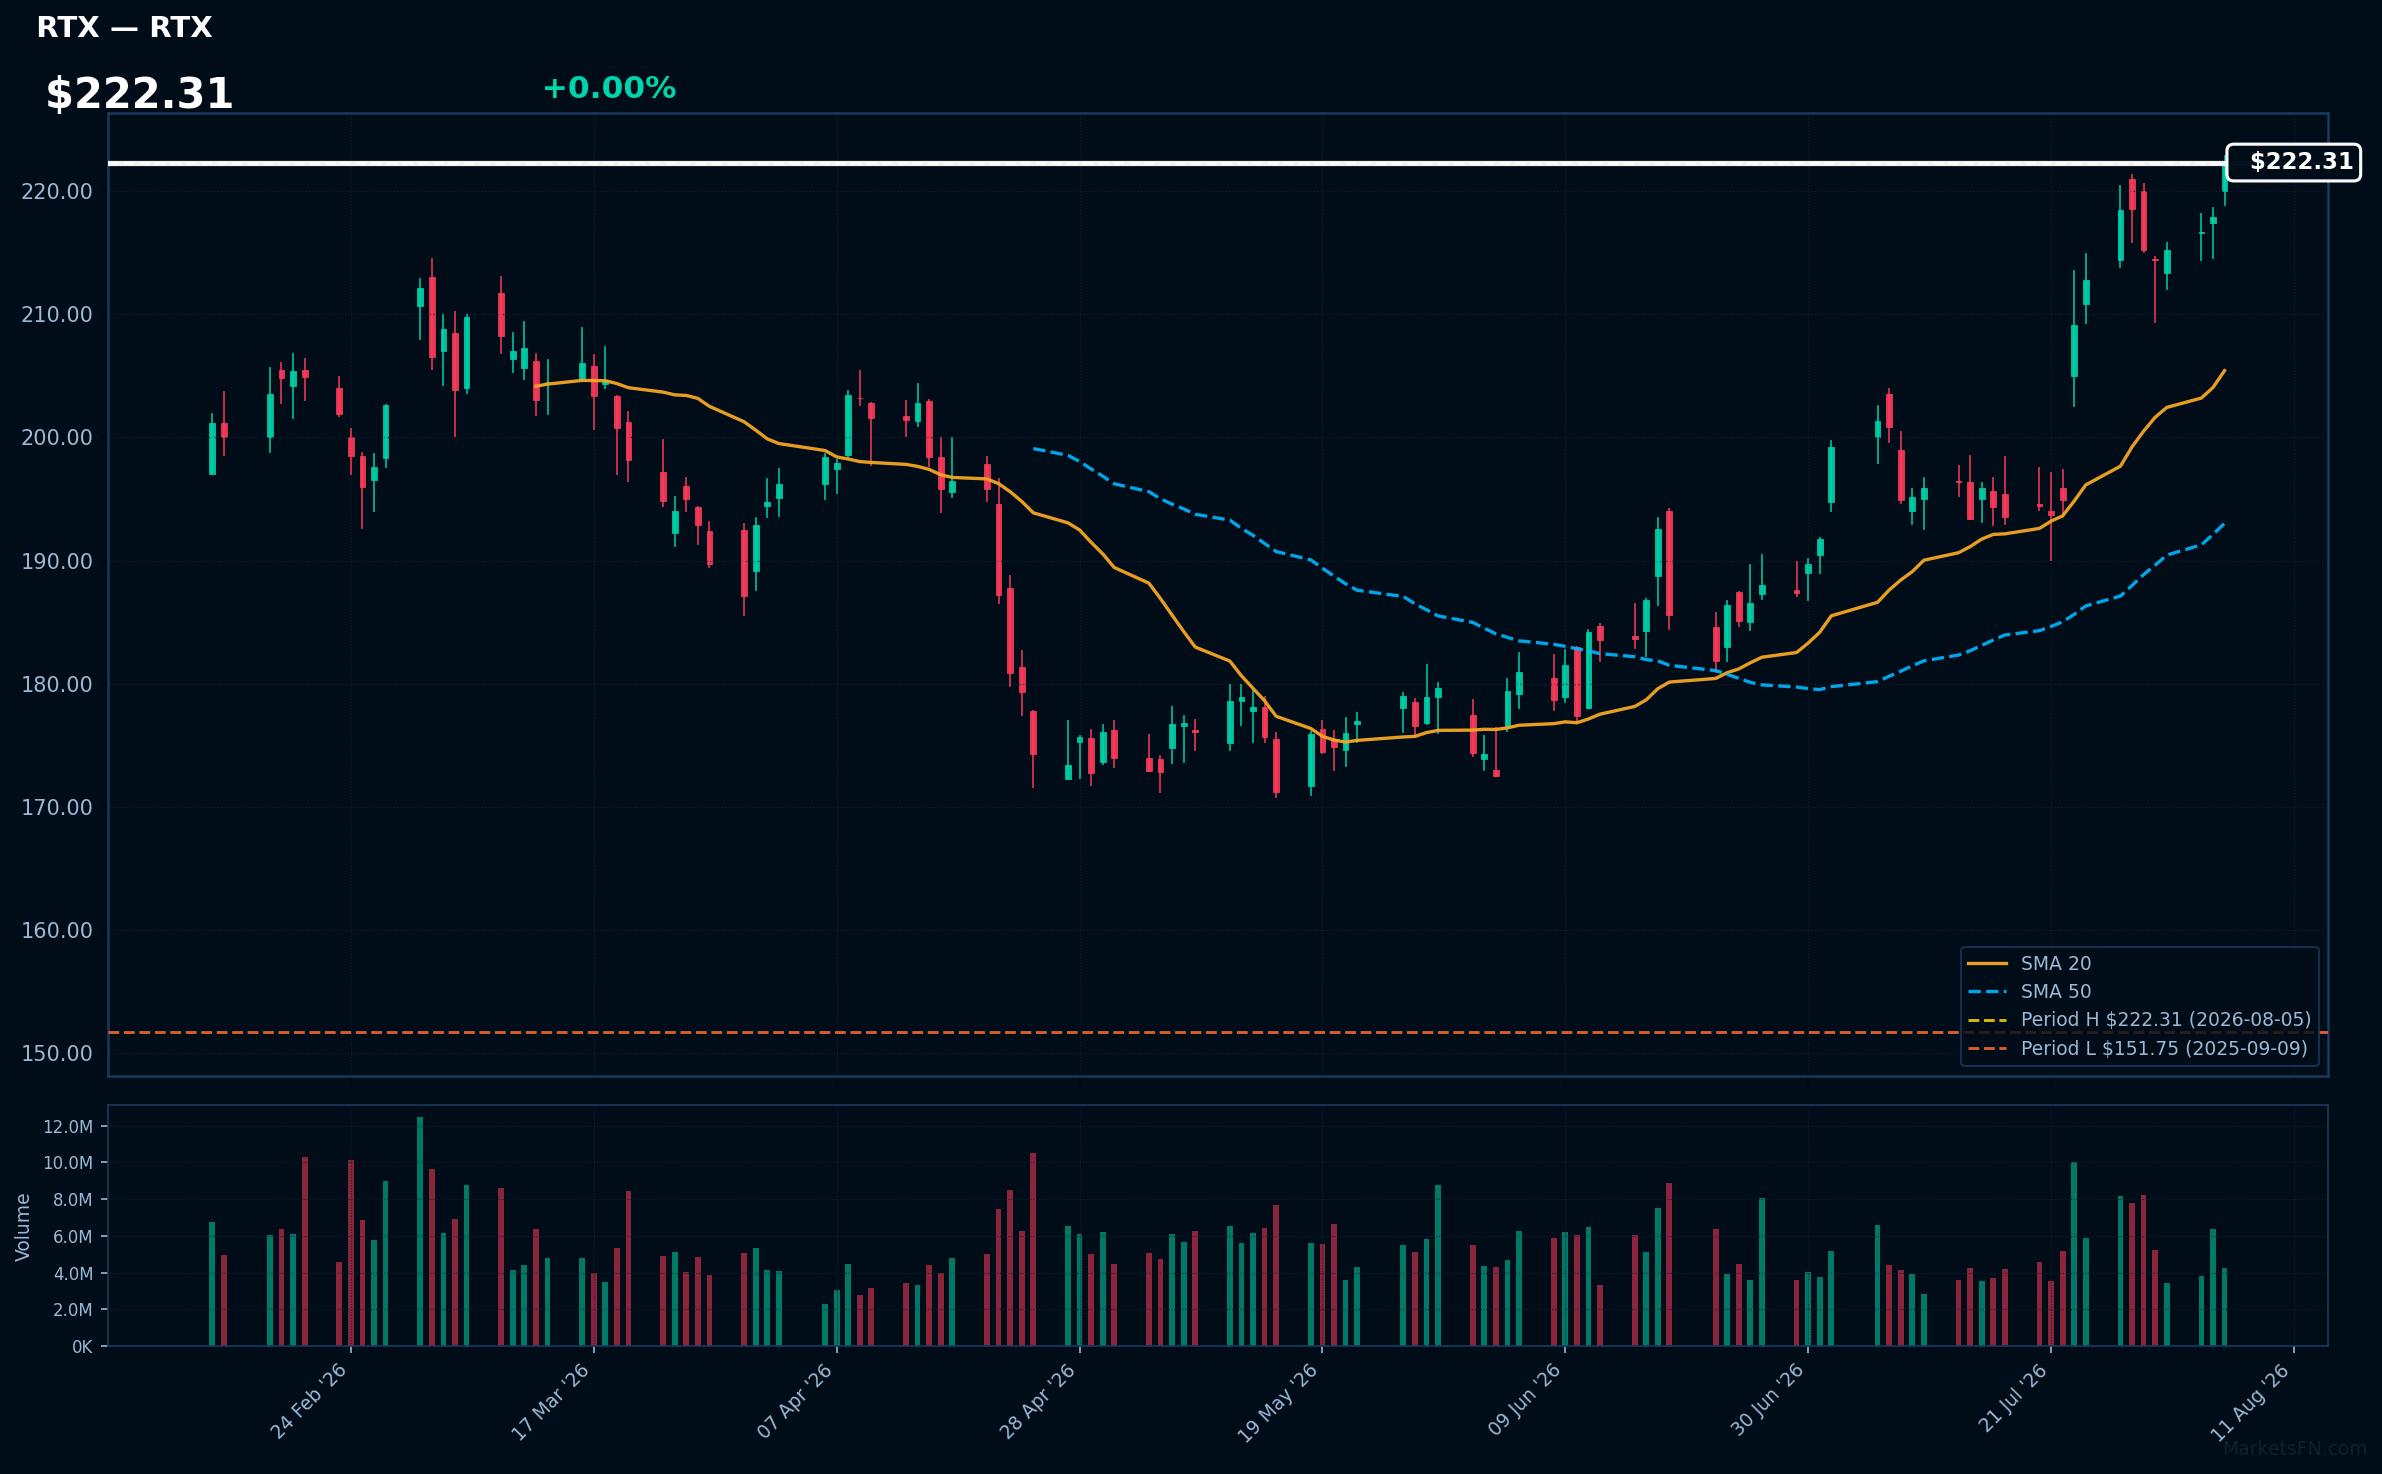
RTX | RTX Corp | Industrials | Price Last: $222.31 | % Realized: +42.74% | RSI: 75.8 | % above MA200: +17.8% | Trend: Above MA20, MA50, MA200
RTX Corp (RTX) specializes in aerospace and defense technologies, providing advanced systems and services for commercial and military applications. Investors should care due to its critical role in national security and innovation, positioning it for growth amid increasing defense budgets and technological advancements.
The current technical situation indicates strong momentum, with an RSI(14) of 75.8 and a bullish MA alignment: price > MA20 > MA50 > MA200. The stock is also 0.0% below its 52-Week high, suggesting a potential breakout.
Related headlines
📉 Nearest to 52-Week Low
Sectors represented: Consumer Cyclical (2), Real Estate (1), Utilities (1), Healthcare (1)
| Ticker | Company | Sector | Price Last | % Realized | 52-Week Low Date | RSI | % above MA200 | Trend |
|---|---|---|---|---|---|---|---|---|
| CCI | Crown Castle Inc | Real Estate | $73.84 | -29.87% | 2026-08-05 | 39.2 | -14.9% | Below MA20, MA50, MA200 |
| PEG | Public Service Enterprise Group Inc | Utilities | $75.54 | -12.03% | 2026-08-05 | 31.3 | -6.6% | Below MA20, MA50, MA200 |
| ROL | Rollins, Inc | Consumer Cyclical | $37.57 | -35.59% | 2026-08-05 | 26.2 | -31.2% | Below MA20, MA50, MA200 |
| PODD | Insulet Corporation | Healthcare | $133.26 | -51.94% | 2026-08-05 | 30.3 | -42.0% | Below MA20, MA50, MA200 |
| APTV | Aptiv PLC | Consumer Cyclical | $47.01 | -27.81% | 2026-08-05 | 25.9 | -33.1% | Below MA20, MA50, MA200 |
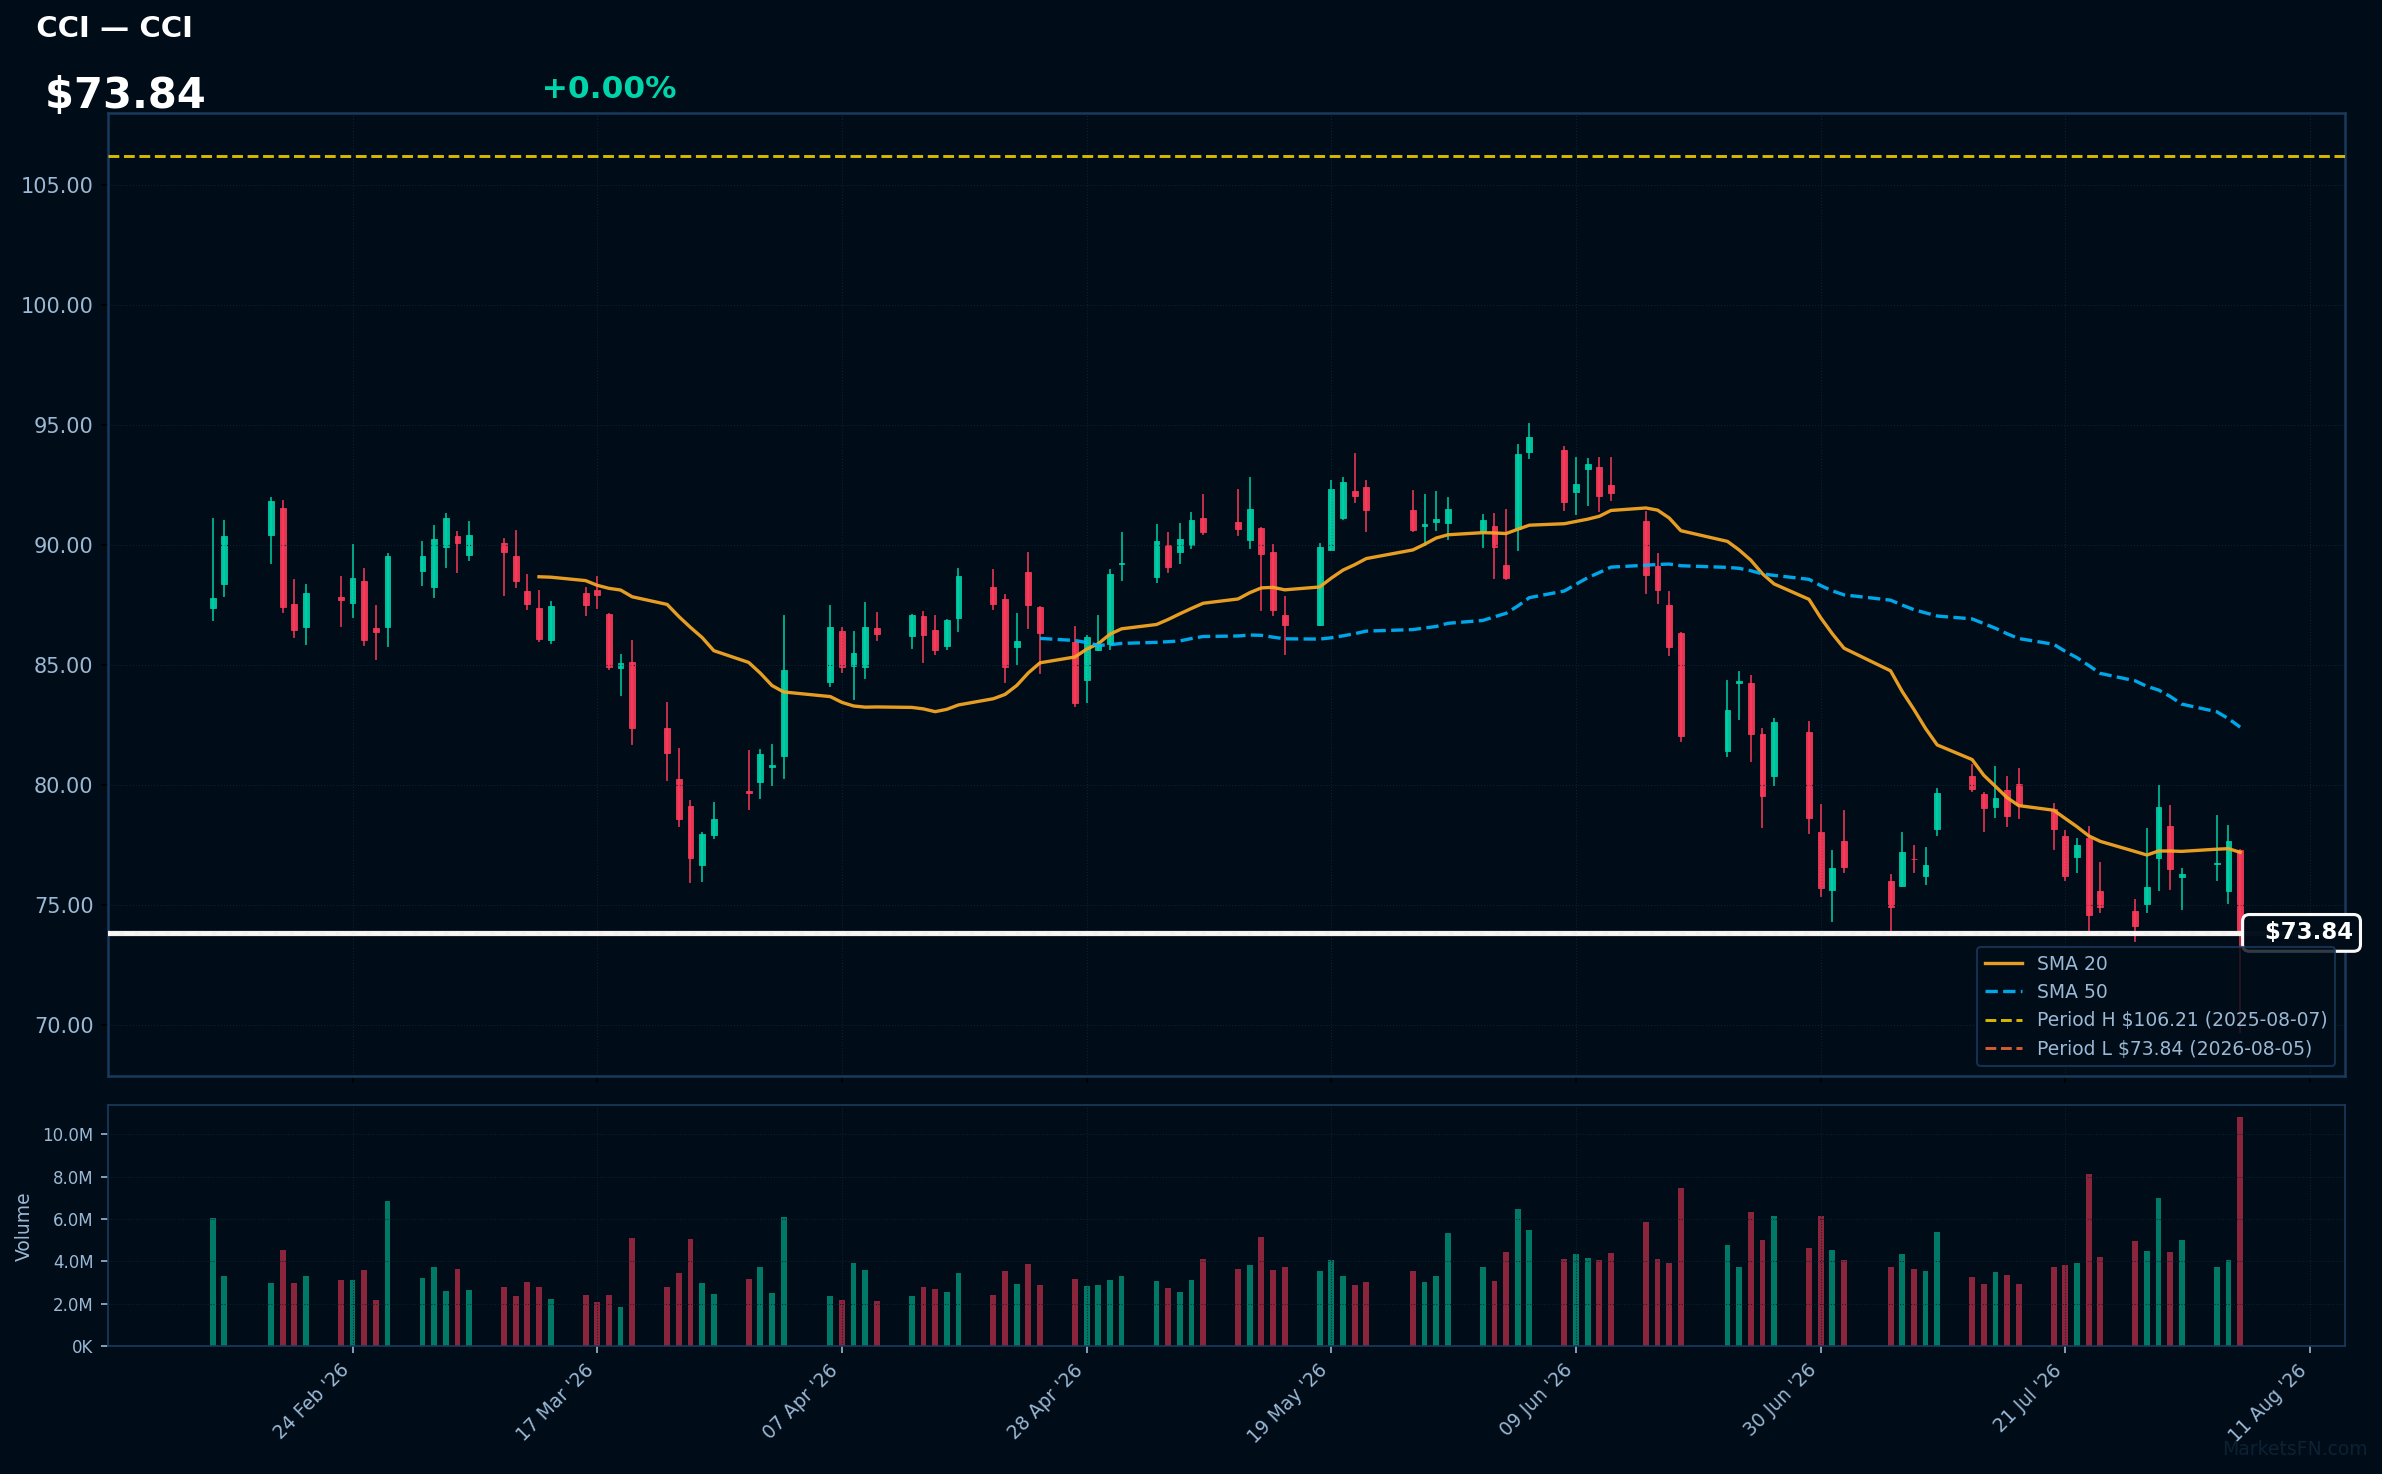
CCI | Crown Castle Inc | Real Estate | Price Last: $73.84 | % Realized: -29.87% | RSI: 39.2 | % above MA200: -14.9% | Trend: Below MA20, MA50, MA200
Crown Castle Inc (CCI) is a leading provider of shared communications infrastructure, including cell towers and small cell networks, essential for mobile data transmission. Investors should care due to its critical role in the growing demand for wireless connectivity and 5G technology.
The current technical situation indicates a bearish trend, with an RSI of 39.2 and a MA alignment of price < MA20 < MA50 < MA200, suggesting sustained downtrend and potential warning signs as the stock tests major support, being only 0.0% above its 52-Week low.
Related headlines
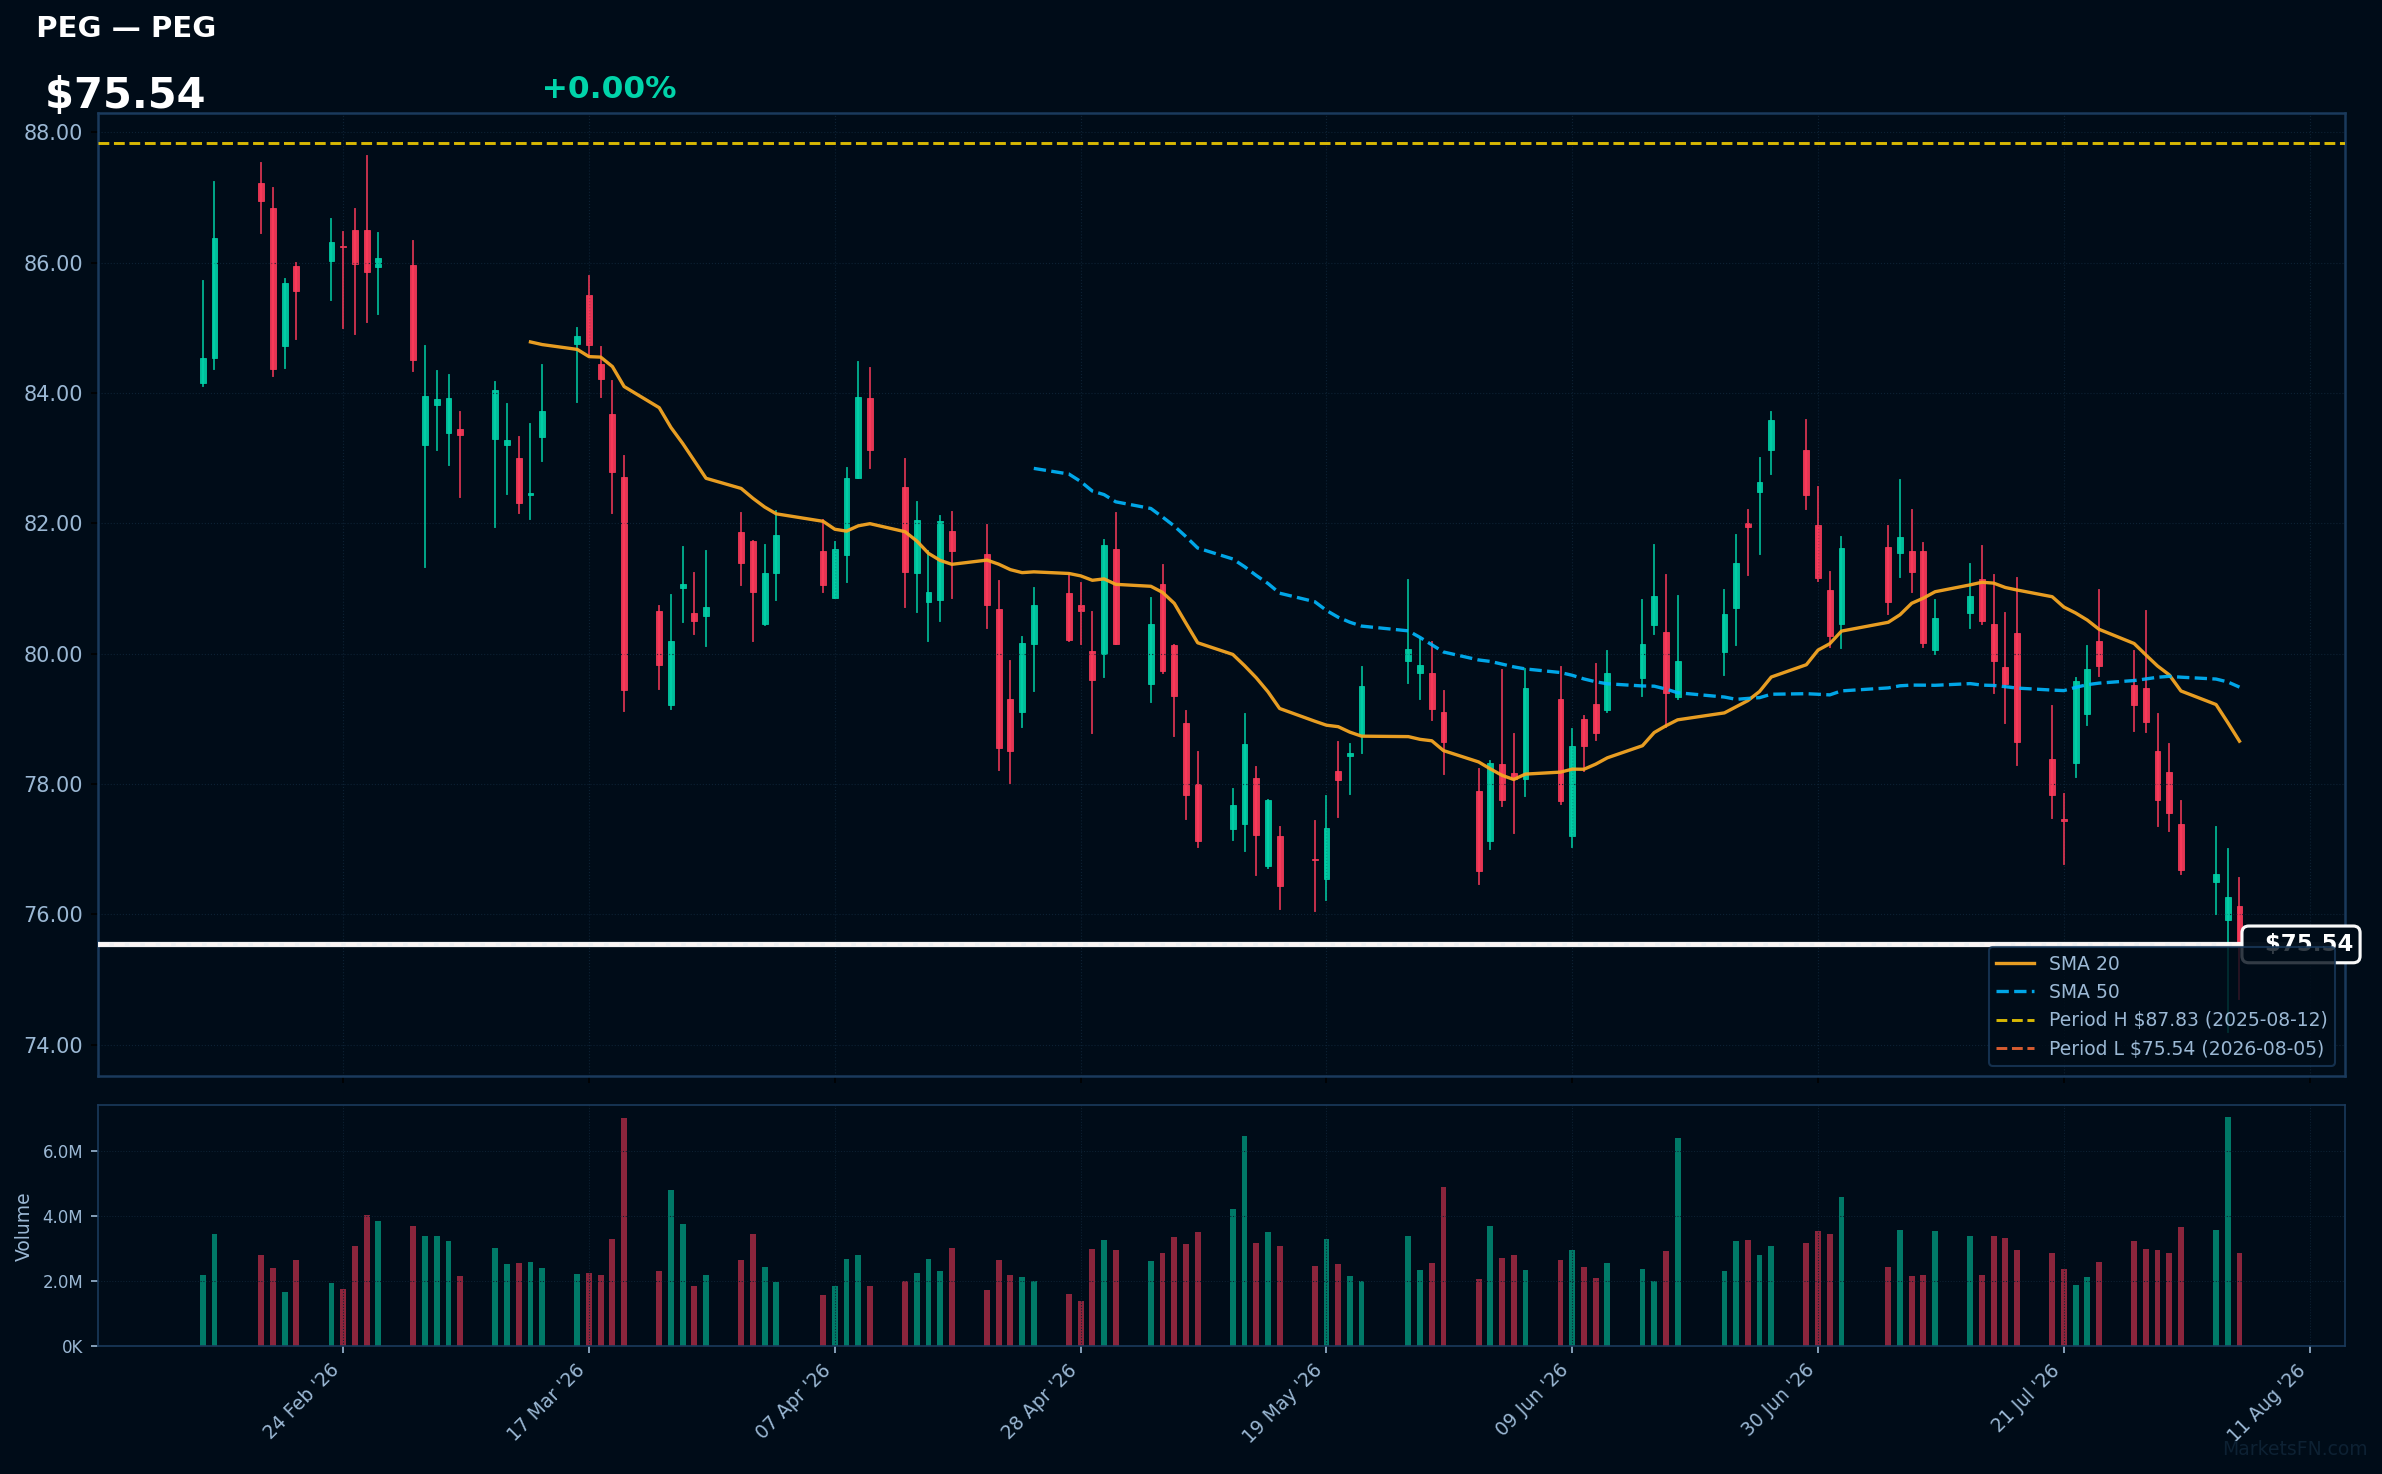
PEG | Public Service Enterprise Group Inc | Utilities | Price Last: $75.54 | % Realized: -12.03% | RSI: 31.3 | % above MA200: -6.6% | Trend: Below MA20, MA50, MA200
Public Service Enterprise Group Inc (PEG) is a utility holding company that provides electricity and natural gas services. Investors should care due to its critical role in energy infrastructure and the potential impact of regulatory changes on its operations and profitability.
The current technical situation indicates a warning sign, with an RSI(14) of 31.3 and a bearish MA alignment: price < MA20 < MA50 < MA200, suggesting a sustained downtrend and testing major support just 0.0% above its 52-Week low.
Related headlines
- Public Service Enterprise Group Inc (PEG) (Q2 2026) Earnings Call Highlights: Reaffirms ...
- Public Service Enterprise Group Incorporated Q2 2026 Earnings Call Summary
- Public Service Enterprise Group Incorporated Q1 2026 Earnings Call Summary
- Is Public Service Enterprise Stock Underperforming the Nasdaq?
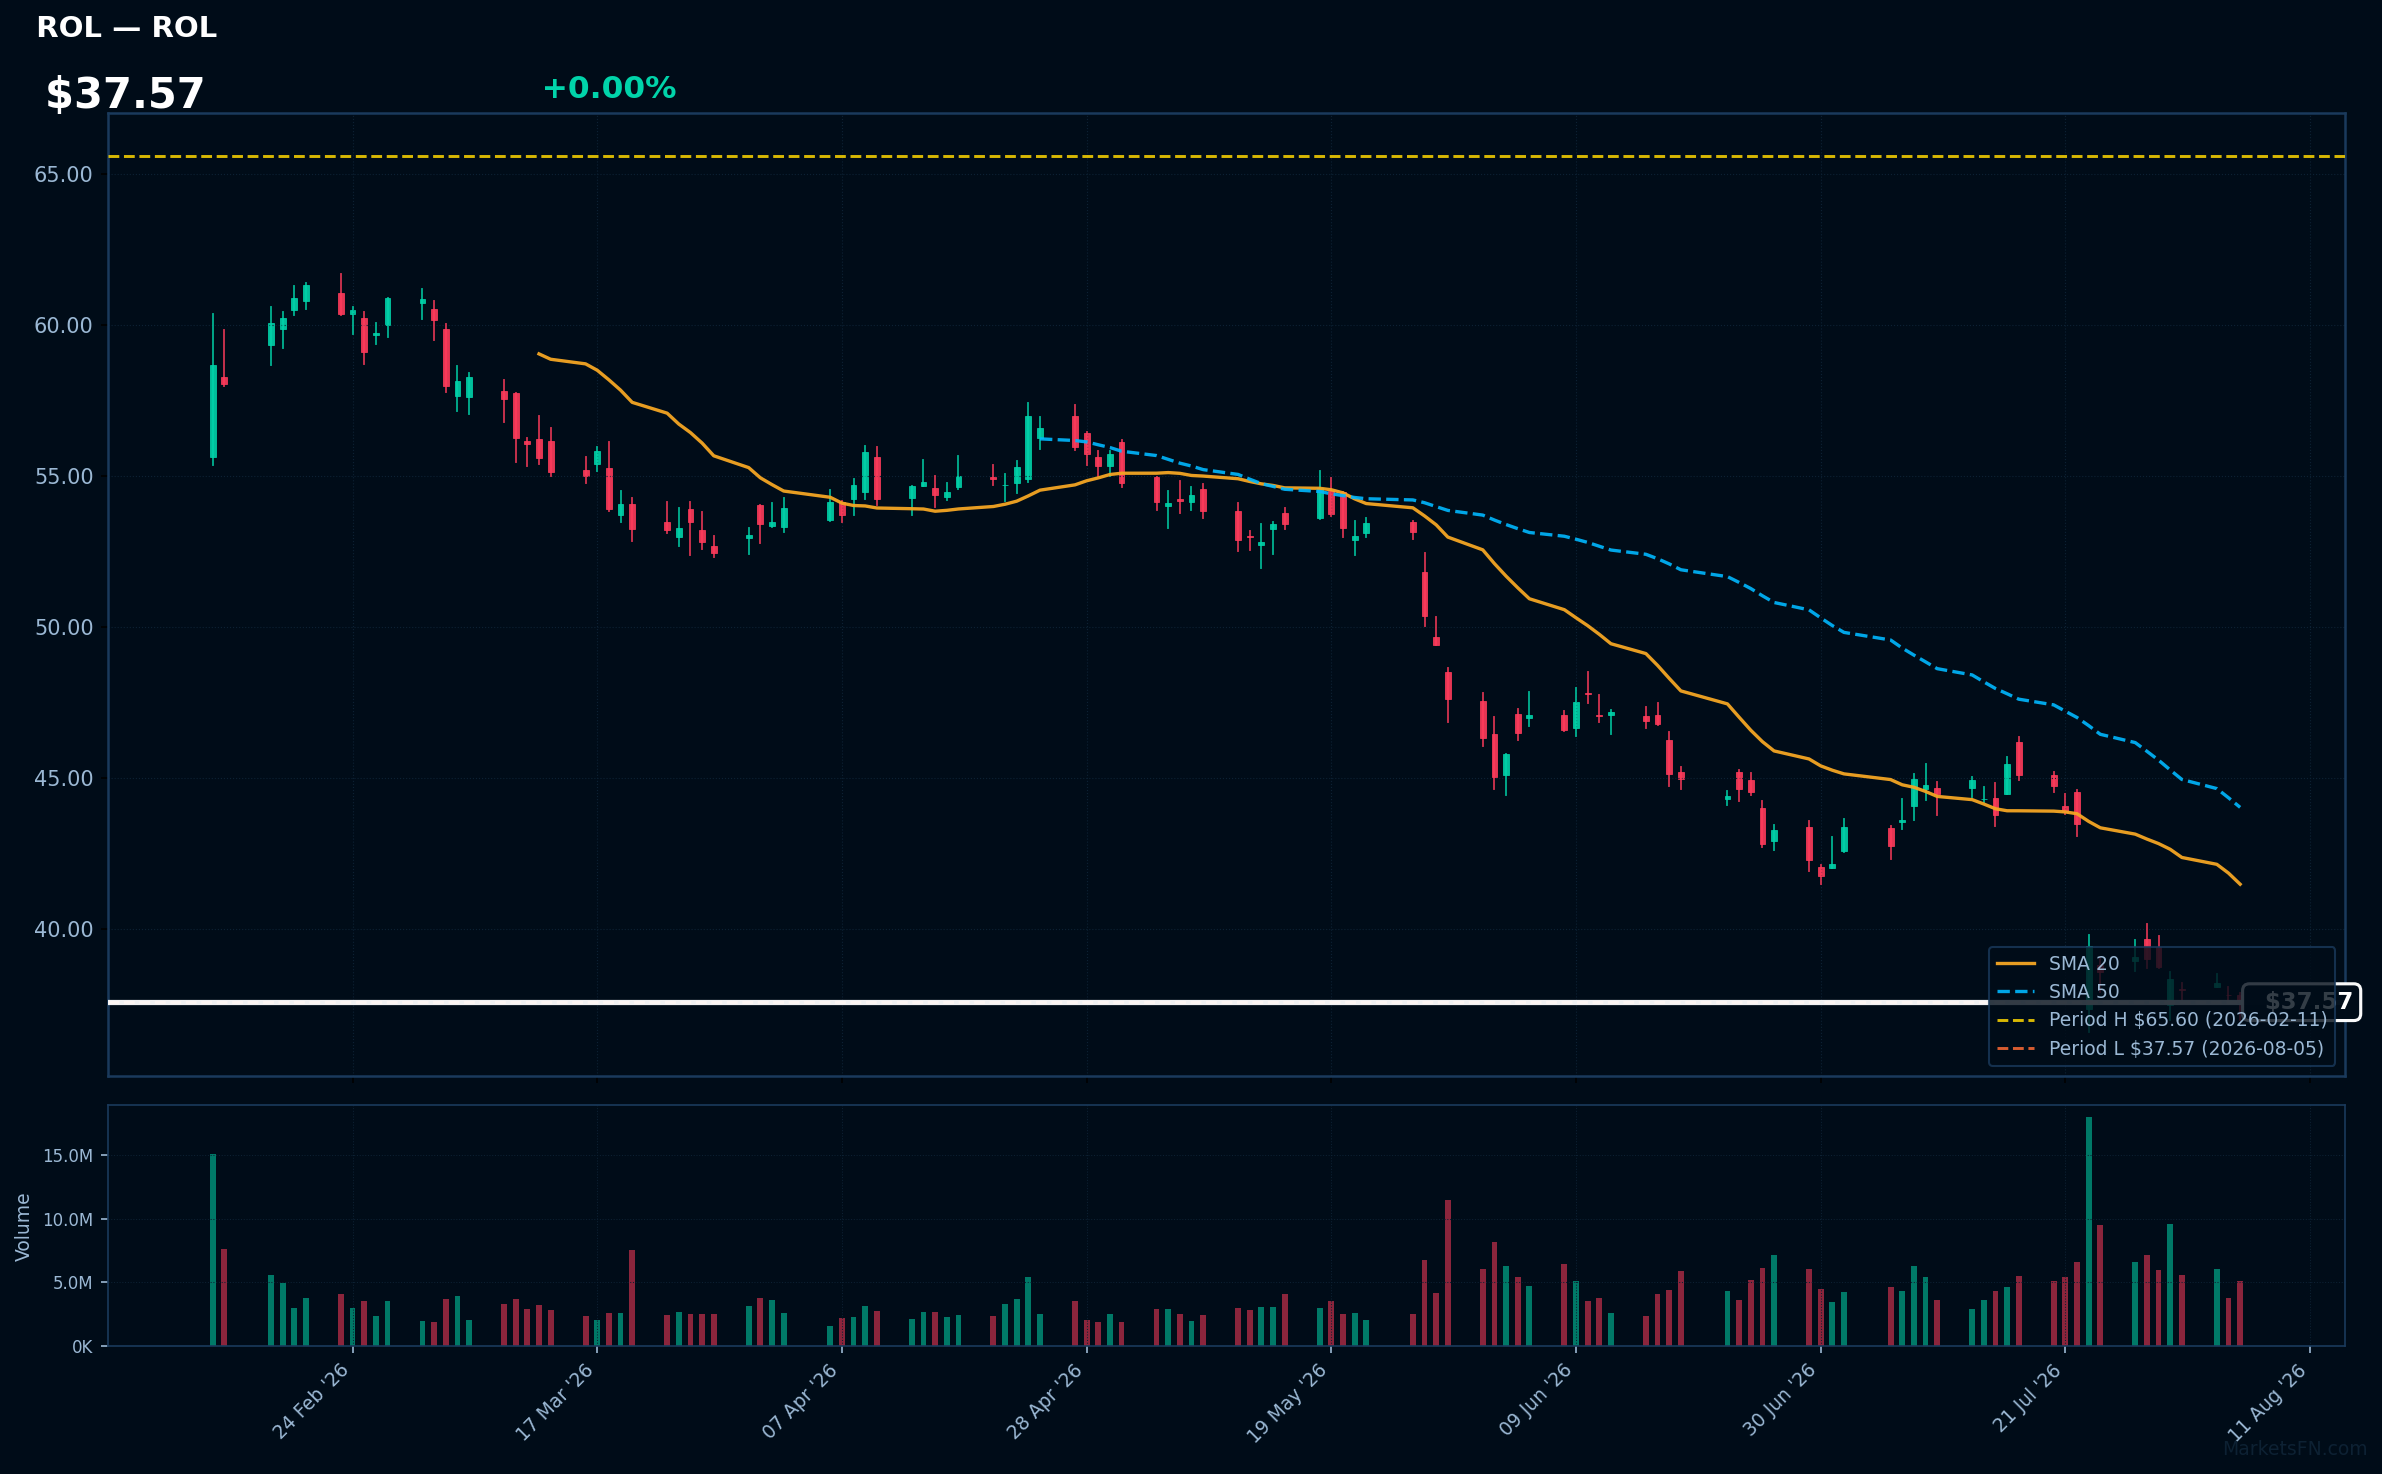
ROL | Rollins, Inc | Consumer Cyclical | Price Last: $37.57 | % Realized: -35.59% | RSI: 26.2 | % above MA200: -31.2% | Trend: Below MA20, MA50, MA200
Rollins, Inc. provides pest control services through its subsidiaries, focusing on residential and commercial markets. Investors should care due to its significant market presence and potential for growth in a sector that remains essential regardless of economic conditions.
The current technical situation indicates a warning sign, with an RSI(14) of 26.2 and a bearish MA alignment: price < MA20 < MA50 < MA200, indicating a sustained downtrend and testing major support just 0.0% above its 52-Week low.
Related headlines
- JPMorgan cuts Rollins to Neutral on demand uncertainty, slashes price target
- Rollins Inc (ROL) Q2 2026 Earnings Call Highlights: Strong Growth in Termite and Ancillary ...
- Rollins Inc. stock underperforms Thursday when compared to competitors
- Rollins shares plunge premarket after Q2 miss triggers downgrades
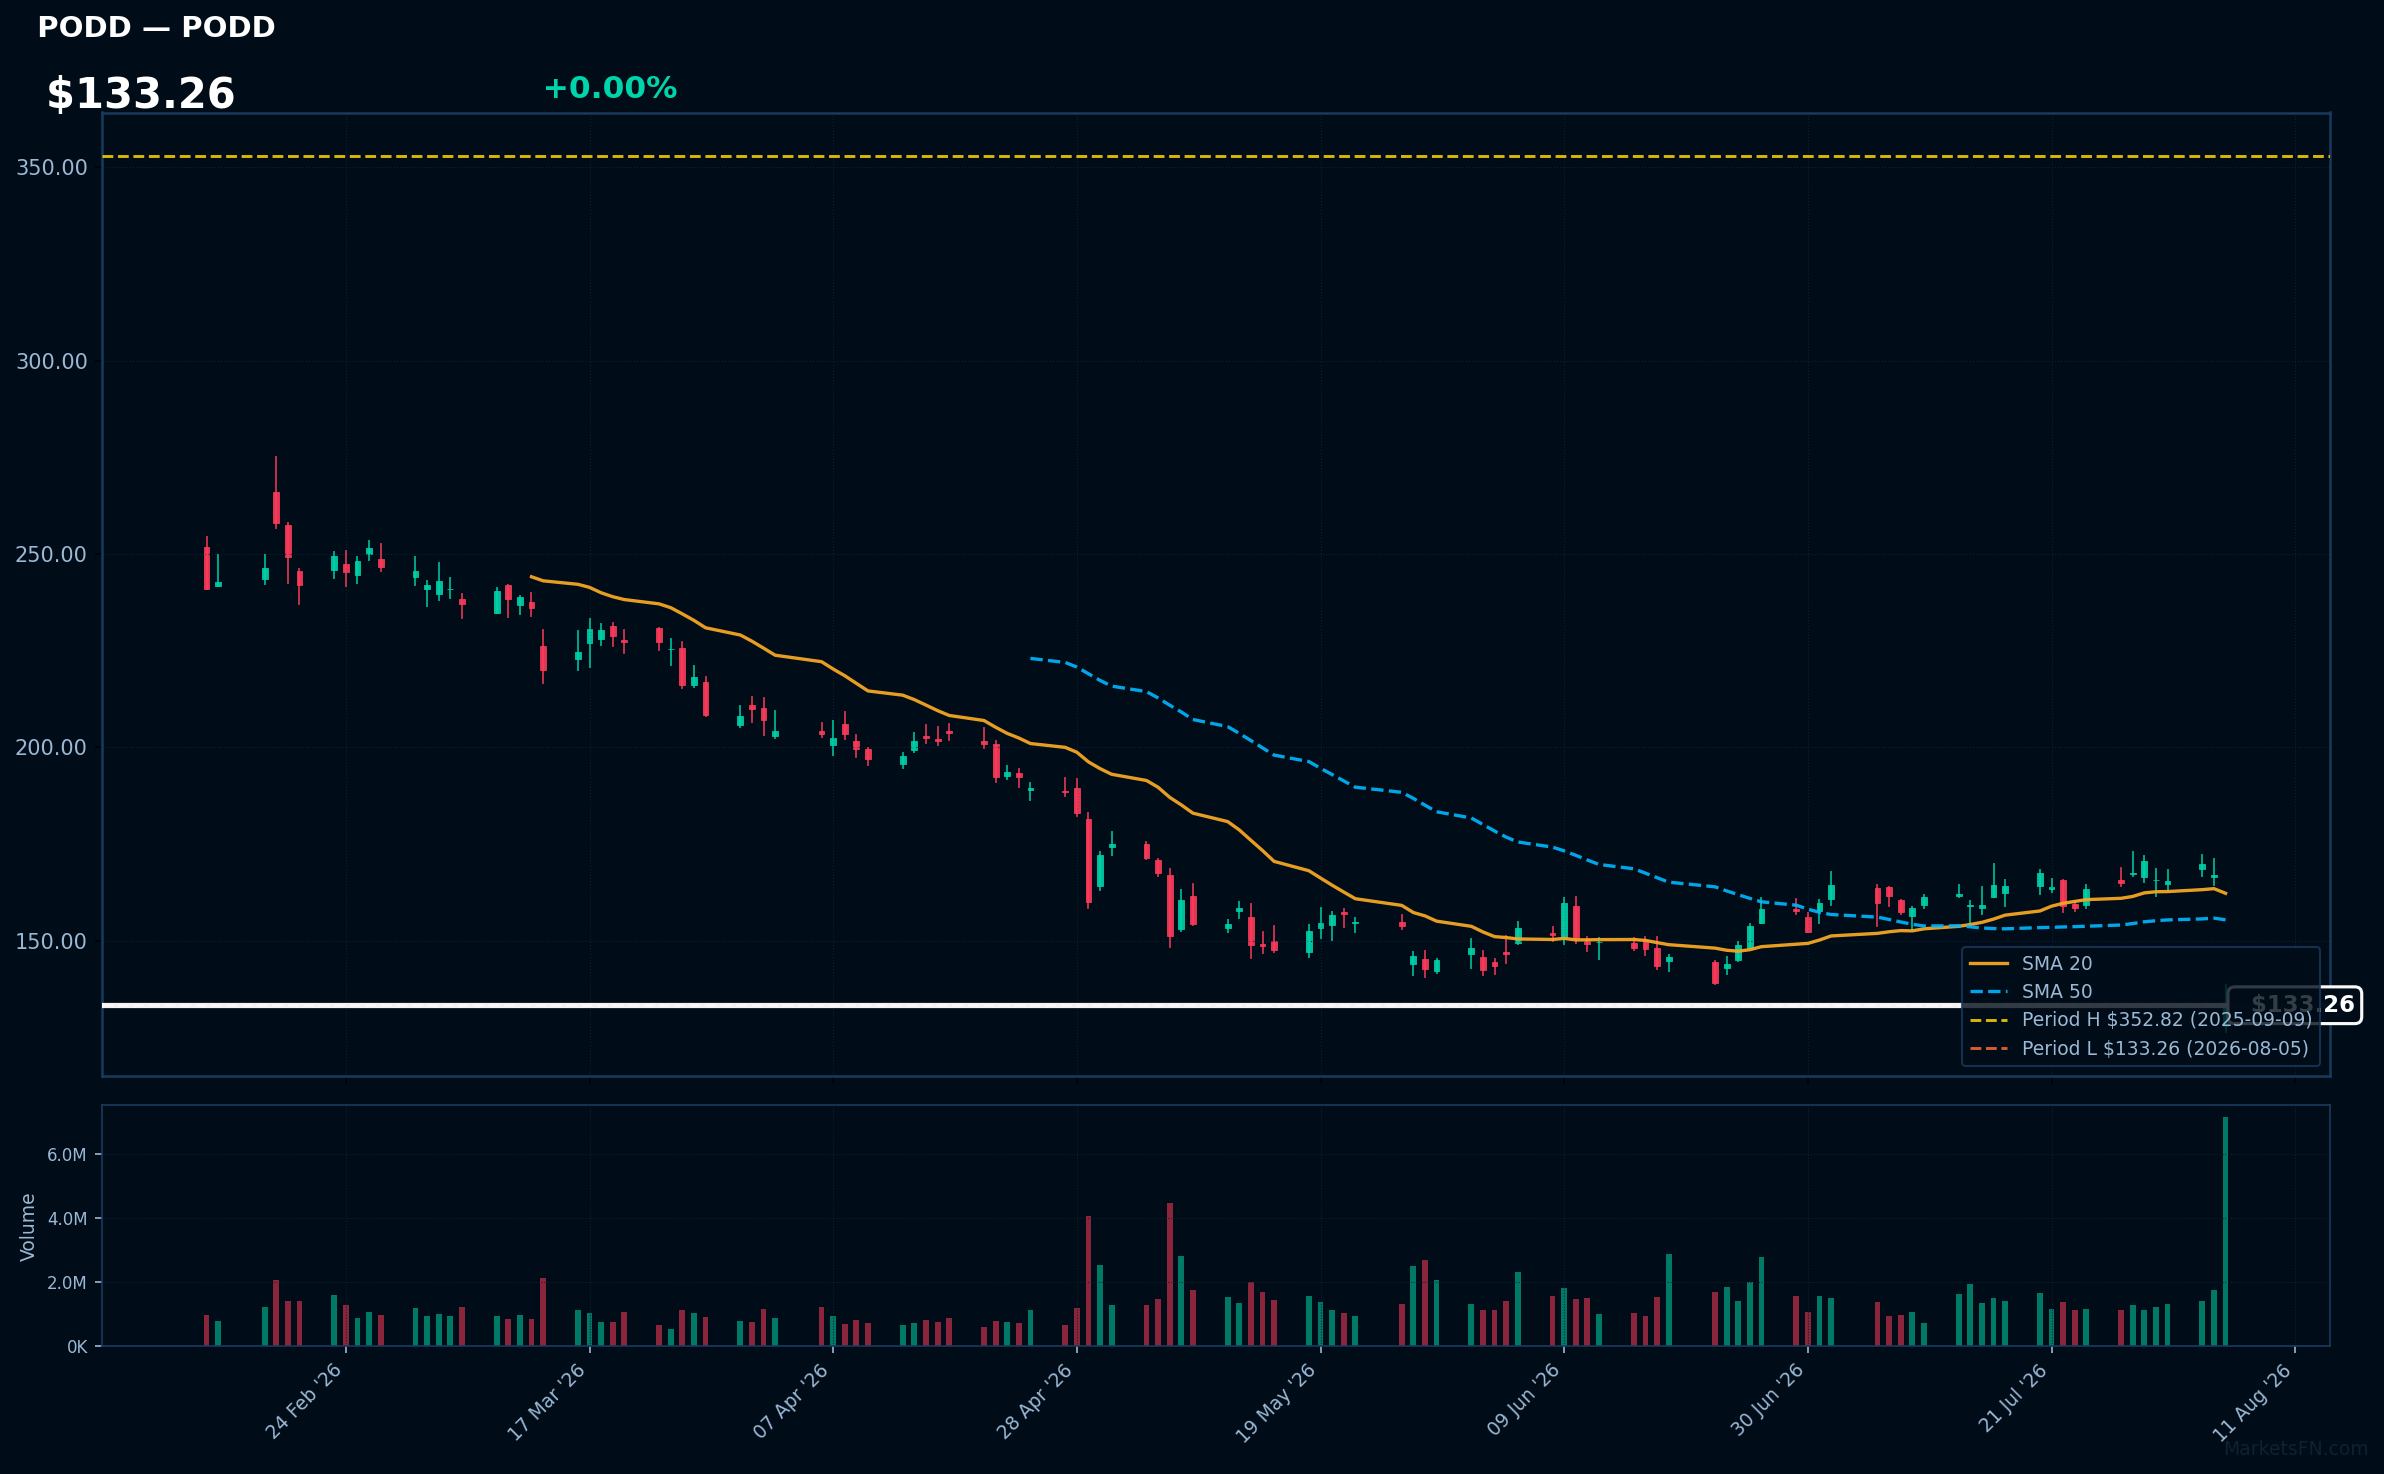
PODD | Insulet Corporation | Healthcare | Price Last: $133.26 | % Realized: -51.94% | RSI: 30.3 | % above MA200: -42.0% | Trend: Below MA20, MA50, MA200
Insulet Corporation (PODD) specializes in innovative insulin delivery systems, notably the Omnipod, which offers a tubeless, wearable solution for diabetes management. Investors should care due to the growing diabetes market and the company's potential for significant revenue growth through product adoption.
The current technical situation indicates caution; with an RSI(14) of 30.3, the stock is in oversold territory. Additionally, it is below MA20/MA50/MA200, signaling mixed momentum and potential weakness as it tests major support, being only 0.0% above its 52-Week low.
Related headlines
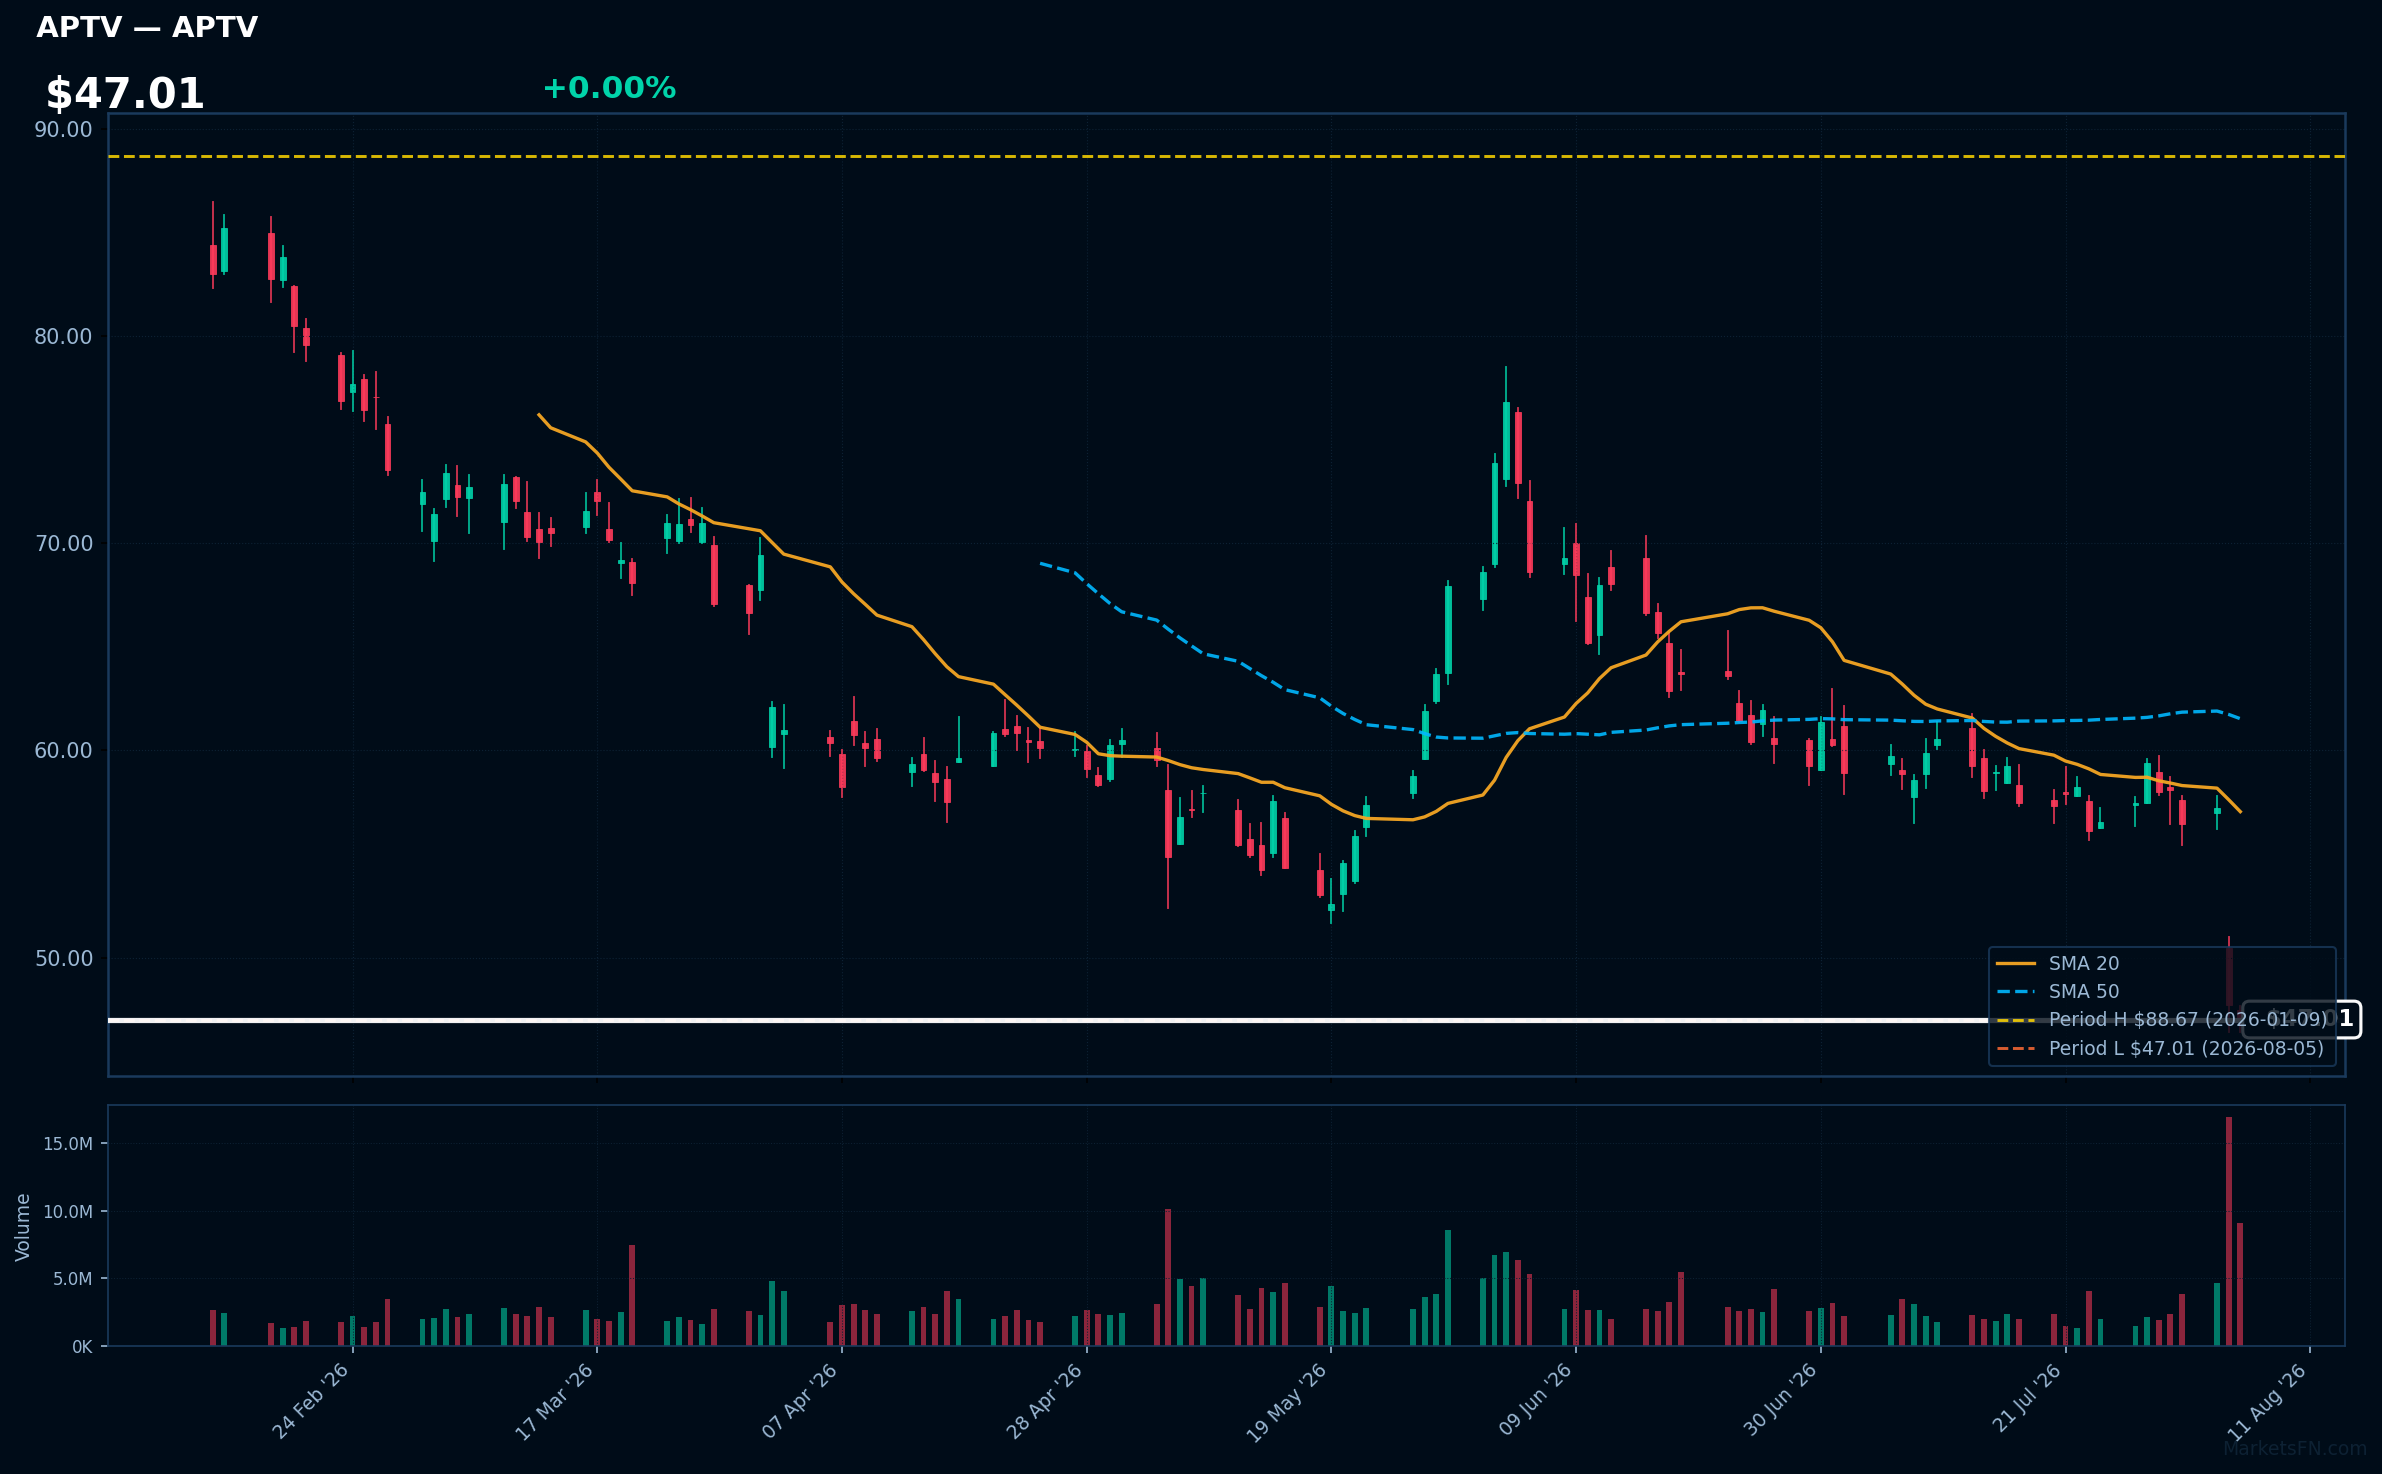
APTV | Aptiv PLC | Consumer Cyclical | Price Last: $47.01 | % Realized: -27.81% | RSI: 25.9 | % above MA200: -33.1% | Trend: Below MA20, MA50, MA200
Aptiv PLC designs advanced automotive technology, focusing on connectivity and safety solutions. Investors should care due to its pivotal role in the evolving electric and autonomous vehicle markets, which are critical for future automotive innovation and growth.
The current technical situation indicates a bearish trend with an RSI of 25.9 and a MA alignment of price < MA20 < MA50 < MA200, suggesting a sustained downtrend and potential warning signs for investors.
Related headlines
Market Commentary
The presence of S&P 500 stocks near 52-week extremes indicates heightened investor sentiment and market momentum. Stocks such as Berkshire Hathaway Inc (BRK-B), JPMorgan Chase & Co (JPM), and Bank Of America Corp (BAC) are currently at 0.0% from their 52-week highs, suggesting strong bullish trends. Conversely, stocks like Crown Castle Inc (CCI) and Public Service Enterprise Group Inc (PEG) are only slightly above their 52-week lows, reflecting potential bearish sentiment in certain sectors.
This divergence may signal sector rotation, where investors shift capital from overvalued sectors to those perceived as undervalued or with growth potential. Macro themes such as interest rate fluctuations and inflation concerns could be influencing these price levels, as financial stocks near their highs may benefit from rising rates, while utility and infrastructure stocks near their lows could be facing headwinds from economic uncertainty.
Key levels to watch include the 52-week highs for the leading stocks, which could serve as resistance points if upward momentum falters. For those near their lows, a break below these levels may trigger further selling. Potential catalysts include upcoming earnings reports, economic data releases, and Federal Reserve announcements, which could significantly impact market sentiment and stock performance.
Methodology: All 503 S&P 500 constituents screened. 52-week high = highest daily close over the past 252 trading days (approx. 1 year). 52-week low = lowest daily close over the same period. Distance = (current price / extreme − 1) × 100. Technical indicators computed on up to 1 year of daily OHLCV data.
Disclaimer: For informational purposes only. Not investment advice. Past performance is not indicative of future results.

