S&P 500 52-Week Highs & Lows Radar: GE Aerospace (GE), Salesforce (CRM) and more
· Stocks · MarketsFN Team
S&P 500 52-Week Highs & Lows Radar: GE Aerospace (GE), Salesforce (CRM) and more
Screening all 503 S&P 500 constituents for stocks nearest to their 52-week high and their 52-week low. Data as of June 19, 2026. % Realized = 52-week total return.
Legend: RSI > 70 = overbought · RSI < 30 = oversold · Green % Realized = positive 52W return · Red = negative.
📈 Nearest to 52-Week High
Sectors represented: Financial (3), Industrials (2)
| Ticker | Company | Sector | Price Last | % Realized | 52-Week High Date | RSI | % above MA200 | Trend |
|---|---|---|---|---|---|---|---|---|
| GE | GE Aerospace | Industrials | $357.03 | +49.15% | 2026-06-17 | 71.2 | +17.1% | Above MA20, MA50, MA200 |
| MS | Morgan Stanley | Financial | $224.96 | +69.51% | 2026-06-17 | 71.7 | +28.4% | Above MA20, MA50, MA200 |
| GS | Goldman Sachs Group, Inc | Financial | $1099.14 | +71.53% | 2026-06-17 | 66.2 | +25.6% | Above MA20, MA50, MA200 |
| CAT | Caterpillar Inc | Industrials | $955.92 | +165.15% | 2026-06-17 | 61.4 | +43.2% | Above MA20, MA50, MA200 |
| C | Citigroup Inc | Financial | $143.78 | +83.28% | 2026-06-17 | 73.7 | +27.2% | Above MA20, MA50, MA200 |
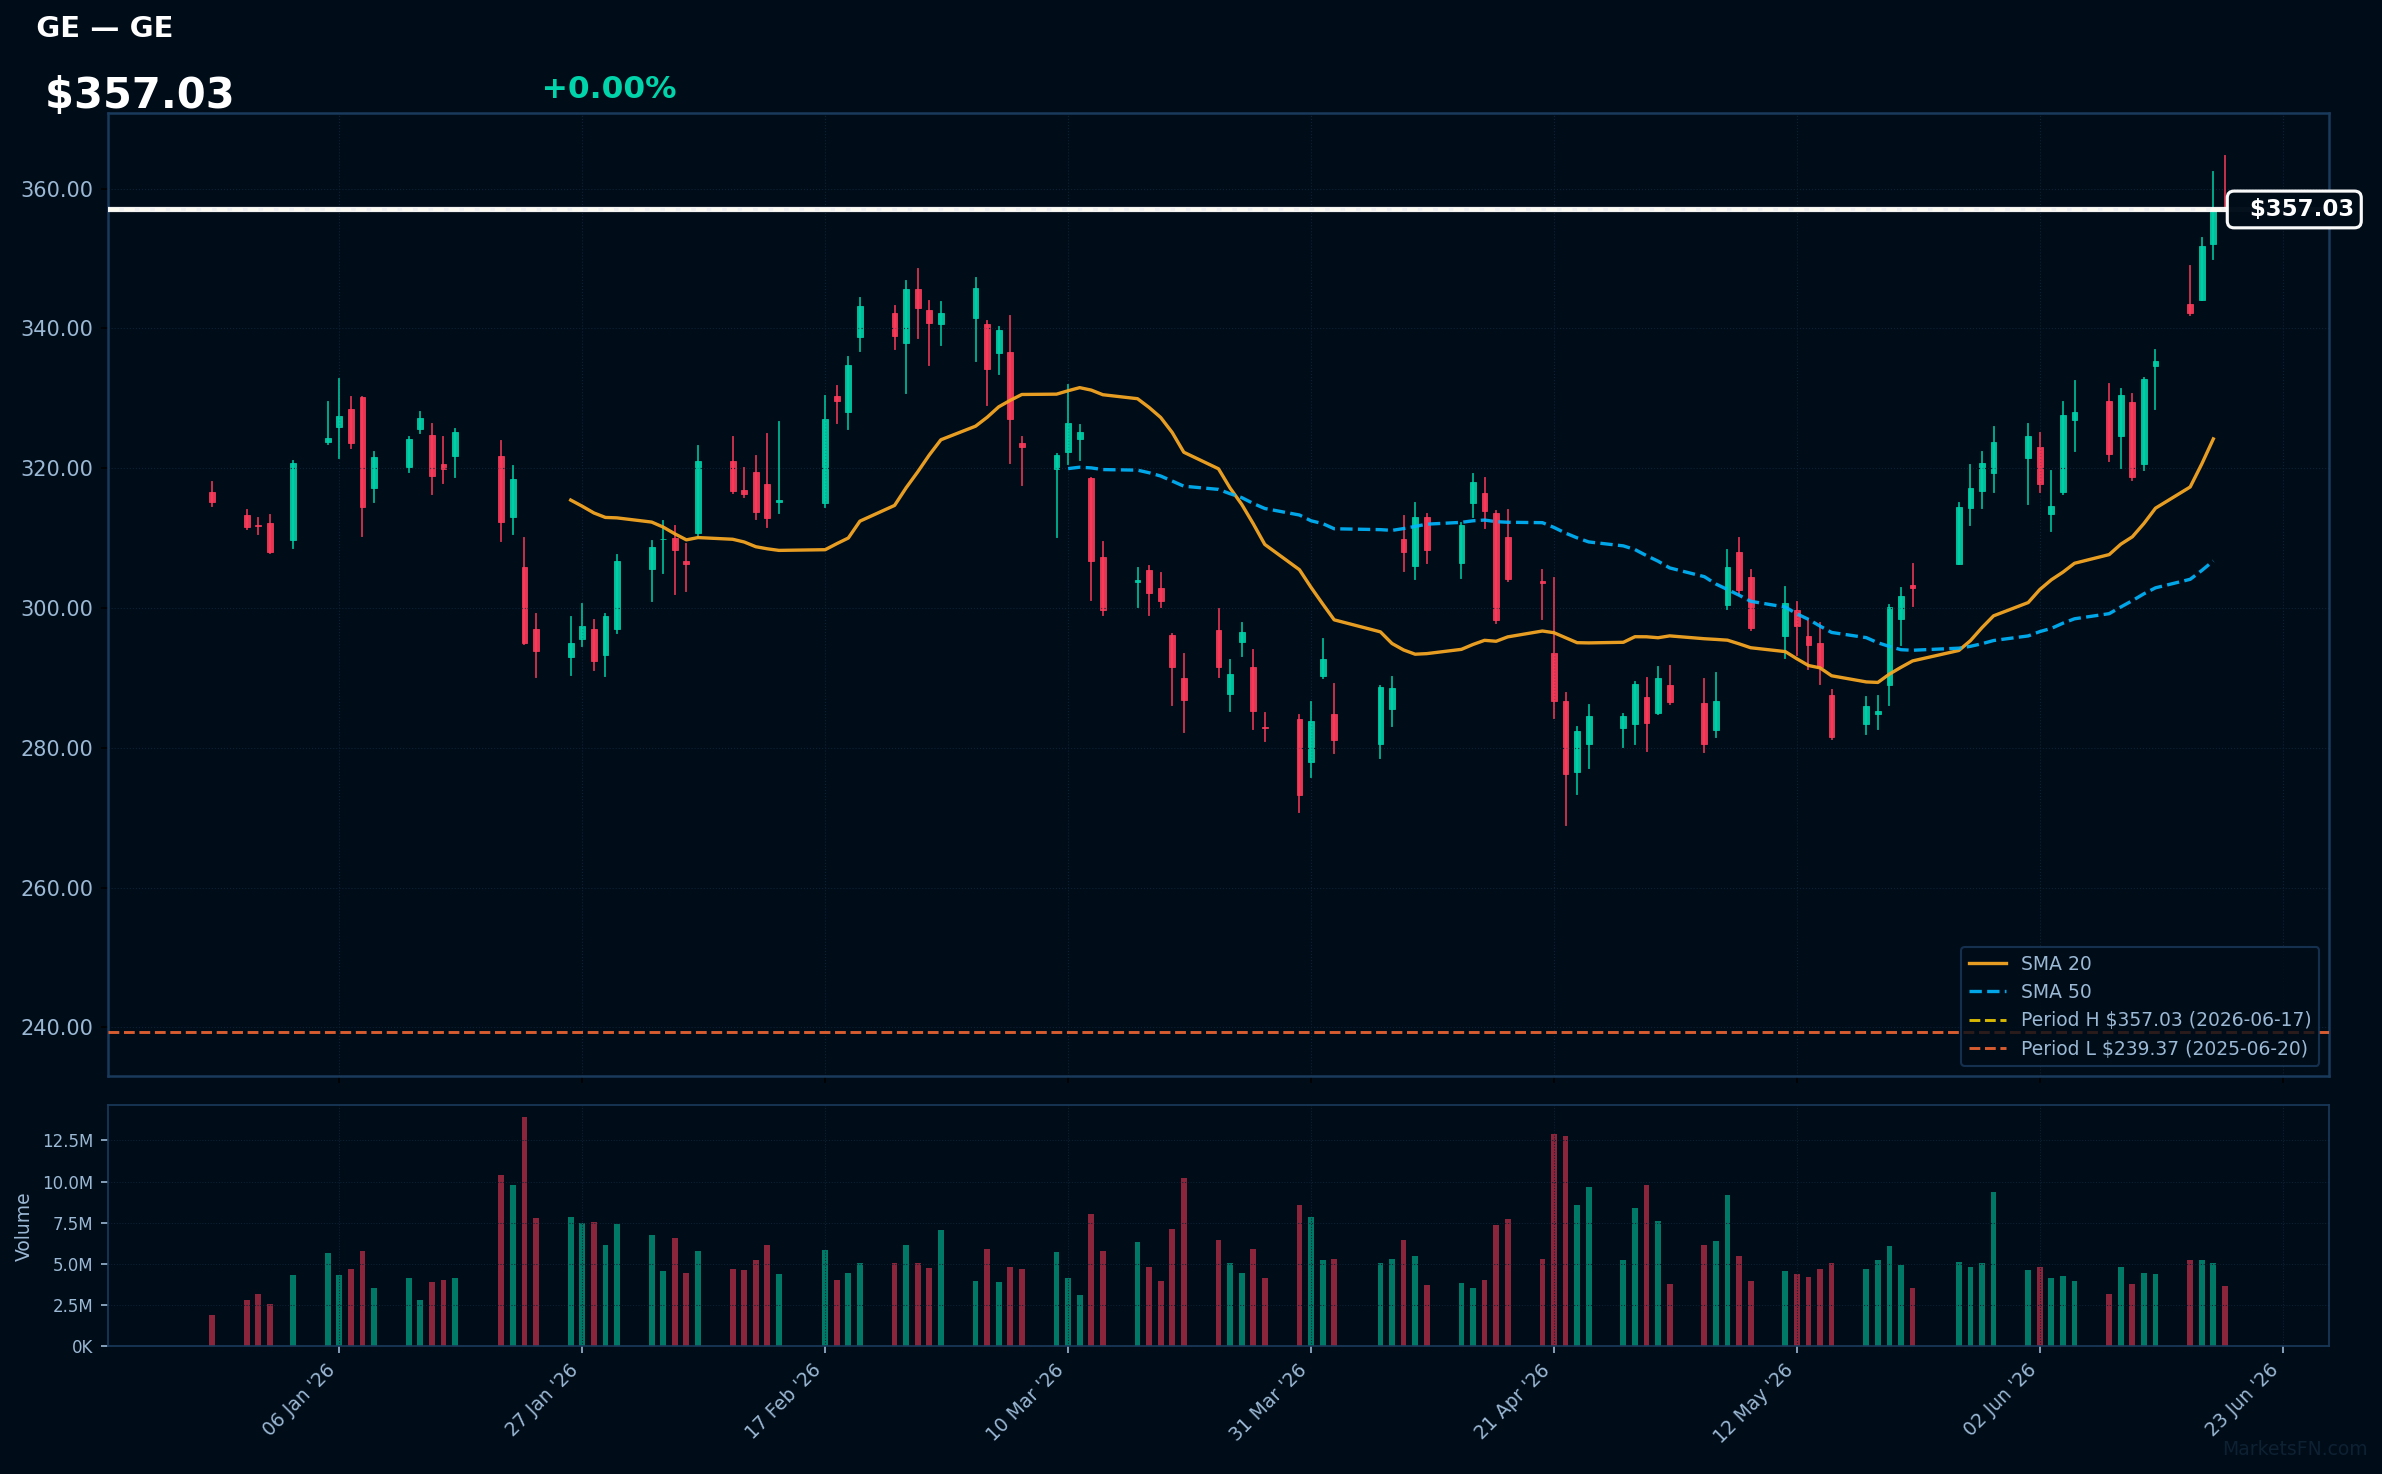
GE | GE Aerospace | Industrials | Price Last: $357.03 | % Realized: +49.15% | RSI: 71.2 | % above MA200: +17.1% | Trend: Above MA20, MA50, MA200
GE Aerospace is a leader in the aerospace industry, manufacturing commercial and military jet engines, and providing related services. Investors should care about its dominance in the market and potential for long-term growth driven by increasing air travel demand and defense spending.
GE Aerospace's current technical situation indicates strong momentum: RSI(14) is 71.2, nearing overbought territory, with a bullish MA alignment (price > MA20 > MA50 > MA200) and 0.0% below its 52-Week high, suggesting a potential breakout.
Related headlines
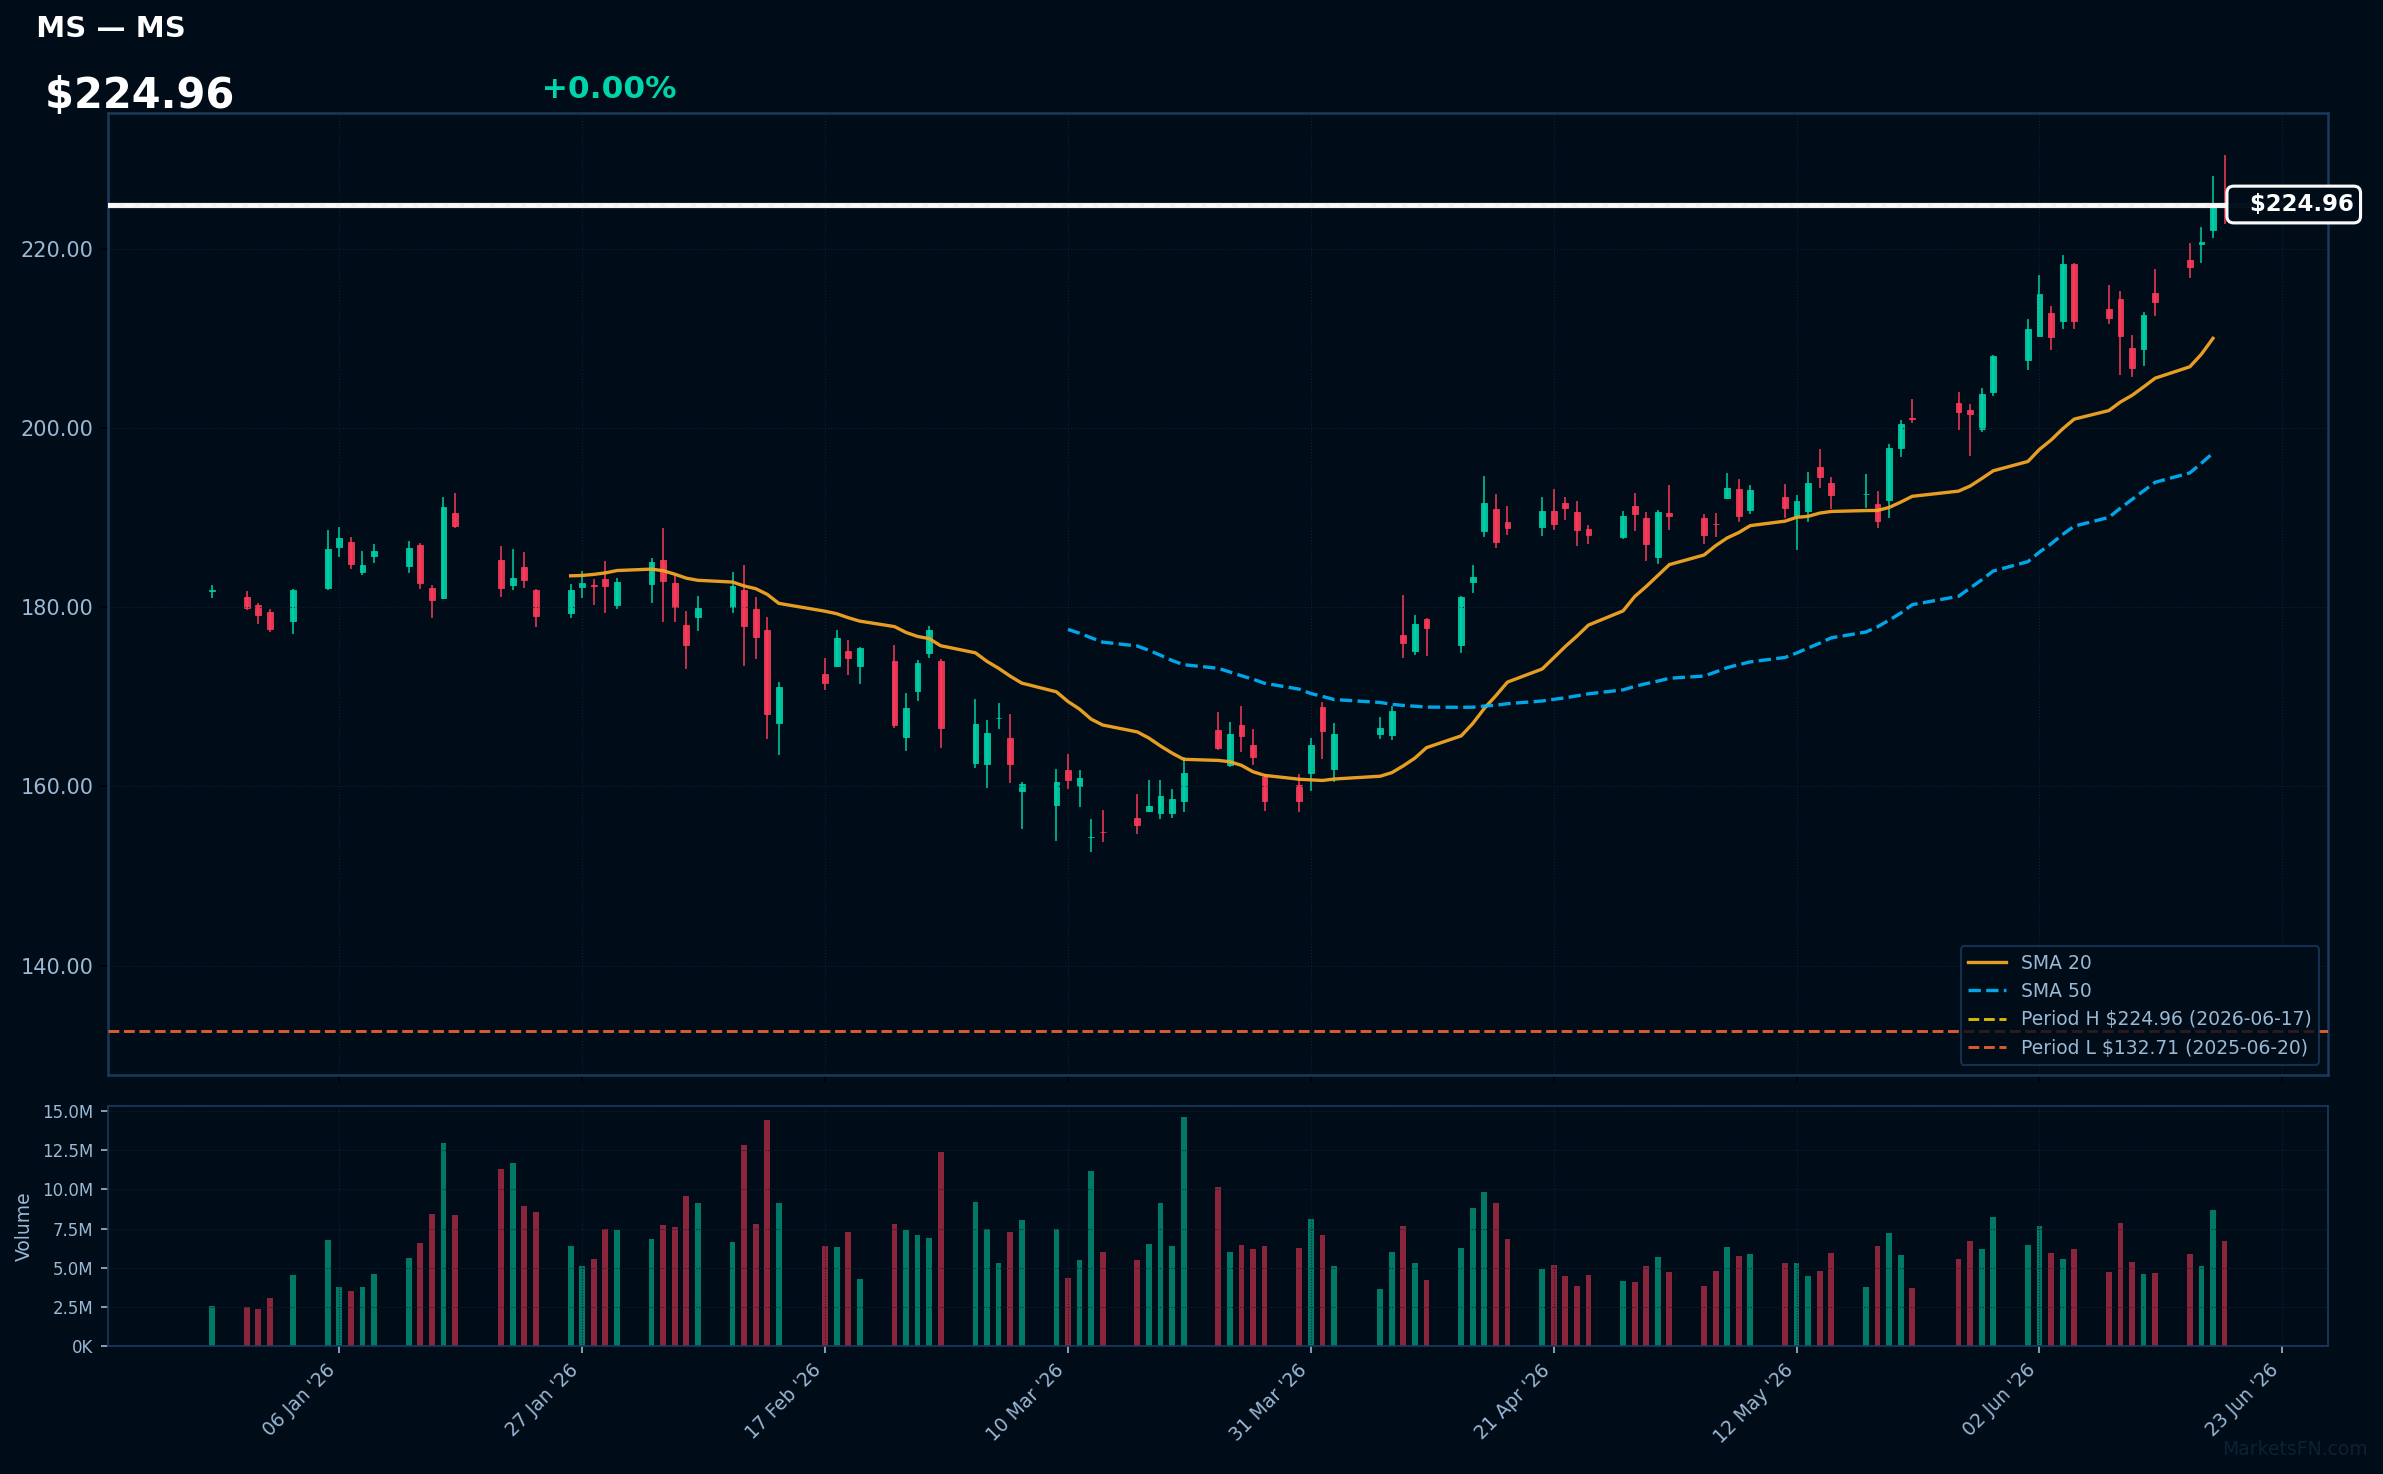
MS | Morgan Stanley | Financial | Price Last: $224.96 | % Realized: +69.51% | RSI: 71.7 | % above MA200: +28.4% | Trend: Above MA20, MA50, MA200
Morgan Stanley is a global financial services firm providing investment banking, wealth management, and investment management services. Investors should care about its diversified revenue streams and exposure to global financial markets.
Morgan Stanley's RSI is 71.7, indicating strong momentum. The stock is in a sustained uptrend with price > MA20 > MA50 > MA200, and is 0.0% below its 52-Week high, suggesting a potential breakout.
Related headlines
- The IPO Onslaught Is Forcing Bankers to Pick Teams
- Morgan Stanley Real Estate Investing Acquires Metra Living from L&Q in Partnership with Ridgeback Group for 1.045 Billion
- Goldman, Morgan Stanley Cut Q4 Oil Forecasts to $80 a Barrel
- Buy this sector after recent pullback, Morgan Stanley urges investors
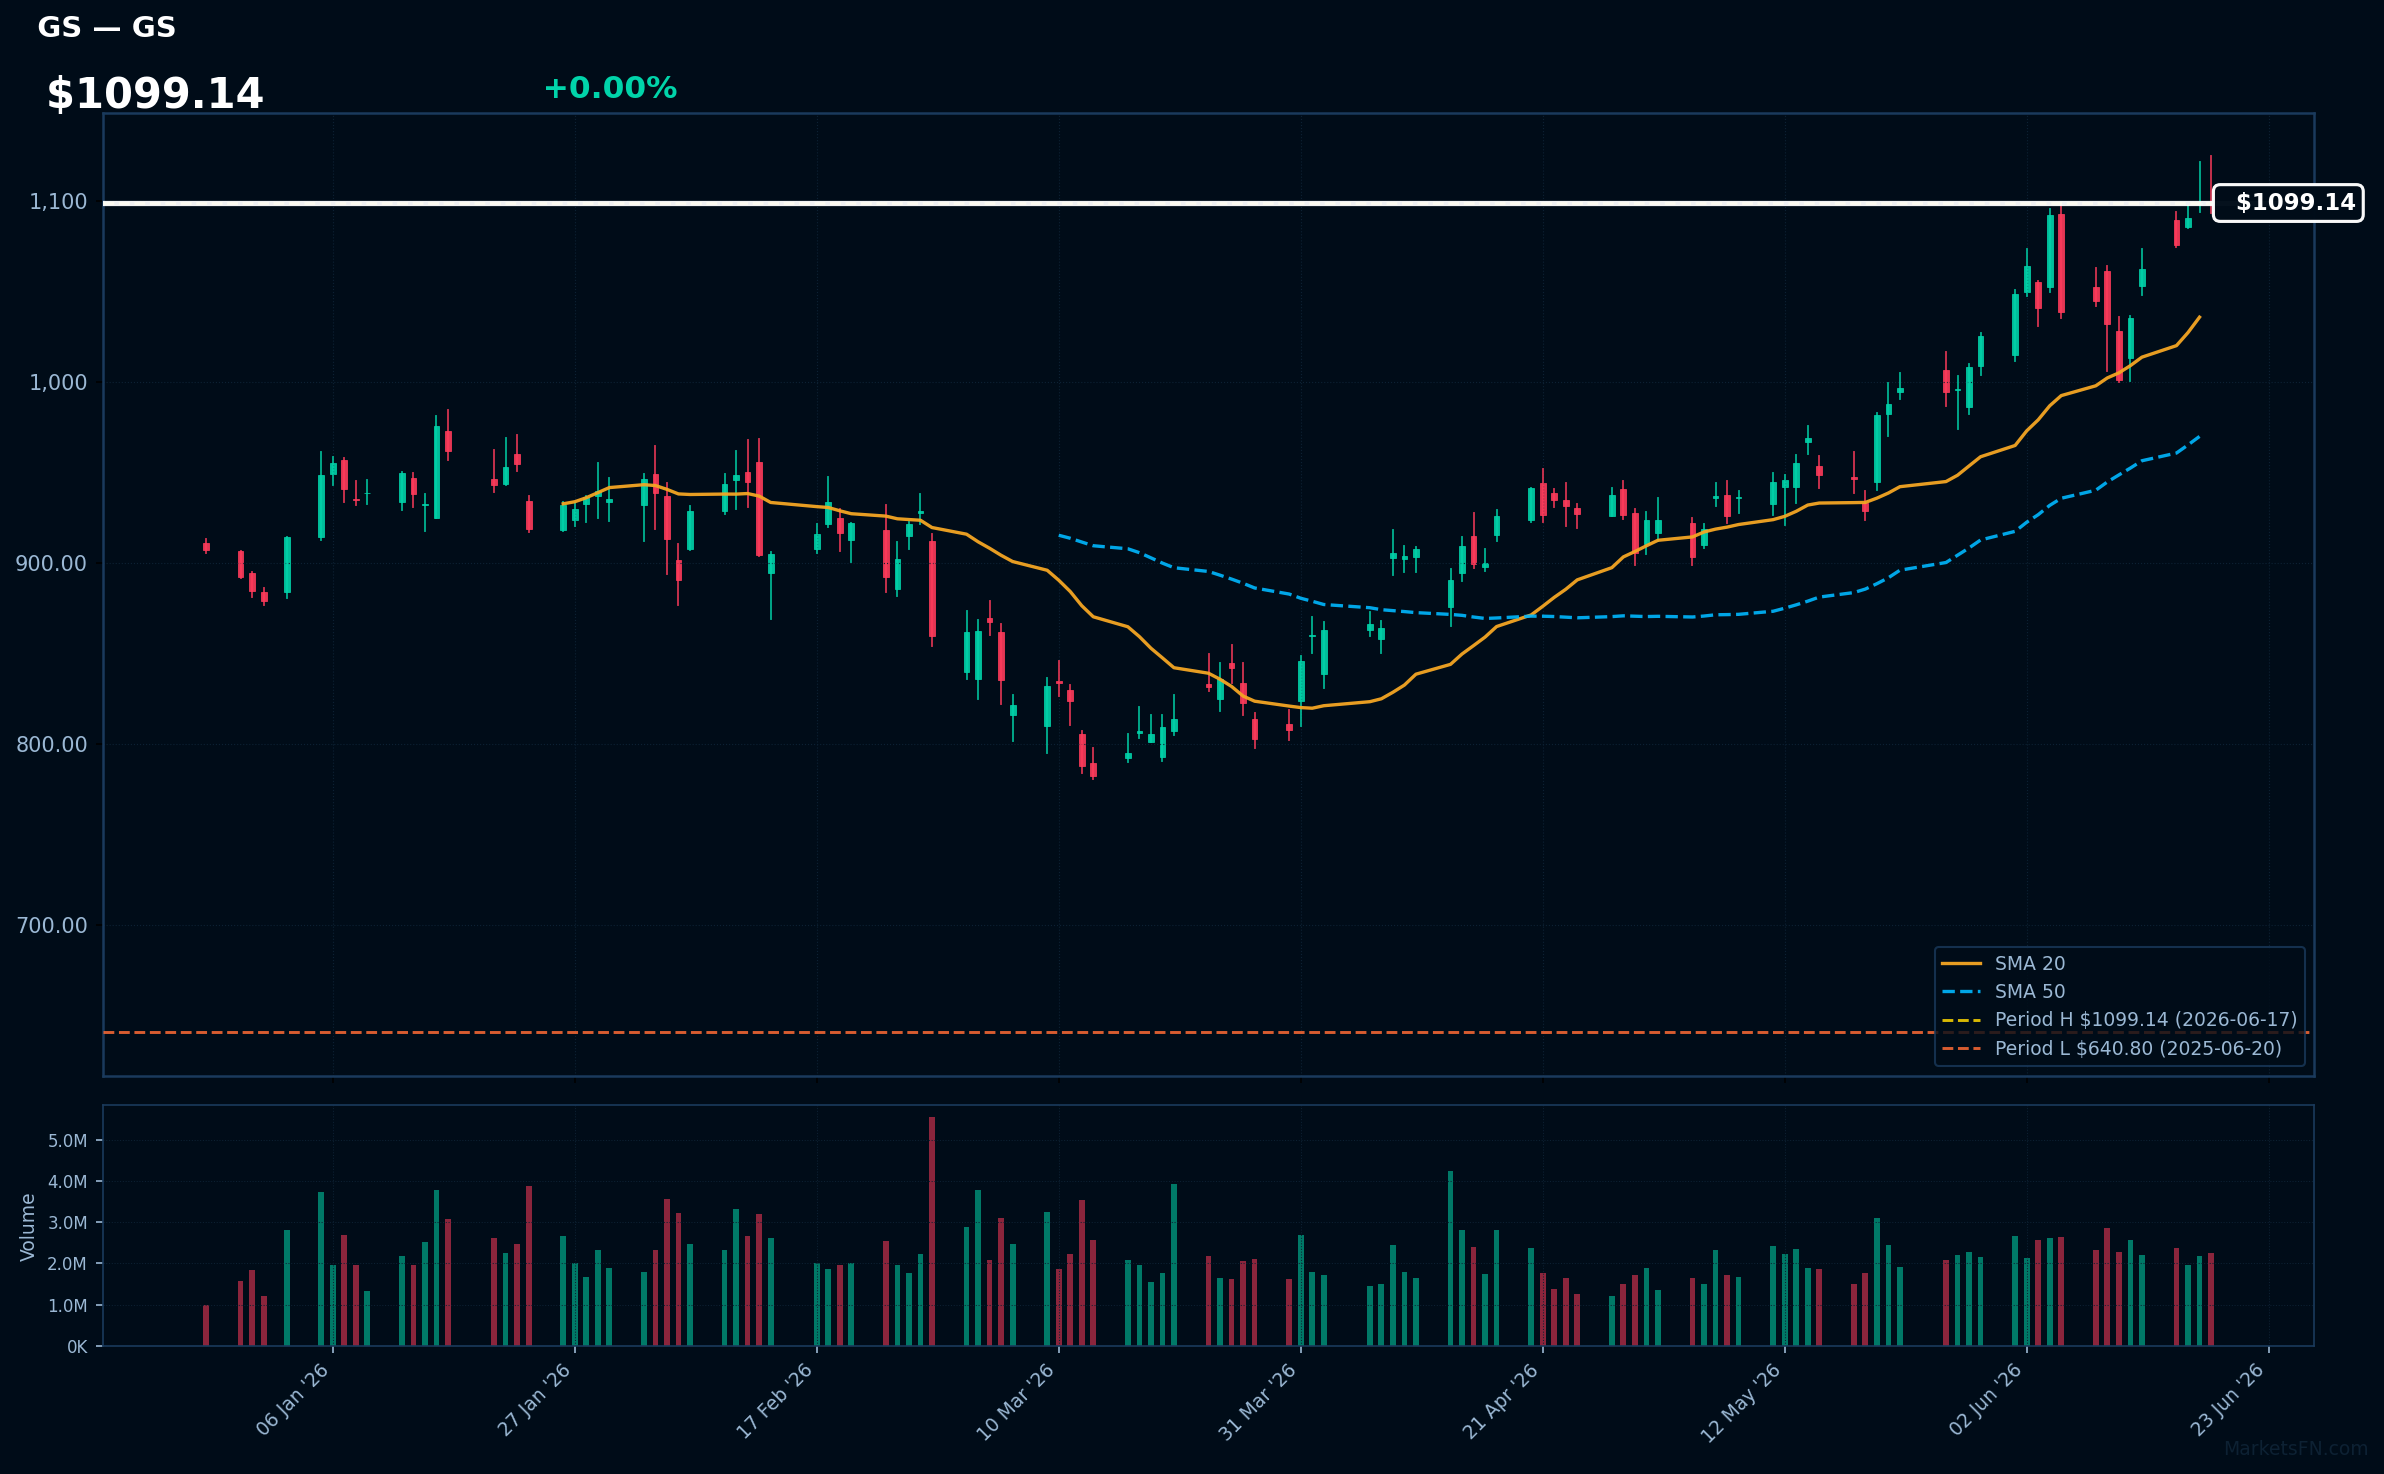
GS | Goldman Sachs Group, Inc | Financial | Price Last: $1099.14 | % Realized: +71.53% | RSI: 66.2 | % above MA200: +25.6% | Trend: Above MA20, MA50, MA200
Goldman Sachs Group, Inc is a global investment bank and financial services company, providing a wide range of financial services to corporations, governments, and high-net-worth individuals. Investors care due to its significant role in global financial markets and exposure to various asset classes.
The stock exhibits a sustained uptrend with price ($1099.14) above MA20 > MA50 > MA200, RSI(14) at 66.2, and is 0.0% below its 52-Week high, indicating strong momentum with no immediate signs of reversal, having returned 71.5% over the 52-Week period.
Related headlines
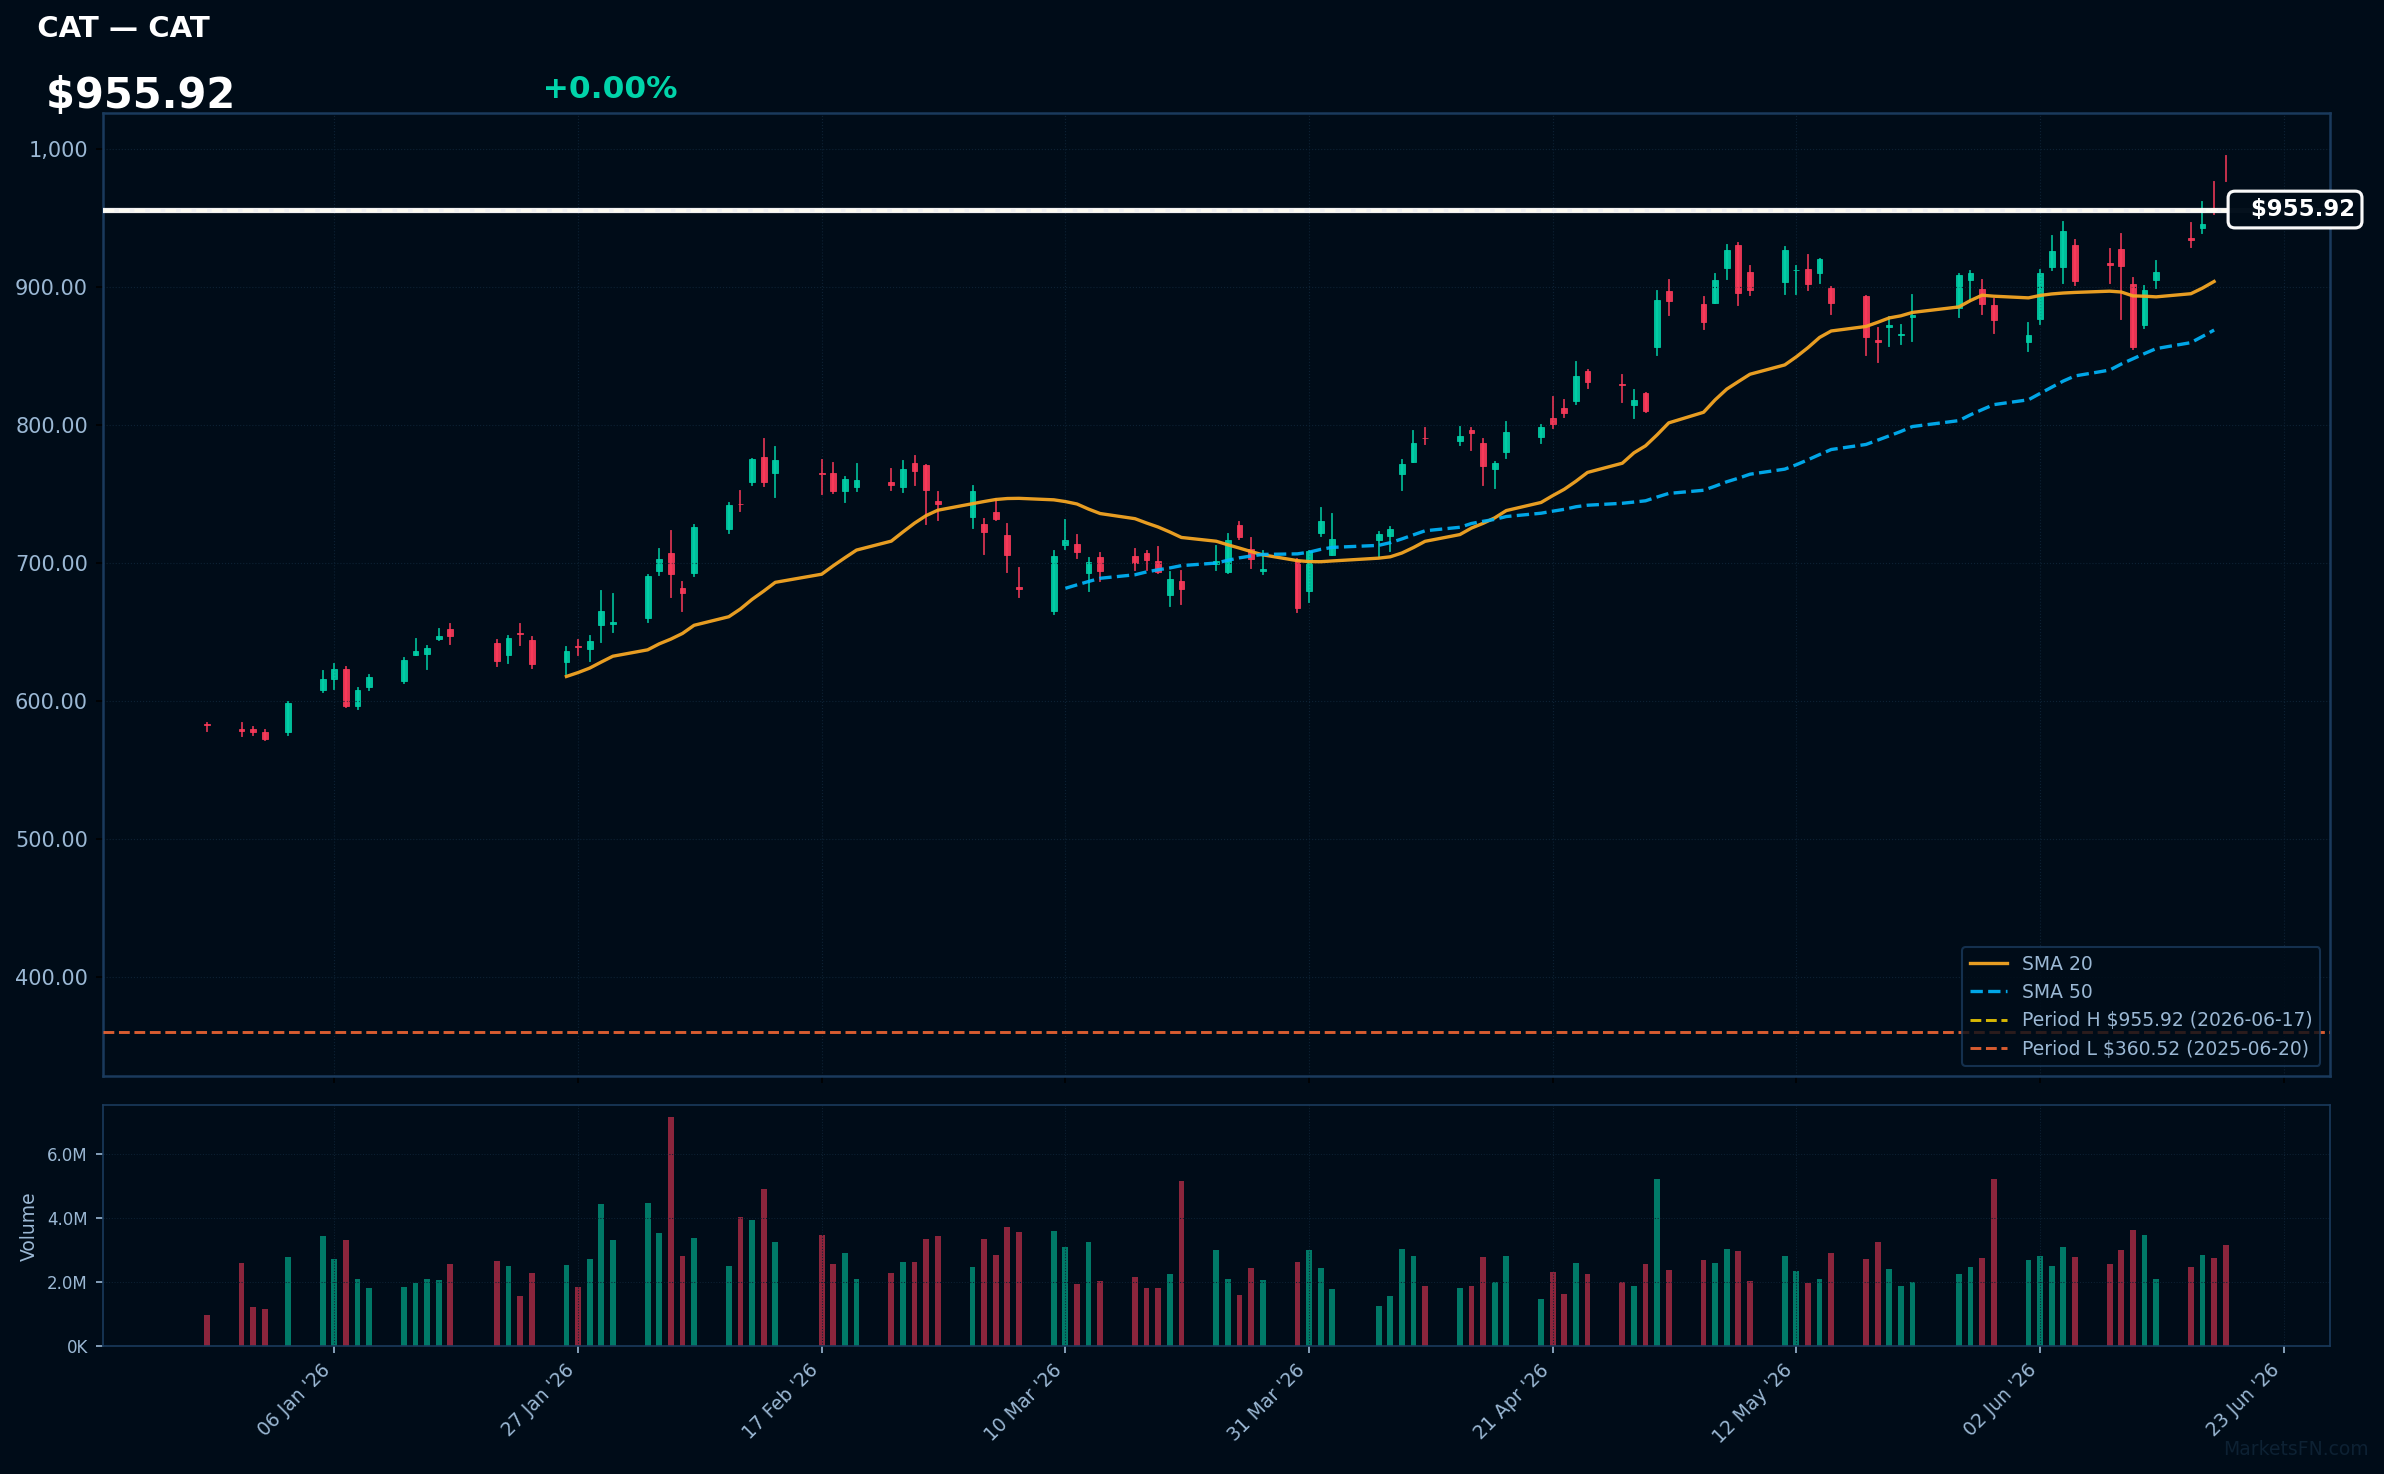
CAT | Caterpillar Inc | Industrials | Price Last: $955.92 | % Realized: +165.15% | RSI: 61.4 | % above MA200: +43.2% | Trend: Above MA20, MA50, MA200
Caterpillar Inc is a leading manufacturer of heavy machinery, engines, and financial products. Investors should care about its ability to drive growth through infrastructure spending, mining, and energy projects, as well as its aftermarket parts and services revenue stream.
Caterpillar Inc's RSI is 61.4, indicating moderate momentum. The stock is in a sustained uptrend with price > MA20 > MA50 > MA200, and is 0.0% below its 52-Week high, suggesting potential for further breakout.
Related headlines
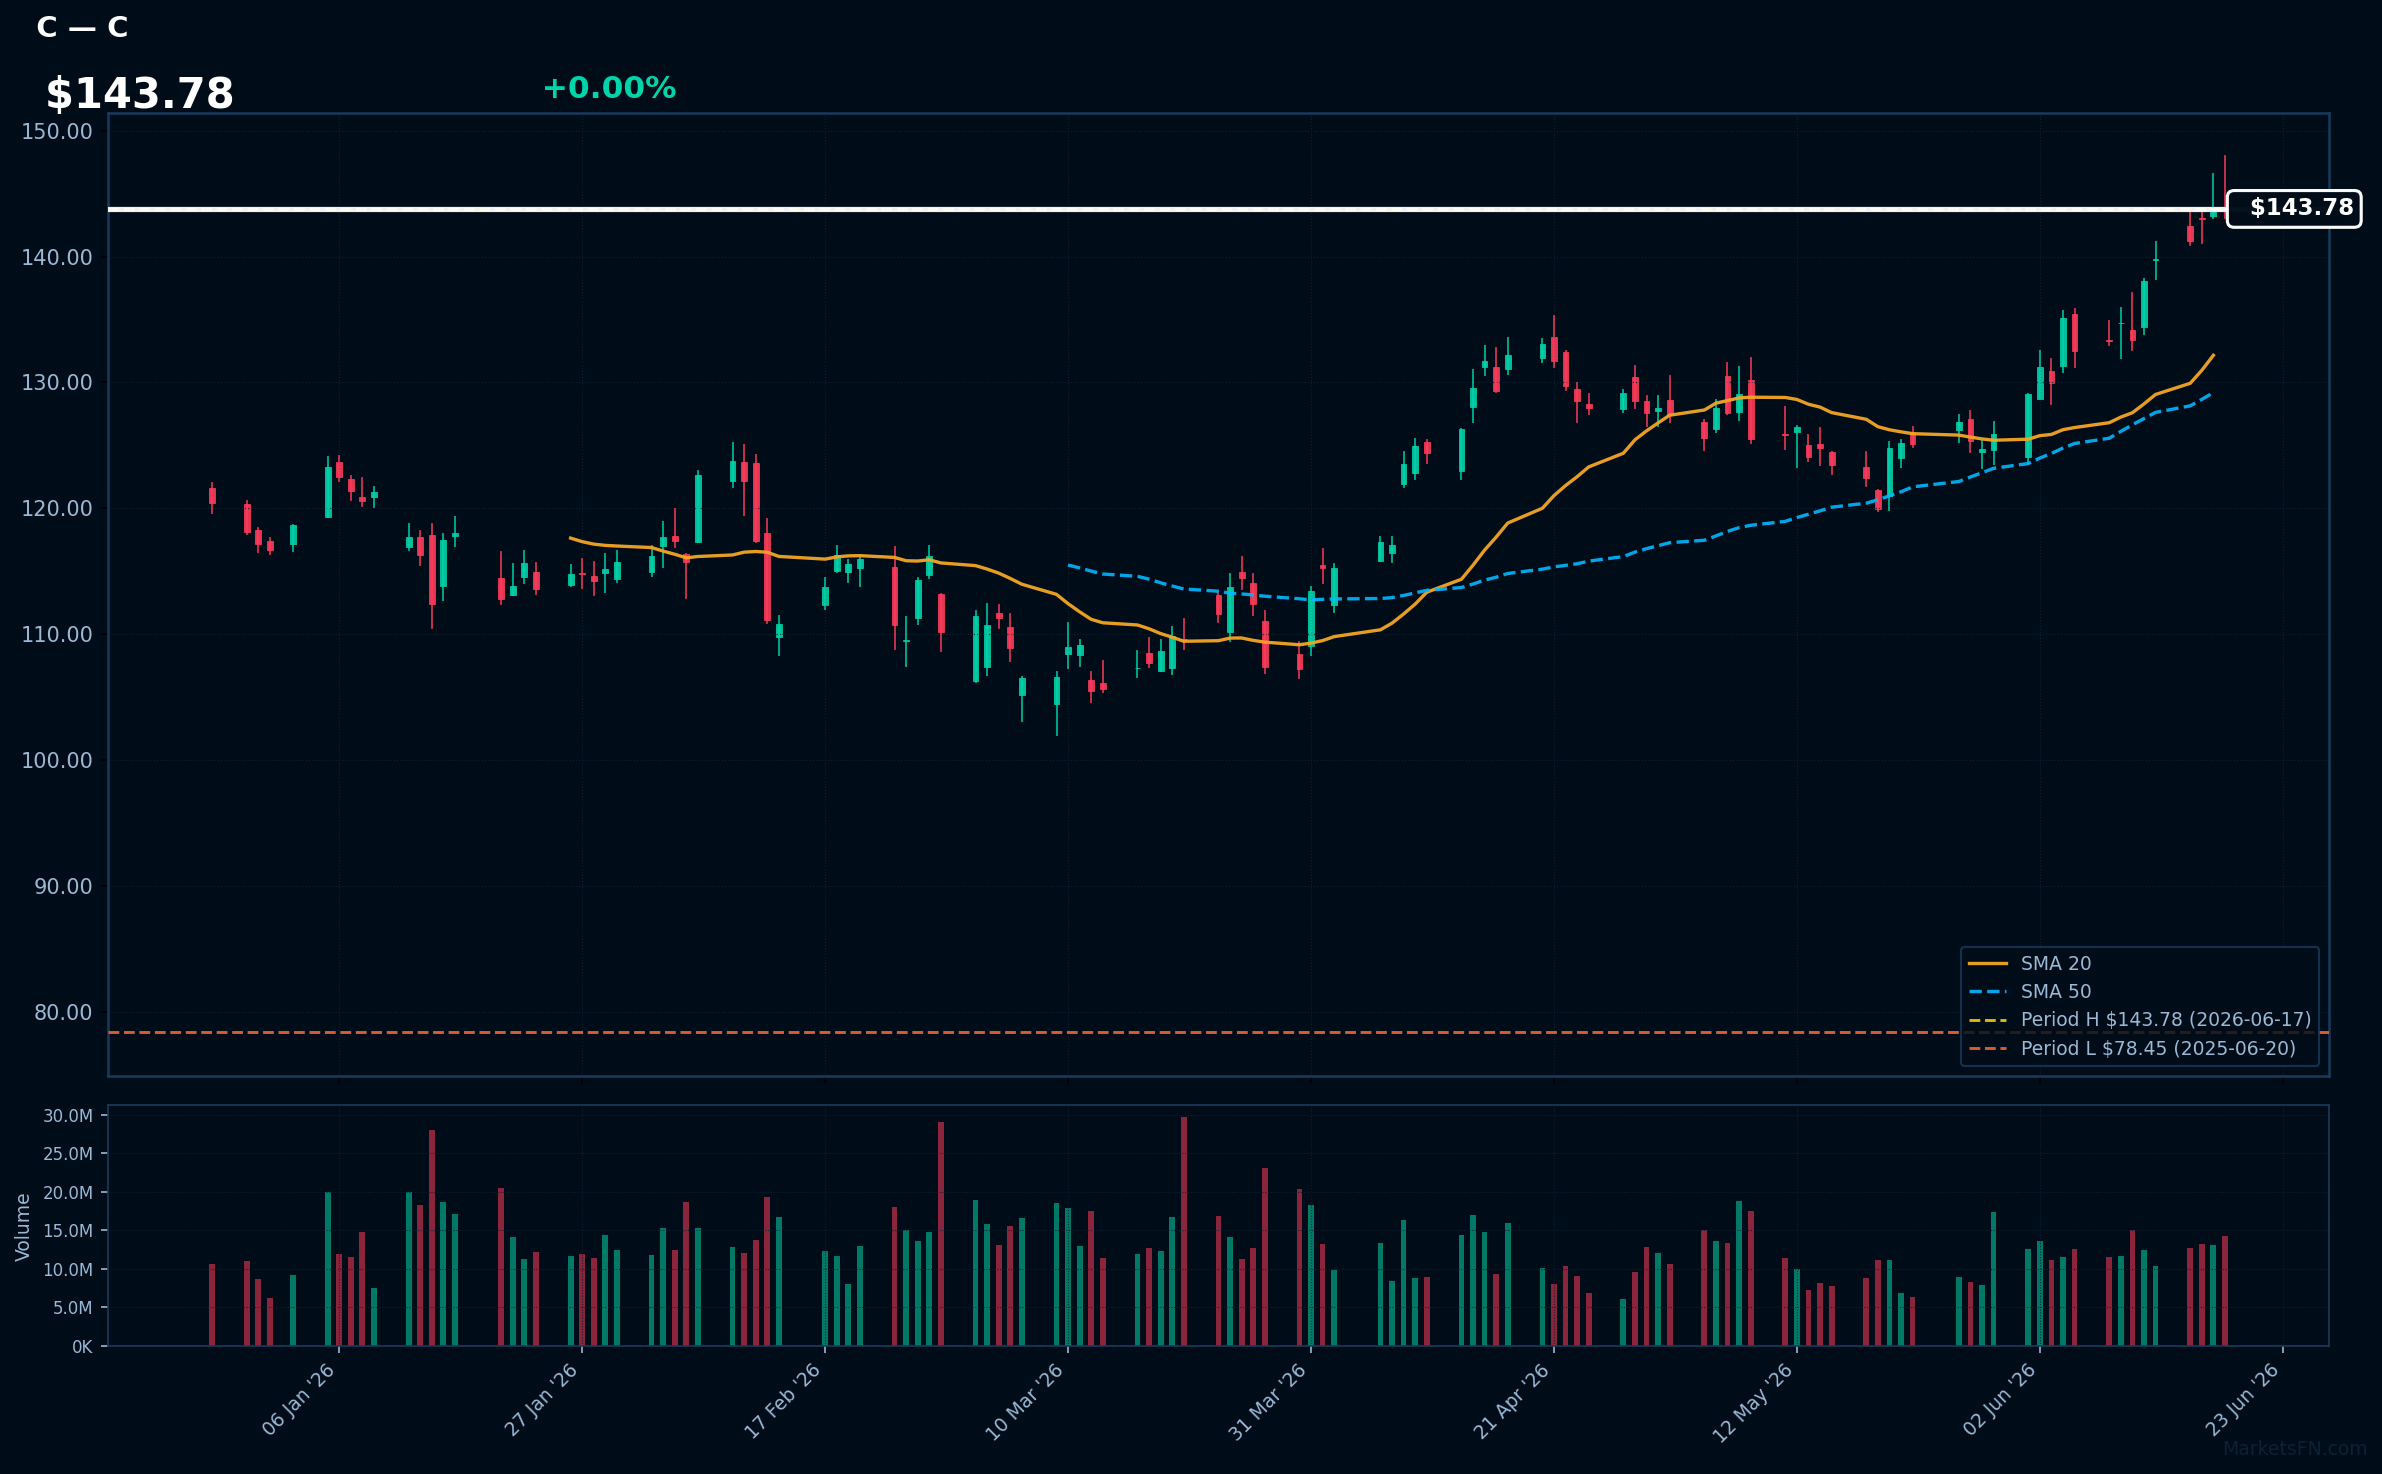
C | Citigroup Inc | Financial | Price Last: $143.78 | % Realized: +83.28% | RSI: 73.7 | % above MA200: +27.2% | Trend: Above MA20, MA50, MA200
Citigroup Inc is a global banking institution providing financial services, including consumer banking, credit, and investment products. Investors should care about its diversified revenue streams and exposure to global economic trends.
Citigroup Inc shows strong technical momentum with RSI(14) at 73.7, indicating overbought conditions, and a bullish MA alignment: price ($143.78) > MA20 > MA50 > MA200, near a 52-Week high with 83.3% 52-Week return.
Related headlines
📉 Nearest to 52-Week Low
Sectors represented: Technology (2), Healthcare (2), Communication Services (1)
| Ticker | Company | Sector | Price Last | % Realized | 52-Week Low Date | RSI | % above MA200 | Trend |
|---|---|---|---|---|---|---|---|---|
| CRM | Salesforce Inc | Technology | $155.02 | -40.52% | 2026-06-17 | 32.3 | -28.5% | Below MA20, MA50, MA200 |
| T | AT&T, Inc | Communication Services | $22.44 | -19.19% | 2026-06-17 | 32.5 | -14.1% | Below MA20, MA50, MA200 |
| INTU | Intuit Inc | Technology | $269.08 | -64.65% | 2026-06-17 | 31.8 | -48.8% | Below MA20, MA50, MA200 |
| ISRG | Intuitive Surgical Inc | Healthcare | $402.18 | -21.04% | 2026-06-17 | 37.4 | -18.1% | Below MA20, MA50, MA200 |
| BSX | Boston Scientific Corp | Healthcare | $44.95 | -55.63% | 2026-06-17 | 25.1 | -44.9% | Below MA20, MA50, MA200 |
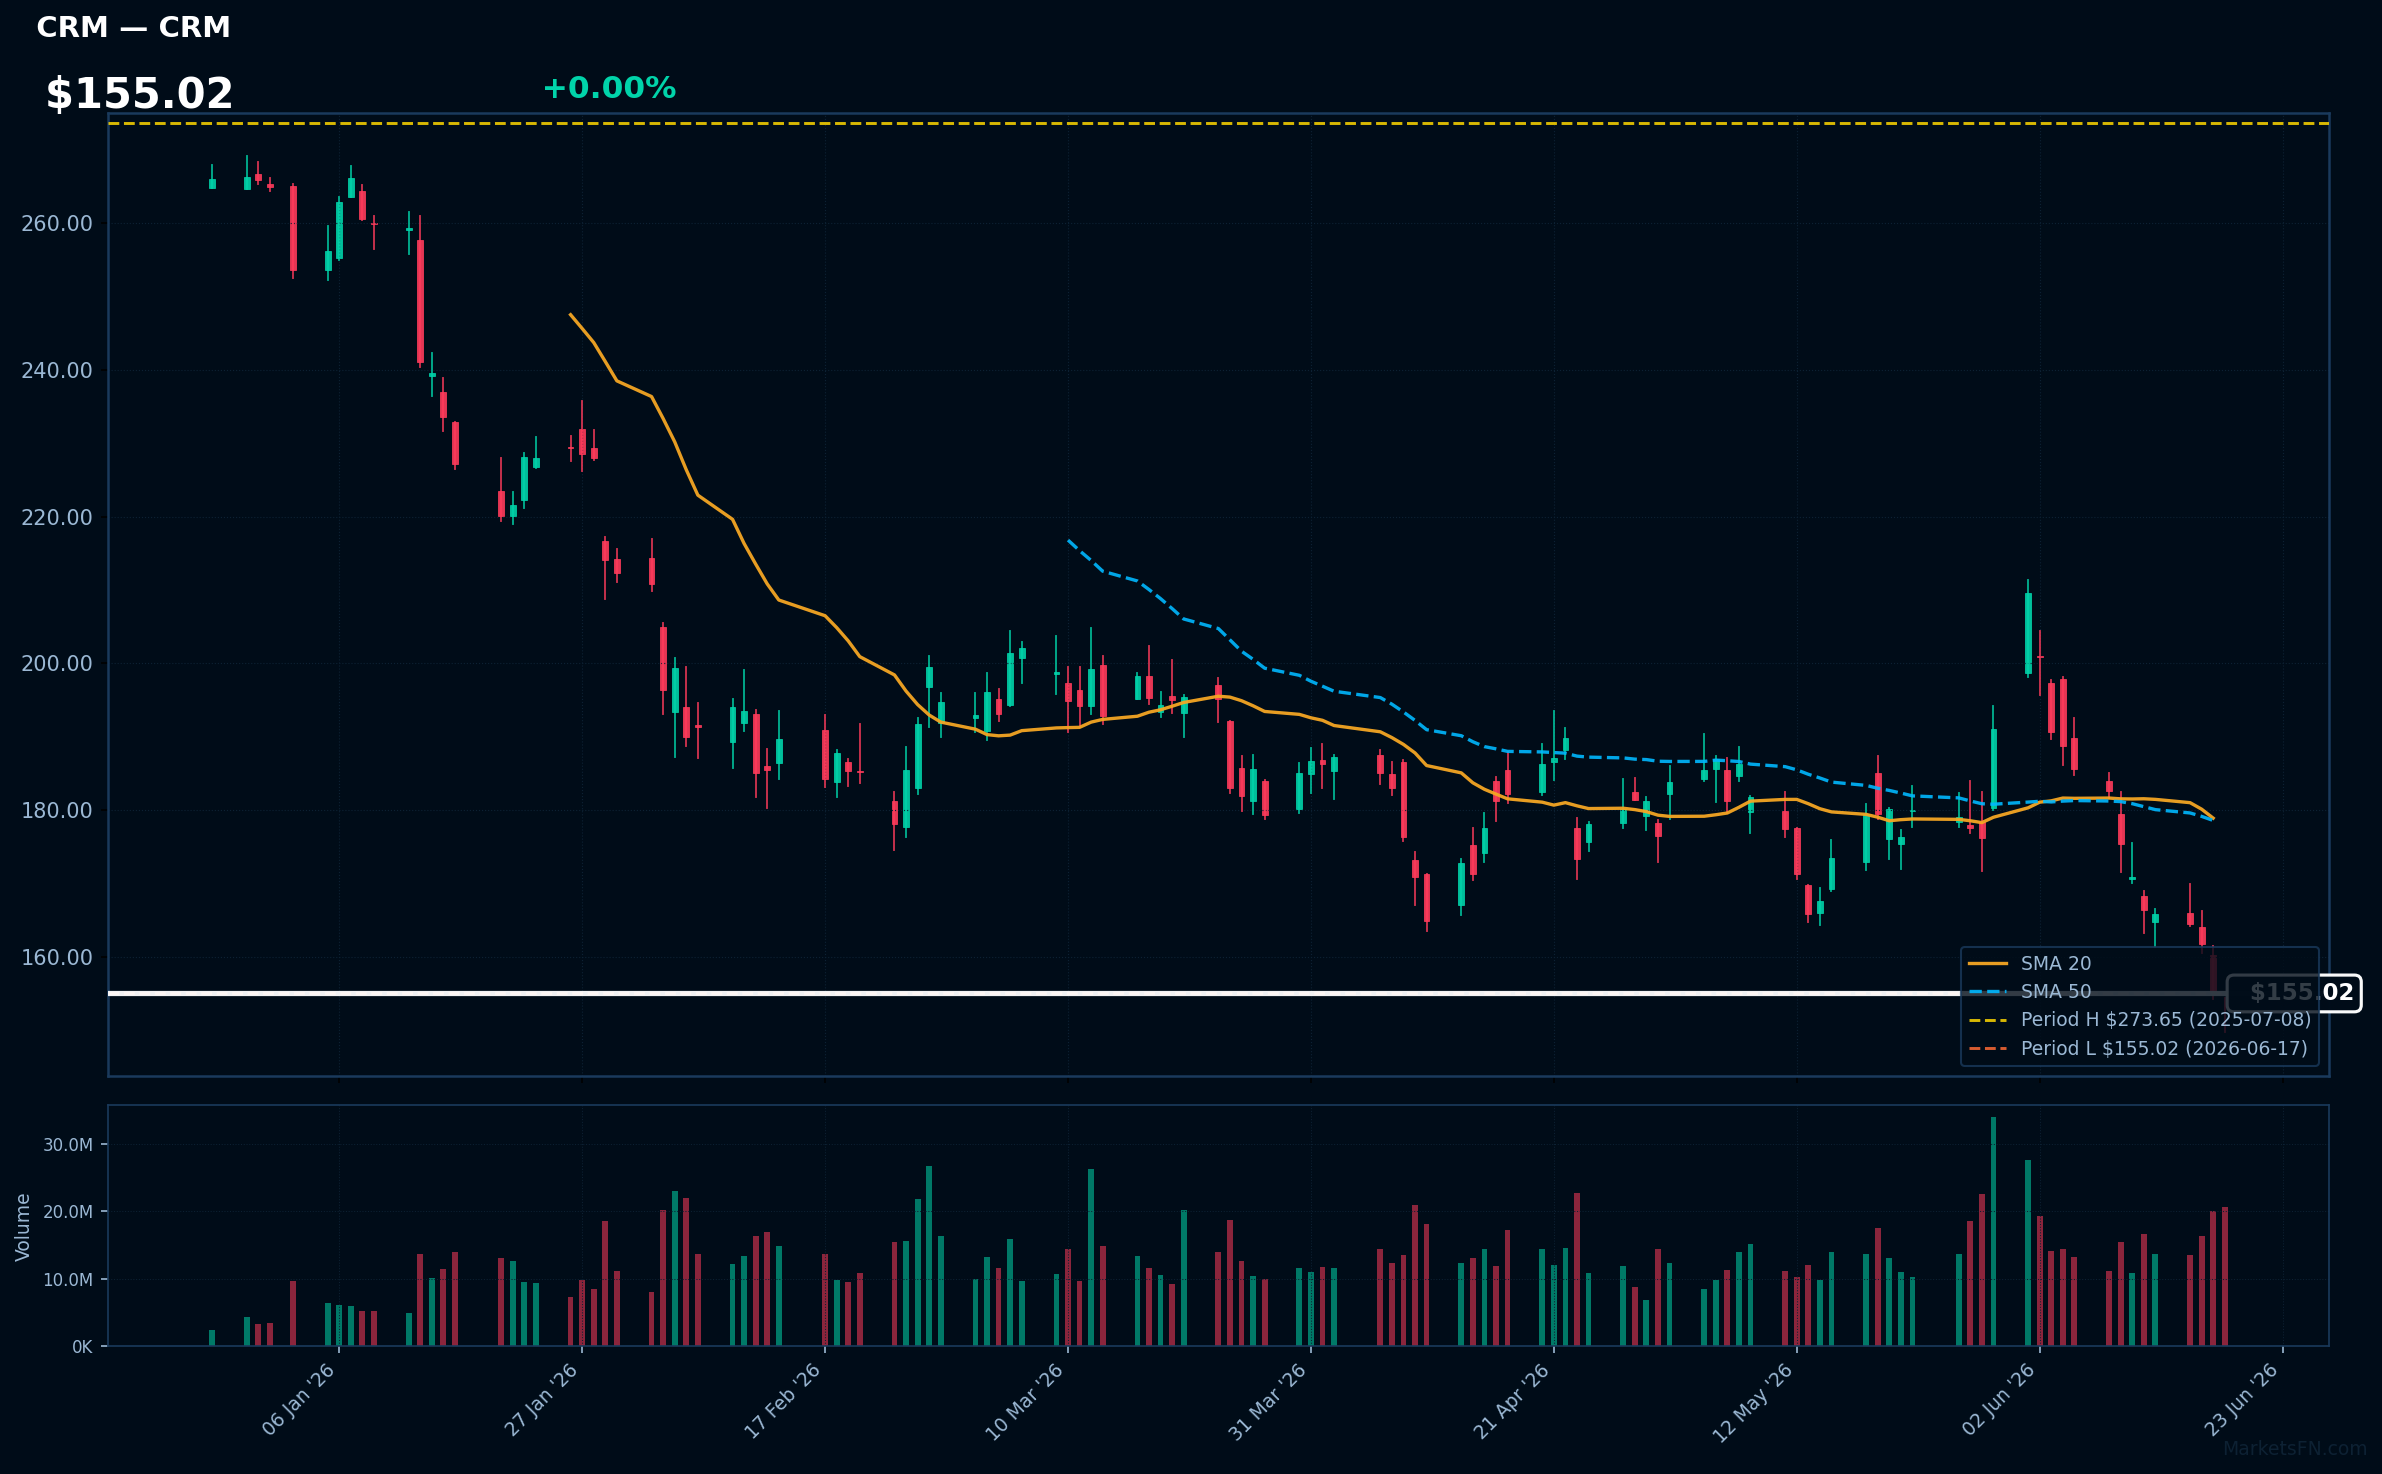
CRM | Salesforce Inc | Technology | Price Last: $155.02 | % Realized: -40.52% | RSI: 32.3 | % above MA200: -28.5% | Trend: Below MA20, MA50, MA200
Salesforce Inc is a customer relationship management (CRM) software provider, enabling businesses to manage sales, marketing, and customer service. Investors should care about its innovative cloud-based solutions and growth prospects in the expanding CRM market.
Salesforce Inc's technical situation is bearish, with an RSI(14) of 32.3 indicating oversold conditions, and the stock below MA20, MA50, and MA200. It's 0.0% above its 52-Week low, showing major support being tested after a -40.5% 52-Week return.
Related headlines
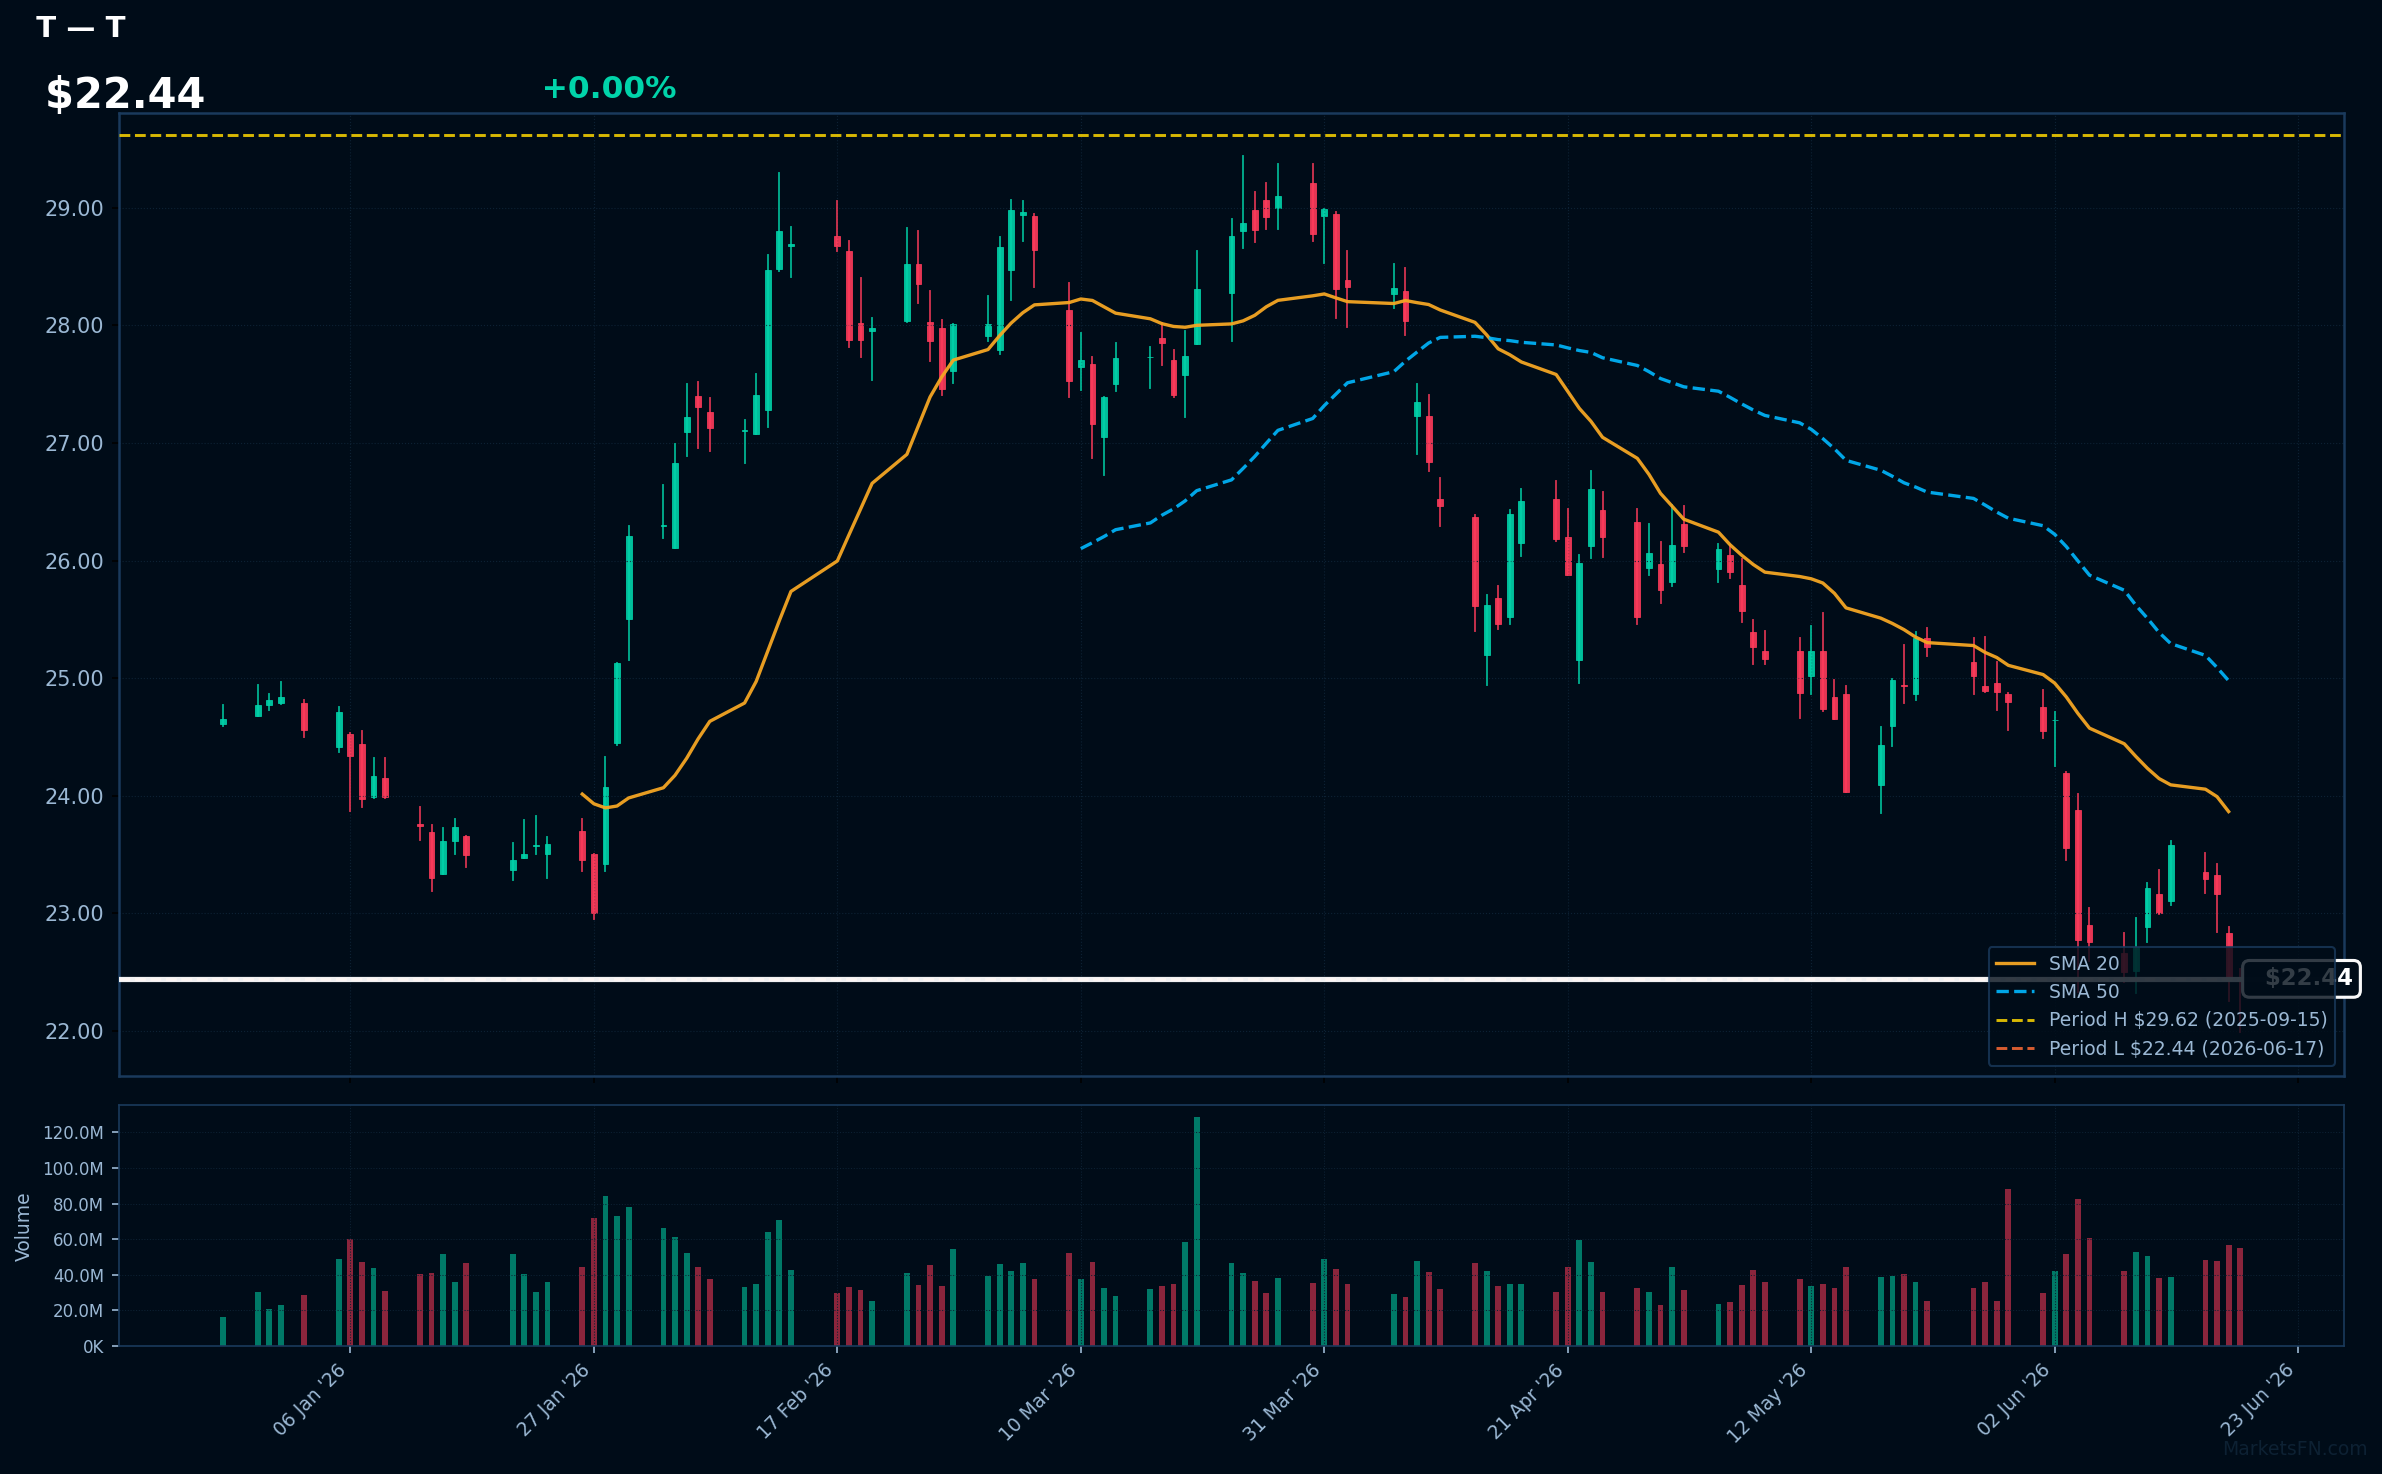
T | AT&T, Inc | Communication Services | Price Last: $22.44 | % Realized: -19.19% | RSI: 32.5 | % above MA200: -14.1% | Trend: Below MA20, MA50, MA200
AT&T, Inc is a telecommunications conglomerate providing wireless communications, local exchange, and long-distance services. Investors care due to its significant market presence and dividend yield, although its performance has been impacted by intense competition and regulatory changes.
AT&T's technical situation indicates a sustained downtrend with price ($22.44) below MA20, MA50, and MA200. The RSI(14) is 32.5, nearing oversold territory, and the stock is at its 52-Week low, testing major support, potentially a warning sign.
Related headlines
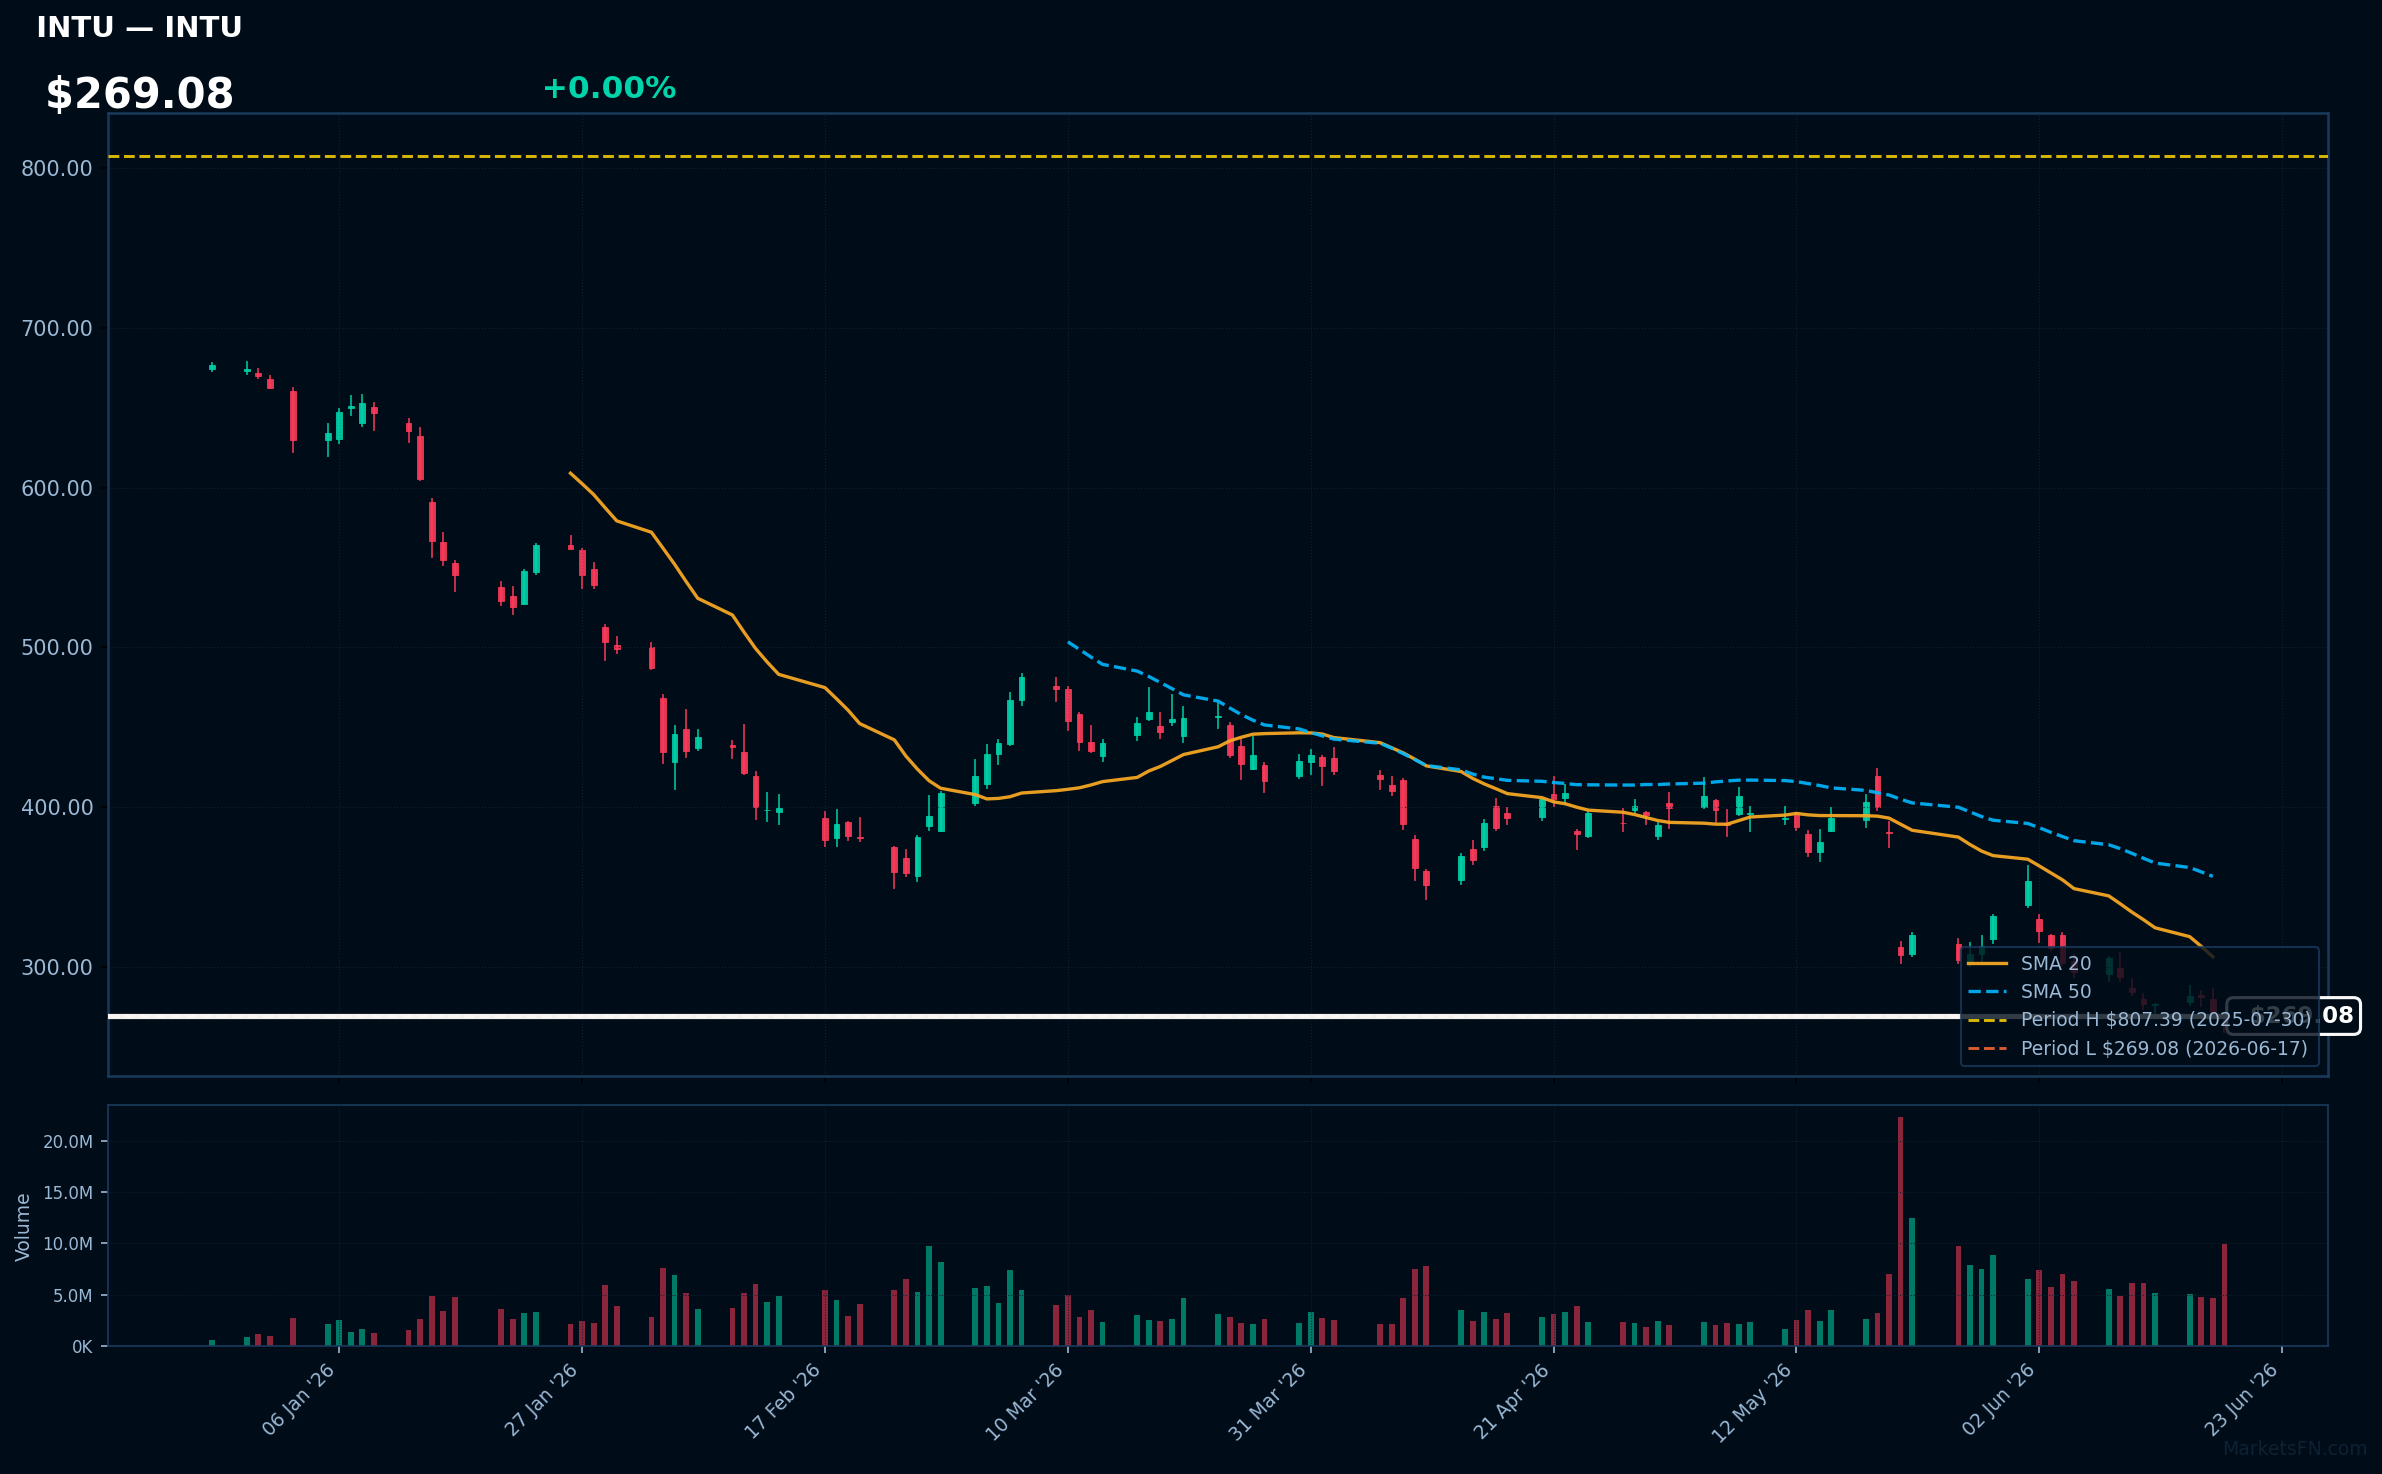
INTU | Intuit Inc | Technology | Price Last: $269.08 | % Realized: -64.65% | RSI: 31.8 | % above MA200: -48.8% | Trend: Below MA20, MA50, MA200
Intuit Inc (INTU) provides financial management solutions, including QuickBooks for small businesses and TurboTax for individual tax preparation, making it a key player in the financial software space with significant exposure to the US tax and accounting markets.
INTU's technical situation is bearish, with an RSI(14) of 31.8 indicating oversold conditions, price below all key MAs (MA20, MA50, MA200), and a 52-Week low test, suggesting a sustained downtrend and potential further downside; the stock has lost 64.6% over the 52-Week period.
Related headlines
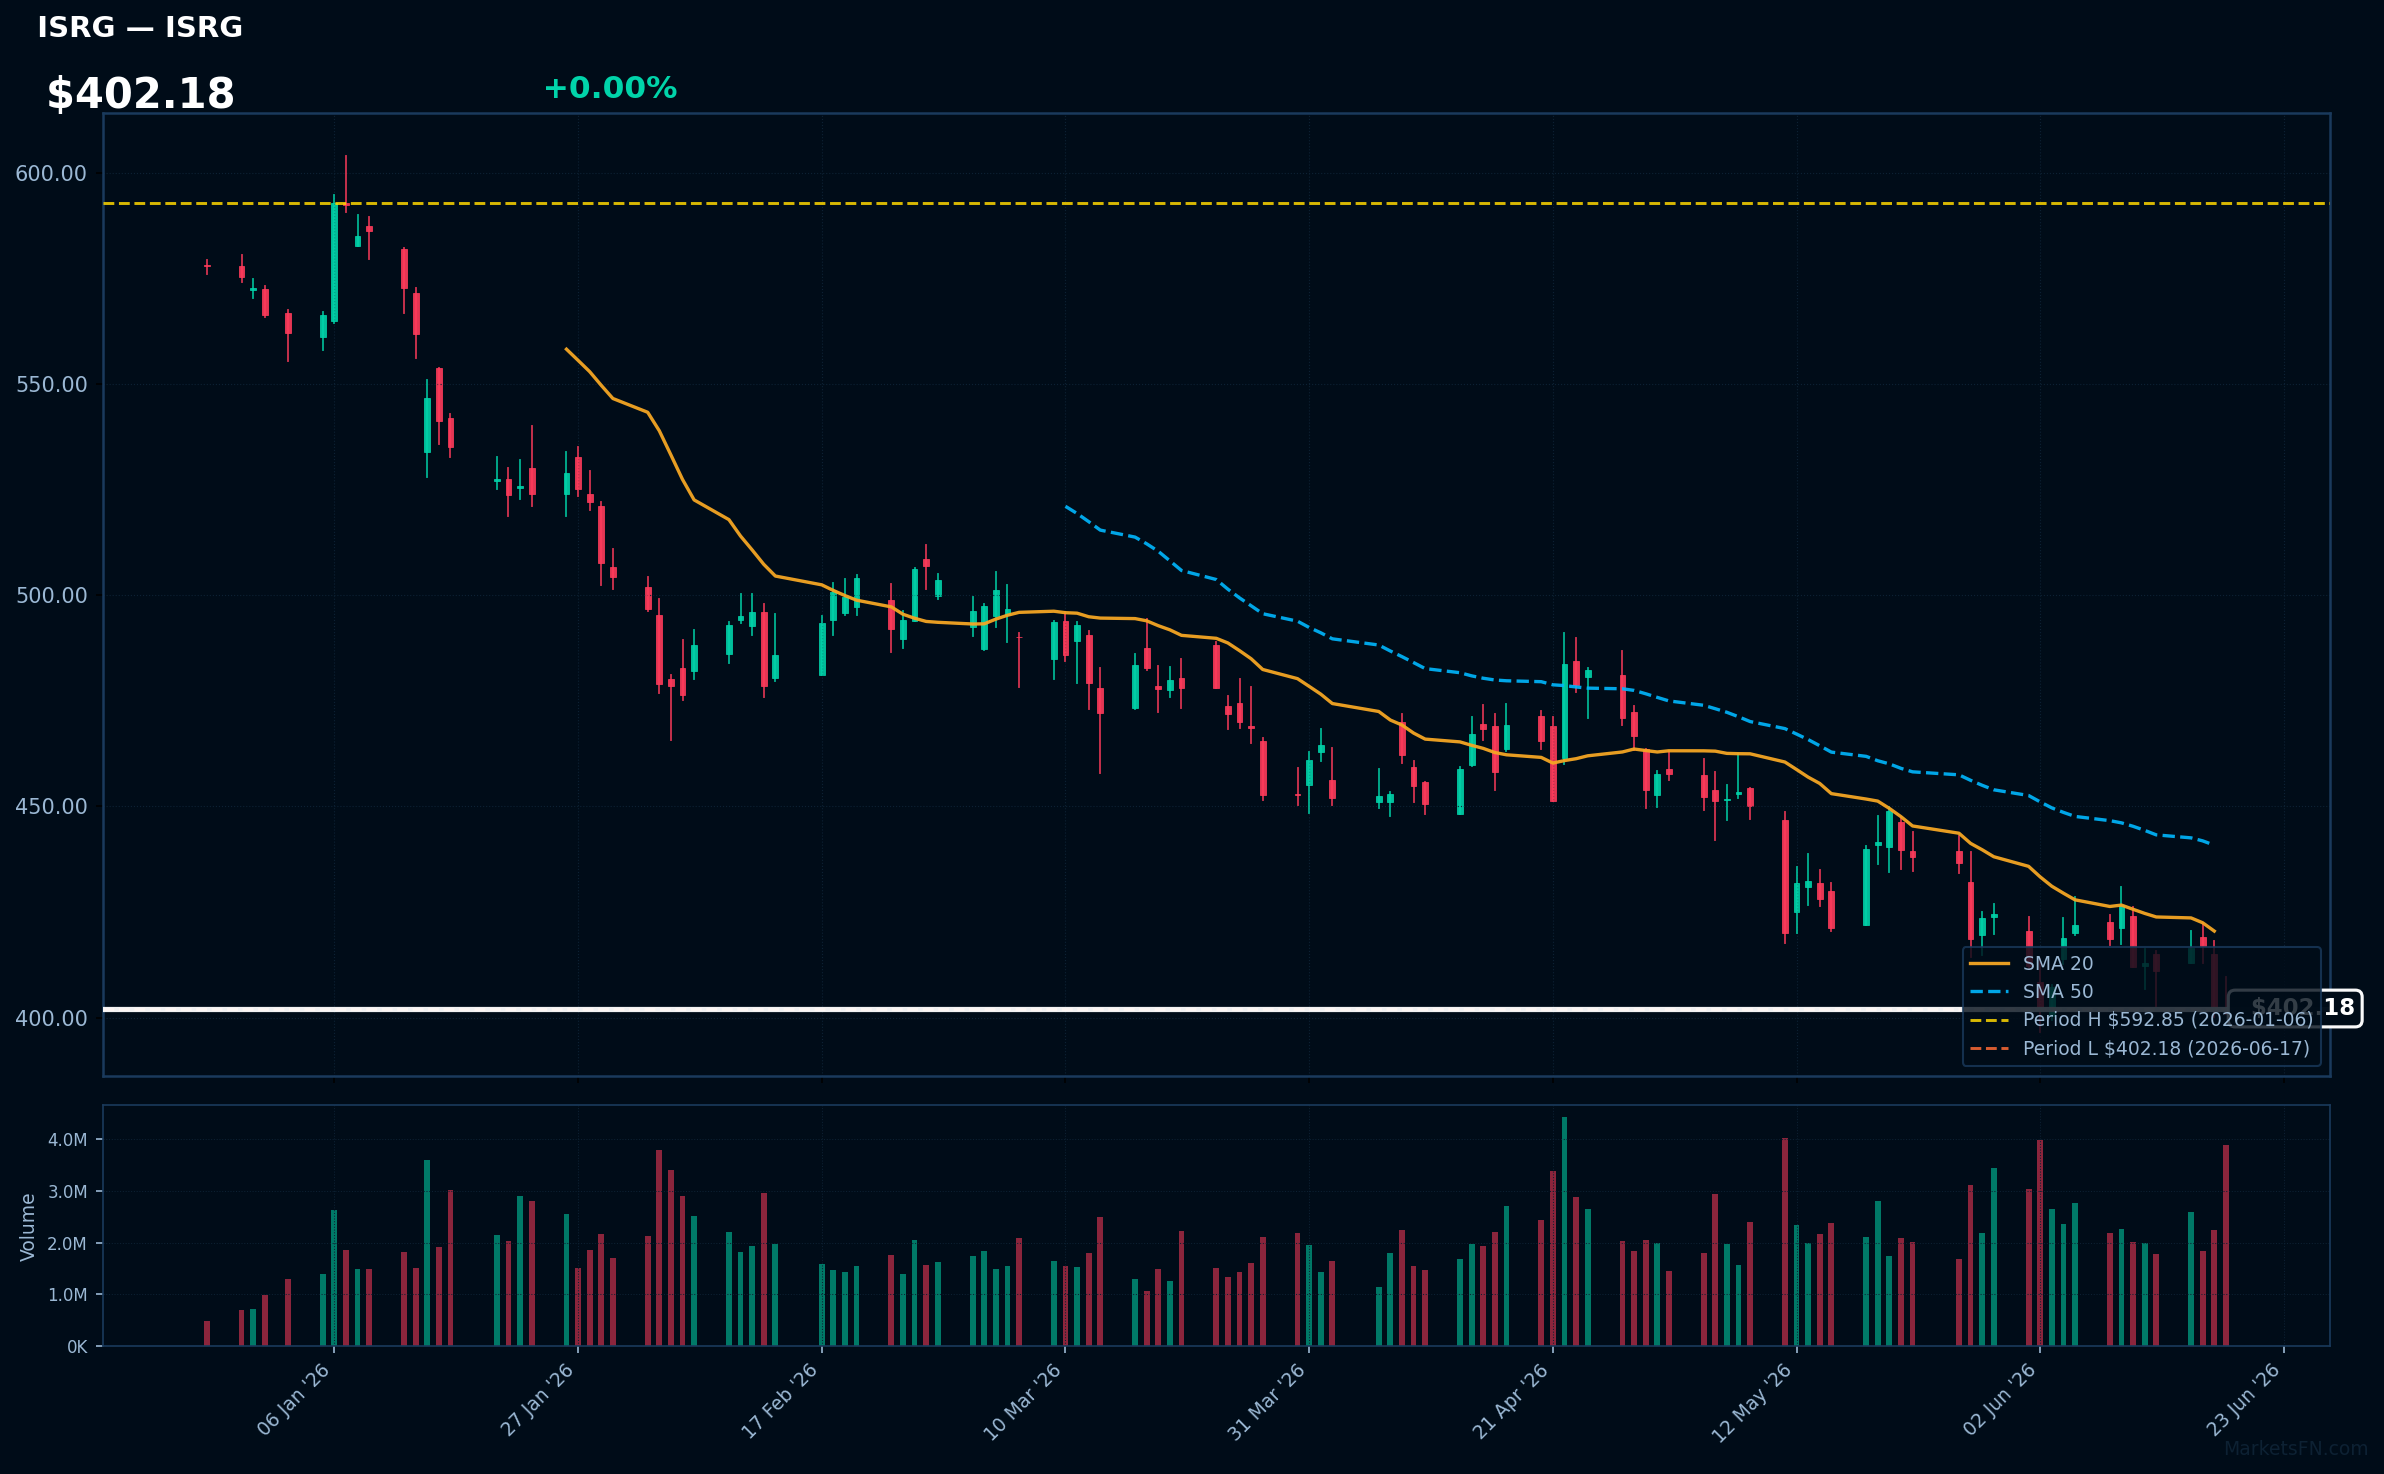
ISRG | Intuitive Surgical Inc | Healthcare | Price Last: $402.18 | % Realized: -21.04% | RSI: 37.4 | % above MA200: -18.1% | Trend: Below MA20, MA50, MA200
Intuitive Surgical Inc develops and markets robotic-assisted surgical systems, primarily the da Vinci Surgical System, enabling minimally invasive surgeries. Investors should care as its technology adoption drives growth, and its market dominance impacts the surgical robotics industry.
ISRG's technical situation is bearish, with an RSI(14) of 37.4 indicating oversold conditions, and a sustained downtrend as price ($402.18) remains below MA20, MA50, and MA200. The stock is at its 52-Week low, a potential support level.
Related headlines
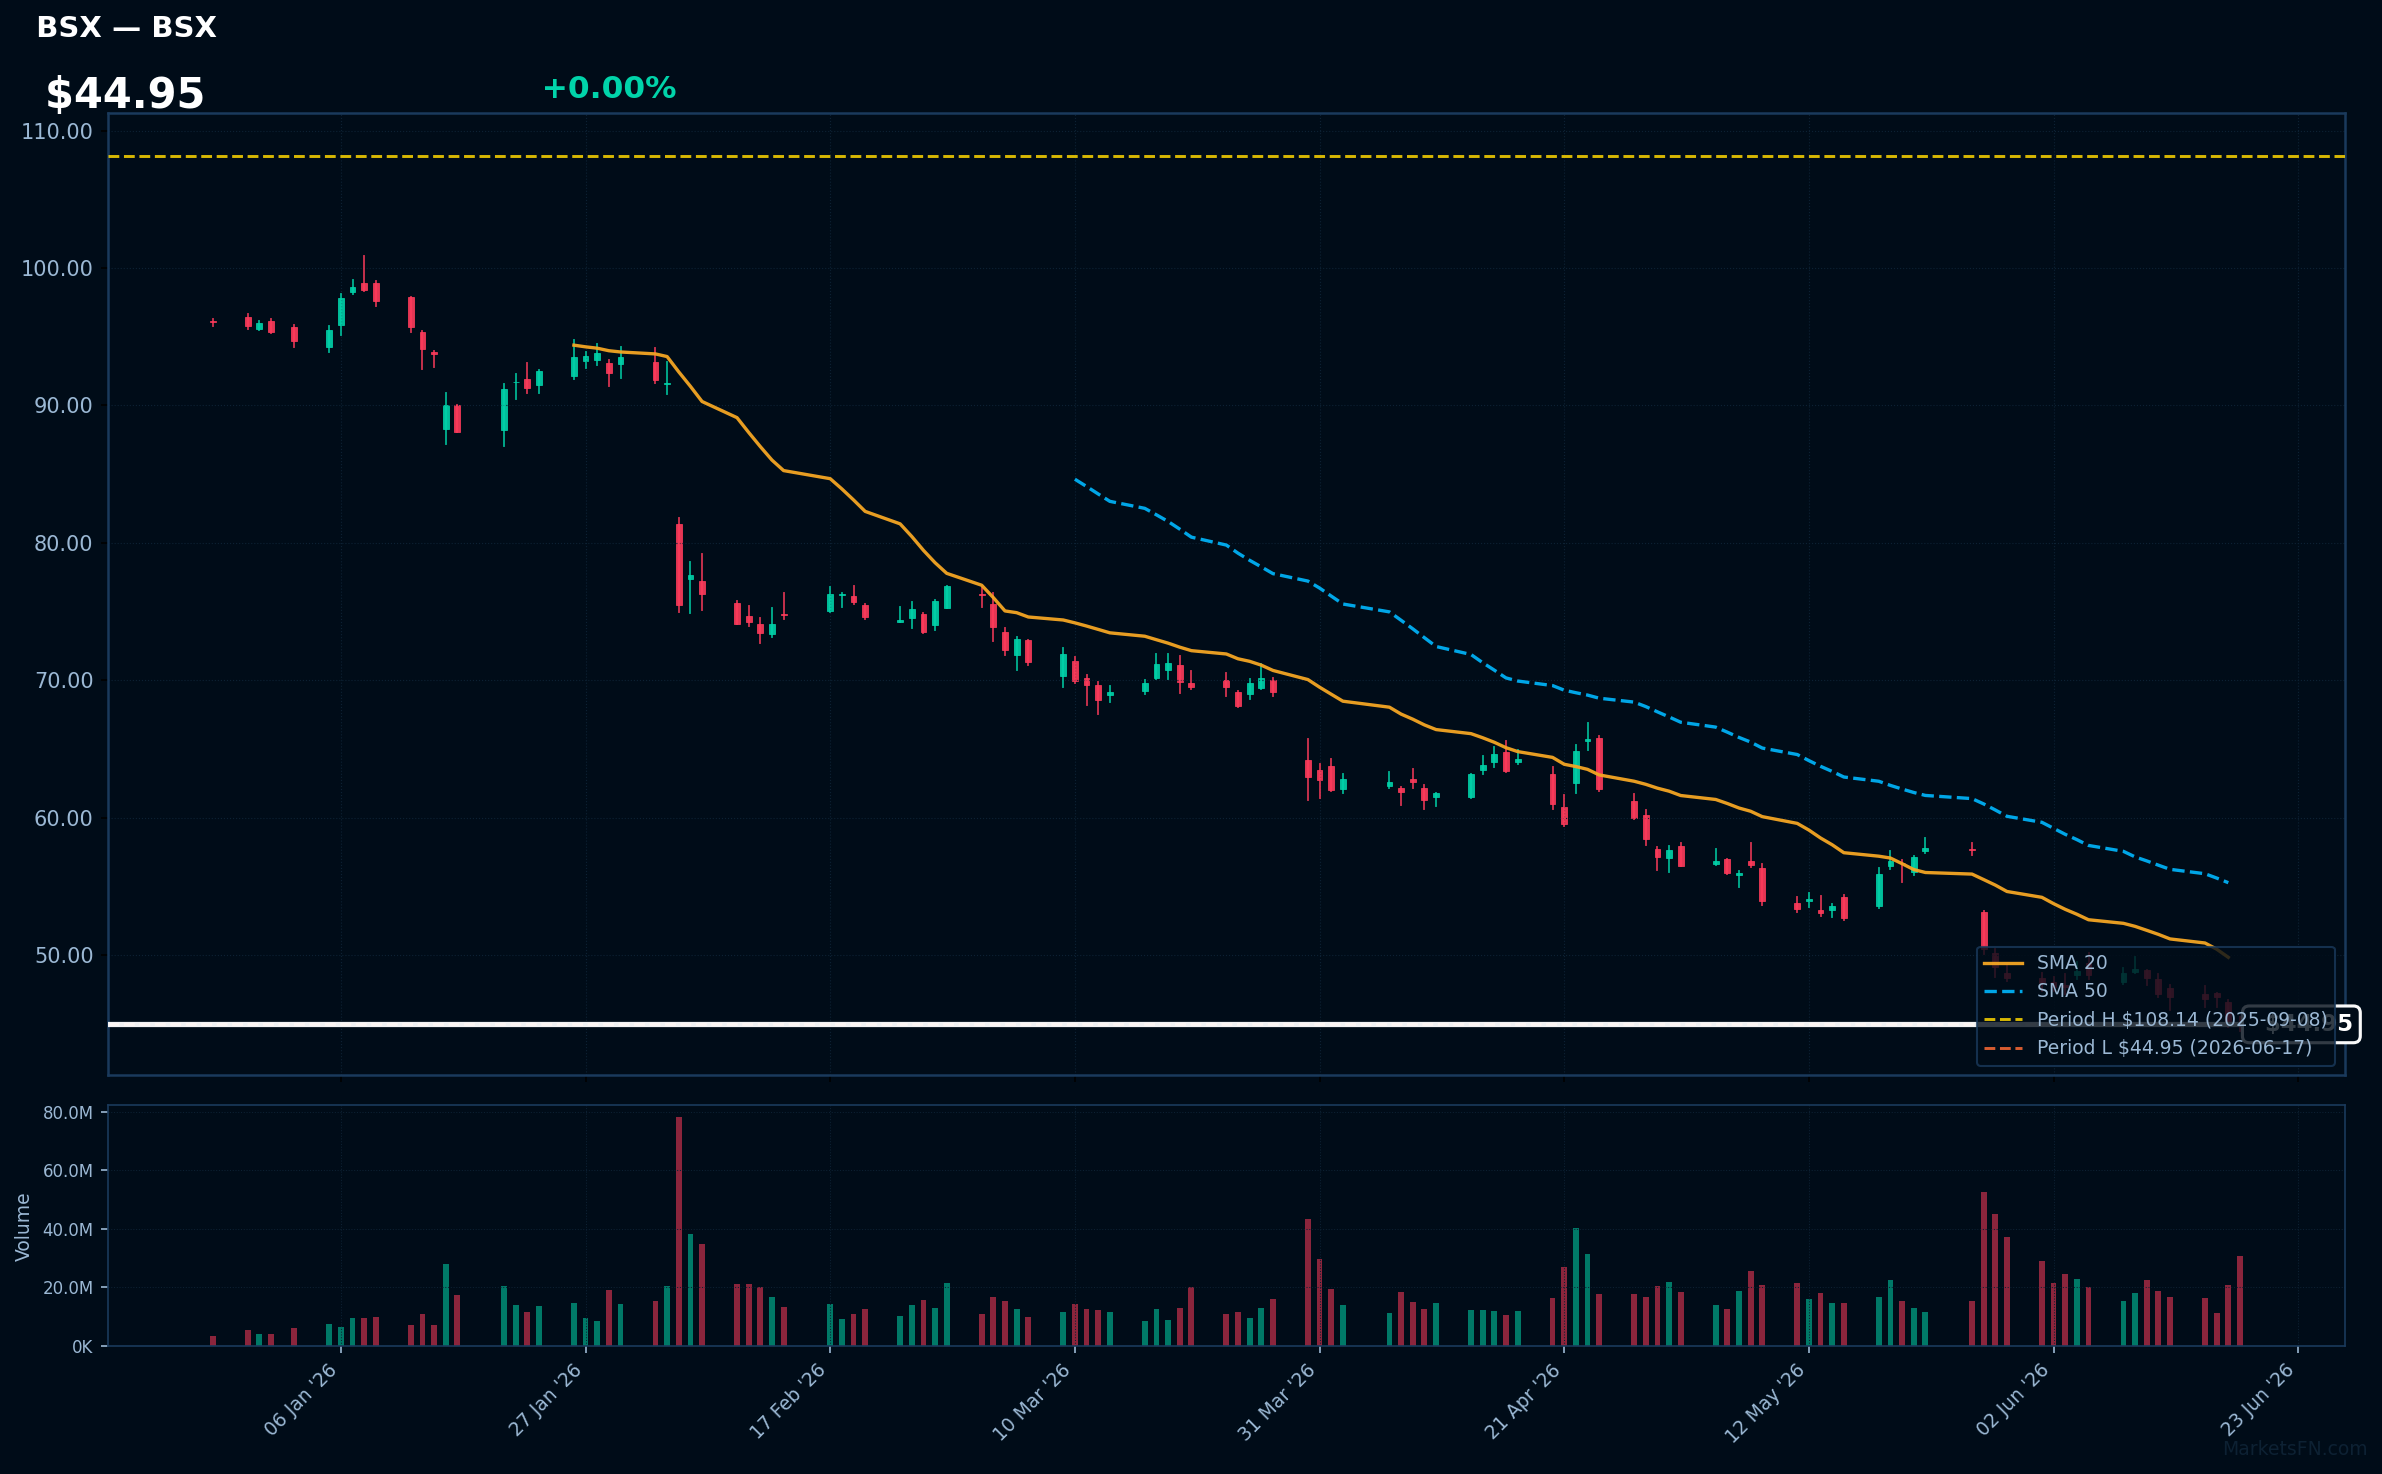
BSX | Boston Scientific Corp | Healthcare | Price Last: $44.95 | % Realized: -55.63% | RSI: 25.1 | % above MA200: -44.9% | Trend: Below MA20, MA50, MA200
Boston Scientific Corp (BSX) develops and markets medical devices used in interventional medical specialties, such as cardiology and urology. Investors should care about its innovation pipeline and market share in these critical healthcare areas.
BSX's technical situation is bearish, with RSI(14) at 25.1, indicating oversold conditions, and a sustained downtrend (price < MA20 < MA50 < MA200). The stock is at its 52-Week low, having lost 55.6% over the period, signaling a warning sign.
Related headlines
Market Commentary
The S&P 500 stocks listed are currently trading at their 52-week extremes, with GE, MS, GS, CAT, and C at their 52-week highs and CRM, T, INTU, ISRG, and BSX at their 52-week lows. This indicates a significant price movement, potentially driven by fundamental factors or market sentiment.
The stocks at 52-week highs are primarily from the financial (MS, GS, C) and industrials (CAT, GE) sectors, suggesting a potential rotation into these areas. In contrast, the stocks at 52-week lows are from technology (CRM, INTU) and healthcare (ISRG, BSX) sectors, with T representing communications. This divergence may be driven by macro themes such as interest rates, economic growth, or regulatory changes.
Key levels to watch include the current prices of these stocks, as a break above or below their 52-week extremes could signal further momentum. Potential catalysts include earnings reports, industry trends, and broader market movements. Monitoring these stocks and their respective sectors may provide insight into ongoing sector rotation and emerging market themes.
Methodology: All 503 S&P 500 constituents screened. 52-week high = highest daily close over the past 252 trading days (approx. 1 year). 52-week low = lowest daily close over the same period. Distance = (current price / extreme − 1) × 100. Technical indicators computed on up to 1 year of daily OHLCV data.
Disclaimer: For informational purposes only. Not investment advice. Past performance is not indicative of future results.