S&P 500 52-Week Highs & Lows Radar: JPMorgan Chase & (JPM), Palantir (PLTR) and more
· Stocks · MarketsFN Team
S&P 500 52-Week Highs & Lows Radar: JPMorgan Chase & (JPM), Palantir (PLTR) and more
Screening all 503 S&P 500 constituents for stocks nearest to their 52-week high and their 52-week low. Data as of June 18, 2026. % Realized = 52-week total return.
Legend: RSI > 70 = overbought · RSI < 30 = oversold · Green % Realized = positive 52W return · Red = negative.
📈 Nearest to 52-Week High
Sectors represented: Financial (3), Industrials (2)
| Ticker | Company | Sector | Price Last | % Realized | 52-Week High Date | RSI | % above MA200 | Trend |
|---|---|---|---|---|---|---|---|---|
| JPM | JPMorgan Chase & Co | Financial | $335.58 | +22.49% | 2026-06-18 | 73.4 | +9.3% | Above MA20, MA50, MA200 |
| GE | GE Aerospace | Industrials | $360.96 | +53.02% | 2026-06-18 | 72.4 | +18.2% | Above MA20, MA50, MA200 |
| MS | Morgan Stanley | Financial | $228.62 | +72.51% | 2026-06-18 | 74.1 | +30.2% | Above MA20, MA50, MA200 |
| GS | Goldman Sachs Group, Inc | Financial | $1115.29 | +75.57% | 2026-06-18 | 68.5 | +27.2% | Above MA20, MA50, MA200 |
| CAT | Caterpillar Inc | Industrials | $990.02 | +175.16% | 2026-06-18 | 66.1 | +47.7% | Above MA20, MA50, MA200 |
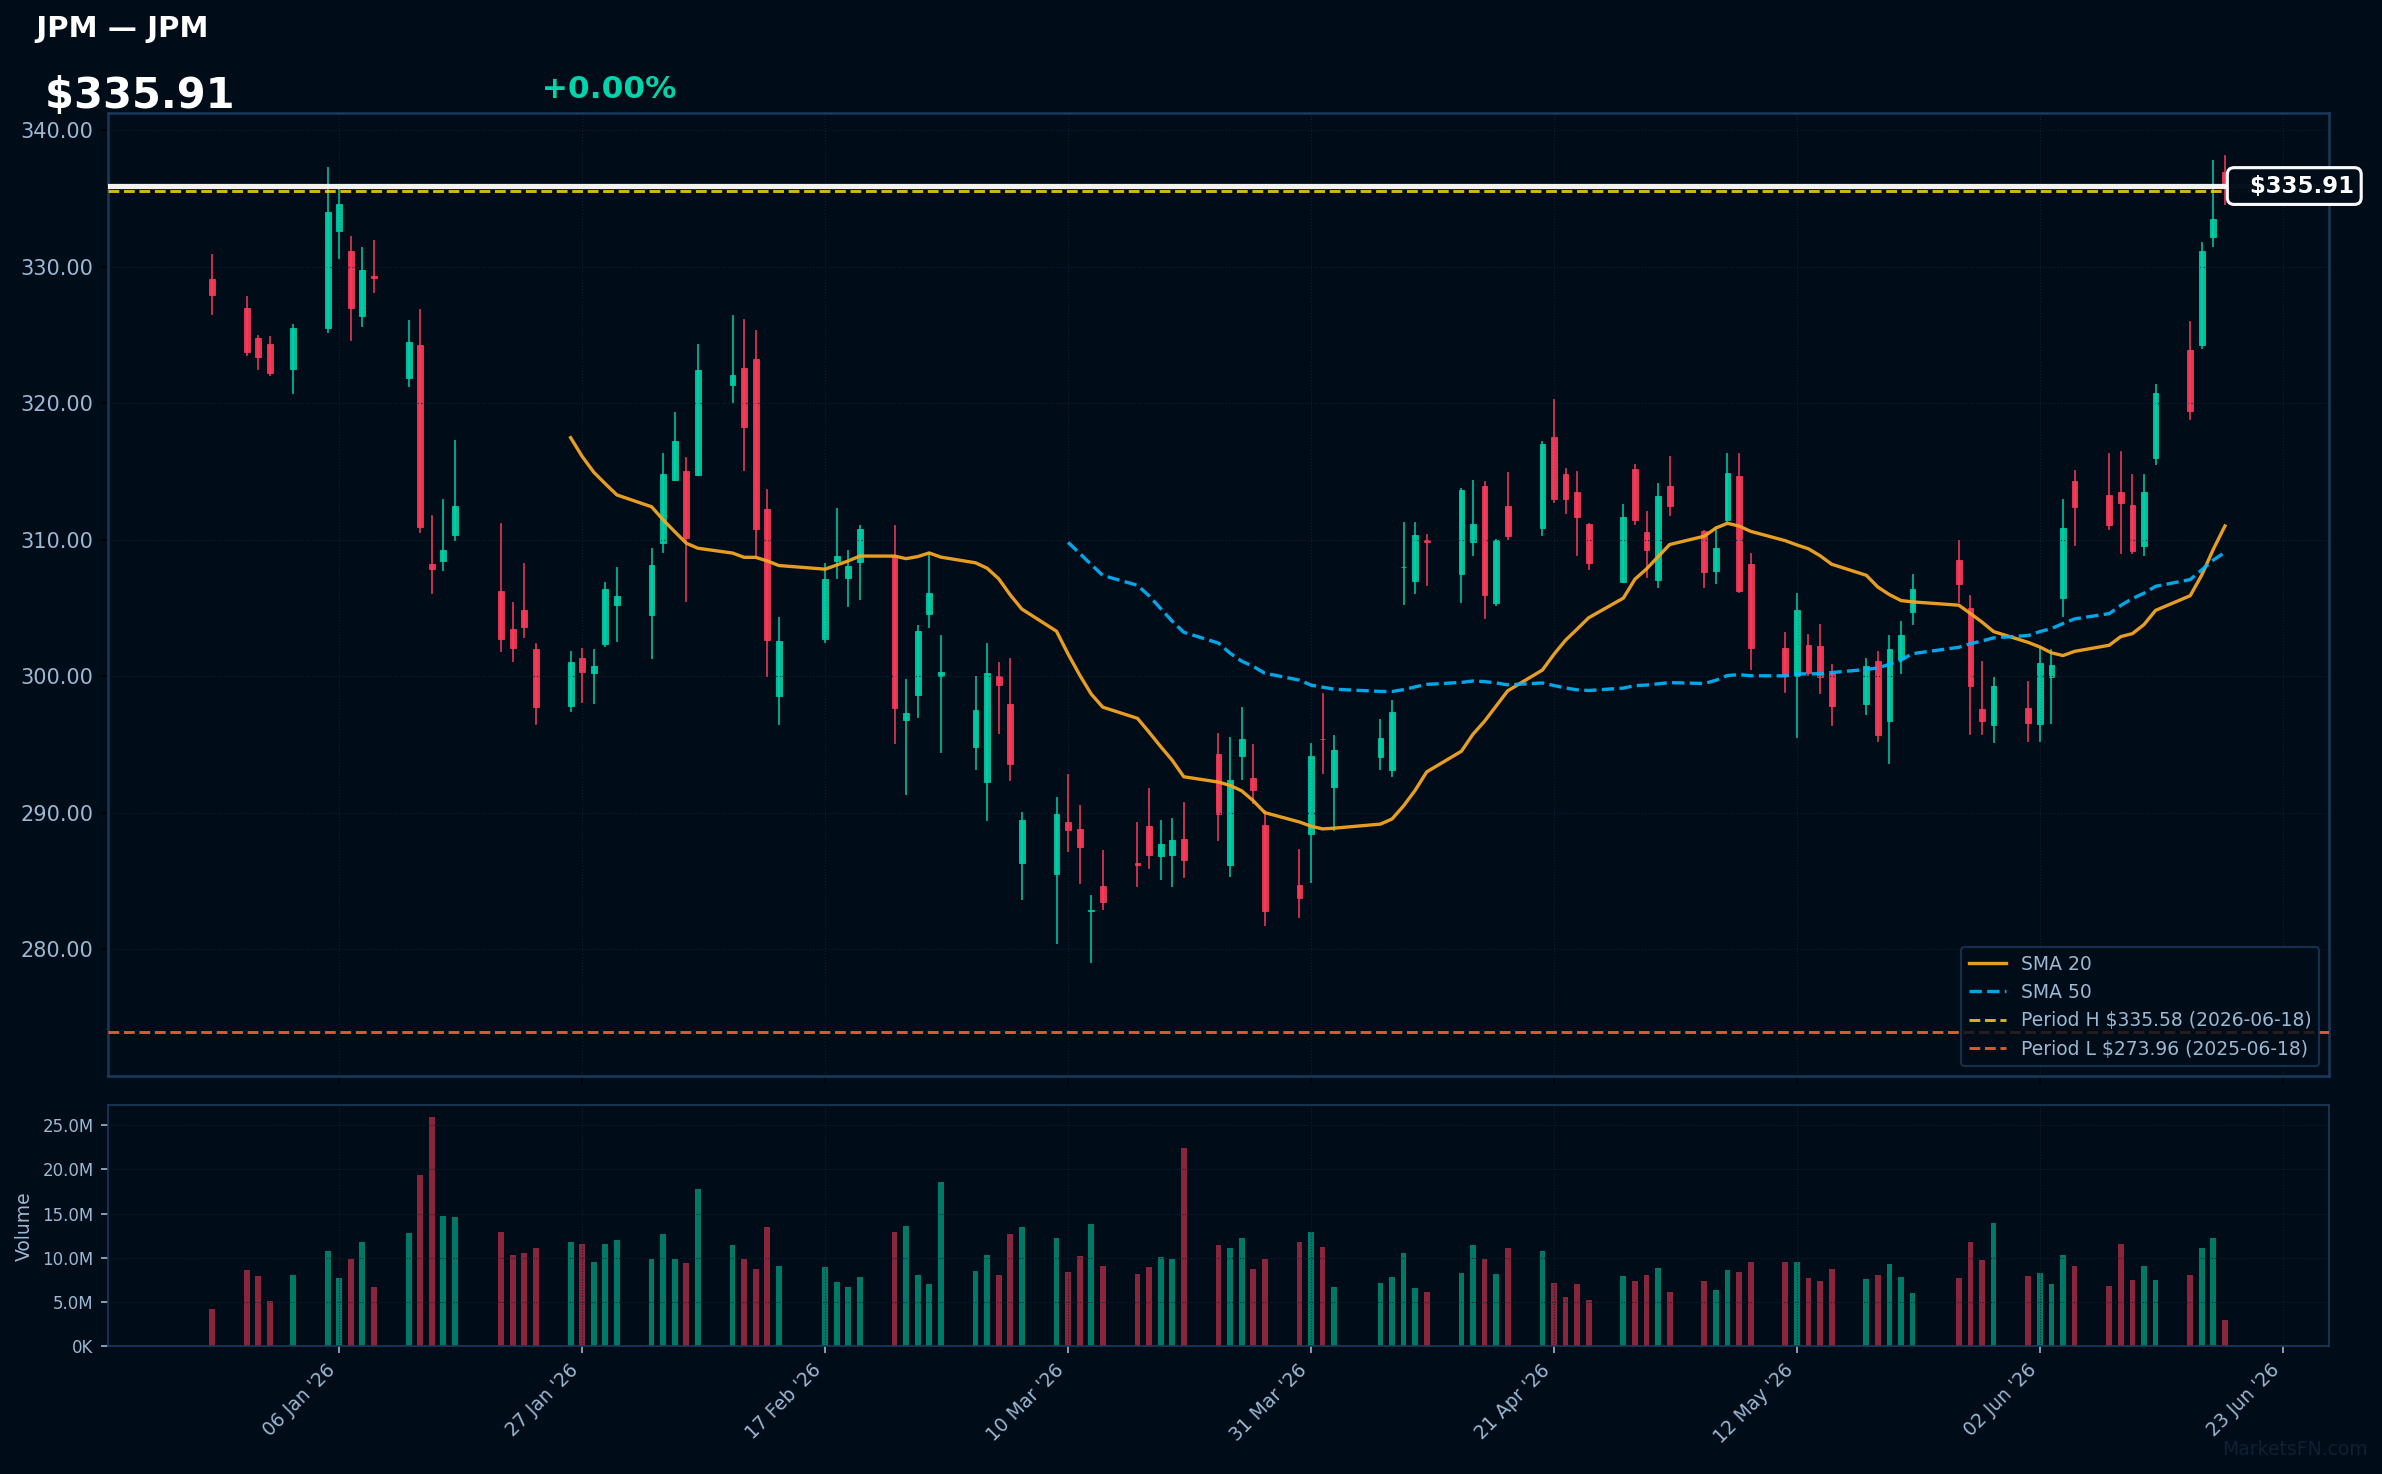
JPM | JPMorgan Chase & Co | Financial | Price Last: $335.58 | % Realized: +22.49% | RSI: 73.4 | % above MA200: +9.3% | Trend: Above MA20, MA50, MA200
JPMorgan Chase & Co is a multinational bank and financial services company providing consumer and investment banking, asset management, and financial transactions services. Investors care about its performance as it reflects the overall health of the financial sector.
JPMorgan Chase & Co is in a sustained uptrend with price > MA20 > MA50 > MA200, RSI(14) at 73.4, indicating strong momentum. The stock is 0.0% below its 52-Week high, near a potential breakout level, with a 22.5% return over the 52-Week period.
Related headlines
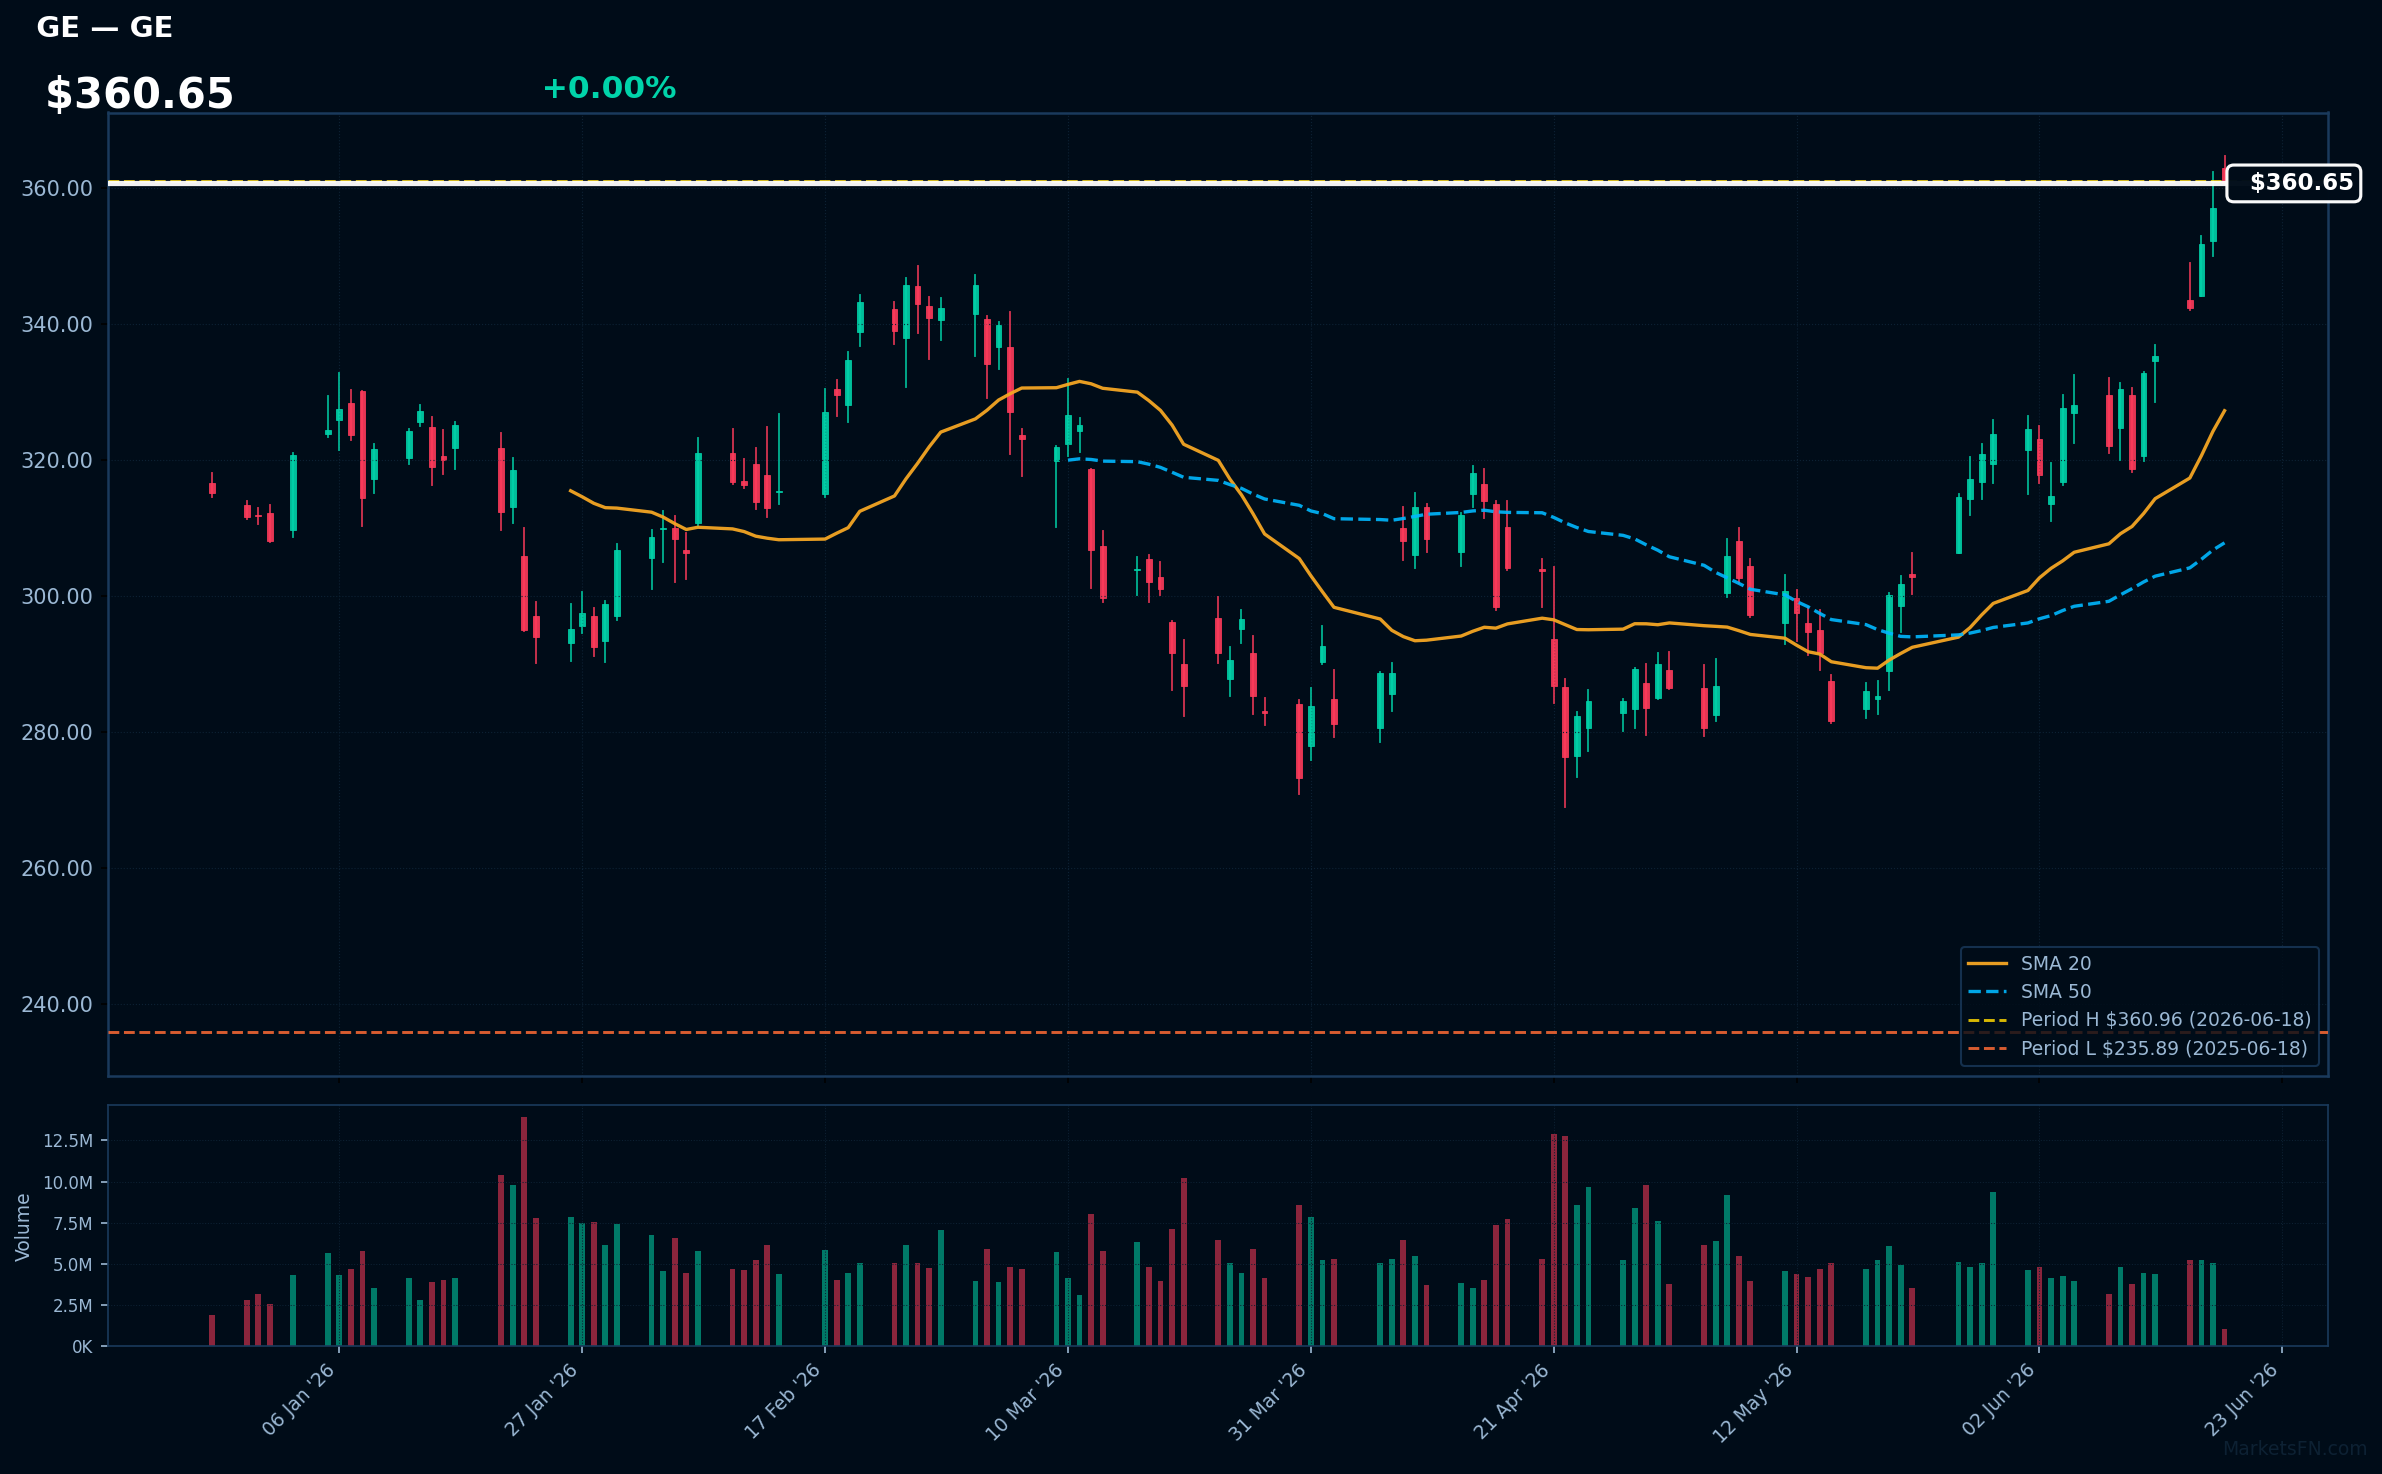
GE | GE Aerospace | Industrials | Price Last: $360.96 | % Realized: +53.02% | RSI: 72.4 | % above MA200: +18.2% | Trend: Above MA20, MA50, MA200
GE Aerospace is a leader in the aerospace industry, manufacturing commercial and military jet engines, and providing related services. Investors should care about its dominance in the market and potential for long-term growth driven by increasing air travel demand and defense spending.
GE Aerospace's technicals indicate strong momentum: RSI(14) is 72.4, nearing overbought territory, with a bullish MA alignment (price > MA20 > MA50 > MA200) and 0.0% below its 52-Week high, suggesting a potential breakout.
Related headlines
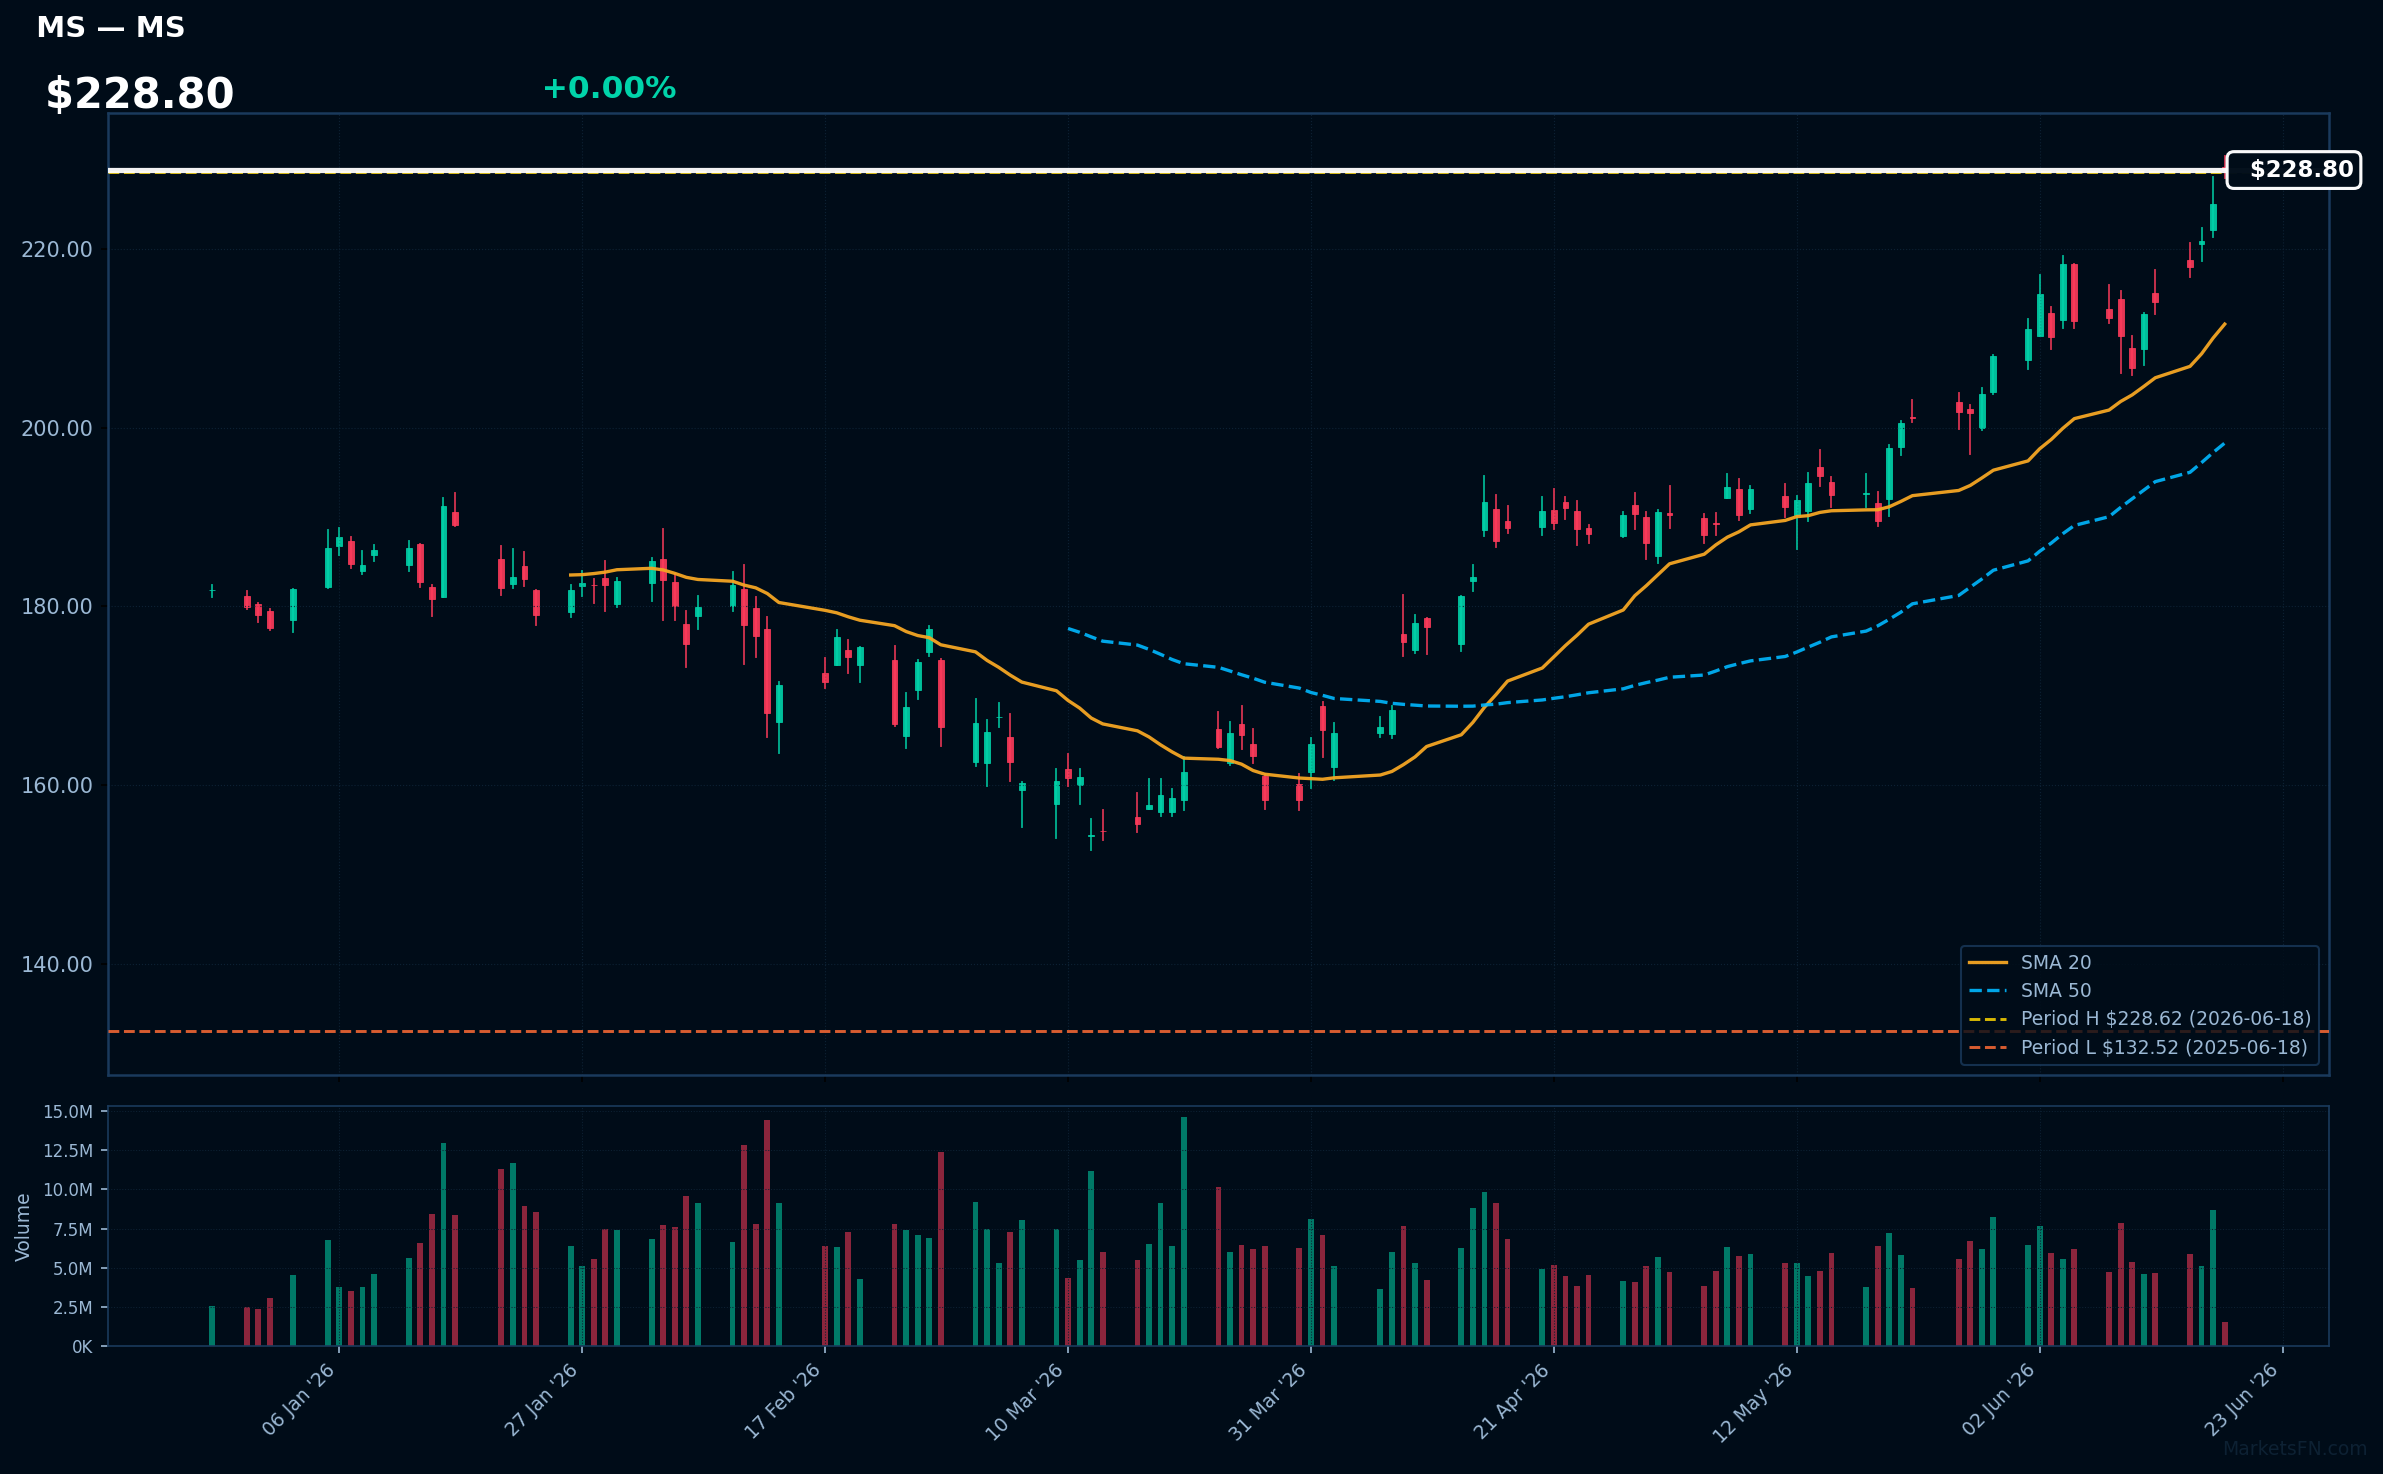
MS | Morgan Stanley | Financial | Price Last: $228.62 | % Realized: +72.51% | RSI: 74.1 | % above MA200: +30.2% | Trend: Above MA20, MA50, MA200
Morgan Stanley is a global financial services firm providing investment banking, wealth management, and investment management services. Investors should care about its diversified revenue streams and market position, which drive long-term growth.
Morgan Stanley's RSI is 74.1, indicating strong momentum. The stock is in a sustained uptrend with price > MA20 > MA50 > MA200, and is 0.0% below its 52-Week high, suggesting a potential breakout.
Related headlines
- The IPO Onslaught Is Forcing Bankers to Pick Teams
- Morgan Stanley Real Estate Investing Acquires Metra Living from L&Q in Partnership with Ridgeback Group for 1.045 Billion
- Goldman, Morgan Stanley Cut Q4 Oil Forecasts to $80 a Barrel
- Buy this sector after recent pullback, Morgan Stanley urges investors
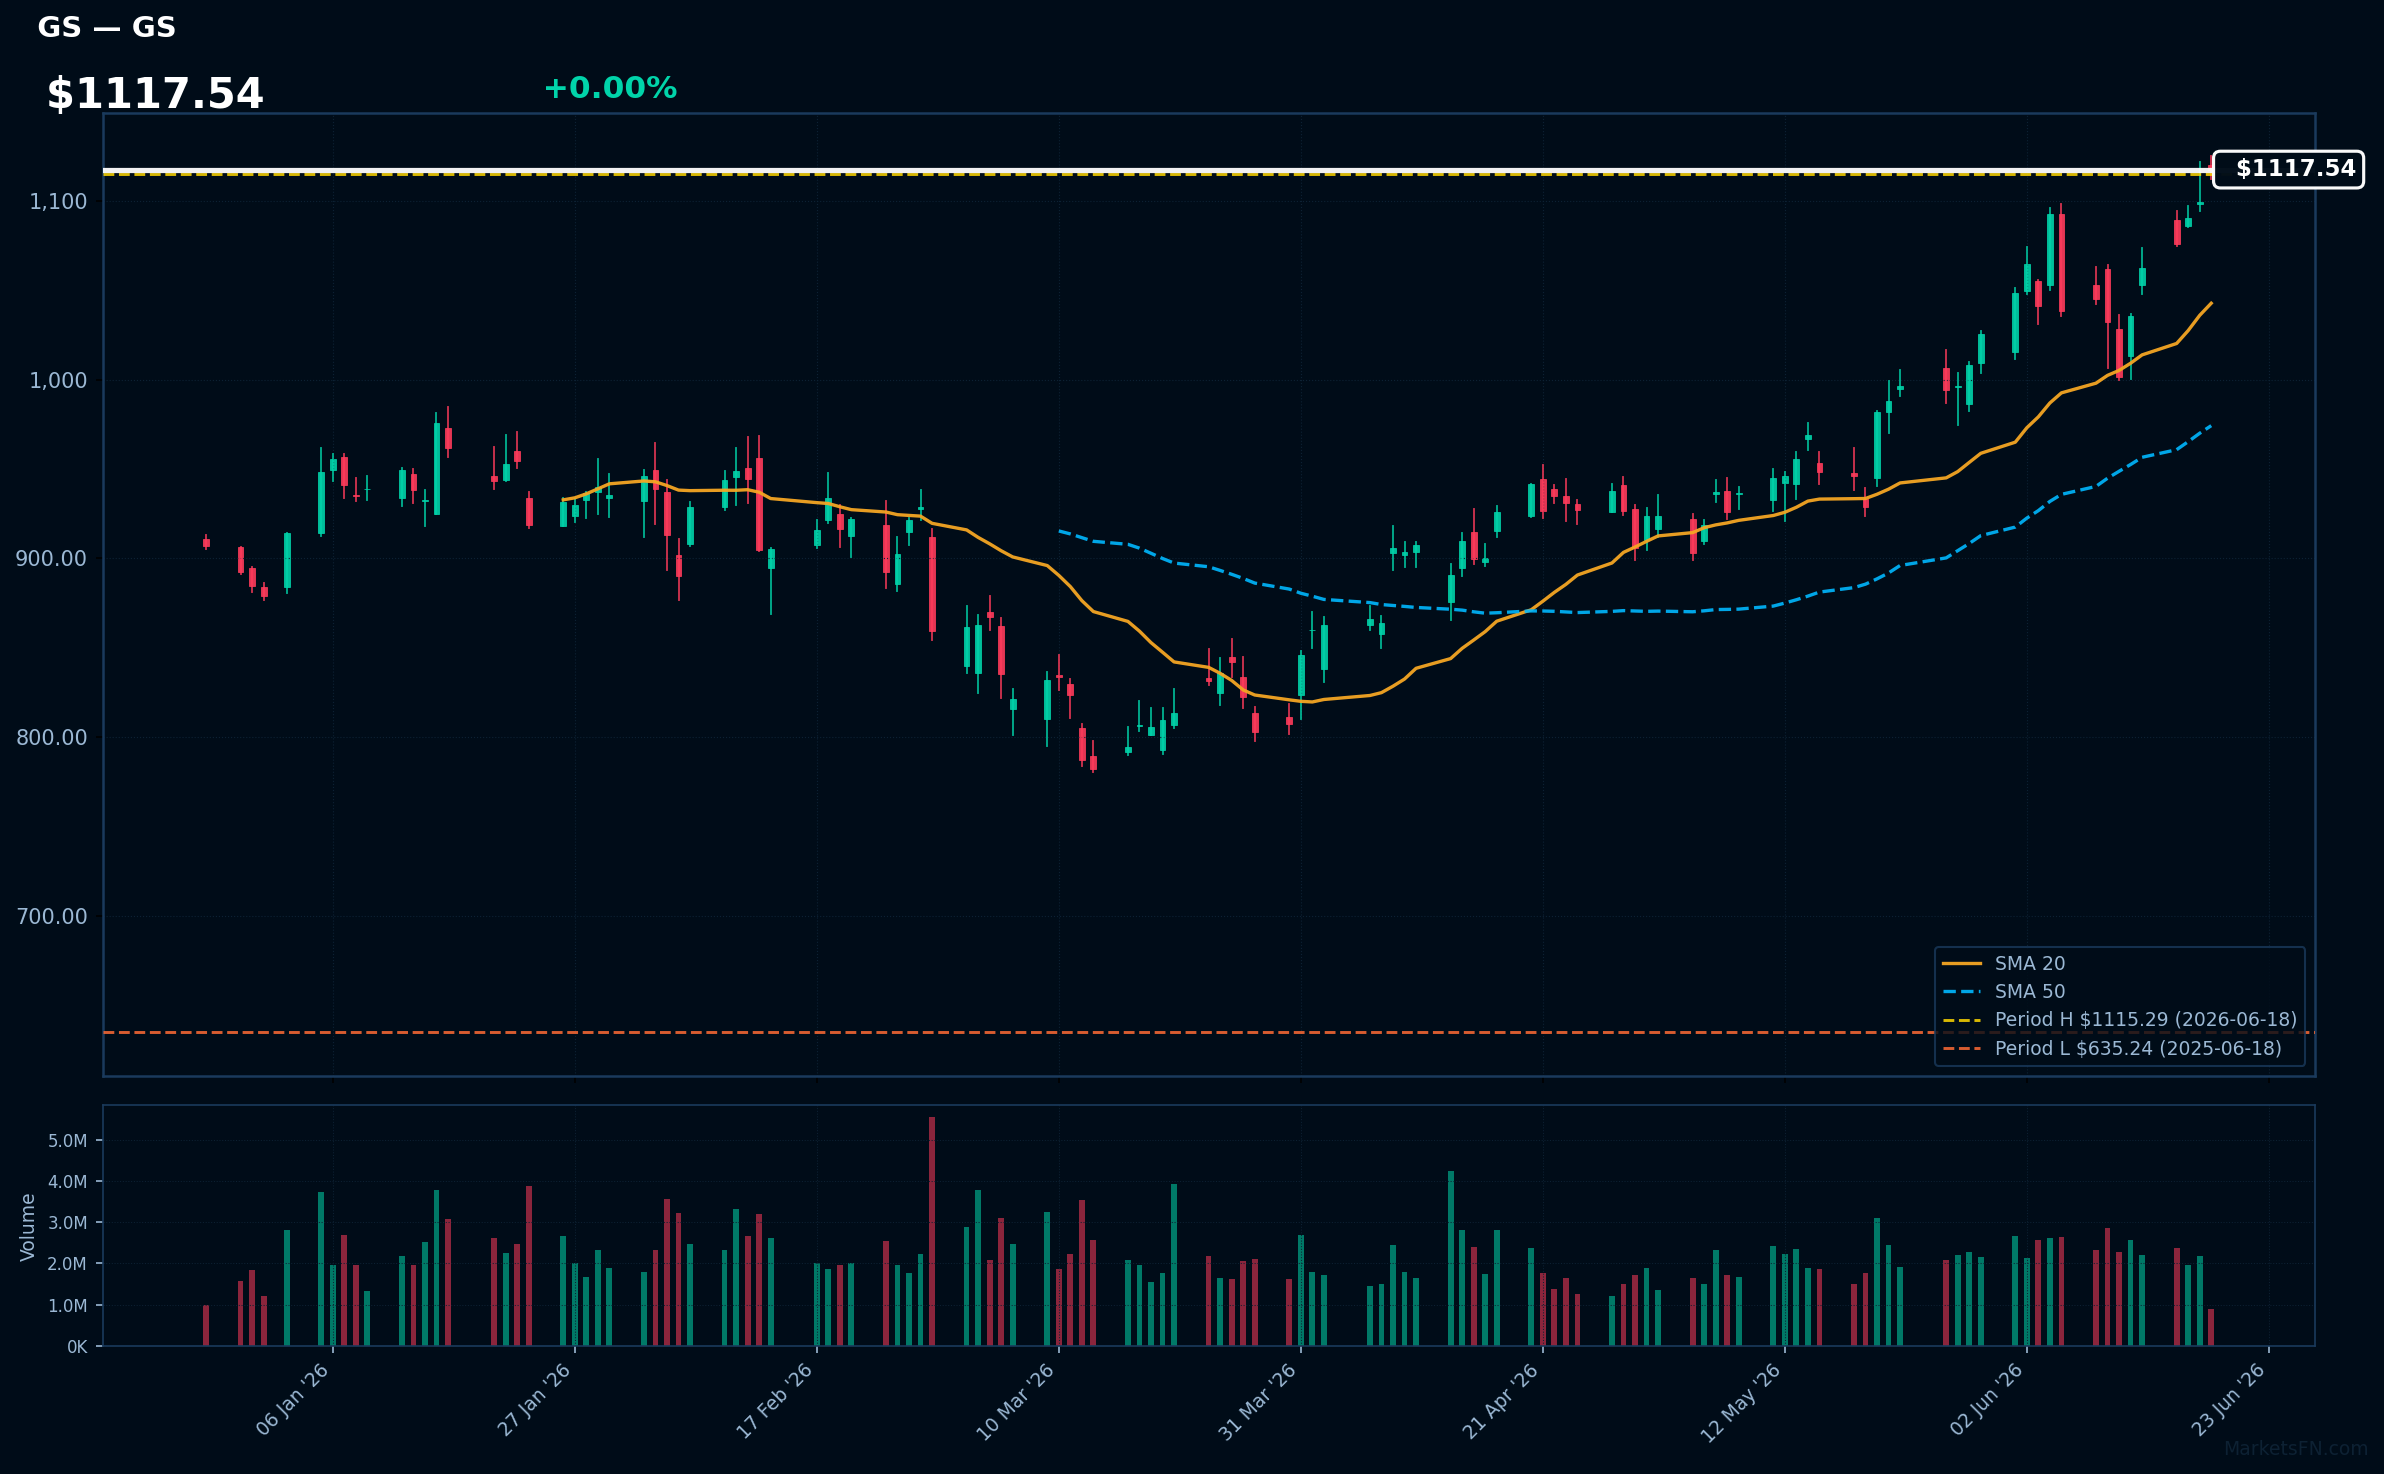
GS | Goldman Sachs Group, Inc | Financial | Price Last: $1115.29 | % Realized: +75.57% | RSI: 68.5 | % above MA200: +27.2% | Trend: Above MA20, MA50, MA200
Goldman Sachs Group, Inc is a global investment bank and financial services company providing investment banking, securities, and investment management services. Investors care about its performance as it reflects the overall health of global financial markets.
The stock is in a sustained uptrend with RSI(14) at 68.5, price > MA20 > MA50 > MA200, and is 0.0% below its 52-Week high, indicating strong momentum with no immediate signs of reversal.
Related headlines
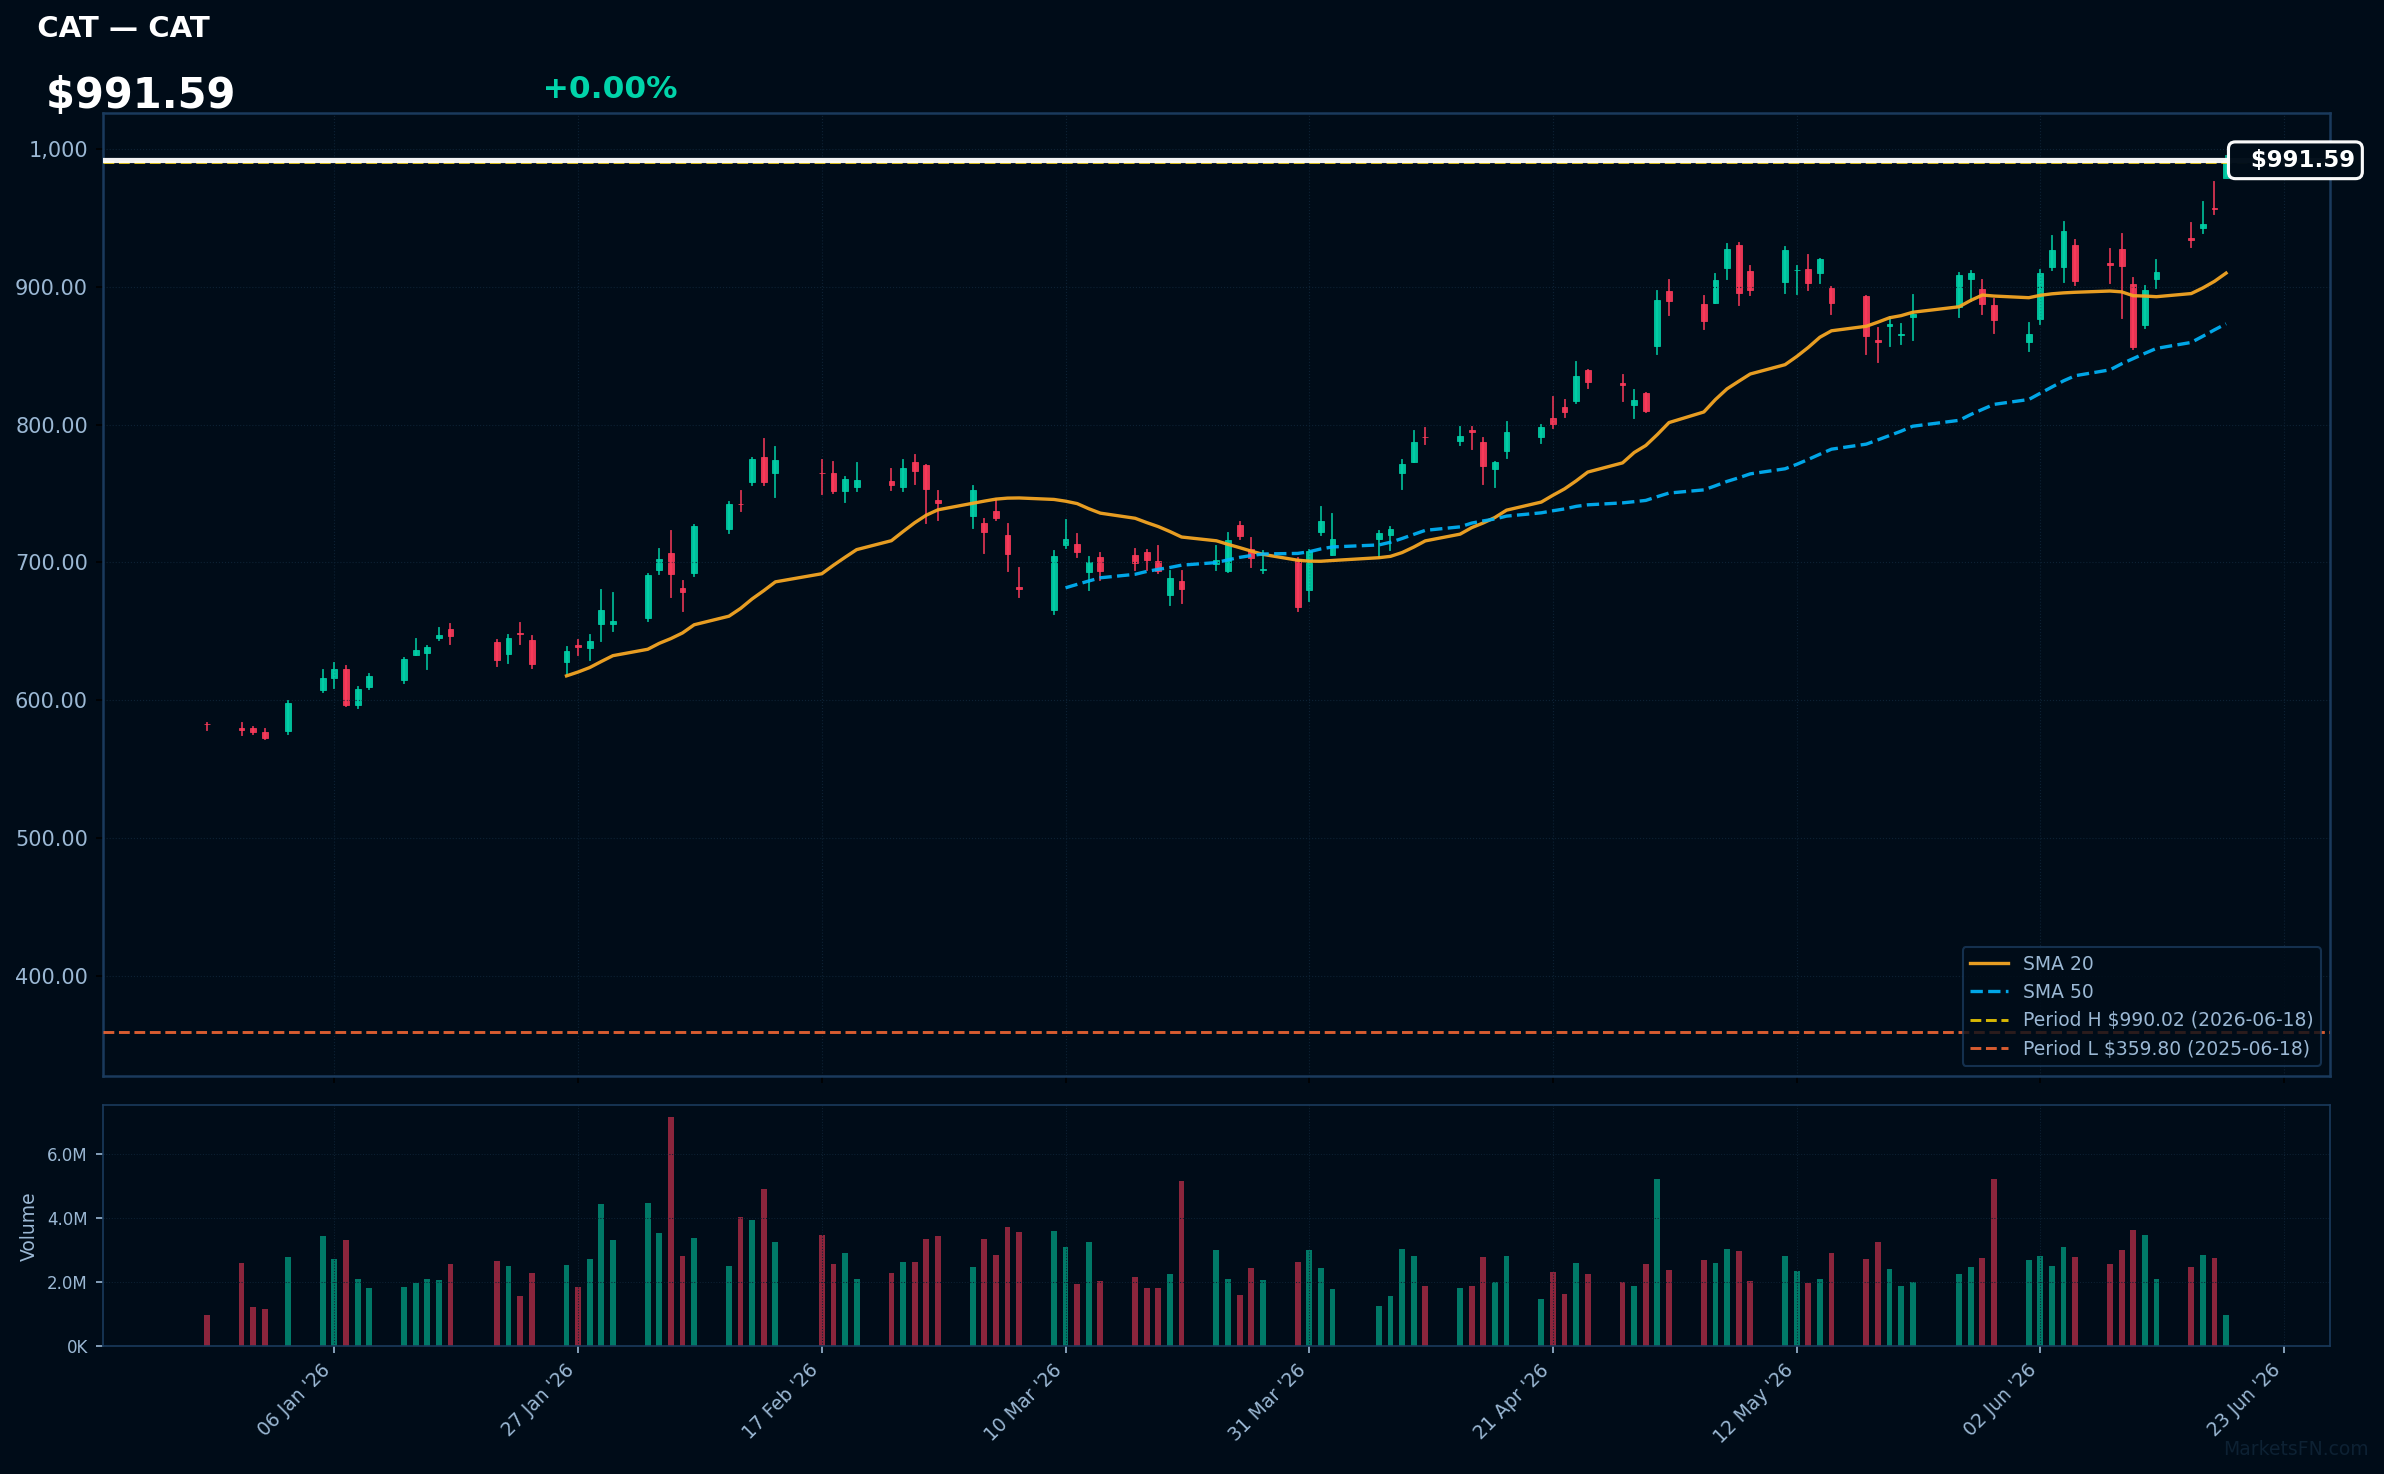
CAT | Caterpillar Inc | Industrials | Price Last: $990.02 | % Realized: +175.16% | RSI: 66.1 | % above MA200: +47.7% | Trend: Above MA20, MA50, MA200
Caterpillar Inc is a leading manufacturer of heavy machinery used in construction, mining, and energy sectors. Investors should care due to its exposure to infrastructure spending and commodity prices, making it a barometer for global economic activity.
Caterpillar Inc's RSI(14) is 66.1, indicating rising momentum. The MA alignment is bullish with price > MA20 > MA50 > MA200, and it's 0.0% below its 52-Week high, suggesting a potential breakout.
Related headlines
📉 Nearest to 52-Week Low
Sectors represented: Technology (3), Communication Services (1), Healthcare (1)
| Ticker | Company | Sector | Price Last | % Realized | 52-Week Low Date | RSI | % above MA200 | Trend |
|---|---|---|---|---|---|---|---|---|
| PLTR | Palantir Technologies Inc | Technology | $126.82 | -9.39% | 2026-06-18 | 40.1 | -20.7% | Below MA20, MA50, MA200 |
| CRM | Salesforce Inc | Technology | $150.82 | -41.88% | 2026-06-18 | 30.2 | -30.3% | Below MA20, MA50, MA200 |
| T | AT&T, Inc | Communication Services | $22.43 | -18.91% | 2026-06-18 | 32.4 | -14.0% | Below MA20, MA50, MA200 |
| INTU | Intuit Inc | Technology | $263.39 | -65.11% | 2026-06-18 | 30.6 | -49.7% | Below MA20, MA50, MA200 |
| BSX | Boston Scientific Corp | Healthcare | $44.76 | -55.84% | 2026-06-18 | 24.5 | -44.9% | Below MA20, MA50, MA200 |
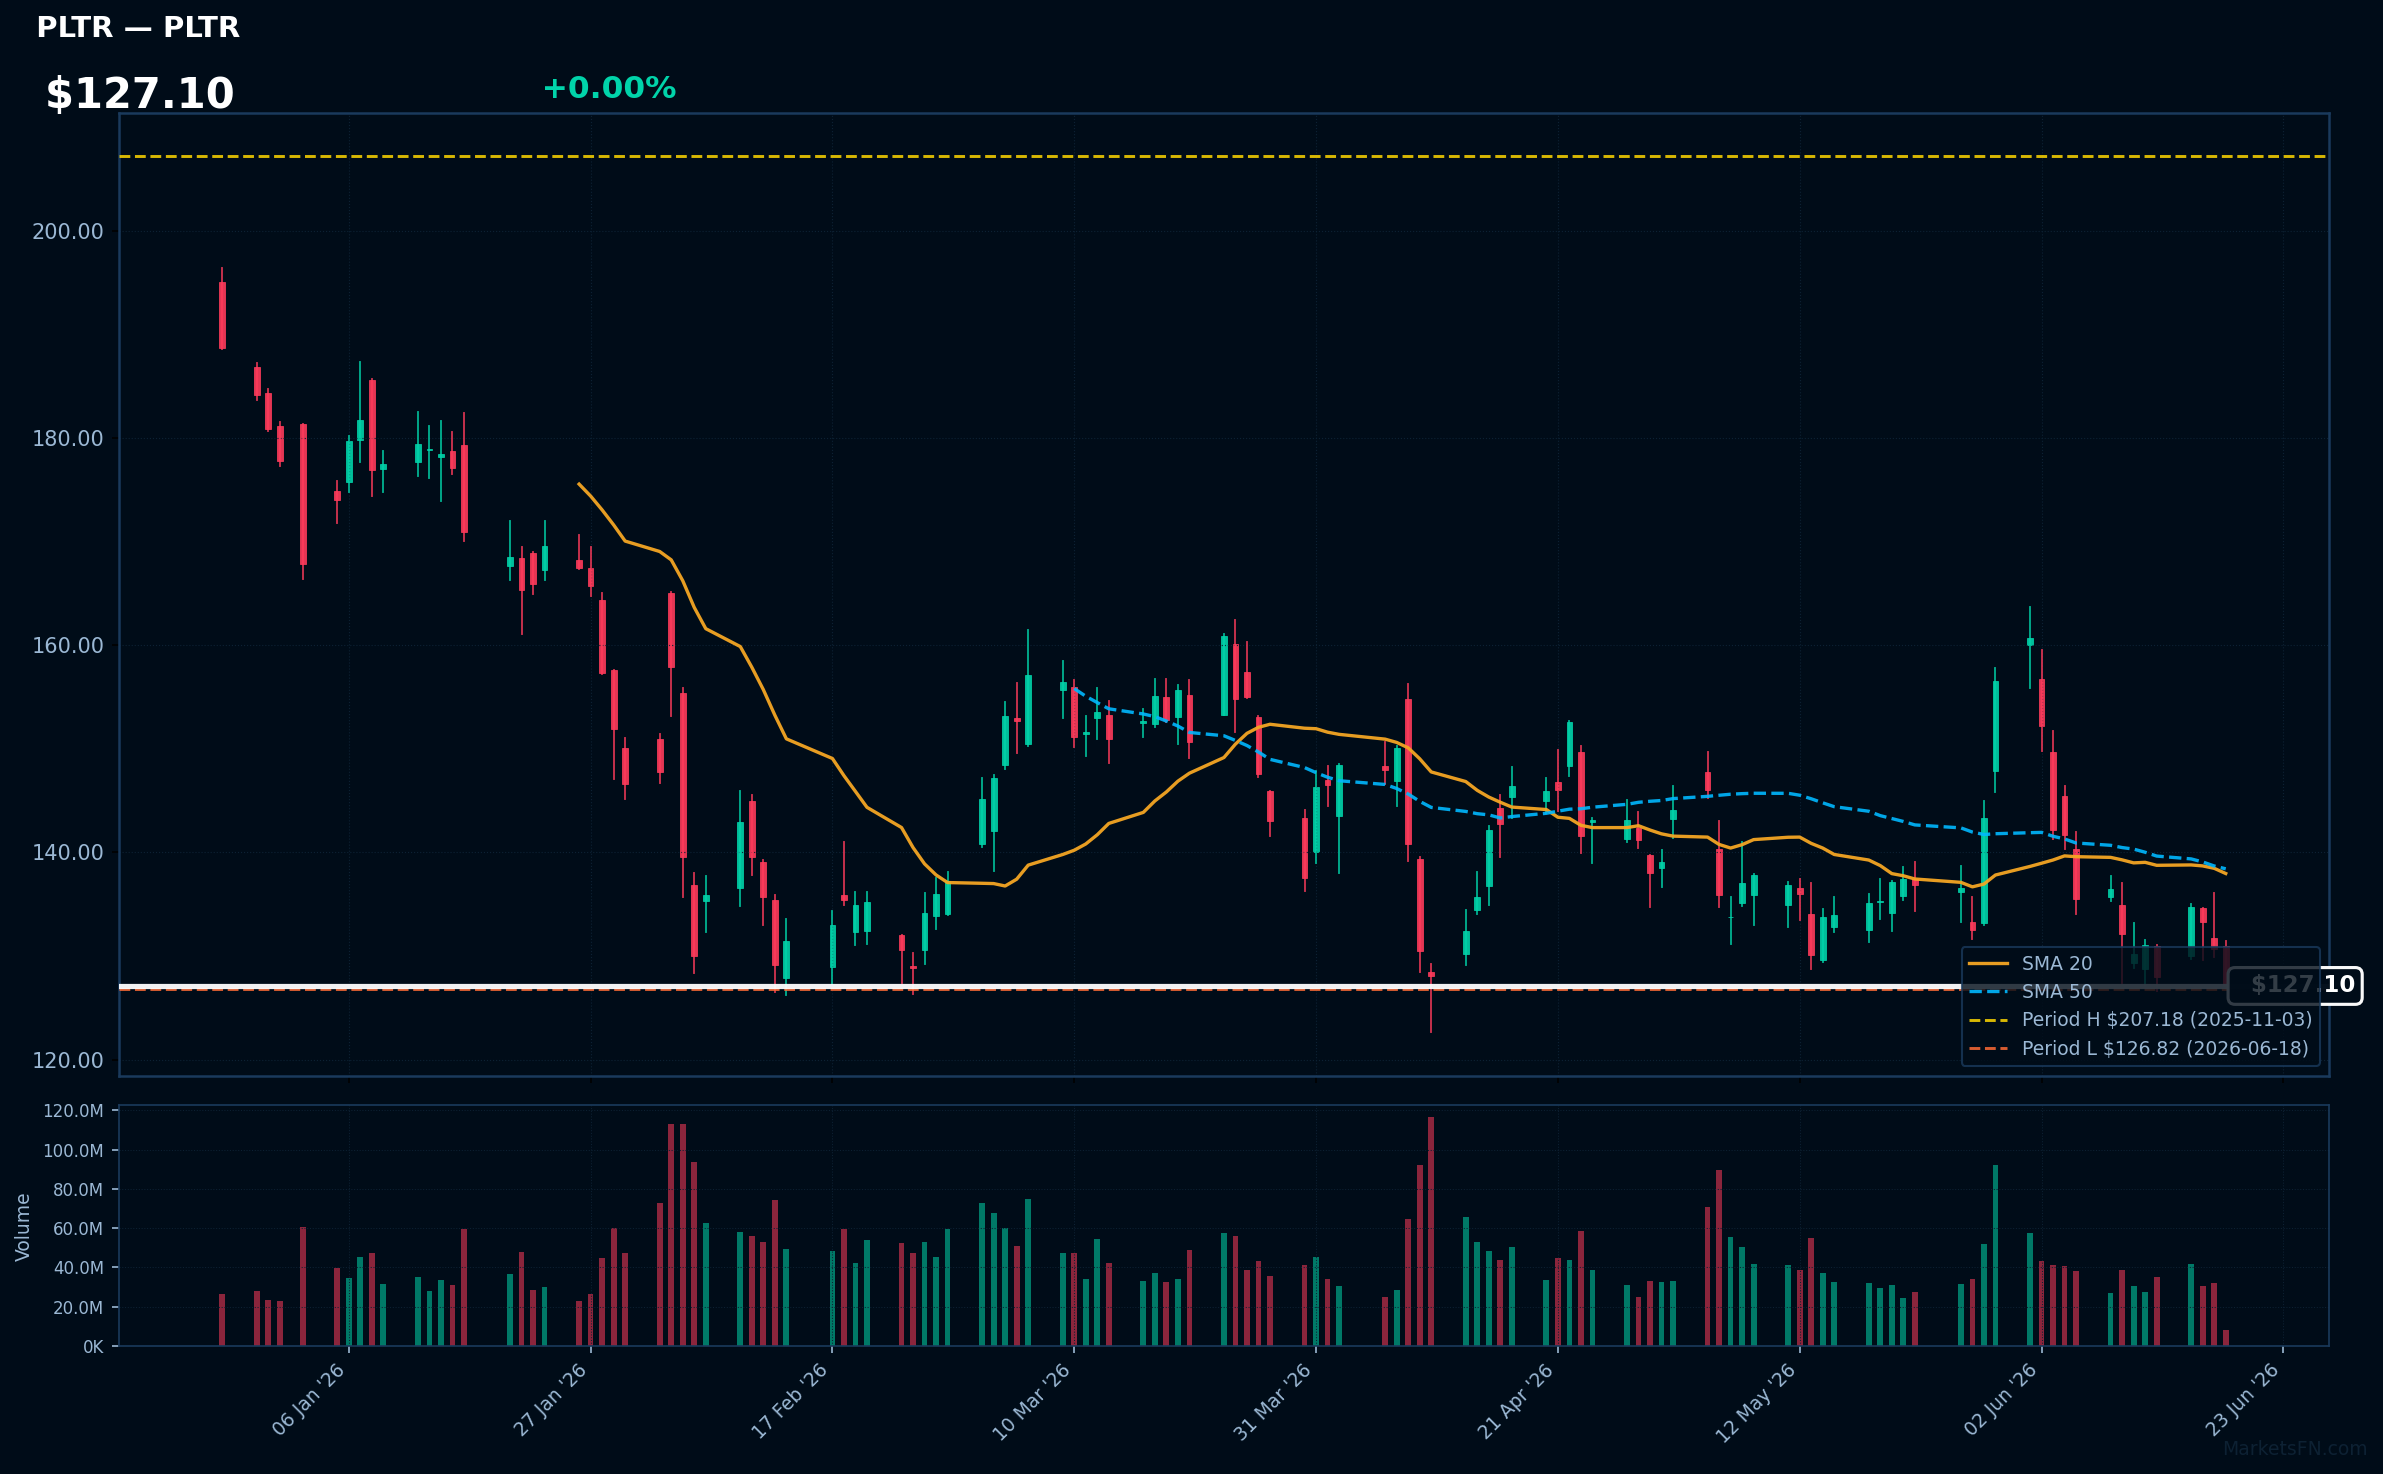
PLTR | Palantir Technologies Inc | Technology | Price Last: $126.82 | % Realized: -9.39% | RSI: 40.1 | % above MA200: -20.7% | Trend: Below MA20, MA50, MA200
Palantir Technologies Inc provides data integration and analytics software to governments and corporations, enabling them to make data-driven decisions. Investors should care because its software is used in critical applications such as defense, finance, and healthcare.
PLTR's technical situation is bearish, with an RSI(14) of 40.1 indicating weak momentum. The stock is in a sustained downtrend (price < MA20 < MA50 < MA200) and testing major support at its 52-Week low.
Related headlines
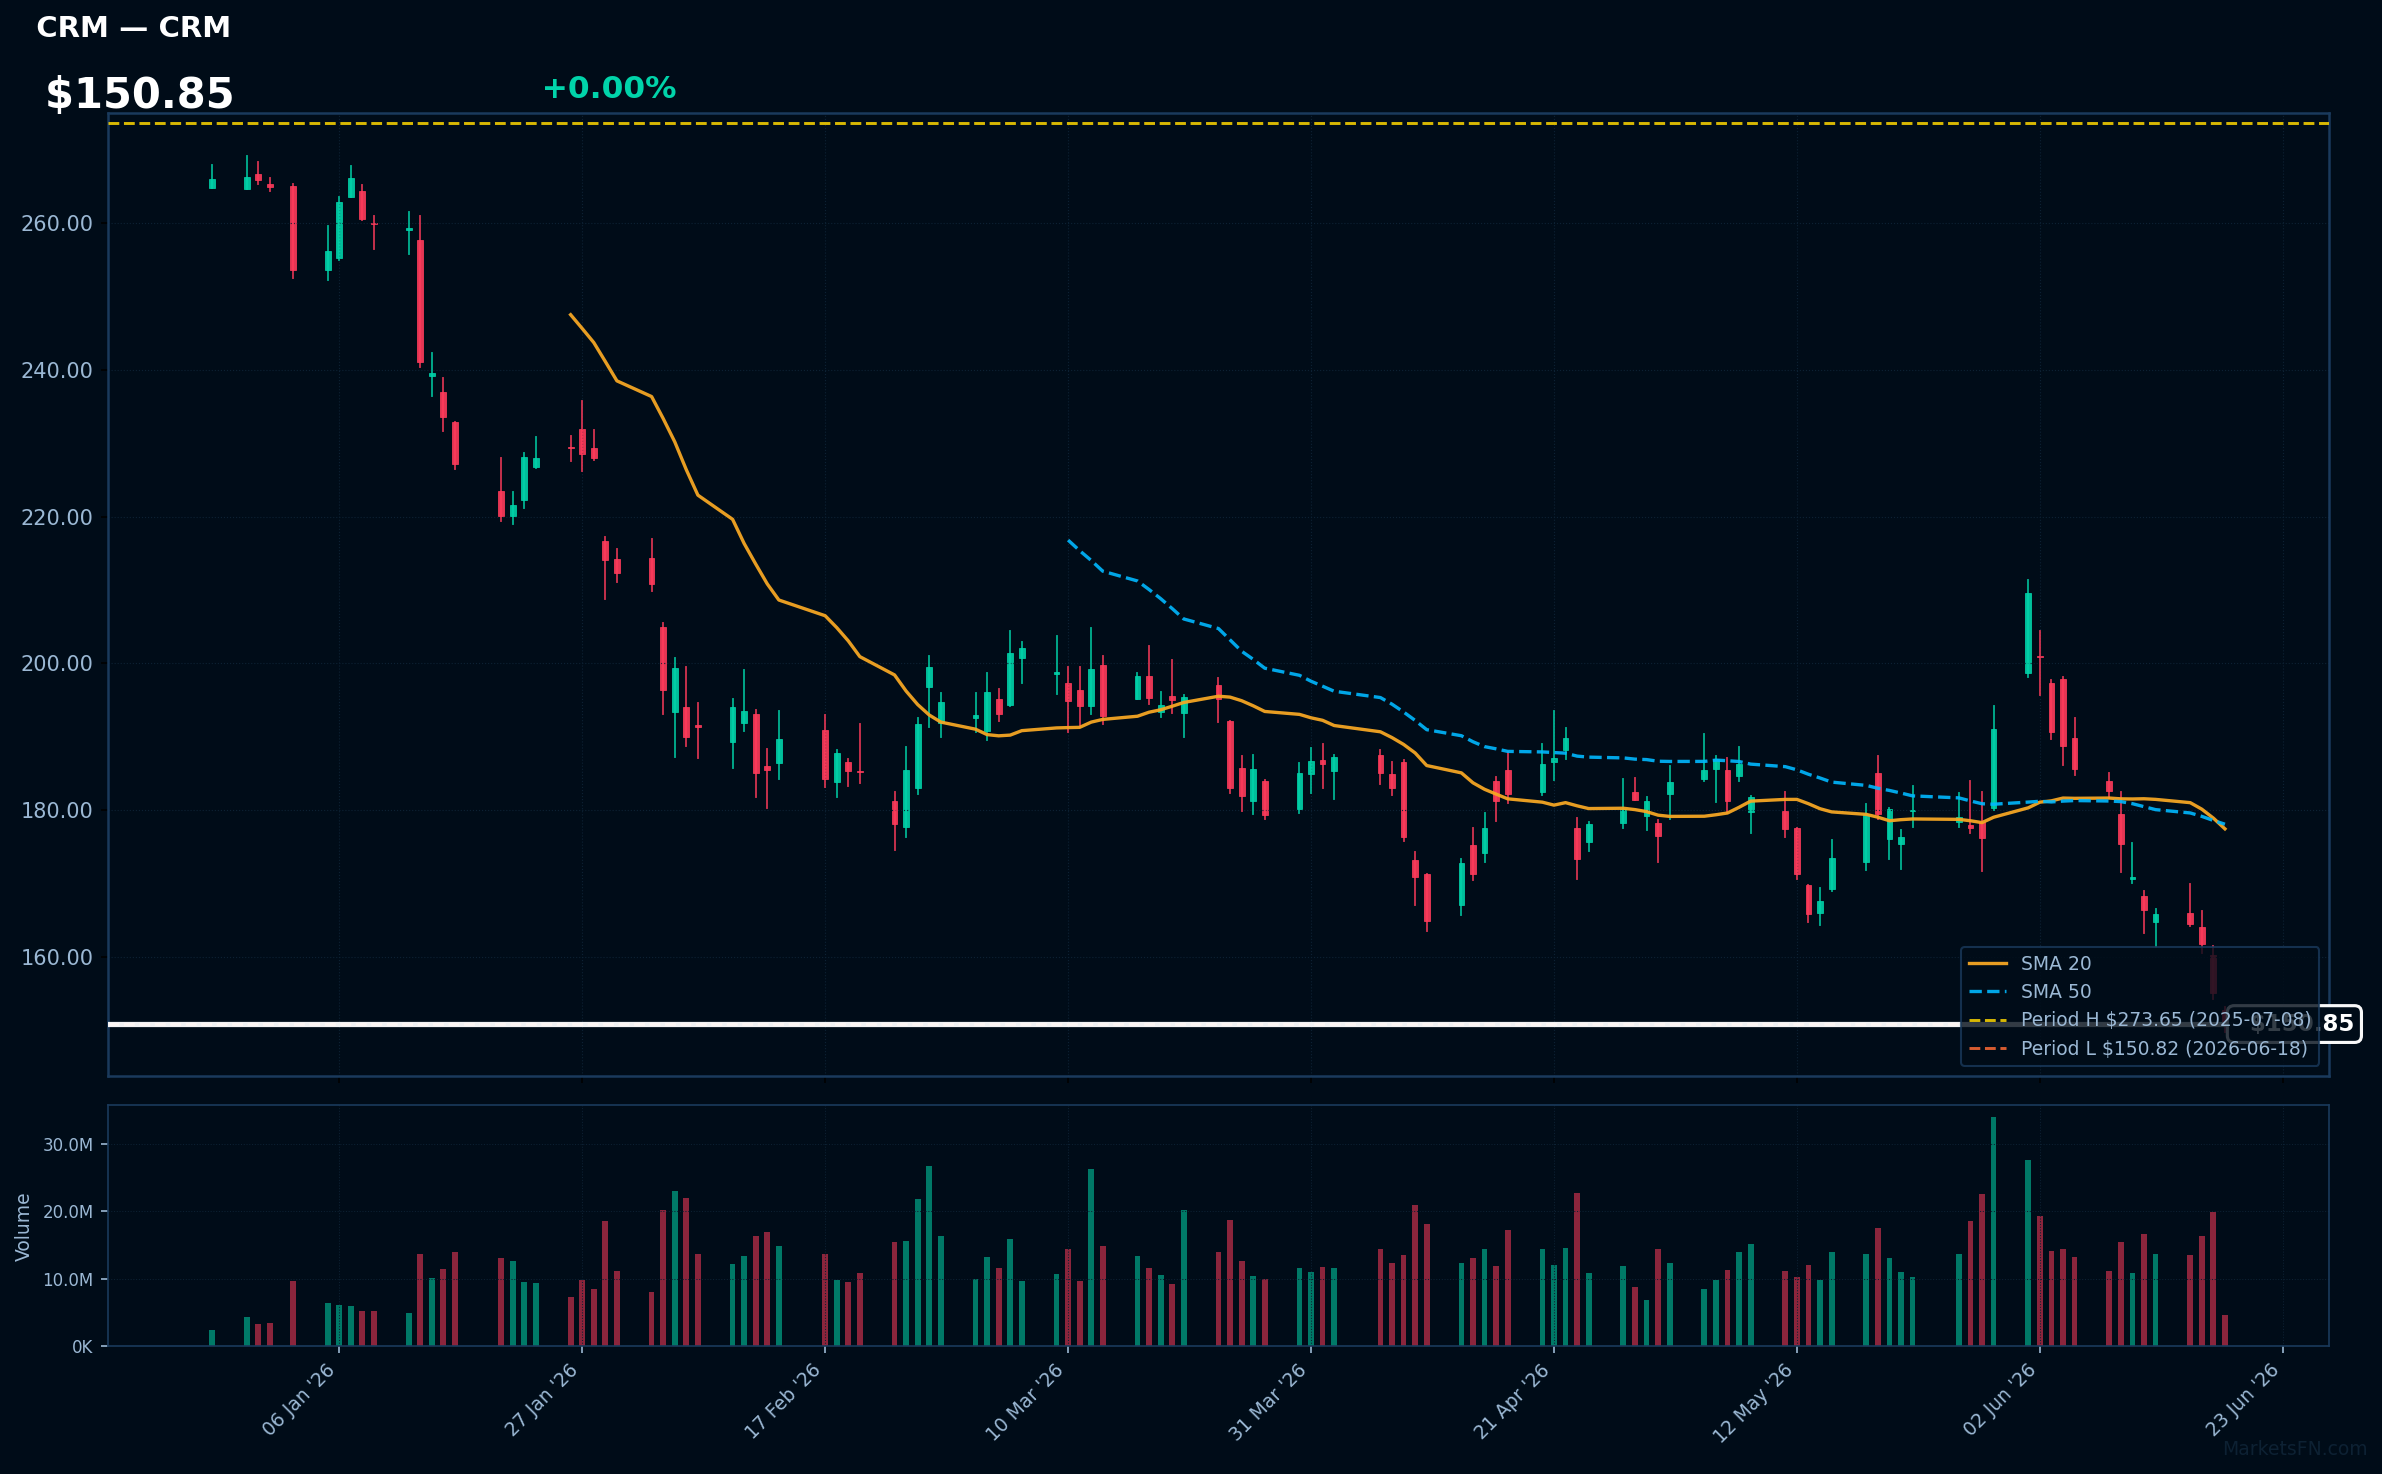
CRM | Salesforce Inc | Technology | Price Last: $150.82 | % Realized: -41.88% | RSI: 30.2 | % above MA200: -30.3% | Trend: Below MA20, MA50, MA200
Salesforce Inc is a customer relationship management (CRM) software provider, enabling businesses to manage sales, marketing, and customer service. Investors care about its cloud-based growth, subscription revenue model, and competitive positioning in the enterprise software market.
Salesforce Inc is testing major support at its 52-Week low, with RSI(14) at 30.2, indicating oversold conditions. The bearish MA alignment (price < MA20 < MA50 < MA200) and -41.9% 52-Week return suggest a sustained downtrend, potentially warning of further downside.
Related headlines
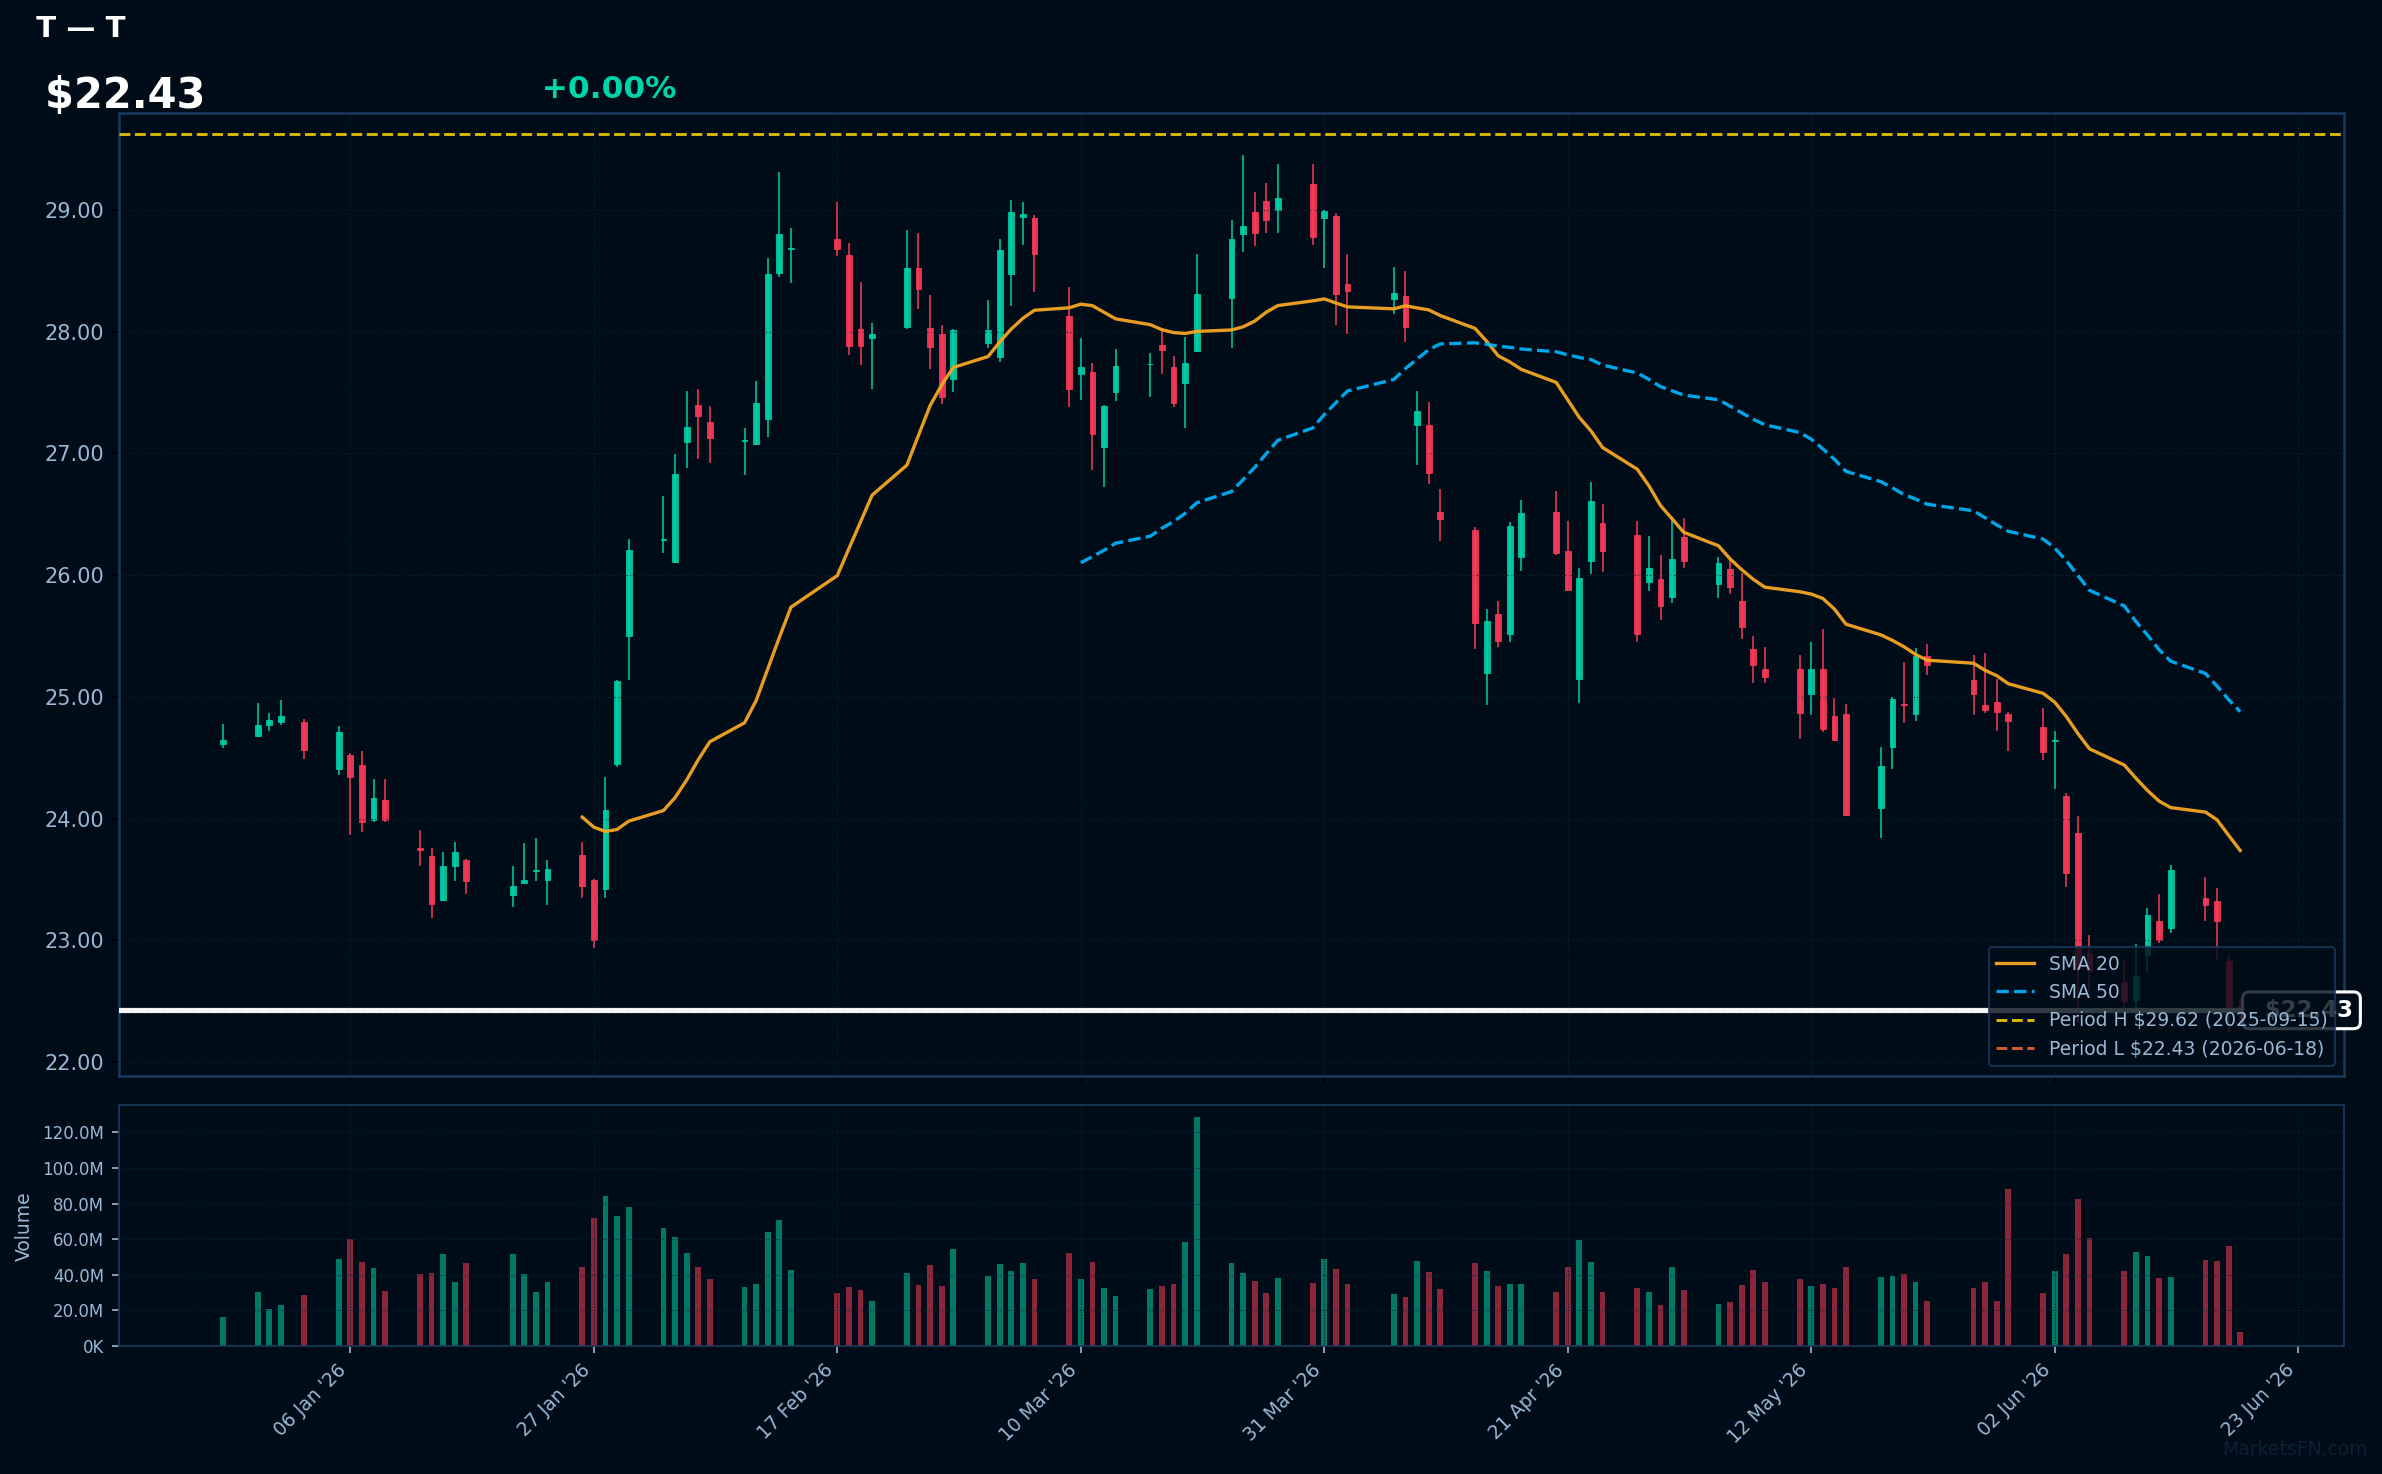
T | AT&T, Inc | Communication Services | Price Last: $22.43 | % Realized: -18.91% | RSI: 32.4 | % above MA200: -14.0% | Trend: Below MA20, MA50, MA200
AT&T, Inc is a telecommunications conglomerate providing wireless services, broadband, and media content. Investors care due to its significant market share and dividend yield, making it a staple in income-focused portfolios.
AT&T's technicals indicate a sustained downtrend with price ($22.43) below MA20, MA50, and MA200. The RSI(14) at 32.4 suggests oversold conditions, and being 0.0% above its 52-Week low signals major support testing, potentially a warning sign.
Related headlines
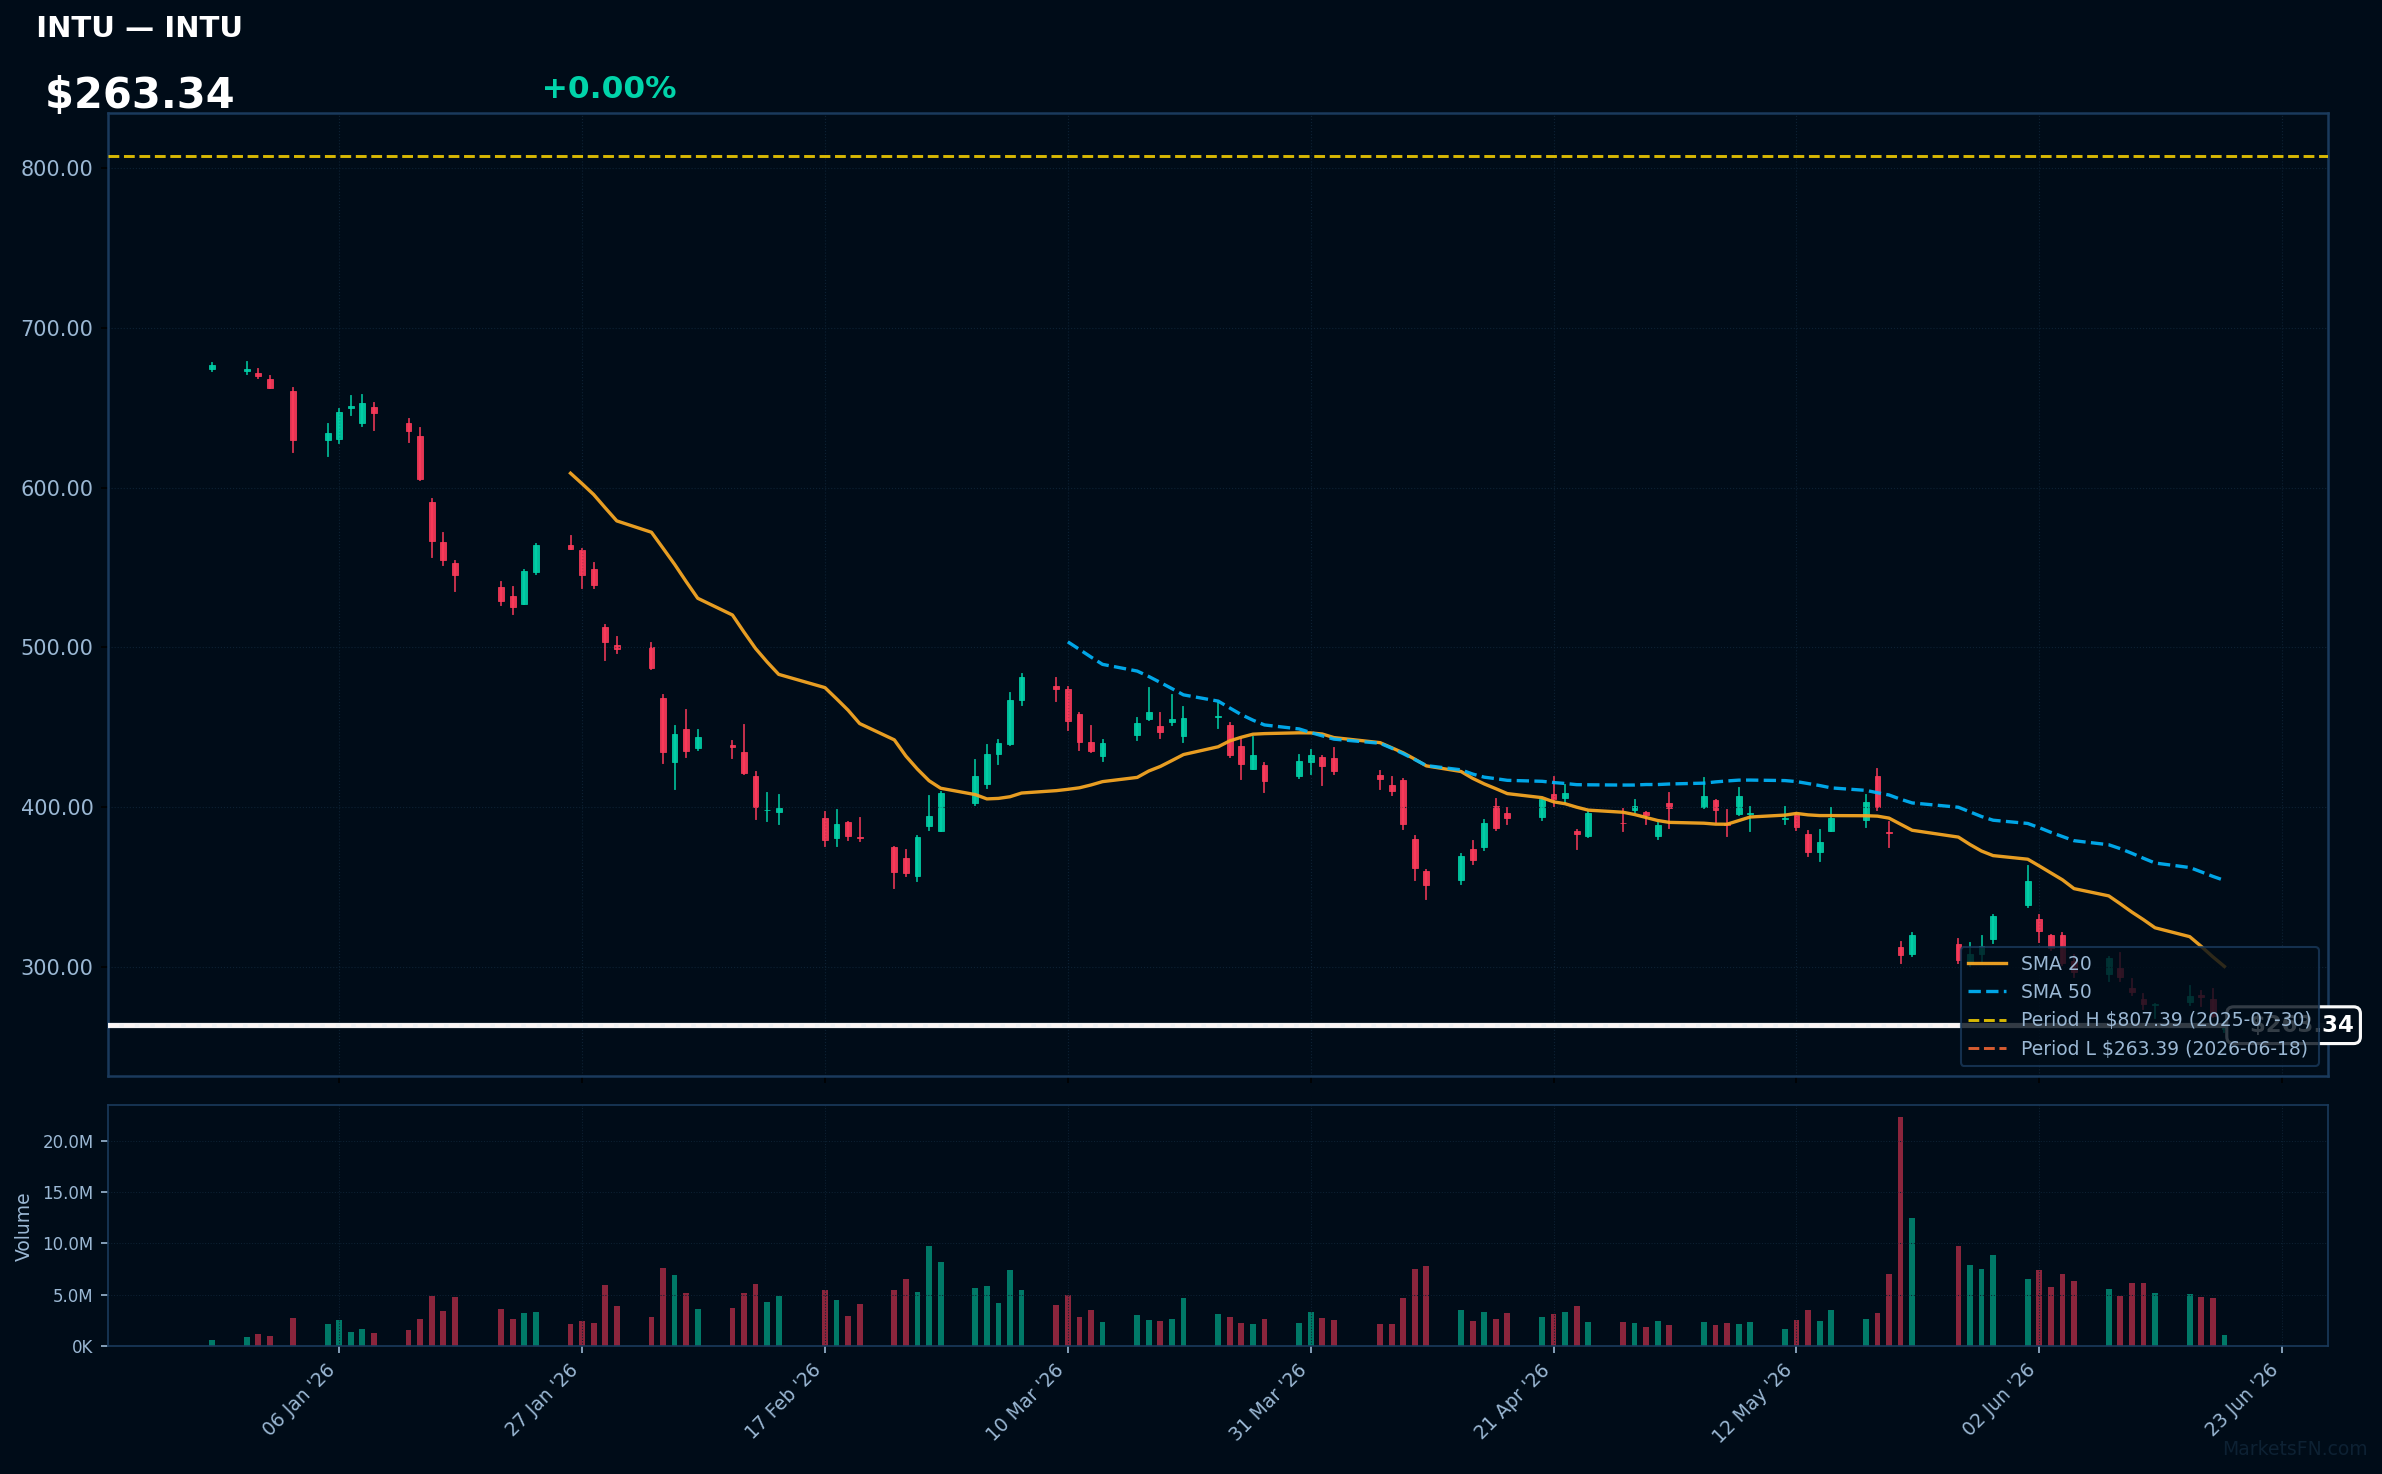
INTU | Intuit Inc | Technology | Price Last: $263.39 | % Realized: -65.11% | RSI: 30.6 | % above MA200: -49.7% | Trend: Below MA20, MA50, MA200
Intuit Inc (INTU) provides financial management solutions, including QuickBooks for small businesses and TurboTax for individual tax preparation, making it a key player in the financial software space with significant exposure to the tax preparation and accounting sectors.
INTU's technical situation is bearish, with an RSI(14) of 30.6 indicating oversold conditions, and a sustained downtrend as price ($263.34) remains below MA20, MA50, and MA200, with the stock testing major support at its 52-Week low.
Related headlines
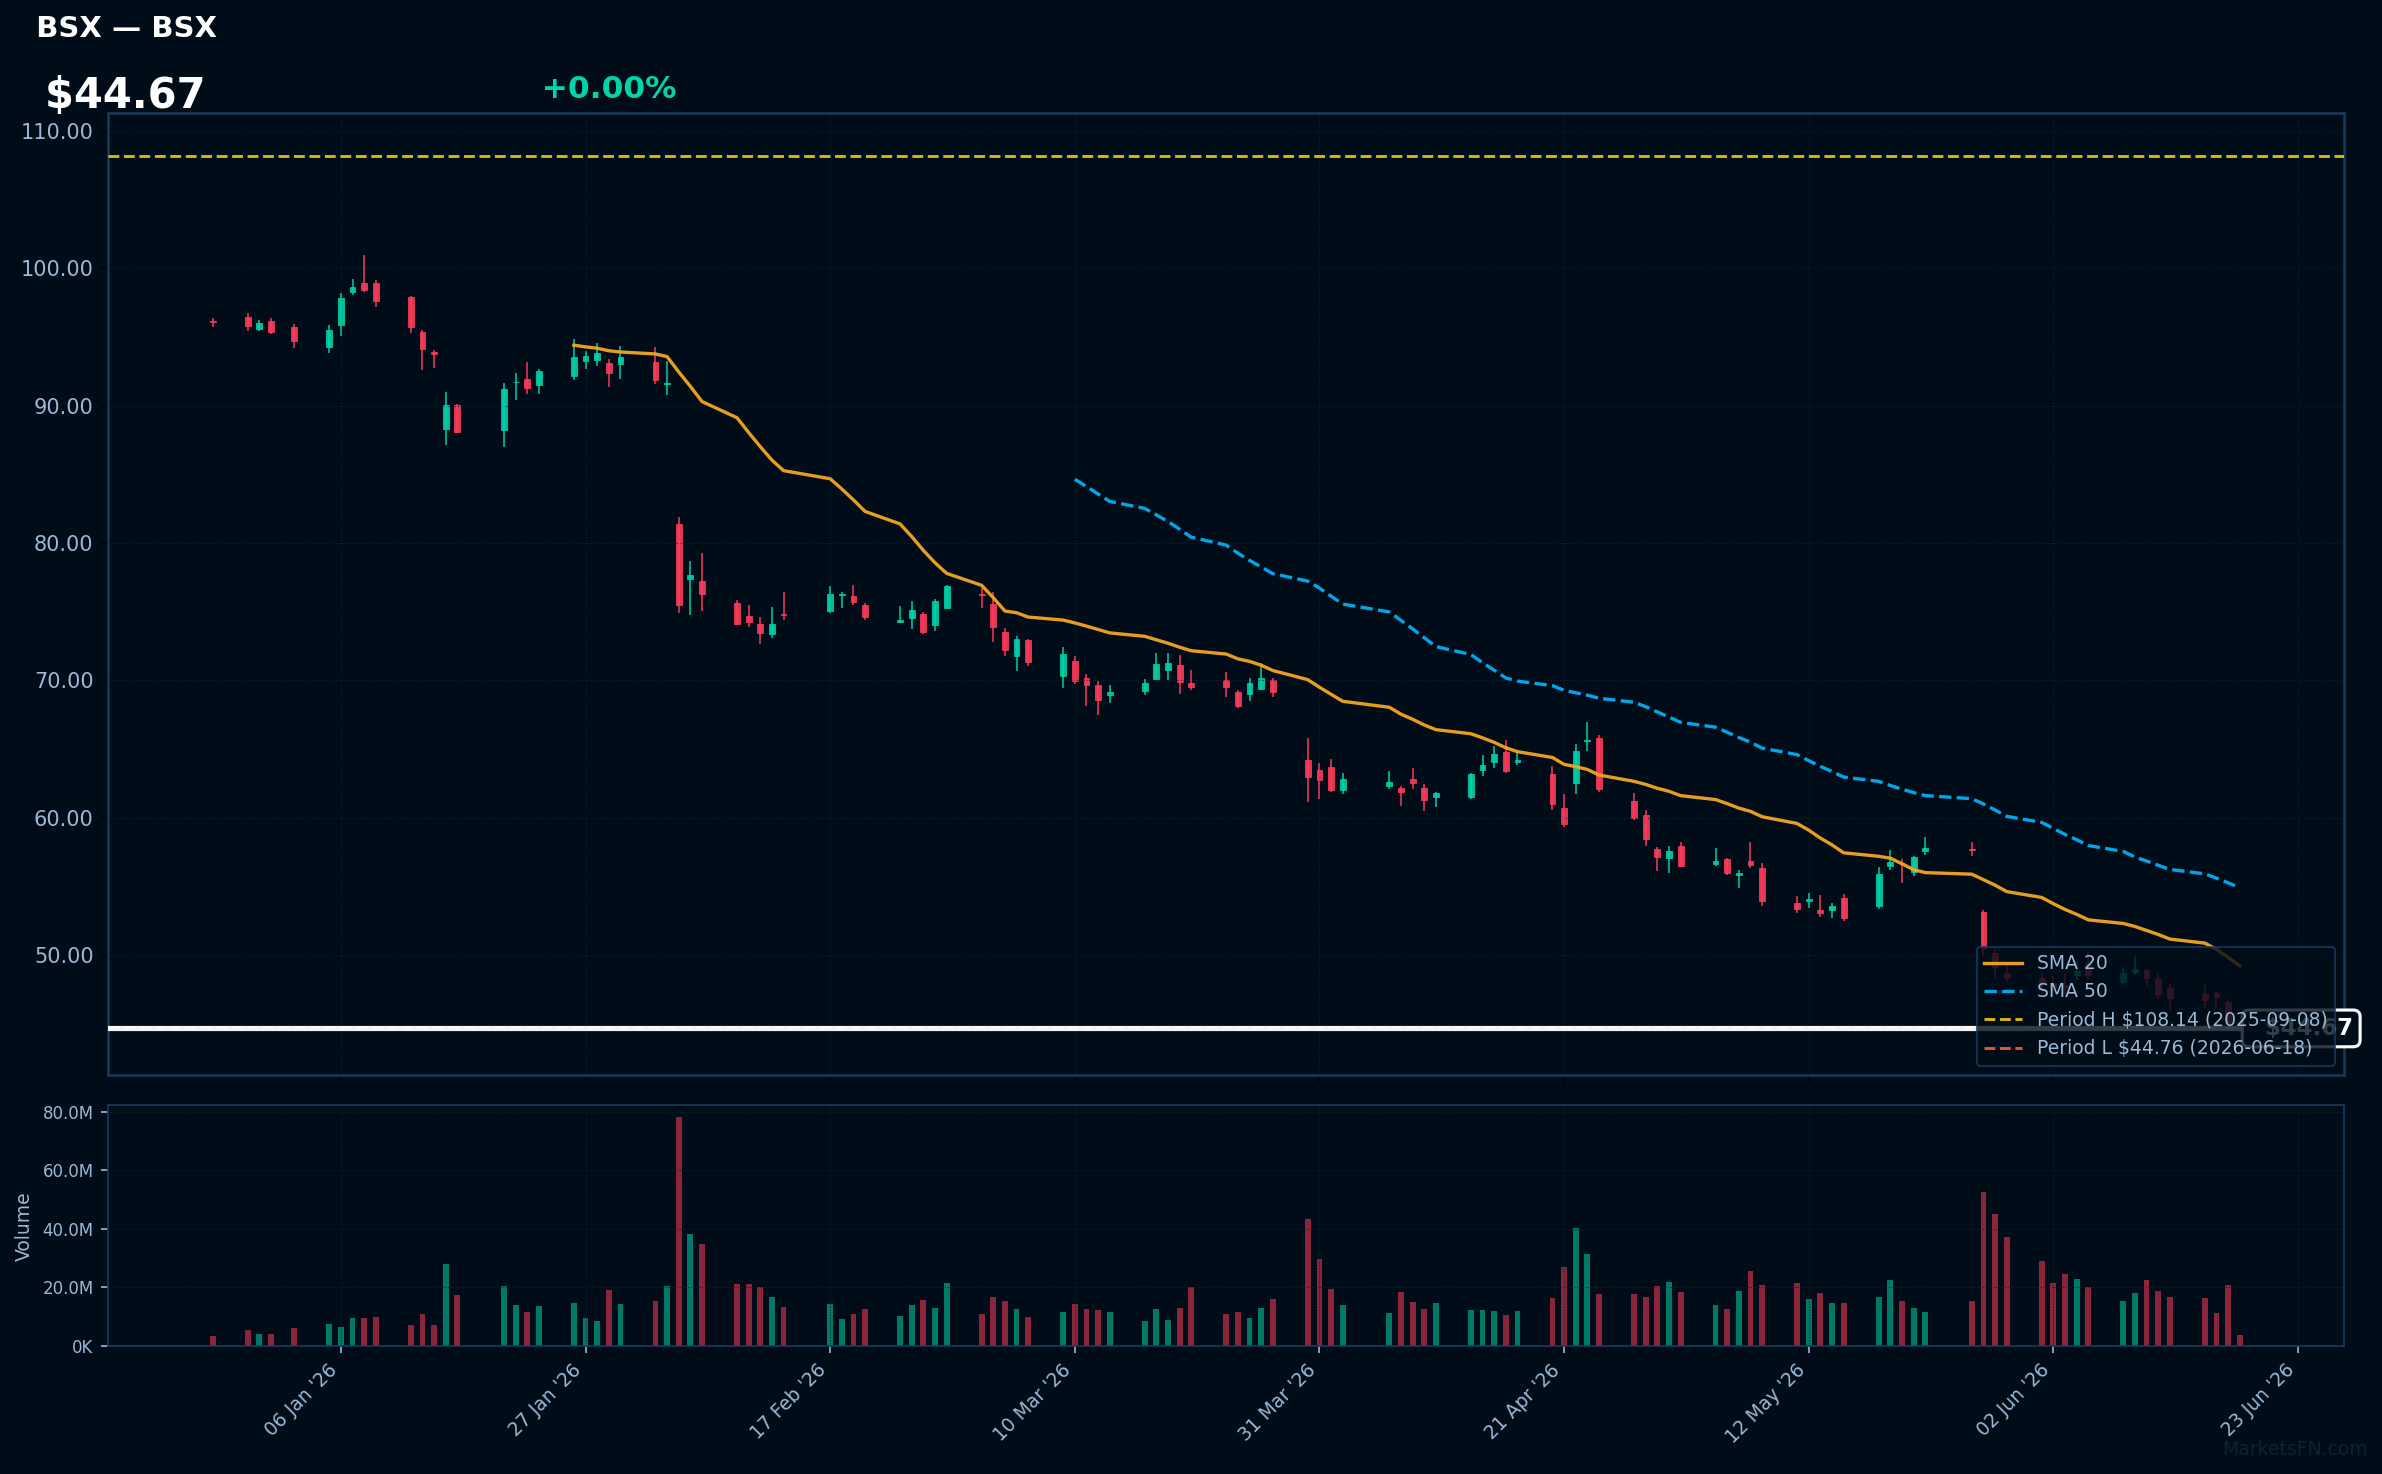
BSX | Boston Scientific Corp | Healthcare | Price Last: $44.76 | % Realized: -55.84% | RSI: 24.5 | % above MA200: -44.9% | Trend: Below MA20, MA50, MA200
Boston Scientific Corp (BSX) develops and manufactures medical devices, including stents, pacemakers, and neurovascular intervention products, addressing cardiovascular and other diseases. Investors should care about its innovation pipeline and market share in the medical device industry.
BSX's technical situation is bearish, with an RSI(14) of 24.5 indicating oversold conditions, and a bearish MA alignment: price ($44.67) < MA20 < MA50 < MA200, suggesting a sustained downtrend. The stock is at its 52-Week low, down 55.8% over the period.
Related headlines
Market Commentary
The S&P 500 stocks listed are currently trading near their 52-week extremes, with some at highs and others at lows. Stocks like JPM, GE, MS, GS, and CAT are at their 52-week highs, while PLTR, CRM, T, INTU, and BSX are at their 52-week lows. This indicates a significant price movement, potentially driven by various market and economic factors.
The stocks at 52-week highs are primarily from the financial and industrials sectors, suggesting a potential rotation into these areas. The presence of JPM, MS, and GS at highs may indicate investor confidence in the financial sector. Conversely, the stocks at 52-week lows span technology and consumer staples, with CRM and INTU representing the tech sector, and T representing consumer staples. This could signal a shift away from these areas or concerns about their current valuations.
Key levels to watch include the current prices of these stocks, as they are at critical support or resistance levels. Potential catalysts for further movement could include macroeconomic data releases, sector-specific news, or company earnings reports. Investors should monitor these stocks closely for signs of breakout or reversal.
Methodology: All 503 S&P 500 constituents screened. 52-week high = highest daily close over the past 252 trading days (approx. 1 year). 52-week low = lowest daily close over the same period. Distance = (current price / extreme − 1) × 100. Technical indicators computed on up to 1 year of daily OHLCV data.
Disclaimer: For informational purposes only. Not investment advice. Past performance is not indicative of future results.