TAIEX Surges 2.50% Amid Yen Decline and Trade Tensions
· Market News · MarketsFN Team
TAIEX Surges 2.50% Amid Yen Decline and Trade Tensions
Note: This analysis covers the Asian trading session close for June 30, 2026. All times are in US Eastern Time (ET).
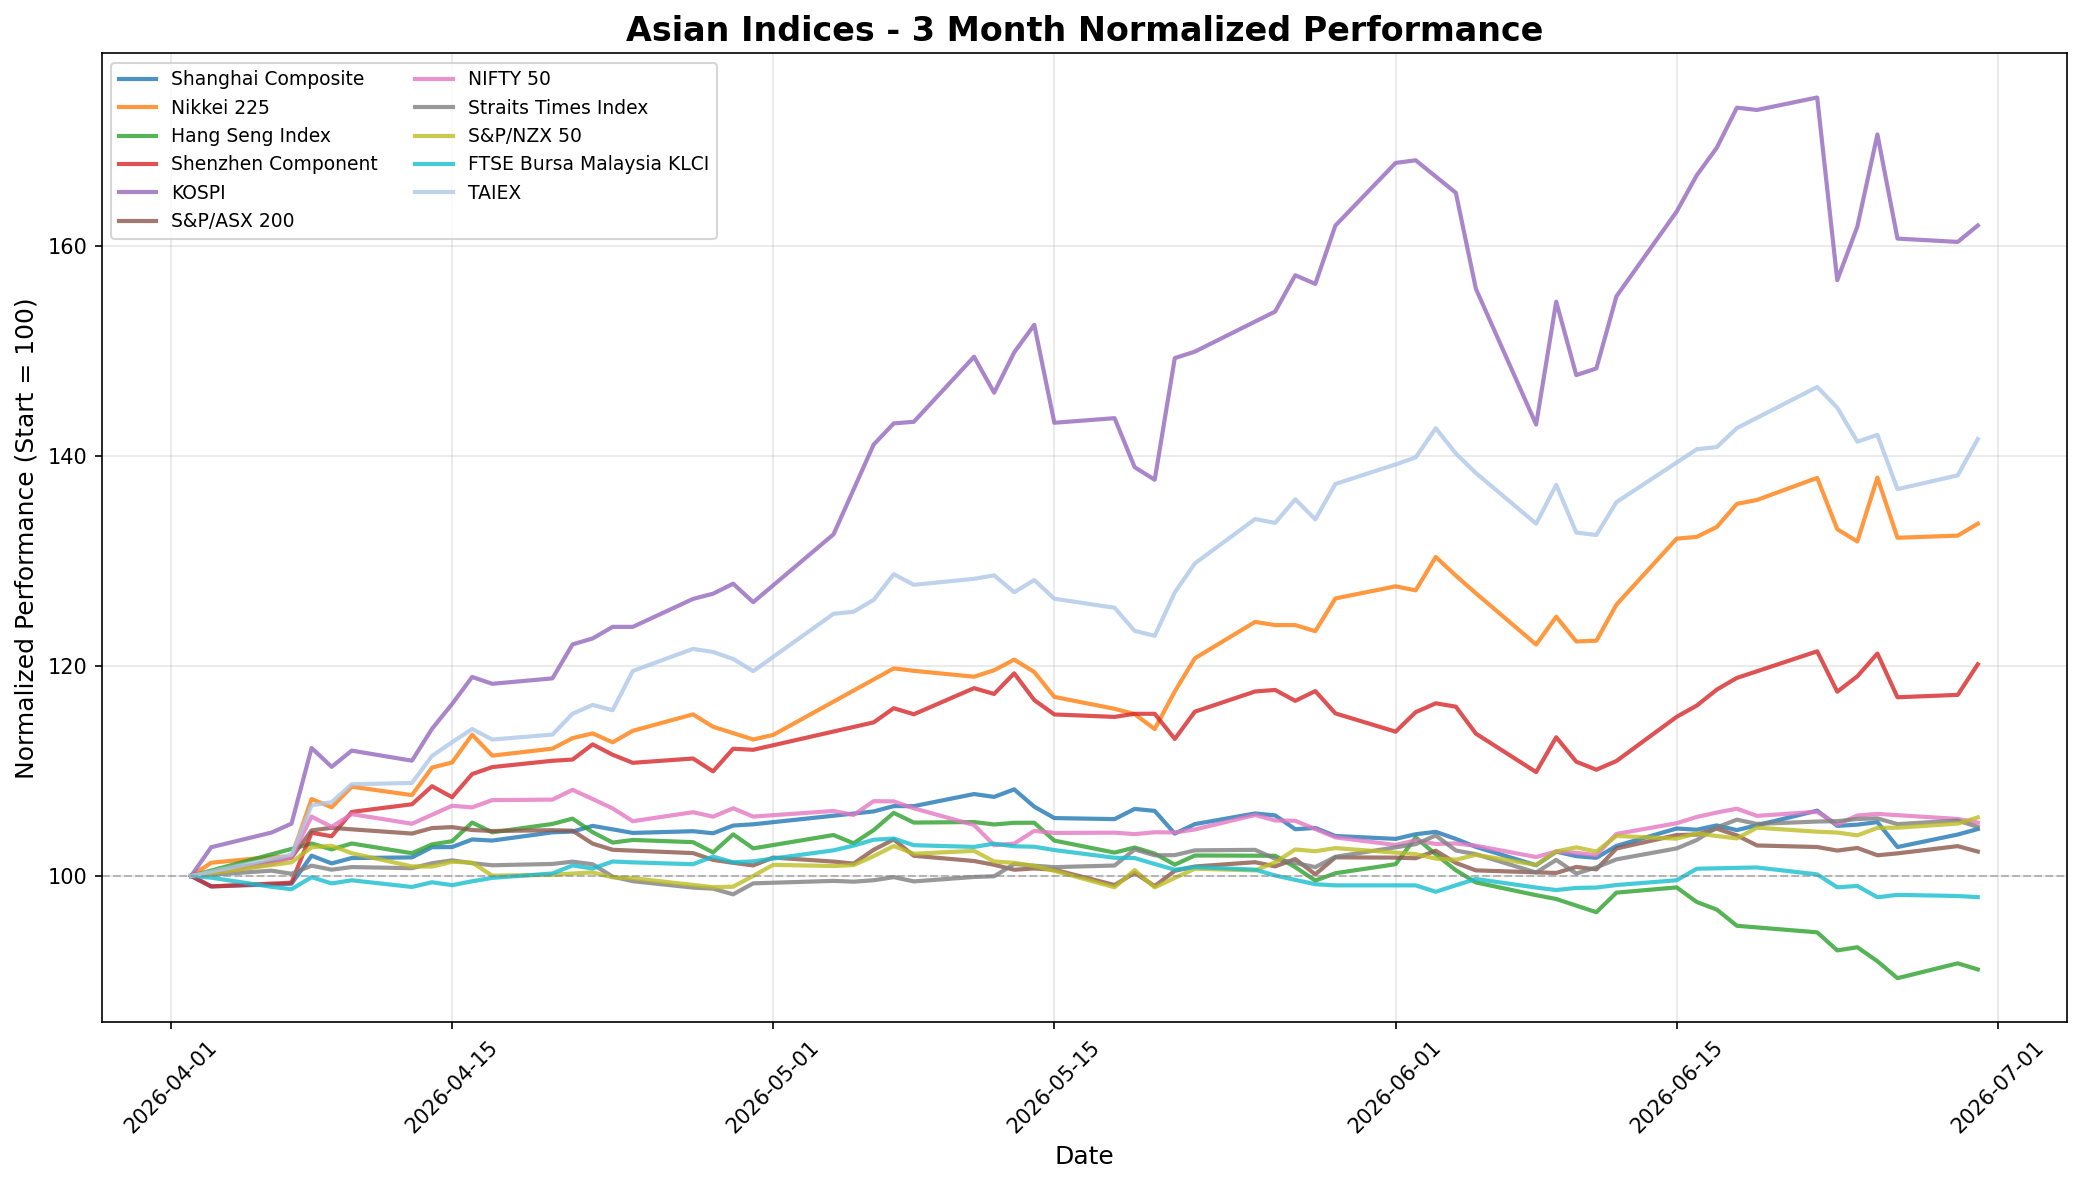
📊 Asian Indices Performance
| Index | Price | Daily Change (%) |
|---|---|---|
| Shanghai Composite | 4,094.40 | +0.50% |
| Nikkei 225 | 70,062.32 | +0.86% |
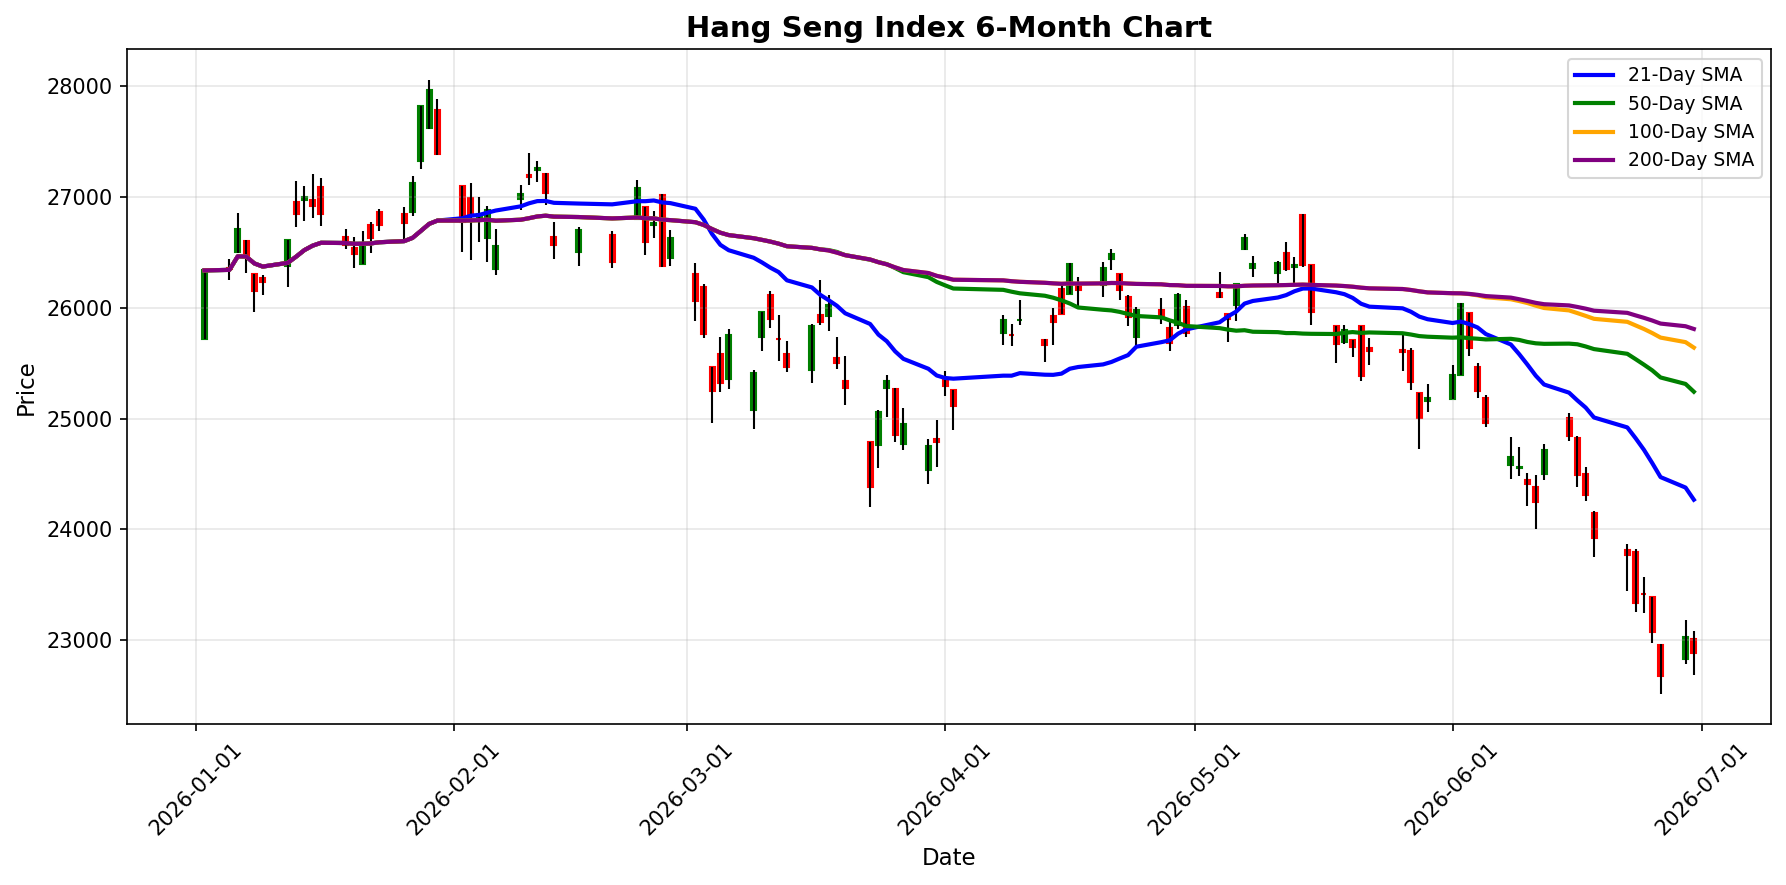
| Hang Seng Index | 22,881.02 | -0.63% |
| Shenzhen Component | 16,205.56 | +2.48% |
| KOSPI | 8,476.48 | +0.97% |
| S&P/ASX 200 | 8,778.70 | -0.51% |
| NIFTY 50 | 23,874.05 | -0.30% |
| Straits Times Index | 5,178.42 | -0.58% |
| S&P/NZX 50 | 13,621.66 | +0.56% |
| FTSE Bursa Malaysia KLCI | 1,664.06 | -0.11% |
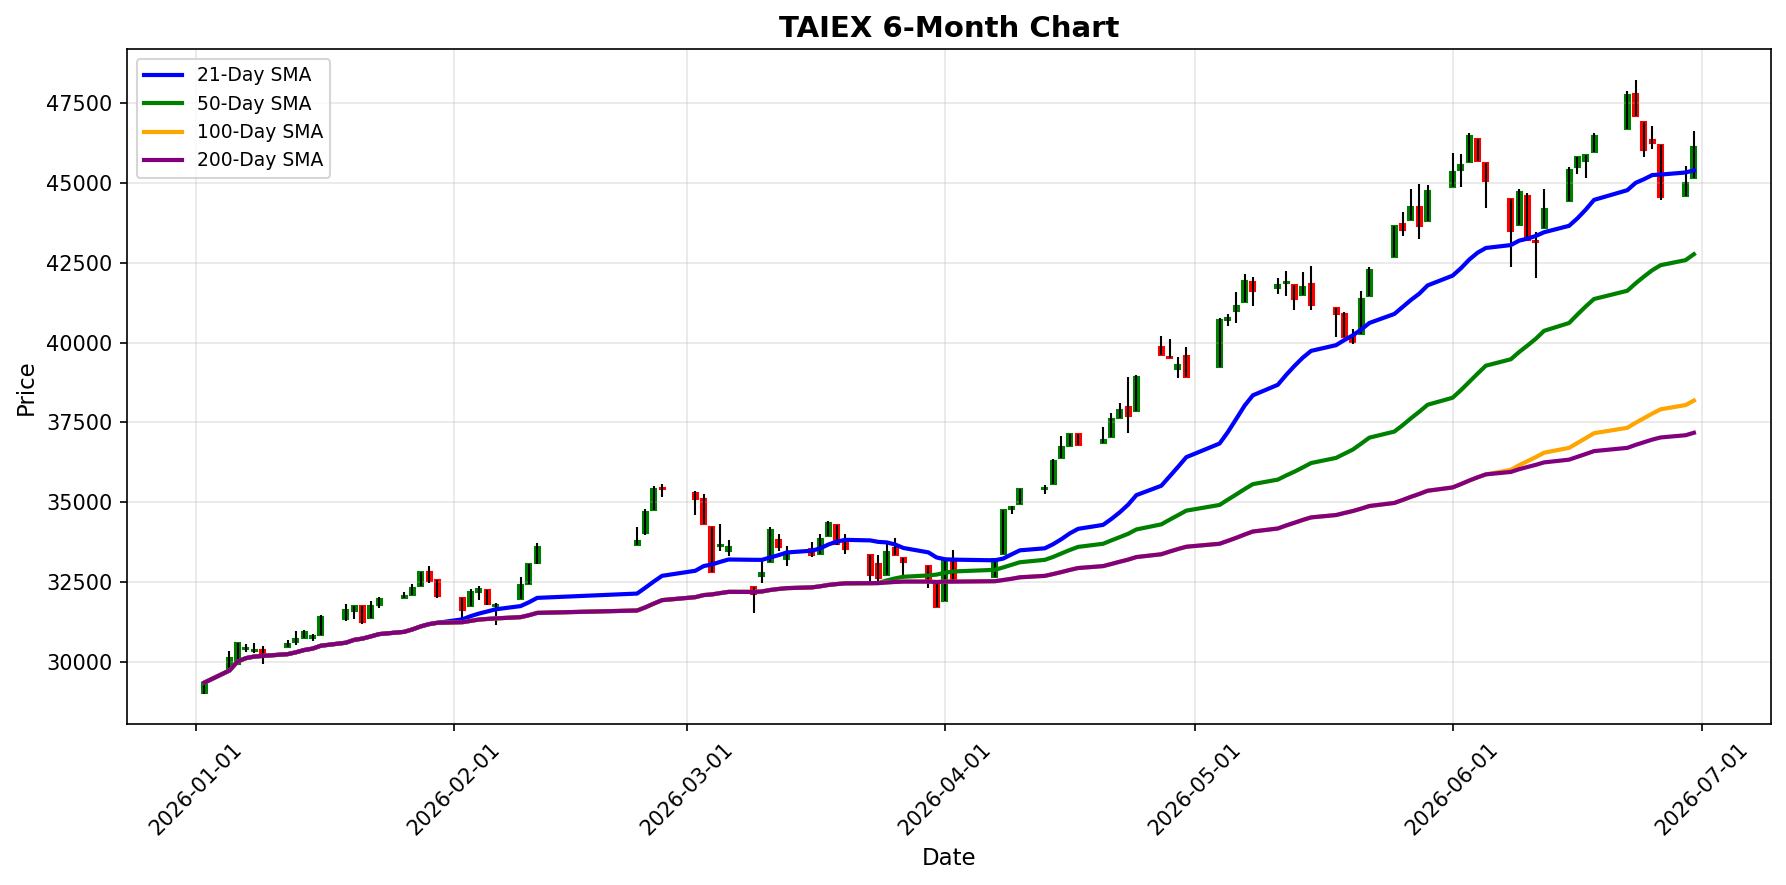
| TAIEX | 46,125.91 | +2.50% |
📰 Market Commentary
As of June 30, 2026, the Asian markets are experiencing mixed performance, influenced by several key events and developments across the region. **Key Events Impacting Asian Indices:** 1. **Japanese Yen Decline**: The Japanese yen has hit a new 39-year low, trading past 162 against the U.S. dollar. This significant depreciation raises concerns about potential intervention by Japanese authorities to stabilize the currency. The weakening yen is impacting investor sentiment and is a focal point for the Japanese market, contributing to a cautious outlook among traders. 2. **China-EU Trade Agreement**: A joint statement from China and the European Union has been released, establishing a platform to monitor trade flows and set up working groups aimed at easing bilateral economic tensions. This development may positively influence market sentiment in China, as it indicates a commitment to improving trade relations. 3. **Local Government Misconduct in China**: Reports of local officials in China falsifying performance data have surfaced, raising concerns about governance and transparency. This could have implications for investor confidence in the Chinese market, as it highlights systemic issues that may affect economic stability. **Market Sentiment and Price Movements:** - The **Shanghai Composite** rose by 0.50%, reflecting a positive response to the China-EU trade discussions. - The **Nikkei 225** increased by 0.86%, despite the yen's decline, indicating resilience among Japanese equities. - Conversely, the **Hang Seng Index** fell by 0.63%, likely influenced by the broader regional unease and local governance issues. - The **Shenzhen Component** surged by 2.48%, suggesting strong performance in the tech sector amid the backdrop of increasing biotech deals and investments. - The **KOSPI** gained 0.97%, reflecting a generally optimistic outlook in South Korea. - The **Straits Times Index** and **S&P/ASX 200** both declined by 0.58% and 0.51%, respectively, as inflationary pressures from external conflicts, particularly the US-Iran war, continue to impact economic conditions. **Regional Economic Developments:** - In Singapore, households are facing record high power bills due to the inflationary effects of the ongoing US-Iran conflict, which is expected to weigh on consumer spending and overall economic sentiment. - DBS Bank has completed Singapore's first synthetic securitisation, a move that is expected to enhance its capital management and lending capacity, indicating a proactive stance in the financial sector. - Great Eastern Financial Advisers has received regulatory approval to expand its wealth management services, showcasing the competitive landscape in Singapore's financial market as institutions seek to capture a larger share of the affluent population. Overall, the Asian markets are navigating a complex landscape characterized by currency fluctuations, trade negotiations, and economic pressures, leading to a mixed sentiment among investors as they assess the implications of these developments on regional indices.
📅 Economic Calendar - Asian Session
All times are in US Eastern Time (ET)
| Date | Time | Cur | Imp | Event | Actual | Forecast |
|---|---|---|---|---|---|---|
| 2026-06-30 | 19:50 | 🇯🇵 | Medium | Tankan All Big Industry CAPEX (Q2) | ||
| 2026-06-30 | 19:50 | 🇯🇵 | Medium | Tankan Big Manufacturing Outlook Index (Q2) | 13 | |
| 2026-06-30 | 19:50 | 🇯🇵 | Medium | Tankan Large Manufacturers Index (Q2) | 16 | |
| 2026-06-30 | 19:50 | 🇯🇵 | Medium | Tankan Large Non-Manufacturers Index (Q2) | 36 | |
| 2026-06-30 | 21:45 | 🇨🇳 | Medium | RatingDog Manufacturing PMI (MoM) (Jun) | 51.9 |
**Asian Economic Events Summary – June 30, 2026** On June 30, 2026, several key economic indicators were released from Japan and China, which are critical for traders monitoring Asian markets. Below is a comprehensive summary of the high-impact data releases, actual vs. forecast comparisons, and their implications for Asian indices. **Japan Economic Data:** 1. **Tankan All Big Industry CAPEX (Q2)** - **Actual:** [Data not provided] - **Forecast:** [Data not provided] - *Market Implication:* The CAPEX figure is crucial for understanding business investment trends. A deviation from expectations could lead to volatility in the Japanese equity market. 2. **Tankan Big Manufacturing Outlook Index (Q2)** - **Actual:** [Data not provided] - **Forecast:** 13 - *Market Implication:* If the actual figure is significantly lower than 13, it may signal a downturn in manufacturing sentiment, negatively impacting the Nikkei 225 index. 3. **Tankan Large Manufacturers Index (Q2)** - **Actual:** [Data not provided] - **Forecast:** 16 - *Market Implication:* Similar to the Outlook Index, a lower-than-expected result could indicate weakening manufacturing conditions, potentially leading to bearish sentiment in Japanese stocks. 4. **Tankan Large Non-Manufacturers Index (Q2)** - **Actual:** [Data not provided] - **Forecast:** 36 - *Market Implication:* A strong performance above 36 could support a bullish outlook for the broader Japanese economy, benefiting non-manufacturing sectors and related equities. **China Economic Data:** 1. **RatingDog Manufacturing PMI (MoM) (June)** - **Actual:** 51.9 - **Forecast:** [Data not provided] - *Market Implication:* A PMI above 50 indicates expansion in the
📈 Index Performance Charts
Best Performer: TAIEX
Worst Performer: Hang Seng Index
💱 FX, Commodities & Crypto
**Market Summary: FX Pairs, Commodities, and Cryptocurrencies** **FX Pairs:** - **USD/JPY**: The pair is trading at 162.2920, reflecting a daily increase of 0.26%. This movement may be attributed to ongoing interest rate differentials and economic data releases from both the U.S. and Japan, which continue to influence investor sentiment. - **USD/CNY**: Currently at 6.7719, the pair has seen a decline of 0.22%. The depreciation of the yuan could be linked to concerns over China's economic growth and ongoing trade tensions. - **AUD/USD**: Priced at 0.6885, this pair has decreased by 0.10%. The Australian dollar's performance is influenced by commodity prices and the overall risk sentiment in global markets. - **NZD/USD**: The pair is at 0.5657, showing a slight increase of 0.04%. The New Zealand dollar remains relatively stable, supported by agricultural exports and a resilient domestic economy. **Commodities:** - **Gold**: Trading at $4,033.50, gold has increased by 0.28%. The rise in gold prices can be attributed to safe-haven demand amid geopolitical uncertainties and inflation concerns. - **Silver**: At $59.12, silver has experienced a notable gain of 1.62%. This uptick is likely driven by industrial demand and investor interest in precious metals as a hedge against inflation. - **Crude Oil (WTI)**: Currently priced at $70.71, WTI crude oil has seen a minor decline of 0.06%. The oil market remains sensitive to supply chain
Currency Pairs
| Pair | Price | Daily Change (%) |
|---|---|---|
| USD/JPY | 162.29 | +0.26% |
| USD/CNY | 6.77 | -0.22% |
| AUD/USD | 0.69 | -0.10% |
| NZD/USD | 0.57 | +0.04% |
Commodities
| Commodity | Price | Daily Change (%) |
|---|---|---|
| Gold | $4033.50 | +0.28% |
| Silver | $59.12 | +1.62% |
| Crude Oil (WTI) | $70.71 | -0.06% |
Cryptocurrencies
| Asset | Price | Daily Change (%) |
|---|---|---|
| Bitcoin | $59,190 | -1.58% |
| Ethereum | $1,581 | -1.82% |
Disclaimer
The content on MarketsFN.com is provided for educational and informational purposes only. It does not constitute financial advice, investment recommendations, or trading guidance. All investments involve risks, and past performance does not guarantee future results. You are solely responsible for your investment decisions and should conduct independent research and consult a qualified financial advisor before acting. MarketsFN.com and its authors are not liable for any losses or damages arising from your use of this information.