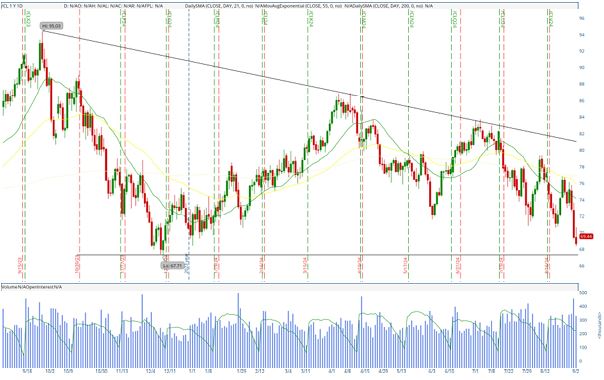
The following is a technical analysis of Crude Oil Futures (/CL) October contract using a a Daily Chart
Trend Analysis:
- Primary Trend: The chart indicates a long-term downtrend, which is clearly evidenced by the downward sloping trendline connecting the highs from earlier in the year. This trendline has acted as a strong resistance level multiple times, confirming the bearish sentiment in the market.
- Recent Price Action: Recently, the price has been moving in a range between $67.71 and $88.07, but the overall direction remains bearish as the price continues to make lower highs and lower lows. The latest trading session shows a significant bearish candle with a closing price of $69.42, suggesting increased selling pressure.
Moving Averages:
- 200-Day Simple Moving Average (SMA): The red line represents the 200-day SMA, which is trending downward and currently sits around $76.24. The price is trading well below this SMA, indicating a strong bearish trend. This moving average has acted as a resistance level multiple times, reinforcing the overall bearish sentiment.
- 50-Day Exponential Moving Average (EMA): The yellow line is the 50-day EMA, currently at $76.75. The price is also below this level, which typically suggests that the shorter-term trend is also bearish. The recent rejection near this EMA indicates that sellers are still in control.
- 21-Day Simple Moving Average (SMA): The green line represents the 21-day SMA at $74.95. The price has failed to sustain above this moving average, which further confirms the bearish momentum in the short term.
Support and Resistance:
- Support Level: The key support level is around $67.71, which is the low reached earlier this year. This level is critical as a break below it could lead to further declines, potentially targeting the $65.00 level.
- Resistance Levels: Immediate resistance is seen at the 21-day SMA ($74.95), followed by the 50-day EMA ($76.75). The major resistance is the 200-day SMA at $76.24. If the price manages to break above these levels, it could indicate a potential reversal, but as of now, these levels are acting as strong barriers to any upward movement.
Volume and Open Interest:
- Volume: The volume is shown in blue bars at the bottom of the chart. There was a noticeable increase in volume during the recent bearish move, which adds validity to the downward pressure. Higher volume on down days often confirms the strength of the bearish trend.
- Open Interest: The green line shows open interest, which indicates the number of outstanding contracts. A declining open interest in a downtrend could suggest that the trend might be losing strength, but an increasing open interest would indicate that more participants are entering the market, potentially reinforcing the bearish trend.
Conclusion:
- Bearish Sentiment Prevails: The chart shows a clear bearish trend with strong resistance levels around the moving averages. The recent price action, combined with high trading volume on down days, suggests that the market sentiment remains bearish.
- Potential Breakdown: A close below the $67.71 support level could trigger further downside, with the next major support likely around the $65.00 mark.
- Short-Term Outlook: In the short term, any rallies are likely to face resistance at the moving averages, particularly the 50-day EMA and 200-day SMA. Until the price breaks above these levels with conviction, the trend remains firmly bearish.
Traders should keep an eye on the volume and price action around the key support level at $67.71 for any signs of a potential breakdown or reversal.
