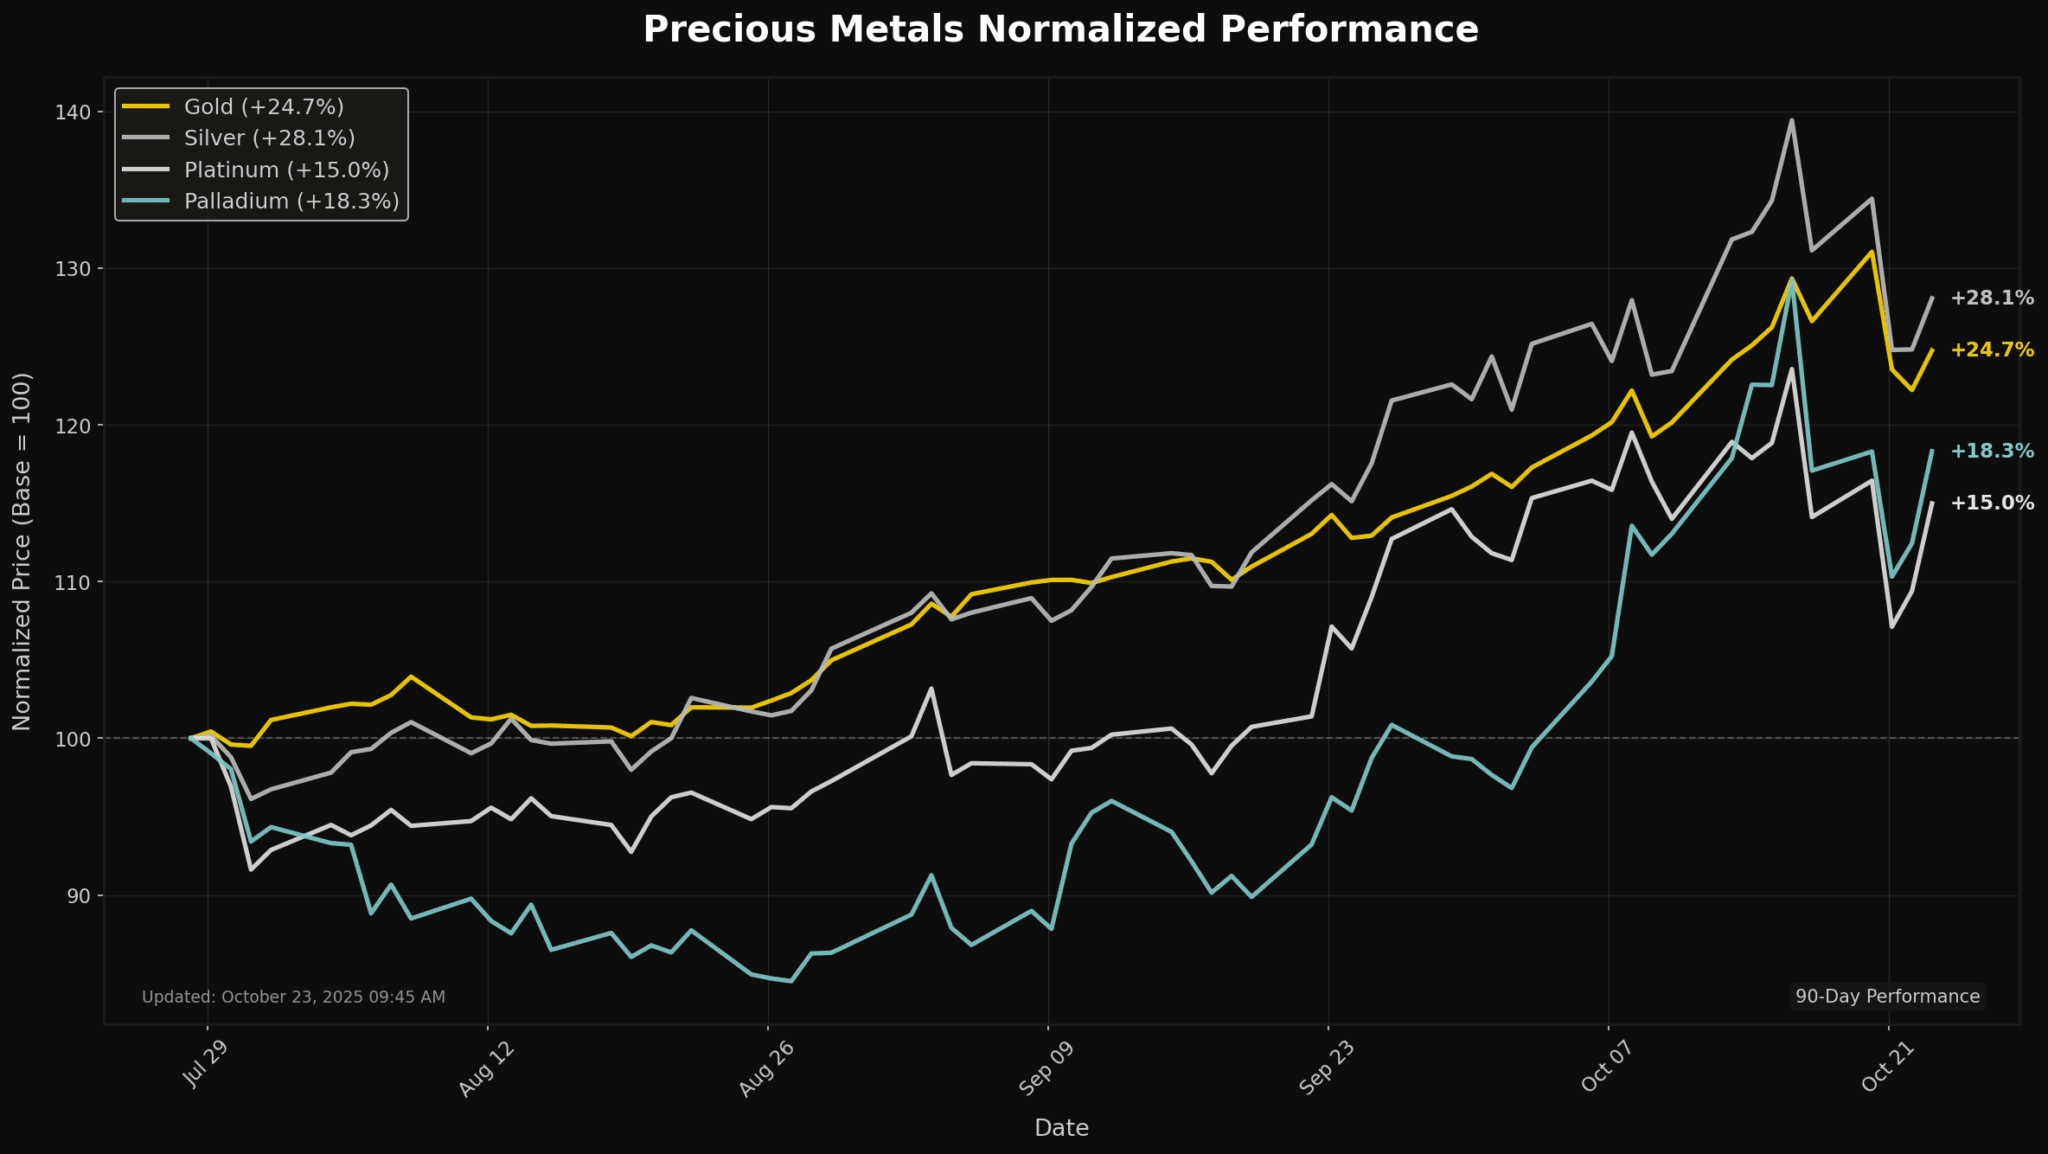
Precious Metals Update: Platinum Surges 3.95% Extending Above 50-Day MA
📊 Market Overview
The precious metals market on October 23, 2025 shows dynamic activity amid evolving economic conditions and safe-haven demand. Below is a comprehensive breakdown of each metal’s performance, technical indicators, market news, and outlook.
Performance Summary
| Metal | Price | Daily Change (%) | MA21 | MA50 | MA100 | MA200 | RSI | MACD |
|---|---|---|---|---|---|---|---|---|
| Gold | $4127.90 | +1.54% | $4006.82 | $3734.82 | $3542.85 | $3295.07 | 58.97 | 125.36 |
| Silver | $48.70 | +2.12% | $48.17 | $43.75 | $40.45 | $36.48 | 55.05 | 1.58 |
| Platinum | $1614.50 | +3.95% | $1612.12 | $1478.10 | $1407.30 | $1195.61 | 53.88 | 32.13 |
| Palladium | $1515.00 | +3.76% | $1406.63 | $1255.44 | $1204.20 | $1082.43 | 60.43 | 75.35 |
🥇 Gold
Current Price: $4127.90 (+1.54%)
📰 Market News & Drivers
In the quiet hours following October 22, 2025, at 09:44 PM, the gold market has shown no significant recent developments, maintaining a steady yet subdued posture amid watchful investor eyes. Absent fresh catalysts, prices for the precious metal have hovered without notable volatility, reflecting a temporary lull in trading activity during off-peak global sessions. Geopolitical tensions and economic uncertainties that typically propel gold as a safe-haven asset remain in the background, but no new escalations or data releases have emerged to stir sentiment in the last 12 hours. Supply chains and demand trends from industrial and retail sectors appear stable, with no reported disruptions or surges influencing spot prices. Investor confidence holds neutral, as participants await potential triggers like upcoming policy announcements or inflation metrics. Near-term implications suggest continued consolidation, with gold likely to react swiftly to any breaking events, underscoring its role as a barometer for broader market nerves.
📈 Technical Analysis
As of the latest analysis, Gold is priced at $4127.90, reflecting a daily increase of 1.54%. The upward movement is supported by its positioning above key moving averages: MA21 at $4006.82, MA50 at $3734.82, MA100 at $3542.85, and MA200 at $3295.07, indicating a bullish trend in the short to mid-term. The Relative Strength Index (RSI) stands at 58.97, suggesting that Gold is nearing overbought territory but still has room for upward momentum. The MACD reading of 125.36 further confirms bullish momentum, signaling potential continuation of the current uptrend. Immediate support is likely around the MA21, while resistance can be encountered at psychological levels above $4130. Should Gold maintain its momentum above these levels, we may see a test of higher resistance zones in the near future, strengthening the bullish outlook for the asset.
🥈 Silver
Current Price: $48.70 (+2.12%)
📈 Technical Analysis
Silver is currently trading at $48.70, reflecting a robust daily change of 2.12%. The price remains well above key moving averages: the 21-day (MA21) at $48.17, the 50-day (MA50) at $43.75, the 100-day (MA100) at $40.45, and the 200-day (MA200) at $36.48, suggesting a strong uptrend in the short to medium term.
The Relative Strength Index (RSI) is at 55.05, indicating that silver is in a relatively balanced momentum zone, neither overbought nor oversold. The MACD reading of 1.58 supports this, showing bullish momentum with potential for further upside. Key support is established at the MA21, while resistance is likely around $50.00.
Overall, the technical outlook for silver remains positive, favoring continued upward movement, particularly if it maintains above the MA21.
⚪ Platinum
Current Price: $1614.50 (+3.95%)
📈 Technical Analysis
As of the latest data, platinum is trading at $1614.50, reflecting a daily gain of 3.95%. The current price is above the 21-day moving average (MA21) of $1612.12, indicating a short-term bullish trend. Moreover, the price remains significantly above the longer-term moving averages (MA50 at $1478.10, MA100 at $1407.30, and MA200 at $1195.61), reinforcing the overall upward momentum in the medium to long term.
The Relative Strength Index (RSI) at 53.88 suggests that platinum is in neutral territory, indicating room for further upward movement without entering overbought conditions. The Moving Average Convergence Divergence (MACD) at 32.13 also supports a positive outlook, reflecting ongoing bullish momentum. Key support levels to monitor are around MA21, while resistance levels could emerge near psychological levels around $1650. Overall, the outlook for platinum remains
💎 Palladium
Current Price: $1515.00 (+3.76%)
📈 Technical Analysis
Palladium is currently trading at $1515.00, reflecting a robust daily increase of 3.76%. The price is significantly above key moving averages, with the 21-day MA at $1406.63, suggesting strong bullish momentum. The distance above the 50-day ($1255.44) and 100-day ($1204.20) MAs indicates a solid upward trend. The 200-day MA ($1082.43) is also well below the current price, affirming a bullish long-term outlook.
The RSI at 60.43 indicates that palladium is nearing overbought territory, yet it maintains upward momentum. Meanwhile, the MACD of 75.35 suggests a strong bullish signal, reinforcing the potential for further gains. Key resistance levels are observed around $1550, while support is well-positioned at the 21-day MA of $1406.63. Overall, palladium’s price action leans positively, with a potential short
Disclaimer
The content on MarketsFN.com is provided for educational and informational purposes only. It does not constitute financial advice, investment recommendations, or trading guidance. All investments involve risks, and past performance does not guarantee future results. You are solely responsible for your investment decisions and should conduct independent research and consult a qualified financial advisor before acting. MarketsFN.com and its authors are not liable for any losses or damages arising from your use of this information.
