As a financial journalist covering the energy sector, I’ve pored over countless reports from the Organization of the Petroleum Exporting Countries (OPEC), but the October 2025 Monthly Oil Market Report (MOMR) stands out for its steadfast confidence in global demand growth—even as crude prices show signs of volatility and economic uncertainties linger. Released on October 13, 2025, the report paints a picture of resilient oil consumption driven by non-OECD economies, but it also raises a critical question: Will this projected uptick be sufficient to counterbalance supply pressures and prevent a prolonged price slump?
Let’s dive into the key insights. The report’s feature article, a deep dive into global oil demand trends, underscores a robust trajectory. In 2024, demand expanded by a solid 1.5 million barrels per day (mb/d), fueled largely by strong economic activity in regions like China and Other Asia. For 2025, OPEC holds firm on its forecast of 1.3 mb/d growth, pushing global demand to an average of 105.1 mb/d. This optimism extends into 2026, with an expected increase of 1.4 mb/d to 106.5 mb/d. Transportation fuels are the stars here: jet/kerosene is projected to surge by 380 thousand barrels per day (tb/d) in 2025, followed by diesel at 300 tb/d and gasoline at 280 tb/d. Petrochemical feedstocks like LPG and naphtha aren’t far behind, adding 330 tb/d and 180 tb/d, respectively, while heavy distillates dip by 120 tb/d.
Breaking it down regionally, the non-OECD bloc dominates the narrative, accounting for about 1.2 mb/d of the 2025 growth. Other Asia leads with 280 tb/d, China follows at 180 tb/d, and contributions from Africa (200 tb/d), Latin America (145 tb/d), the Middle East (140 tb/d), and India (100 tb/d) round out the picture. In contrast, OECD demand edges up by just 130 tb/d, with the Americas driving 160 tb/d growth, Europe adding 30 tb/d, and Asia Pacific contracting by 60 tb/d. The report highlights ongoing airline recovery and petrochemical needs as key supports, but it cautions on risks like inflation, monetary tightening, and sovereign debt.
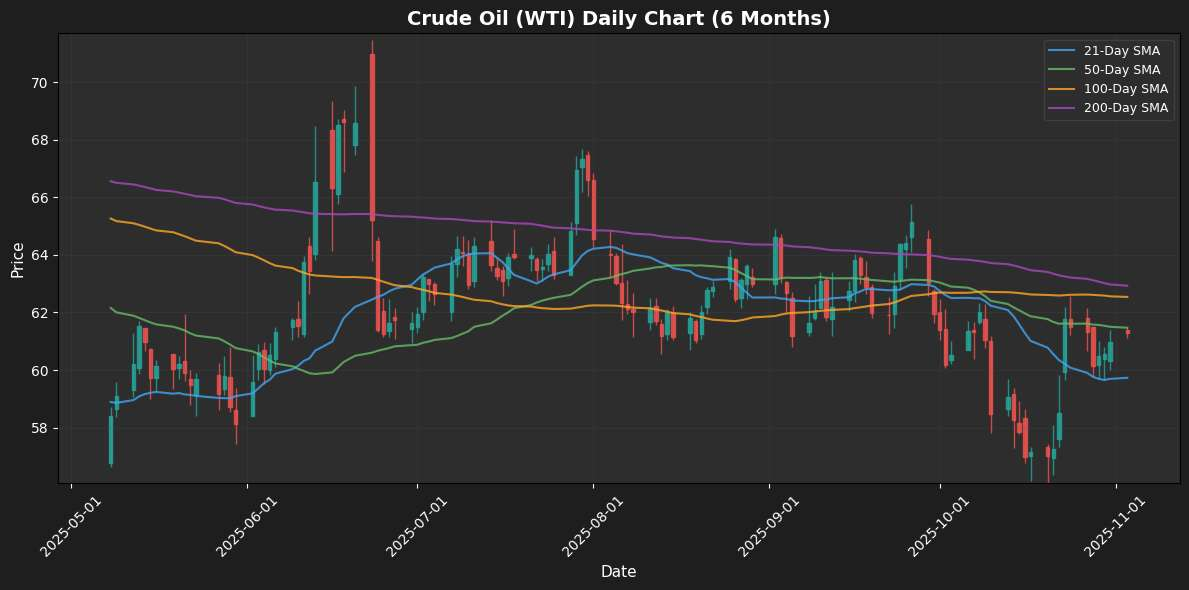
On the price front, September 2025 brought mixed signals. The OPEC Reference Basket (ORB) rose modestly by 66 cents month-on-month (m-o-m) to $70.39 per barrel (/b), buoyed by gains in ICE Brent (+32 cents to $67.58/b) and DME Oman (+81 cents to $70.04/b). However, NYMEX WTI slipped 49 cents to $63.53/b, widening the Brent-WTI spread to $4.05/b. Forward curves flattened for Brent and WTI but strengthened for Oman and Dubai, signaling varied market sentiments. Hedge funds maintained a bearish stance, with net short positions dominating NYMEX and ICE WTI for much of the month—a red flag for investors betting on a quick rebound.
Supply dynamics add another layer of intrigue. Non-DoC liquids production (from countries outside the Declaration of Cooperation) is pegged at 0.8 mb/d growth for 2025, led by the US, Brazil, Canada, and Argentina. This slows to 0.6 mb/d in 2026, with similar drivers. DoC crude production jumped 630 tb/d m-o-m in September to 43.05 mb/d, while NGLs and non-conventionals from DoC nations grow modestly by 0.1 mb/d annually. Demand for DoC crude remains at 42.5 mb/d for 2025 (+0.4 mb/d y-o-y) and 43.1 mb/d for 2026 (+0.6 mb/d y-o-y), suggesting a tight balance if non-DoC output doesn’t overrun expectations.
Refining and product markets showed seasonal strength. Refinery margins climbed across the US Gulf Coast, Rotterdam, and Singapore, thanks to maintenance outages tightening supply. Middle distillates like diesel were the standout, supported by limited Russian output and strong exports. Global refinery intake fell 1.4 mb/d m-o-m to 82.2 mb/d in September, reflecting the Northern Hemisphere’s heavy turnaround season.
Tanker markets were equally dynamic, with dirty rates mixed: VLCCs surged 56% on Middle East-to-East routes amid higher outflows, while Suezmax and Aframax showed varied movements. Clean tanker rates dipped in long-haul segments but firmed short-haul. Trade flows revealed regional shifts—US crude exports hit a 2025 high at 4.3 mb/d, China’s imports averaged 11.7 mb/d in August, and India’s rebounded to 4.6 mb/d.
Commercial stocks provide a sobering counterpoint. OECD inventories dipped 0.5 mb to 2,793 mb in August, below historical averages, with crude down 10.4 mb m-o-m and products up 9.9 mb. Days of forward cover rose slightly to 60.2 days but remain below five-year norms, hinting at potential tightness if demand holds.
The global economy underpins it all, with OPEC’s forecasts unchanged: 3.0% growth in 2025 and 3.1% in 2026. The US (1.8% in 2025, 2.1% in 2026), Eurozone (1.2% both years), China (4.8% and 4.5%), and India (6.5% both) are key pillars, though Japan and Russia lag.
So, back to the question: Is OPEC’s optimism enough to stabilize prices? The report’s data suggests yes, if demand drivers like air travel and petrochemicals fire on all cylinders. But with bearish speculators, rising non-OPEC supply, and geopolitical wildcards, investors should watch closely. As always, the energy market’s crystal ball is foggy—stay tuned for November’s update.
Disclaimer
The content on MarketsFN.com is provided for educational and informational purposes only. It does not constitute financial advice, investment recommendations, or trading guidance. All investments involve risks, and past performance does not guarantee future results. You are solely responsible for your investment decisions and should conduct independent research and consult a qualified financial advisor before acting. MarketsFN.com and its authors are not liable for any losses or damages arising from your use of this information.
