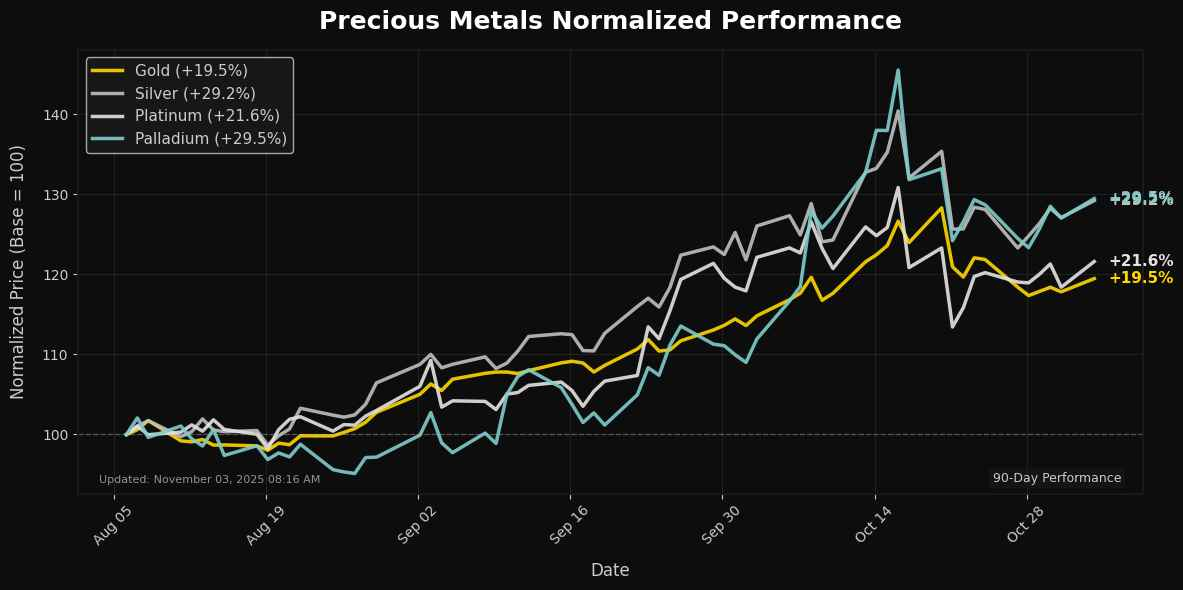
Precious Metals Update: Platinum Rallies 2.36% – RSI at 54
📊 Market Overview
Report Date: November 03, 2025
| Metal | Price | Daily Change (%) | MA21 | MA50 | MA100 | MA200 | RSI | MACD |
|---|---|---|---|---|---|---|---|---|
| Gold | $4037.90 | +1.05% | $4070.02 | $3829.19 | $3589.72 | $3340.78 | 53.71 | 48.20 |
| Silver | $48.79 | +1.32% | $48.65 | $45.13 | $41.28 | $37.07 | 55.26 | 0.74 |
| Platinum | $1612.30 | +2.36% | $1614.21 | $1513.11 | $1434.91 | $1217.79 | 53.99 | 16.08 |
| Palladium | $1472.50 | +1.20% | $1463.68 | $1300.06 | $1231.44 | $1099.67 | 56.85 | 38.65 |
🔸 Gold
Technical Analysis
As of the latest data, gold is trading at $4037.90, reflecting a daily increase of 1.05%. Currently, the price is positioned below the short-term moving average (MA21) of $4070.02, indicating immediate resistance. Notably, the cryptocurrency shows robust support at the MA50 level of $3829.19, suggesting a strong foundational base in that area.
The Relative Strength Index (RSI) sits at 53.71, signaling a neutral momentum, indicating that the market is neither overbought nor oversold. The MACD value of 48.20 supports this momentum, suggesting potential for upward movement if the price can clear resistance at the MA21.
In summary, while gold appears to be consolidating, a breakout above $4070 could initiate a bullish trend further toward the MA100 at $3589.72. Conversely, a decline below $3829.19 might prompt reconsideration of long positions, hinting
🔸 Silver
Technical Analysis
As of the latest trading session, silver is priced at $48.79, reflecting a daily increase of 1.32%. The price remains above the 21-day moving average (MA21) of $48.65, indicating a bullish short-term trend. Additionally, the 50-day MA at $45.13 and the 100-day MA at $41.28 further signify upward momentum, suggesting strong support levels below the current price.
The Relative Strength Index (RSI) is at 55.26, indicating that silver is neither overbought nor oversold, signaling stable momentum. Moreover, the MACD at 0.74 supports this positive outlook, suggesting strengthening buyer sentiment.
On the resistance front, key levels to watch include psychological barriers at $50 and $52. Should the price maintain above MA21, silver may further test these resistance points. Overall, the technical indicators favor a continued bullish trend in the near term, provided momentum persists.
🔸 Platinum
Technical Analysis
Platinum is currently trading at $1612.30, reflecting a daily increase of 2.36%. The price is positioned slightly below the 21-day moving average (MA21) at $1614.21, suggesting a potential resistance level in the near term. The substantial gap between the shorter-term MA21 and the longer-term MAs (MA50 at $1513.11, MA100 at $1434.91, and MA200 at $1217.79) indicates a bullish trend over the medium to long term.
The Relative Strength Index (RSI) at 53.99 shows that Platinum is in neutral territory, signaling potential for upward momentum without entering overbought conditions. The MACD at 16.08 further corroborates this positive outlook, indicating a strengthening bullish trend.
Overall, if Platinum can maintain above the MA21 and break through the minor resistance at $1614.21, further upside toward $1650 may be achievable. However, a
🔸 Palladium
Technical Analysis
Palladium is currently trading at $1,472.50, showing a daily increase of 1.20%. The asset’s recent performance has pushed its price above the 21-day moving average (MA21) of $1,463.68, suggesting bullish sentiment in the short term. The relative strength index (RSI) at 56.85 indicates that the market is neither overbought nor oversold, reflecting moderate bullish momentum.
Furthermore, the moving average convergence divergence (MACD) at 38.65 supports this positive outlook, indicating that momentum is favorable for buyers. Significant long-term support levels can be identified at the MA50 of $1,300.06 and MA100 of $1,231.44, while the recent price breakout suggests potential resistance near the psychological level of $1,500. Overall, if Palladium maintains its current trajectory and manages to break through resistance, it may target higher levels, while prudent traders should monitor key support levels for
Disclaimer
The content on MarketsFN.com is provided for educational and informational purposes only. It does not constitute financial advice, investment recommendations, or trading guidance. All investments involve risks, and past performance does not guarantee future results. You are solely responsible for your investment decisions and should conduct independent research and consult a qualified financial advisor before acting. MarketsFN.com and its authors are not liable for any losses or damages arising from your use of this information.
