Precious Metals Update: Platinum Edges Higher 0.77% – RSI at 50
📊 Market Overview
Report Date: November 06, 2025
| Metal | Price | Daily Change (%) | MA21 | MA50 | MA100 | MA200 | RSI | MACD |
|---|---|---|---|---|---|---|---|---|
| Gold | $4014.50 | +0.54% | $4070.00 | $3852.43 | $3600.69 | $3352.79 | 52.37 | 32.34 |
| Silver | $48.29 | +0.56% | $48.61 | $45.47 | $41.50 | $37.23 | 53.55 | 0.53 |
| Platinum | $1574.60 | +0.77% | $1605.50 | $1521.20 | $1441.08 | $1223.60 | 50.39 | 7.26 |
| Palladium | $1453.00 | +0.20% | $1471.58 | $1313.43 | $1238.83 | $1104.21 | 54.75 | 29.85 |
🔸 Gold
Market News
In the last 12 hours following November 05, 2025, at 08:05 PM, the gold market has shown no significant recent developments. Trading activity remains subdued, with prices stabilizing around recent levels amid a quiet period for new catalysts. Geopolitical tensions and economic uncertainties that typically influence the precious metal have not escalated, while supply chains and demand trends exhibit no notable shifts. Investor sentiment appears cautious but unchanged, as market participants await potential triggers from global events or policy announcements. This lull suggests gold may continue to hover without major volatility in the immediate term, potentially offering a brief respite for holders before any renewed pressures emerge.
Technical Analysis
Gold is currently trading at $4,014.50, reflecting a daily change of 0.54%. The price is slightly below the 21-day moving average (MA21) of $4,070.00, indicating potential resistance in the short term. However, with support levels established around the 50-day MA of $3,852.43, a pullback towards this level may provide a buying opportunity.
The Relative Strength Index (RSI) at 52.37 suggests that gold is neither overbought nor oversold, indicating a neutral momentum environment. Meanwhile, the MACD value of 32.34 reflects bullish momentum, suggesting the potential for continued upside movement if the price can break above key resistance levels.
Overall, while gold faces immediate resistance around the $4,070 level, bullish indicators and support at $3,852.43 could allow for a stronger upward movement if momentum builds. Traders should monitor these levels closely for potential trading opportunities.
🔸 Silver
Technical Analysis
Silver is currently priced at $48.29, reflecting a daily increase of 0.56%. The 21-day moving average (MA21) at $48.61 indicates that silver is trading just below this short-term resistance level, which could suggest potential upward momentum should it break above. The longer-term moving averages—MA50 at $45.47, MA100 at $41.50, and MA200 at $37.23—indicate a bullish trend as all are trending upward, providing strong support levels below the current price.
The Relative Strength Index (RSI) at 53.55 suggests that silver is in a neutral to bullish territory, indicating that there is still room for upward movement without being overbought. The MACD value of 0.53 further reinforces positive momentum. Overall, if silver can breach and sustain levels above the MA21, it may target higher resistance levels, possibly leveraging recent bullish trends. Monitoring for breakout signals will be key for traders.
🔸 Platinum
Technical Analysis
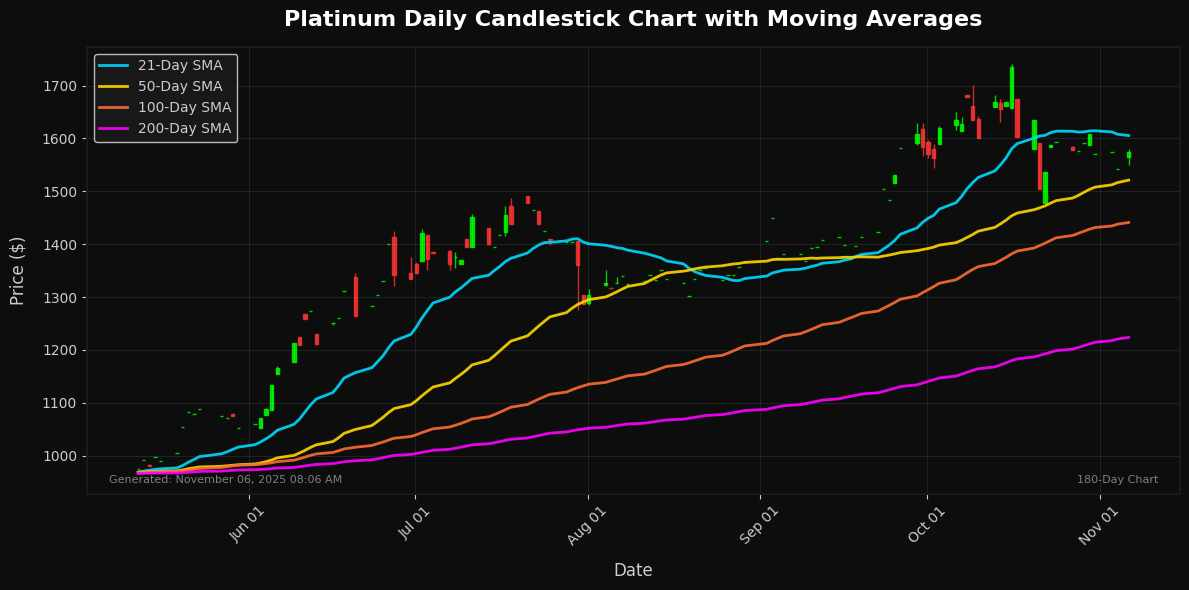
Platinum is currently trading at $1574.60, reflecting a modest daily change of 0.77%. The recent price action indicates positioning near the 21-day moving average (MA21) at $1605.50, which serves as a significant resistance level. Should prices breach this level, it could trigger a bullish momentum towards the next resistance at $1620. Conversely, the 50-day moving average (MA50) at $1521.20 provides a strong support zone, suggesting the potential for a rebound should prices decline.
The Relative Strength Index (RSI) at 50.39 indicates that the metal is in a neutral territory, suggesting limited immediate directional bias. The MACD reading of 7.26 signals bullish momentum, yet it remains close to the zero line, indicating caution. Therefore, the outlook for platinum is cautiously optimistic, with traders encouraged to monitor the resistance at MA21 for potential breakout opportunities while keeping an eye on support at MA50.
🔸 Palladium
Technical Analysis
Palladium is currently priced at $1453.00, reflecting a modest daily change of 0.20%. The price sits below the 21-day moving average (MA21) at $1471.58, suggesting a potential resistance level. The MA50 at $1313.43 and MA100 at $1238.83 indicate a robust upward trend over a longer timeframe, while the MA200 at $1104.21 underscores strong support.
The Relative Strength Index (RSI) at 54.75 indicates neutral momentum, suggesting no immediate overbought or oversold conditions, which could lead to potential consolidation in the near term. The MACD at 29.85 continues to signal bullish strength as it remains above the zero line.
Overall, while palladium is experiencing a slight pullback, the long-term trend remains positive, supported by key moving averages. Traders should watch for a breakout above the MA21 to confirm continued upward momentum, with the next resistance level
Disclaimer
The content on MarketsFN.com is provided for educational and informational purposes only. It does not constitute financial advice, investment recommendations, or trading guidance. All investments involve risks, and past performance does not guarantee future results. You are solely responsible for your investment decisions and should conduct independent research and consult a qualified financial advisor before acting. MarketsFN.com and its authors are not liable for any losses or damages arising from your use of this information.
