The most relevant equity indices had a negative week, with S&P 500 down by 1.29% ,Nasdaq Composite lost 1.93% and the Dow Jones retraced by 0.75%. In Europe the Euro Stoxx 50 slid by 1.04% and in Germany the DAX lost 0.63%. In Japan the Nikkei slid by 0.31% . The CBOE Volatility Index rose last week by 5.73%, thus the decrease in risk appetite on equities was not followed by aggressive buying of volatility protection.
The following table is the summary of Friday trading session, which was quite trendless.
Data released last week were quite mixed as Japanese , Eurozone GDP figures and Chinese Trade Balance were below the consensus while US ISM Service PMI surprised the financial community. The Reserve Bank of Australia and the Bank of Canada kept they rates unchanged, at 4.1% and 5% respectively.
The US Job market seems has peaked as job growth has returned to pre Covid19 trend. This will be relevant for the FED in its next FOMC meeting on September 19-20, where probably of a soft landing scenario has increased placing thus lower pressure on inflationary worries. The CME FedWatch Tool , based on market participants expectation, gives a 92% probability for rates unchanged at the next meeting, up from 86% a month ago.
The majority of the equity indices mentioned above are off their 2023 highs and are developing lower highs and in some cases lower lows, signaling a possible weakened technical set up for the final quarter of the year.
In the currency market the greenback gained ground last week, where EUR/USD did not signal any recovery following the drop below the 200 day SMA of the previous week.
Next week most relevant events will be on Wednesday with US CPI , and then on Thursday with Eurozone Interest Rate decision, expected to remain unchanged, followed by US Retail Sales.
On Friday Chinese Industrial Production and Retail sales data would have a relevant influence on market sentiment of the last session of the week. On Friday also will be released the Michigan Consumer Sentiment Index(Sep) PREL, which of course has a tremendous importance, given that almost 70% of US Nominal Domestic Product depends on consumer spending.
S&P500
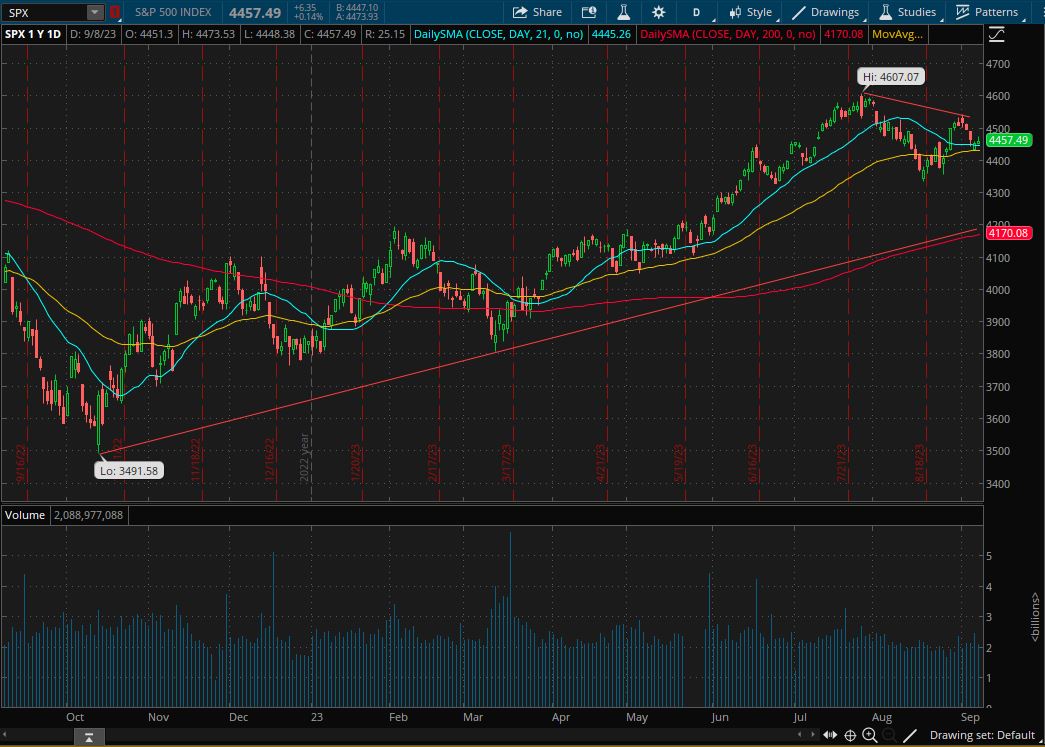
After the 2023 top reached on July at 4.607.07 the index developed a lower high, thus providing a supply line that works as a dynamic resistence for possible bullish pressure. A close below last month lows would probably paving the way for a bearish leg, completing the first lower lows that is necessary for a correction. The intermediate trend is still positive, since the index is still above the trendline generated from last year lows 3491.58. The trendline at the moment is mostly overlapped with the 200 day moving average.
Crude Oil WTI
The commodity found resistance near its 2023 high in area 88 $/barrel and in case a breakout will of this level would succeed without retracing to 85$ is likely to see an advance to 90$, psychological level, and then to 93.5. Below 85 the commodity is likely to test the 21 day SMA, now in area 82.28. Key support for a possible lower low development in area 77.55, last August low.
XAU/USD
Gold is making lower highs, while it made a multiple bottom on the 38.2% Fibonacci retracement in area 1,910 $/oz. Near this price area there is also the 200 day SMA and if the shiny metal would make anothe bearish leg is likely to test 1,854, the 50% Fibonacci retracement of the Nov 2022-June 2023 uptrend. A breakout of the dynamic resistance that links lower highs in area 2,000 is likely to lift gold to test again its record high at 2,085 $/oz.
EUR/USD
The rate is in downtrend, trading below the most relevant moving averages and it seems oriented to test its 38.2% Fibonacci retracement in area 1.06 , which could be a pivotal area either for a rebound or for another bearish leg. In case downtrend would continue 1.04 and then 1.012 would be the next relevant static support levels. The 21 day SMA, the 55 day EMA and the 200 day SMA are near the same price level , thus a breakout above 1.08 is likely to be a premature choice to assess the possibility for an uptrend, given also the price projection that is the distance from the dynamic resistance and the lowest price level under it. Market sentiment from a technical perspective will turn bullish only above the 2023 high 1.1275.
AAPL Apple Inc.
Apple rebounded near the 38.2% Fibonacci level and found resistance against its 21 day SMA. If manages to stay above 170$ possible the development of a lateral phase but if makes lower lows is likely to test area 160. The 61.8% retracement is at 152$ and could be viewed as a key target for bearish trades. If the uptrend would resume area 190 and then 198.3 would be the next resistance levels to watch. Above its July highs, which are also an all time high, AAPL would trade in unchartered territory.
