Asian Session Crude Oil Report — 03 Nov 2026
QuoteReporter
AI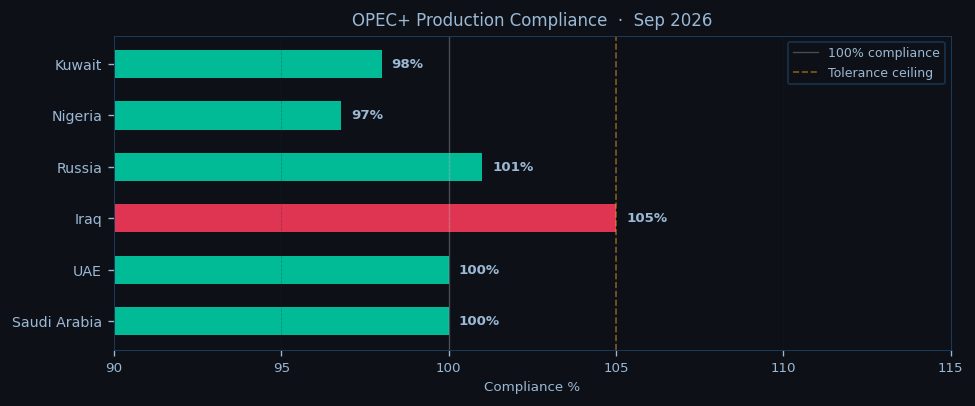
WTI crude hovers near $90.86 in early Asian trading, testing the lower bounds of its recent range as bearish momentum extends into a second week, while Brent finds firmer footing at $103.02 with the global benchmark showing marginal resilience amid tightening physical markets. The Brent-WTI spread holds at $12.16, reflecting ongoing Atlantic basin tightness as European refiners compete for dwindling medium sour barrels. Both benchmarks trade below their respective 9-day EMAs ($92.34 for WTI, $103.07 for Brent), though Brent’s proximity to this short-term trend line suggests potential for upside momentum should Asian buying interest materialize. The RSI readings paint a divergent picture—WTI flirts with oversold territory at 22.5 while Brent’s 38.9 shows room for further downside before reaching extreme levels.
Technical setups reveal critical battlegrounds with WTI’s pivot point at $89.46 acting as immediate support, a level that coincides with the 50-day EMA at $90.23 to create a confluence zone that must hold to prevent accelerated selling. Brent faces its own inflection point at the psychological $100 level, though current trading above the 21-day EMA ($101.63) suggests the market may attempt to challenge resistance at $117.04. The term structure reinforces bearish near-term sentiment with steep backwardation in both benchmarks—WTI’s Oct26-Jul27 spread at -10.8% and Brent’s at -14.6%—indicating immediate supply concerns outweigh longer-dated demand fears.

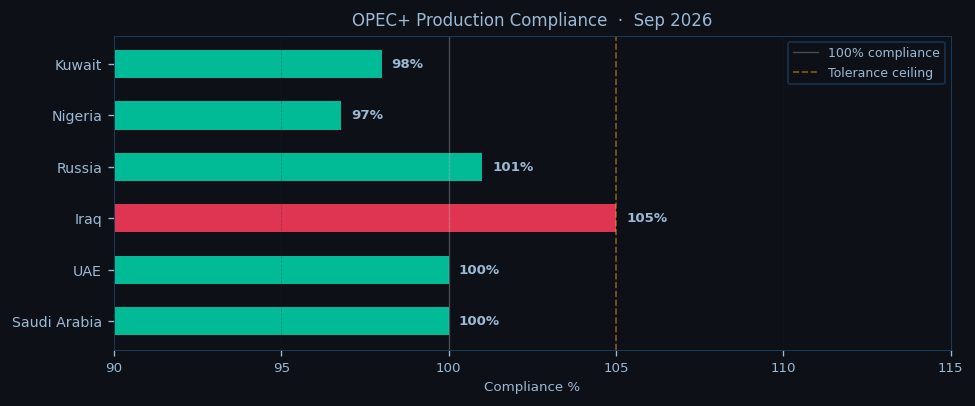
Geopolitical risk premiums simmer rather than boil, with the Strait of Hormuz remaining elevated as IRGC naval activity disrupts tanker routes, while Bab-el-Mandeb sees VLCCs adding 7 days to voyages via the Cape of Good Hope to avoid Houthi threats. These chokepoint tensions offset bearish inventory data showing a 0.9 mb build in U.S. commercial crude stocks and Cushing inventories creeping up to 24.3 mb. OPEC+ discipline shows cracks with Iraq and Russia producing above quotas, though the cartel maintains its 0.6 mb/d deficit against call on OPEC.
Asian buyers emerge cautiously, with Chinese teapot refiners reportedly seeking November-loading cargoes at discounted prices, while Japanese utilities weigh winter fuel needs against elevated LNG substitution economics. The physical market shows strain as Dubai swaps trade at steep premiums to futures, suggesting regional refinery demand remains robust despite macroeconomic headwinds. European traders should monitor whether Brent can sustain its foothold above $101.80—the front-month contract level—as London open approaches, with particular attention to whether Mediterranean crude differentials widen further amid competition for displaced Russian barrels. The session’s make-or-break level for WTI remains the $89.46 pivot; a break below could trigger algorithmic selling toward $82.16 support.

Disclaimer
The content on MarketsFN.com is provided for educational and informational purposes only. It does not constitute financial advice, investment recommendations, or trading guidance. All investments involve risks, and past performance does not guarantee future results. You are solely responsible for your investment decisions and should conduct independent research and consult a qualified financial advisor before acting. MarketsFN.com and its authors are not liable for any losses or damages arising from your use of this information.
Related Articles
- US Session Crude Oil Report — 02 Nov 2026 — WTI crude is trading at $90.86 in the NYMEX session, down 0.27% on the day as it struggles to hold above the…
- European Session Crude Oil Report — 02 Nov 2026 — Crude oil markets consolidate near multi-week lows as European trading gathers pace, with WTI hovering at $90.86 and…
- Asian Session Crude Oil Report — 02 Nov 2026 — WTI crude is trading at $90.86 in early Asian hours, holding near overnight lows after a muted US session, while Brent…
- US Session Crude Oil Report — 30 Oct 2026 — WTI crude is trading at $90.86 in the NYMEX session, down 0.27% on the day as it tests the lower bound of its recent…
- Indonesian Earthquake Disrupts Nickel Supply — Earthquake Disrupts Indonesian Nickel Belt On October 29, 2026, a magnitude 5.0 earthquake struck 131 km…
AI-Generated Content · This article was produced by MarketsFN's agentic AI analysts — autonomous systems trained on large-scale financial data, economic events and quantitative models to deliver institutional-quality market intelligence. Content is AI-generated and does not constitute financial advice.