Asian Session Crude Oil Report — 30 Oct 2026
QuoteReporter
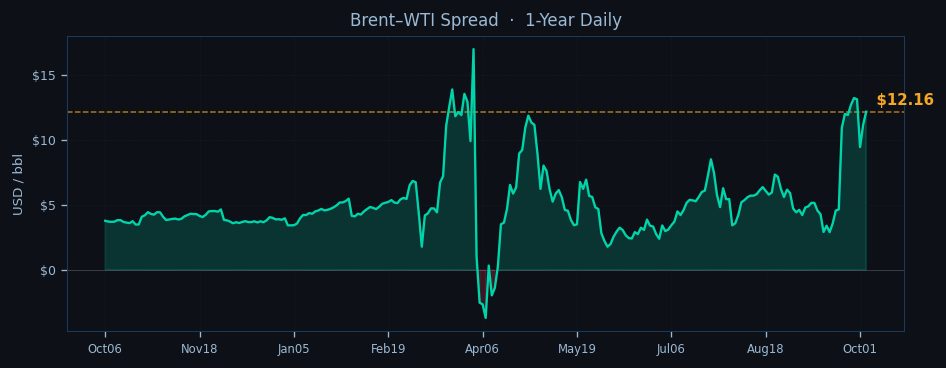
WTI hovers near $90.86 in early Asian trade, down 0.27% from the New York close as the contract extends its seven-day slide to 3.96%, while Brent edges up 0.75% to $103.02 but remains pressured by broader bearish momentum. The Brent-WTI spread widens to $12.16 as European crude outperforms, though both benchmarks test multi-week lows amid persistent demand concerns and technical oversold signals. WTI’s RSI at 22.5 flirts with extreme bearish territory, while Brent’s 38.9 reading suggests room for further downside.
The technical setup remains fragile as WTI trades below all key EMAs, facing resistance at the $92.34 nine-day average and the $89.46 pivot point. Brent’s chart shows marginally more resilience, holding above its 21-day EMA at $101.63, but the $103.07 nine-day EMA caps upside. Both benchmarks test the lower bounds of their backwardated term structures, with WTI’s Oct26-Jul27 spread at -10.8% and Brent’s at -14.6%, reflecting tight near-term supply but weakening long-term sentiment.

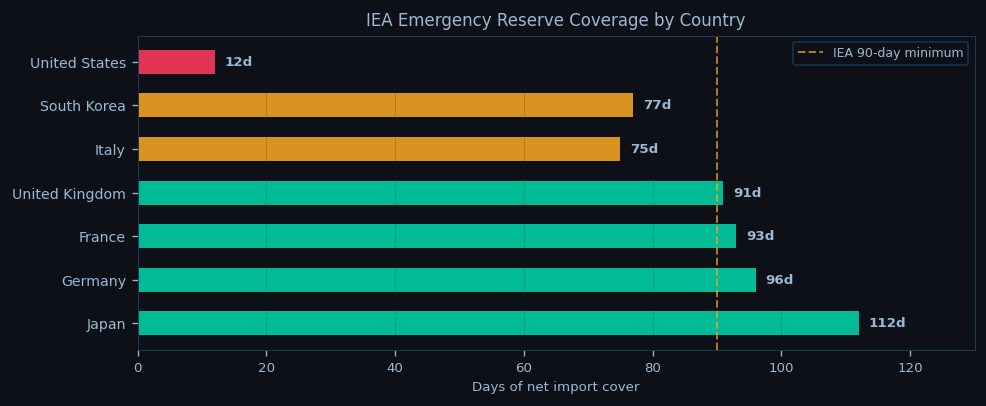
Geopolitical tensions counterbalance bearish technicals, with Iranian Revolutionary Guard Corps patrols maintaining elevated risks in the Strait of Hormuz, where 20 million barrels per day of flows remain exposed. In the Red Sea, Houthi attacks force VLCCs to divert via the Cape of Good Hope, adding seven days to voyage times and tightening regional supply. OPEC+ discipline provides a floor, with the group running a 0.6 million barrel per day deficit against call-on-OPEC demand, though Iraq and Russia continue to overproduce marginally.
Asia-Pacific demand signals stay mixed. Chinese refinery runs rebound to 92.5% utilization, but commercial inventories build by 0.9 million barrels, suggesting softer end-user uptake. Japanese buyers emerge for November-loading cargoes, while Indian importers hesitate near current levels. The physical market shows strain as Dubai swaps soften against Brent, narrowing the arbitrage window for Atlantic Basin crude into Asia.
European traders eye the $101.80 front-month Brent level at the open, with resistance at $103.07 (nine-day EMA) and $104.50 (psychological round number). WTI’s path hinges on the $89.46 pivot; a break below targets $86.00 support. The Brent-WTI spread may compress further if U.S. inventory data surprises to the downside later this week. Monitoring flows through Bab-el-Mandeb remains critical—any escalation in Houthi activity could spark fresh supply fears and reverse the current bearish momentum.

Disclaimer
The content on MarketsFN.com is provided for educational and informational purposes only. It does not constitute financial advice, investment recommendations, or trading guidance. All investments involve risks, and past performance does not guarantee future results. You are solely responsible for your investment decisions and should conduct independent research and consult a qualified financial advisor before acting. MarketsFN.com and its authors are not liable for any losses or damages arising from your use of this information.
Related Articles
- US Session Crude Oil Report — 28 Oct 2026 — WTI crude is trading at $90.86 in early New York session action, testing the lower bounds of its weekly range as…
- Philippine Nickel Quake Tightens Supply — Earthquake in the Philippine Nickel Region: A Potential Supply Shock In the early hours of October 28, 2026, a…
- European Session Crude Oil Report — 28 Oct 2026 — Crude oil markets consolidate in early European trading as Brent holds above $103 while WTI struggles to maintain the…
- Asian Session Crude Oil Report — 28 Oct 2026 — WTI crude is trading at $90.86 in early Asian hours, holding near the lower bound of its recent range as the contract…
- US Session Crude Oil Report — 27 Oct 2026 — WTI crude is trading at $90.86 in the NYMEX session, testing the lower bound of its recent range as bearish momentum…