Bitcoin Holds Steady at $64K as RSI Signals Balanced Momentum
· Crypto · QuoteReporter
Bitcoin Holds Steady at $64K as RSI Signals Balanced Momentum
Bitcoin (BTC/USD) | June 22, 2026 $64,099.9883 +1.36%
🔍 Technical Analysis
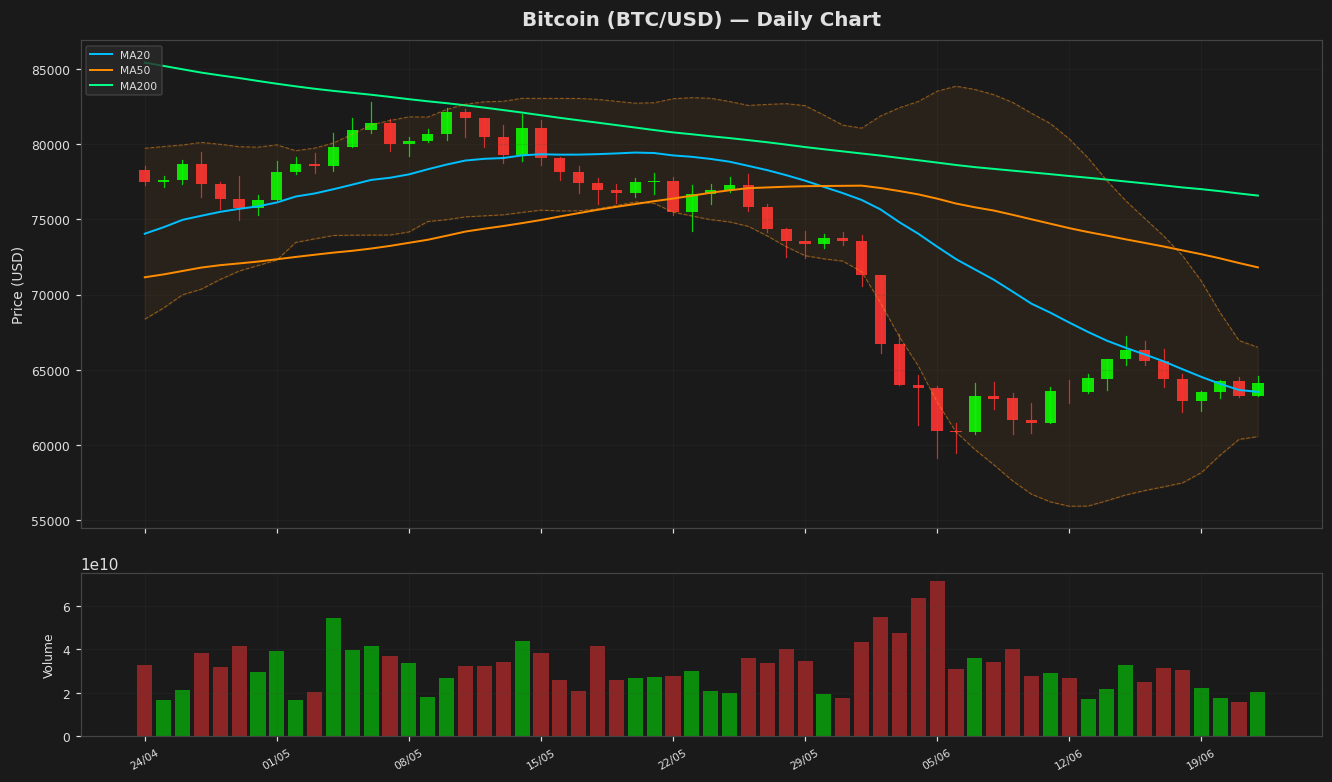
Bitcoin is currently trading at $64,099, showing a modest daily gain of 1.36%. The price remains below the 50-day moving average (MA50) at $71,809 and the 200-day moving average (MA200) at $76,583, indicating a bearish trend in the medium to long term. However, the 20-day moving average (MA20) at $63,529 is acting as near-term support, suggesting some stability in the short term. The Bollinger Bands show the upper band at $66,500 and the lower band at $60,558, with the price hovering near the middle band, reflecting neutral volatility. The Relative Strength Index (RSI) at 53.84 is in neutral territory, neither overbought nor oversold, indicating balanced momentum. The MACD histogram is negative at -1,988, below the signal line at -2,460, signaling bearish momentum but with potential for a reversal if convergence occurs. Key support levels to watch are $60,558 (Bollinger Lower Band) and $59,108 (52-week low), while resistance lies at $66,500 (Bollinger Upper Band) and $71,809 (MA50). The Average True Range (ATR) at 1,836 suggests moderate volatility. Bitcoin remains in a consolidation phase, with a breakout above $66,500 or a drop below $60,558 likely to dictate the next directional move.
Technical Metrics
| Metric | Value |
|---|---|
| Current Price | $64,099.9883 |
| Daily Change | +1.36% |
| MA 20 | $63,529.4139 |
| % from MA20 | +0.90% |
| MA 50 | $71,809.8721 |
| % from MA50 | -10.74% |
| MA 200 | $76,583.5052 |
| % from MA200 | -16.30% |
| BB Upper | $66,500.0611 |
| % from BB Upper | -3.61% |
| BB Lower | $60,558.7667 |
| % from BB Lower | +5.85% |
| RSI (14) | 53.85 |
| MACD | -1988.552269 |
| MACD Signal | -2460.866306 |
| ATR (14) | 1836.856864 |
| 3-Day High | $64,578.3555 |
| 3-Day Low | $63,149.6602 |
| 52-Week High | $116,273.3125 |
| % from 52W High | -44.87% |
| 52-Week Low | $59,108.9180 |
| % from 52W Low | +8.44% |
| YTD High | $97,860.6016 |
| % from YTD High | -34.50% |
| YTD Low | $59,108.9180 |
| % from YTD Low | +8.44% |
📊 Market Commentary
**Bitcoin (BTC) Market Commentary**
Bitcoin is currently trading at **$64,099.9883**, up **1.36%** today, showing mild bullish momentum after recent consolidation. The Relative Strength Index (RSI) at **53.8** suggests neutral conditions, neither overbought nor oversold, indicating balanced market sentiment. Over the past 52 weeks, BTC has ranged between **$59,108.9180** and **$116,273.3125**, reflecting significant volatility but stabilizing near the lower end of that spectrum.
Market sentiment remains cautiously optimistic as traders monitor macroeconomic factors, including Fed policy expectations and institutional inflows. The $60,000 level has emerged as a key psychological support, with buyers stepping in to defend this zone. Resistance is seen near **$65,000**, a level that, if broken, could signal further upside momentum.
Traders are closely watching Bitcoin’s correlation with traditional markets, particularly equities, as risk appetite fluctuates. Additionally, on-chain metrics such as exchange reserves and whale activity are being scrutinized for signs of accumulation or distribution. The recent uptick in price comes amid mixed signals—while some see it as a rebound from oversold conditions, others remain wary of further downside if macroeconomic pressures intensify.
Overall, Bitcoin remains in a consolidation phase, with traders awaiting clearer directional cues. The neutral RSI and mid-range price action suggest a wait-and-see approach dominates for now. Key levels to watch remain **$60,000** (support) and **$65,000** (resistance).
Disclaimer
The content on MarketsFN.com is provided for educational and informational purposes only. It does not constitute financial advice or investment recommendations. All investments involve risk. Cryptocurrency markets are highly volatile. Past performance does not guarantee future results.