Bitcoin Nears $60K as RSI Hits Oversold Territory
· Crypto · QuoteReporter
Bitcoin Nears $60K as RSI Hits Oversold Territory
Bitcoin (BTC/USD) | June 29, 2026 $59,738.9805 +0.35%
🔍 Technical Analysis
### Bitcoin (BTC) Technical Analysis
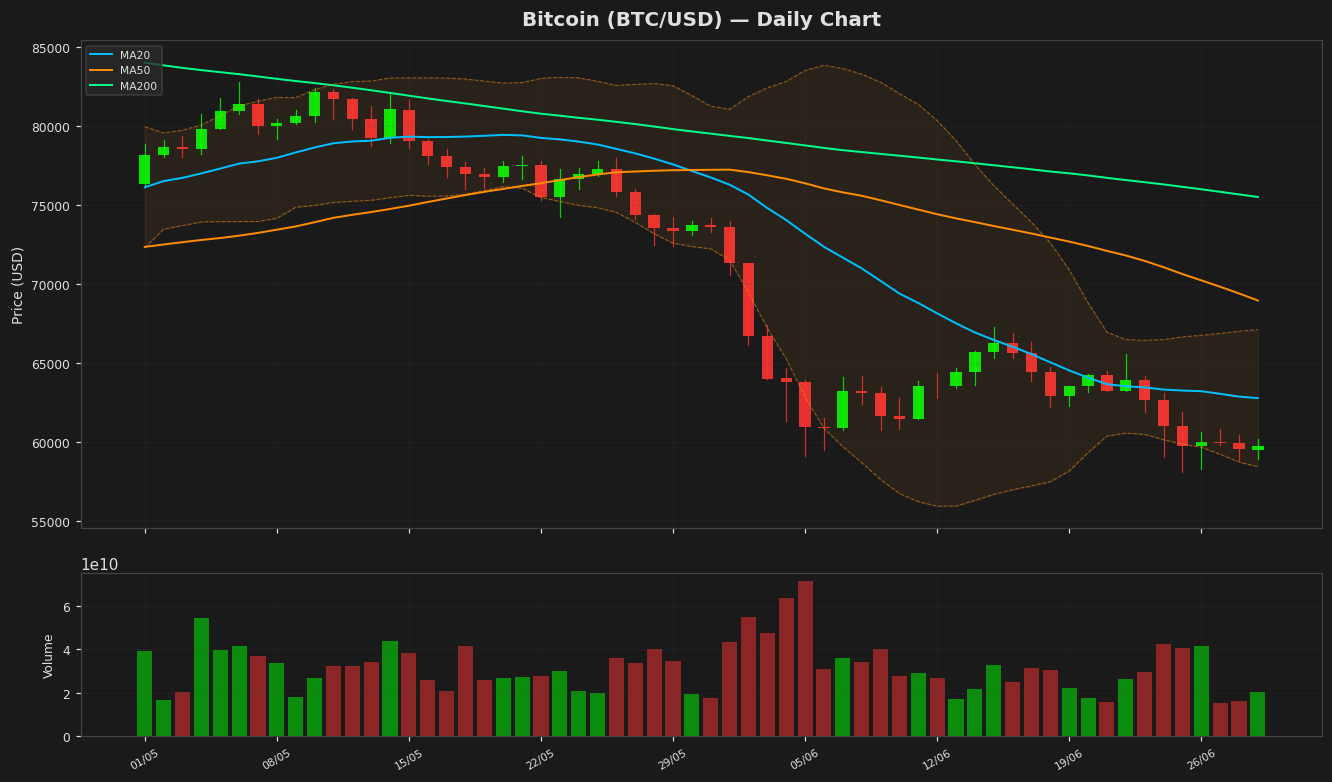
Bitcoin is currently trading at **$59,738.98**, showing a slight daily gain of **+0.35%**. The price remains below key moving averages, indicating bearish pressure in the short to medium term. The **20-day MA (62,773.66)** and **50-day MA (68,955.52)** both act as resistance levels, while the **200-day MA (75,511.18)** suggests a longer-term downtrend if BTC fails to reclaim higher levels.
Bollinger Bands show **upper (67,115.77)** and **lower (58,431.55)** bands tightening, signaling reduced volatility. The price is hovering near the lower band, which may indicate an oversold condition or potential consolidation before a breakout.
The **RSI (14) at 21.93** is deeply oversold, suggesting a possible short-term bounce or reversal if buying pressure increases. However, the **MACD (-2,338.24)** remains below its signal line (-2,314.02), reinforcing bearish momentum.
Key support lies near **$58,075.92 (52-week low)**, while resistance is seen at **$62,773.66 (20-day MA)** and **$67,115.77 (Bollinger upper band)**. A break below support could lead to further downside toward **$55,000**, whereas reclaiming the 20-day MA may signal a short-term recovery. The **ATR (14) at 2,077.39** suggests moderate volatility, meaning sharp moves remain possible.
Overall, Bitcoin remains in a bearish phase, but oversold RSI and proximity to lower Bollinger Band hint at potential stabilization or a minor rebound. Traders should watch for confirmation above resistance or breakdown below support for directional bias.
Technical Metrics
| Metric | Value |
|---|---|
| Current Price | $59,738.9805 |
| Daily Change | +0.35% |
| MA 20 | $62,773.6578 |
| % from MA20 | -4.83% |
| MA 50 | $68,955.5170 |
| % from MA50 | -13.37% |
| MA 200 | $75,511.1793 |
| % from MA200 | -20.89% |
| BB Upper | $67,115.7688 |
| % from BB Upper | -10.99% |
| BB Lower | $58,431.5468 |
| % from BB Lower | +2.24% |
| RSI (14) | 21.93 |
| MACD | -2338.239477 |
| MACD Signal | -2314.017150 |
| ATR (14) | 2077.386719 |
| 3-Day High | $60,835.0469 |
| 3-Day Low | $58,879.6328 |
| 52-Week High | $116,273.3125 |
| % from 52W High | -48.62% |
| 52-Week Low | $58,075.9219 |
| % from 52W Low | +2.86% |
| YTD High | $97,860.6016 |
| % from YTD High | -38.96% |
| YTD Low | $58,075.9219 |
| % from YTD Low | +2.86% |
📊 Market Commentary
Bitcoin (BTC) is currently trading at $59,738.9805, up 0.35% today, as the market shows tentative signs of stabilization after recent volatility. The Relative Strength Index (RSI) sits at 21.9, indicating deeply oversold conditions—a level not seen since the bear market lows of 2022. This suggests potential exhaustion in selling pressure, though sentiment remains cautious amid macroeconomic uncertainties and lingering concerns over inflation and interest rate policies.
The 52-week range of $58,075.9219 to $116,273.3125 highlights the stark contrast between Bitcoin’s all-time highs and its current consolidation near the lower bound. Traders are closely watching the psychological $60,000 level, which has acted as both support and resistance in recent weeks. A sustained break above this level could signal short-term bullish momentum, while failure to hold may see a retest of the yearly low near $58,000.
Market sentiment remains mixed, with on-chain data showing long-term holders accumulating at these levels, while short-term traders remain wary. Liquidity is thin, increasing the risk of sharp moves in either direction. Key factors being monitored include institutional flows, regulatory developments, and broader equity market trends, particularly the Nasdaq’s performance, given Bitcoin’s recent correlation with tech stocks. For now, the market appears to be in a wait-and-see mode, with the oversold RSI suggesting a possible relief rally, though conviction remains low.
Disclaimer
The content on MarketsFN.com is provided for educational and informational purposes only. It does not constitute financial advice or investment recommendations. All investments involve risk. Cryptocurrency markets are highly volatile. Past performance does not guarantee future results.