Solana Eyes $75 as RSI Nears Midpoint, Bulls Gain Traction
· Crypto · QuoteReporter
Solana Eyes $75 as RSI Nears Midpoint, Bulls Gain Traction
Solana (SOL/USD) | June 29, 2026 $72.6800 +1.92%
🔍 Technical Analysis
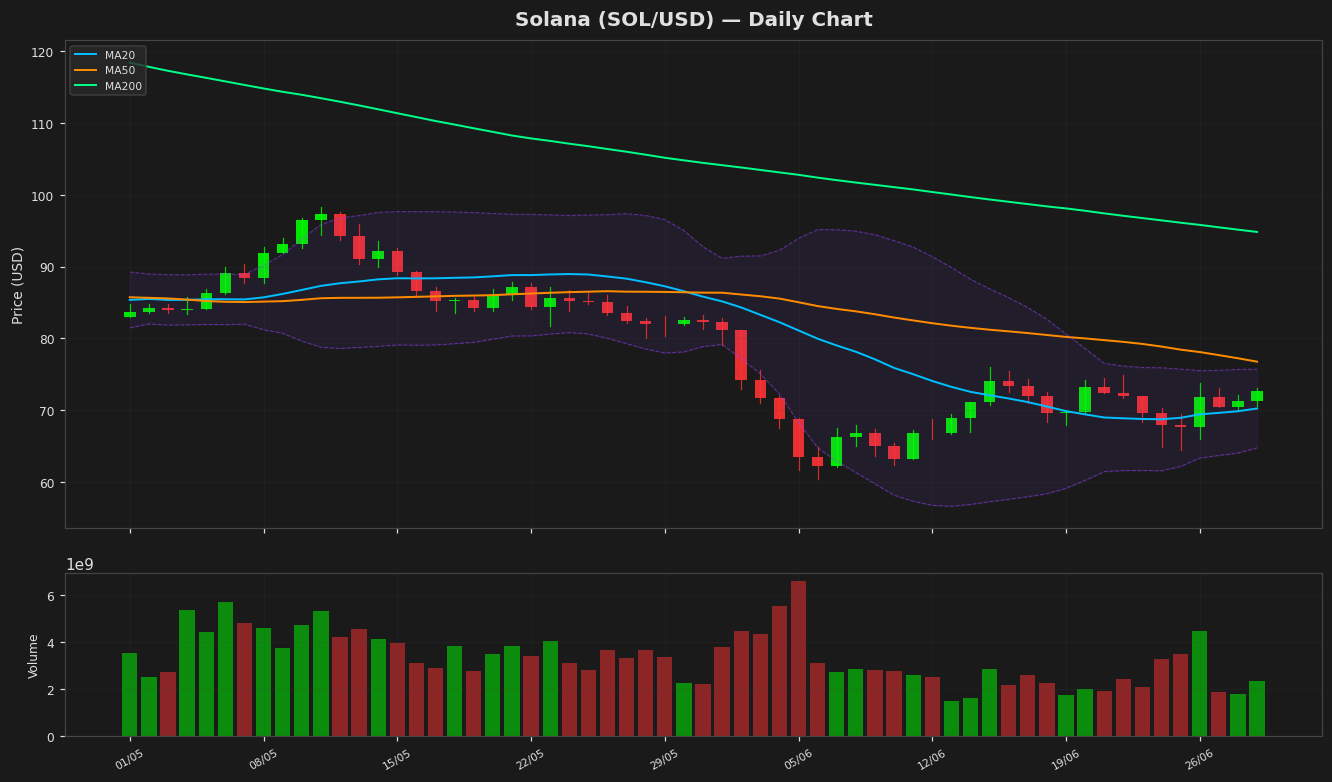
Solana (SOL) is currently trading at $72.68, up 1.92% on the day, showing mild bullish momentum amid broader market uncertainty. The price remains above the 20-day moving average (MA20) at $70.22, suggesting short-term support, but it is still below the MA50 ($76.74) and MA200 ($94.82), indicating persistent mid-to-long-term bearish pressure. The Bollinger Bands highlight a narrowing volatility range, with the upper band at $75.70 and the lower band at $64.74, suggesting potential consolidation before a breakout. The RSI at 46.97 is neutral, neither overbought nor oversold, reflecting a lack of strong directional bias. The MACD histogram is negative at -1.06, with the signal line at -1.74, showing weak bearish momentum but potential for a reversal if the MACD line crosses above the signal. Key support lies near $64.74 (Bollinger lower band), while resistance is at $75.70 (upper band) and $76.74 (MA50). The 52-week high of $205.02 and YTD high of $148.22 underscore the significant downside from peak levels, while the 52-week low of $60.41 remains a critical floor. ATR at 3.69 suggests moderate volatility, warranting caution for traders. A break above MA50 could signal further upside, while failure to hold MA20 may lead to a retest of lower supports.
Technical Metrics
| Metric | Value |
|---|---|
| Current Price | $72.6800 |
| Daily Change | +1.92% |
| MA 20 | $70.2190 |
| % from MA20 | +3.50% |
| MA 50 | $76.7422 |
| % from MA50 | -5.29% |
| MA 200 | $94.8205 |
| % from MA200 | -23.35% |
| BB Upper | $75.6987 |
| % from BB Upper | -3.99% |
| BB Lower | $64.7394 |
| % from BB Lower | +12.27% |
| RSI (14) | 46.97 |
| MACD | -1.058589 |
| MACD Signal | -1.743555 |
| ATR (14) | 3.694352 |
| 3-Day High | $73.0597 |
| 3-Day Low | $69.8388 |
| 52-Week High | $205.0201 |
| % from 52W High | -64.55% |
| 52-Week Low | $60.4147 |
| % from 52W Low | +20.30% |
| YTD High | $148.2160 |
| % from YTD High | -50.96% |
| YTD Low | $60.4147 |
| % from YTD Low | +20.30% |
📊 Market Commentary
**Solana (SOL) Market Commentary**
Solana (SOL) is trading at $72.68, up 1.92% today, showing mild bullish momentum after recent volatility. The Relative Strength Index (RSI) at 47.0 suggests SOL is in neutral territory, neither overbought nor oversold, indicating room for movement in either direction. Over the past 52 weeks, SOL has ranged between $60.41 and $205.02, reflecting significant volatility, with the current price near the lower end of this range.
Market sentiment remains cautious but improving, as SOL recovers from recent dips. Traders are closely watching the $70 support level, which has held firm this week, serving as a key psychological and technical floor. A sustained break below could signal further downside toward the yearly low near $60, while holding above $70 may encourage a retest of higher resistance near $80.
On-chain activity and network performance continue to be focal points, with Solana maintaining strong developer interest despite past outages. The broader crypto market’s direction, particularly Bitcoin’s stability, will likely influence SOL’s near-term trend. Traders are also monitoring trading volume, which has been moderate, suggesting cautious participation rather than strong conviction.
Institutional interest and macroeconomic factors, including Fed policy and risk asset flows, remain key external drivers. For now, SOL’s price action reflects a balance between optimism over its ecosystem growth and lingering concerns about network reliability and macro pressures.
Disclaimer
The content on MarketsFN.com is provided for educational and informational purposes only. It does not constitute financial advice or investment recommendations. All investments involve risk. Cryptocurrency markets are highly volatile. Past performance does not guarantee future results.