Crypto Market Update: Solana Surges, Dogecoin Slips Amid Mixed Altcoin Movements Today
· Crypto · QuoteReporter
Crypto Market Update: Solana Surges, Dogecoin Slips Amid Mixed Altcoin Movements Today
Crypto Market Report | June 29, 2026
📊 Crypto Market Overview
The cryptocurrency market is currently characterized by a cautious sentiment, with most major assets trading in a narrow range. Bitcoin, the largest cryptocurrency by market capitalization, is trading at $59,699.62, having risen by 0.28% over the past 24 hours. The Relative Strength Index (RSI) for Bitcoin stands at 21.7, indicating that the asset is oversold, while the Moving Average Convergence Divergence (MACD) is negative at -2341.3793, suggesting a bearish trend.
Other major cryptocurrencies, such as Ethereum and BNB, are also trading in a similar manner, with Ethereum's RSI at 18.1 and BNB's RSI at 21.0, both indicating oversold conditions. Ripple's RSI is even lower, at 9.7, while Dogecoin's RSI is at 6.9, suggesting that these assets are heavily oversold. In contrast, Solana and Tron are showing relatively more strength, with Solana's RSI at 46.1 and Tron's RSI at 56.7.
The macroeconomic context is mixed, with the Bank for International Settlements (BIS) warning of the potential global financial consequences of excessive AI spending. Meanwhile, the crypto industry is dealing with its own set of challenges, including the closure of Loopring's decentralized exchange due to a lack of adoption and the removal of top executives at BitMEX.
In terms of market activity, Ether treasury Sharplink purchased $62.4 million worth of ETH last week, indicating some level of accumulation. The overall market sentiment remains cautious, with some analysts pointing to a bullish RSI divergence in Bitcoin as a potential sign of a bear market bottom, similar to what was seen in 2022. However, the market's reaction to recent events, such as the de-escalation of tensions between the US and Iran, has been muted, with Bitcoin dipping to $59,700 despite a broader market rally.
📰 Crypto News
- Galaxy cuts CLARITY Act odds to 50% as Senate floor time narrows
- Here’s what happened in crypto today
- Excessive AI spending risks global financial consequences, BIS warns
- Pioneering zk-rollup Loopring closes DEX, citing lack of adoption
- Ether treasury Sharplink bought $62.4M ETH last week
- Bullish Bitcoin RSI divergence has analysts calling for 2022-style bear market bottom
- Binance booted from EU, EthLabs rises up to save Ethereum: Hodler's Digest June 14-28
- Crypto exchange BitMEX removes CEO, CFO and head of growth
- South Korea’s $518 billion AI chip push shows crypto is still losing the capital race
- Bitcoin dips to $59,700 as Iran de-escalation lifts stocks but not crypto
- $4 billion gone. Spot bitcoin ETFs are on track for their worst month on record
🔍 Technical Analysis
Bitcoin (BTC) — +0.28%
$59,699.62 52W: $58,075.92 — $116,273.31
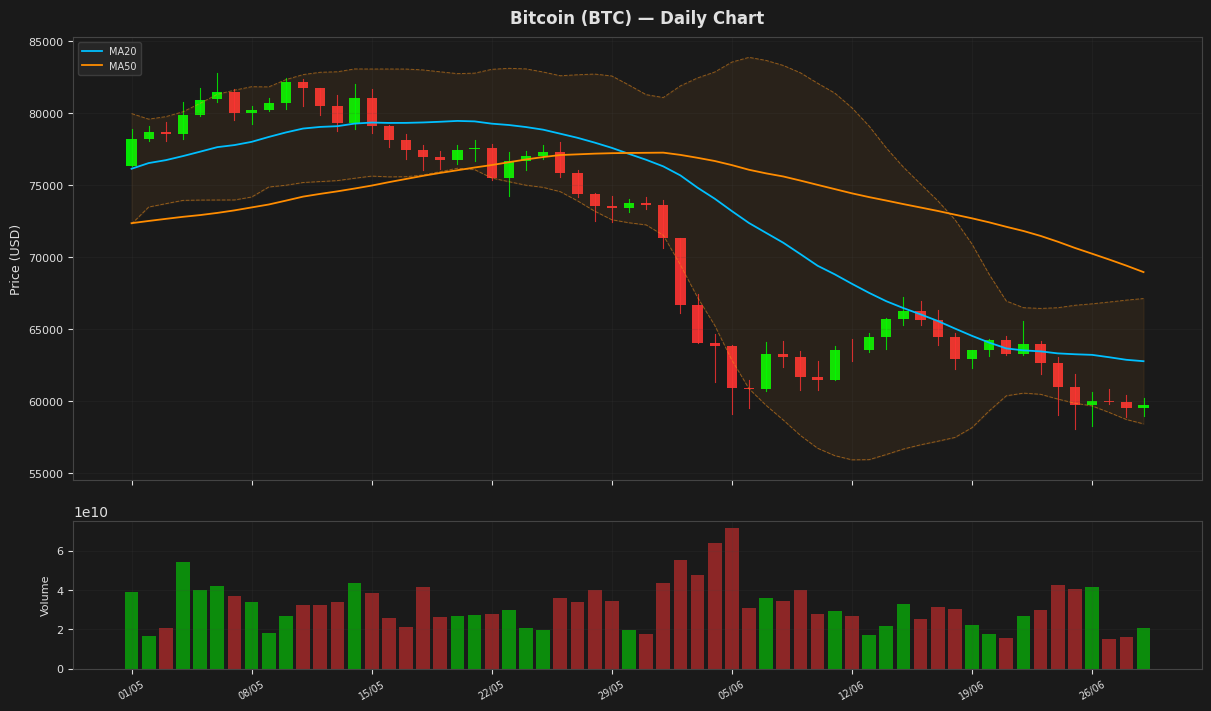
Bitcoin is currently trading at $59,699.62, near the lower band of the Bollinger Bands at $58,423.76, indicating a potential oversold condition, which is further supported by the RSI(14) value of 21.67. The MACD is negative and below its signal line, suggesting a bearish trend. The price is also below both MA20 and MA50, indicating a downward pressure.
Ethereum (ETH) — -0.01%
$1,570.20 52W: $1,506.51 — $4,250.67
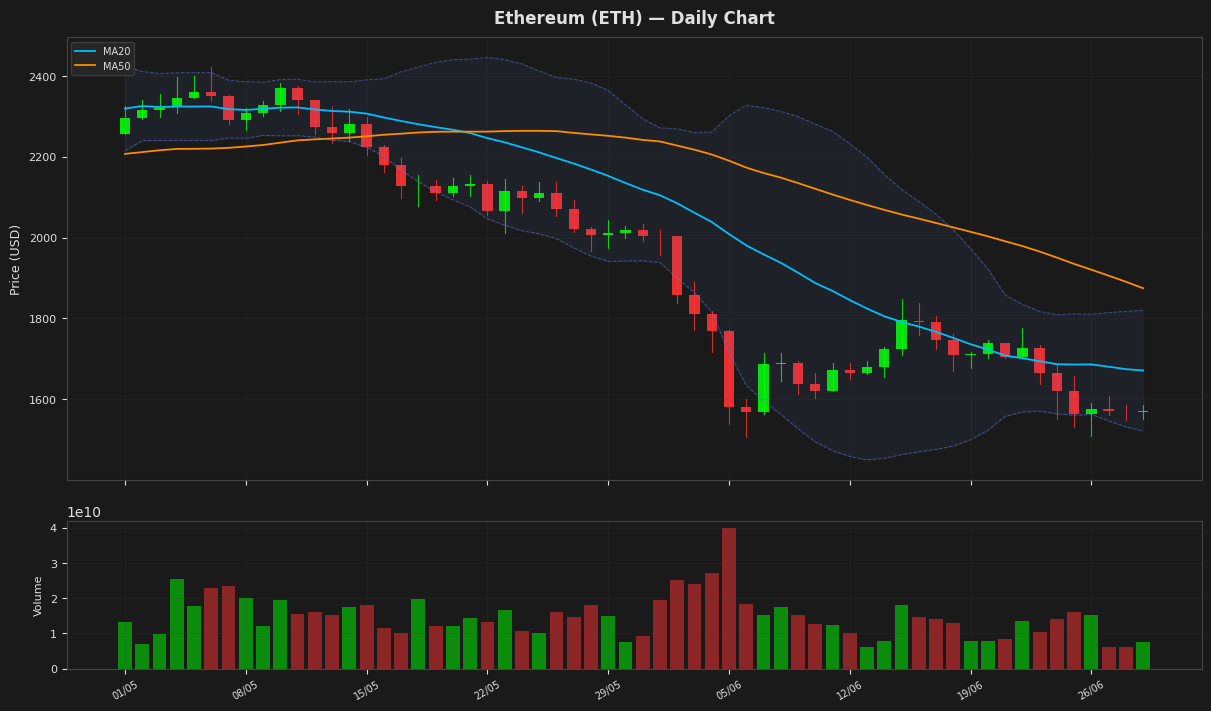
Ethereum's price is currently at $1,570, near the lower Bollinger Band at $1,521, indicating a potential oversold condition as the RSI(14) is at 18.05. The MACD is below the signal line, suggesting a bearish trend. The price is also below both the MA20 and MA50, further indicating a downtrend. The ATR(14) suggests high volatility.
Ripple (XRP) — -0.55%
$1.0418 52W: $1.0098 — $2.6934
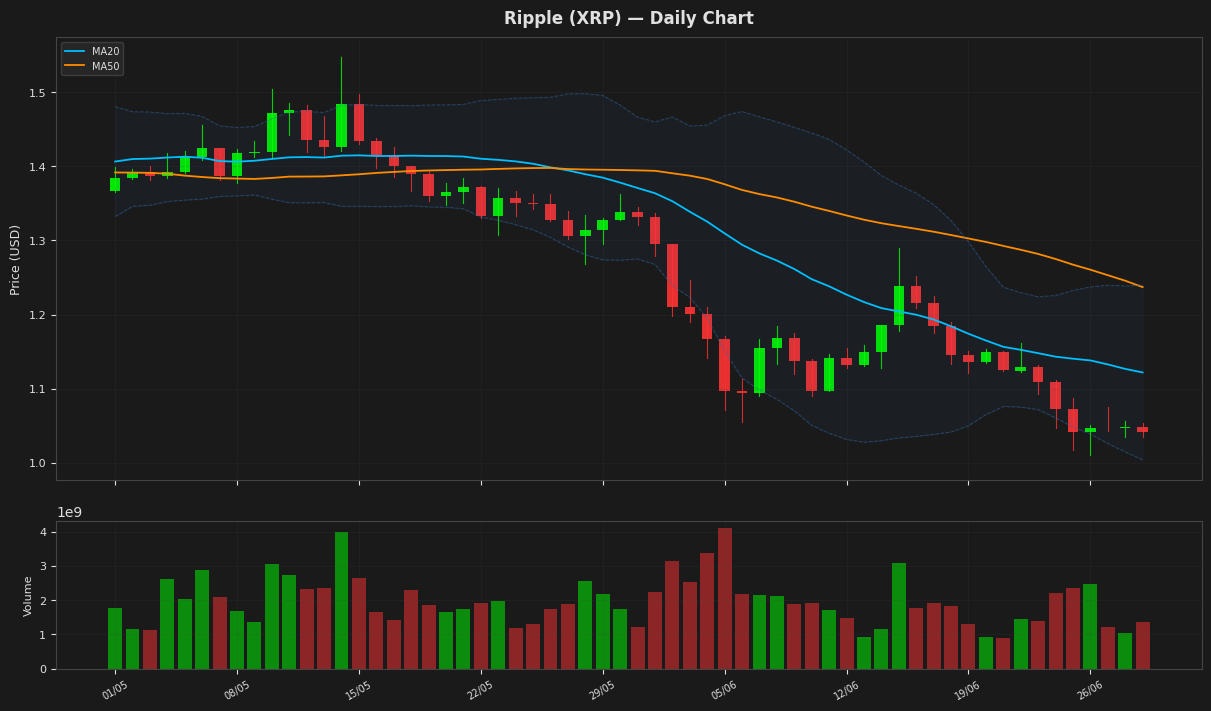
Ripple's price is currently at $1.041800, near the lower Bollinger Band at $1.003761, indicating a potential oversold condition supported by the RSI(14) value of 9.65638, which is below 10. The MACD is negative and below its signal line, suggesting a bearish trend. The price is also below both the MA20 and MA50, further indicating a downtrend.
Solana (SOL) — +1.45%
$72.3500 52W: $60.4147 — $205.0200
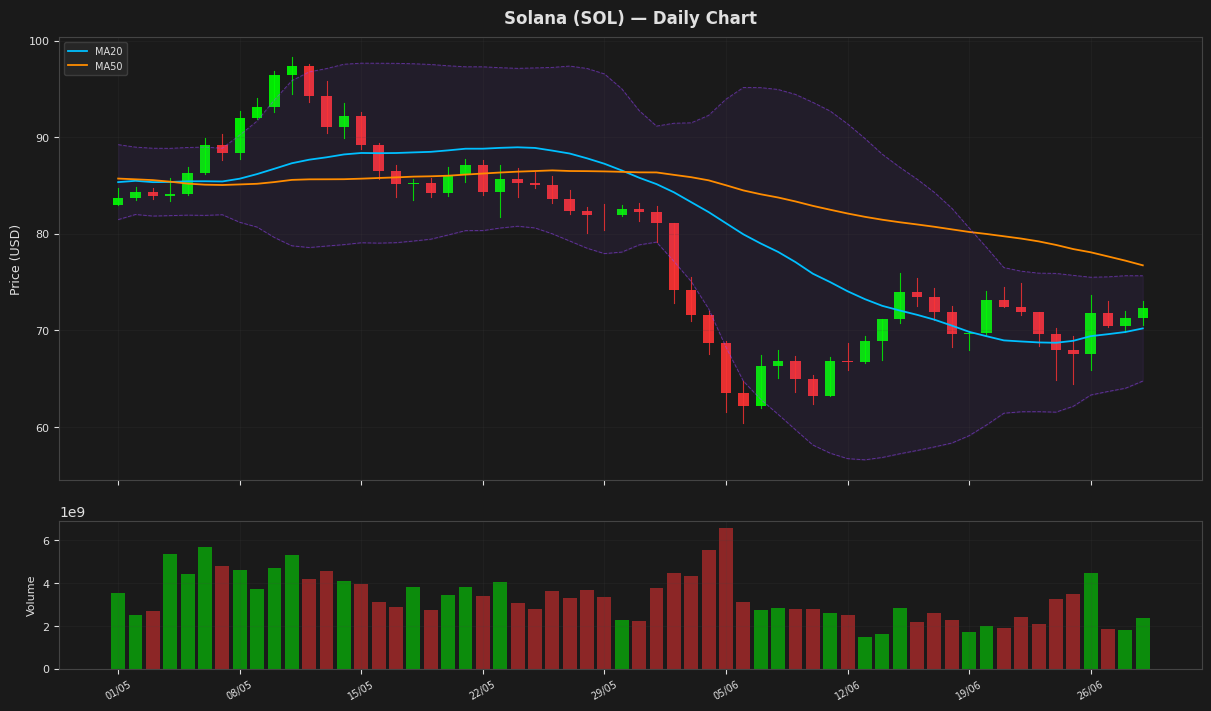
Solana's price is currently at $72.35, showing a slight increase of 1.45%. The RSI at 46.14 indicates a neutral stance, while the MACD line is above its signal line, suggesting a potential bullish crossover. The price is below the MA50 at $76.74 and near the upper Bollinger Band's lower boundary, indicating a possible consolidation phase. The ATR suggests moderate volatility.
BNB (BNB) — +0.17%
$551.6500 52W: $543.1838 — $1,180.01
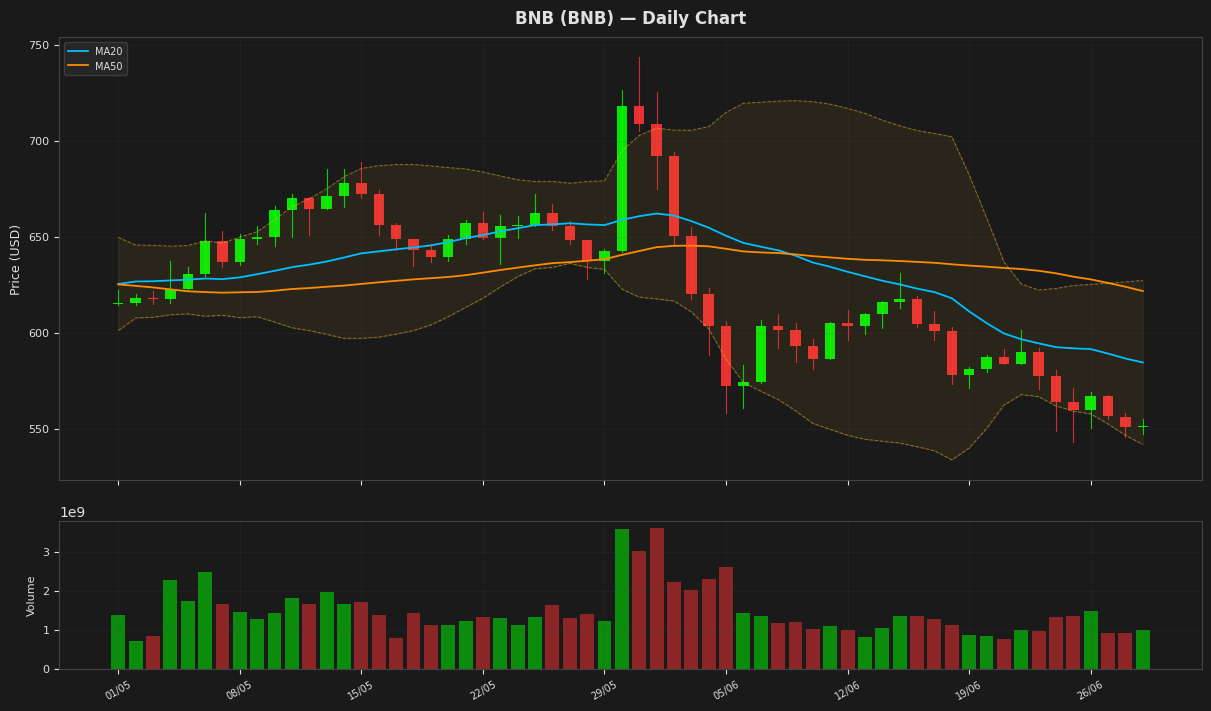
BNB is currently trading at $551.65, near its 52-week low of $543.18, with an oversold RSI reading of 20.98 indicating potential for a bounce. The price is also near the lower Bollinger Band at $541.81, suggesting a possible support level. The MACD is in negative territory and below its signal line, indicating a bearish trend. The low ATR suggests relatively stable volatility.
Tron (TRX) — +0.61%
$0.323584 52W: $0.268138 — $0.376332
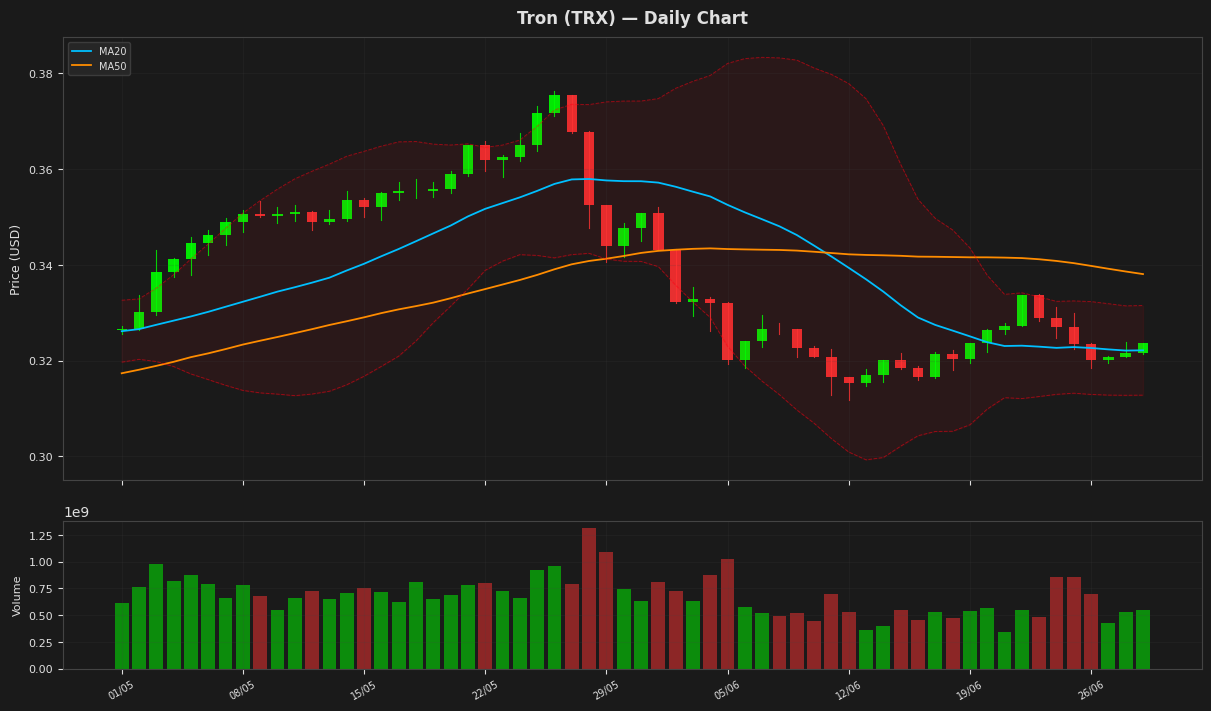
Tron's price is currently at $0.323584, showing a slight increase of 0.61% in a day, and is positioned near the upper Bollinger Band at $0.331507, indicating potential resistance. The RSI of 56.714638 suggests a neutral to slightly bullish sentiment. With the MACD being above its signal line, a potential bullish crossover is indicated, although the margin is narrow. The current price is between the MA20 and MA50, indicating a possible trend reversal if it breaks above the MA50 at $0.33807.
Dogecoin (DOGE) — -1.19%
$0.072220 52W: $0.072059 — $0.209315
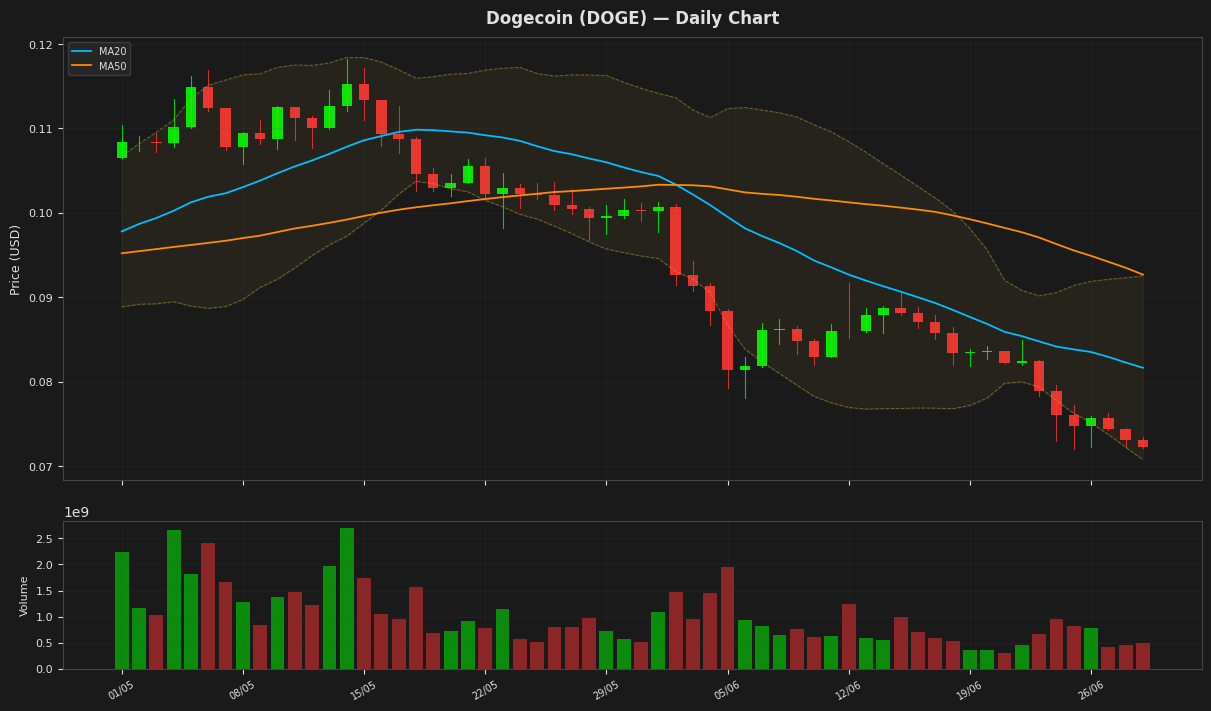
Dogecoin's price is currently at $0.072220, near its 52-week low of $0.072059, indicating a strong downtrend. The RSI(14) value of 6.938055 suggests that DOGE is oversold, potentially setting up for a bounce. The MACD is below its signal line, indicating bearish momentum, while the price is near the lower Bollinger Band at $0.070726, indicating potential support.
Disclaimer
The content on MarketsFN.com is provided for educational and informational purposes only. It does not constitute financial advice or investment recommendations. All investments involve risk. Past performance does not guarantee future results.