BNB at $552: Oversold RSI Hints Rebound Amid 0.26% Gain
· Crypto · QuoteReporter
BNB at $552: Oversold RSI Hints Rebound Amid 0.26% Gain
BNB (BNB/USD) | June 29, 2026 $552.1200 +0.26%
🔍 Technical Analysis
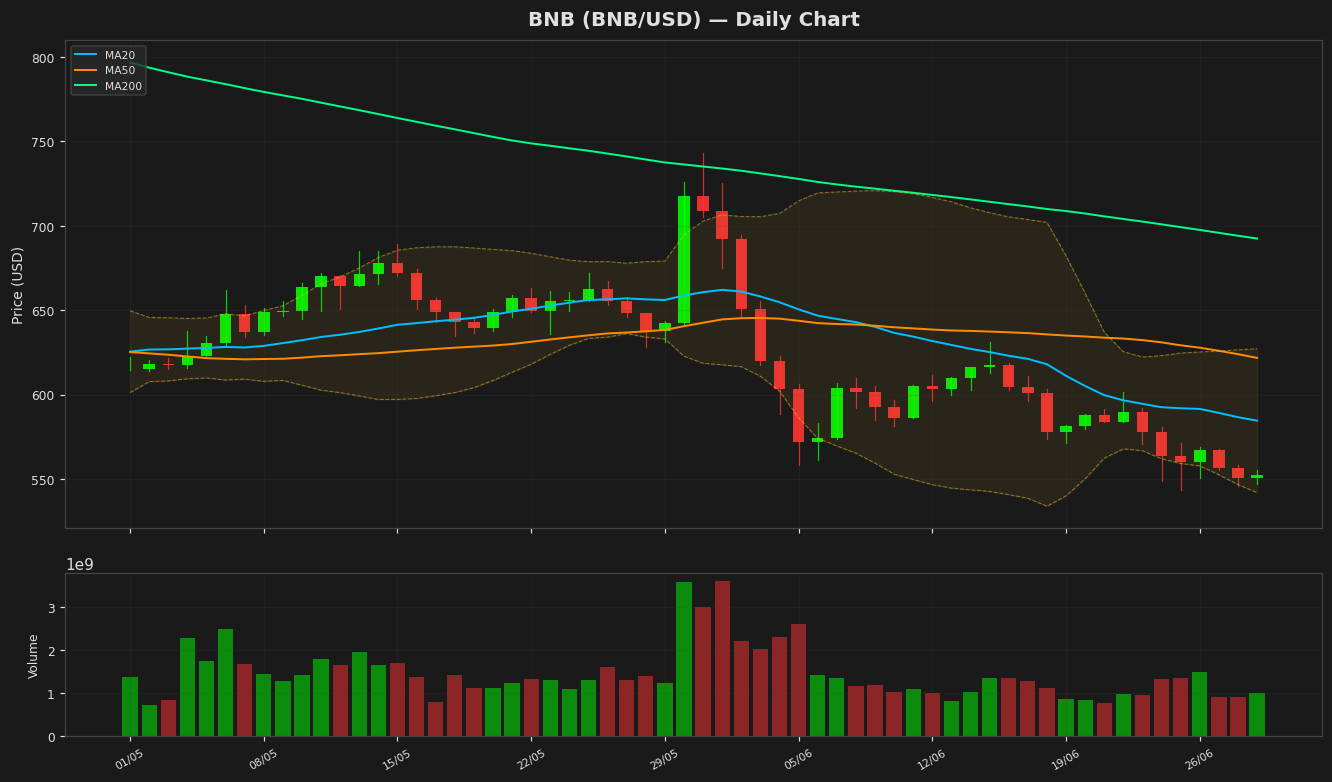
BNB is currently trading at $552.12, showing a marginal daily gain of 0.26%. The price remains below all key moving averages, indicating a bearish trend in the short to medium term. The 20-day MA at $584.54 and the 50-day MA at $621.70 act as immediate resistance levels, while the 200-day MA at $692.43 underscores a longer-term downtrend. Bollinger Bands reveal a narrowing range, with the upper band at $627.17 and the lower band at $541.91, suggesting reduced volatility. The price hovering near the lower band signals potential oversold conditions. The RSI at 21.31 is deeply oversold, which could precede a short-term bounce or consolidation. The MACD histogram at -18.37 remains below the signal line (-16.14), confirming bearish momentum. Key support lies at the yearly low of $543.18, a critical level to watch for further downside. Resistance levels are seen at the 20-day MA ($584.54) and the 52-week high of $1,180.01, though the latter seems distant given current momentum. The ATR of 17.00 reflects moderate volatility. Overall, BNB remains in a downtrend, but oversold RSI conditions may prompt a temporary rebound if support holds.
Technical Metrics
| Metric | Value |
|---|---|
| Current Price | $552.1200 |
| Daily Change | +0.26% |
| MA 20 | $584.5390 |
| % from MA20 | -5.55% |
| MA 50 | $621.6994 |
| % from MA50 | -11.19% |
| MA 200 | $692.4292 |
| % from MA200 | -20.26% |
| BB Upper | $627.1683 |
| % from BB Upper | -11.97% |
| BB Lower | $541.9097 |
| % from BB Lower | +1.88% |
| RSI (14) | 21.31 |
| MACD | -18.366172 |
| MACD Signal | -16.137605 |
| ATR (14) | 17.003762 |
| 3-Day High | $567.6495 |
| 3-Day Low | $545.8073 |
| 52-Week High | $1,180.0149 |
| % from 52W High | -53.21% |
| 52-Week Low | $543.1838 |
| % from 52W Low | +1.65% |
| YTD High | $954.8583 |
| % from YTD High | -42.18% |
| YTD Low | $543.1838 |
| % from YTD Low | +1.65% |
📊 Market Commentary
**BNB Market Commentary**
BNB is currently trading at $552.12, up slightly by 0.26% today, as the broader crypto market shows cautious optimism. The Relative Strength Index (RSI) sits at 21.3, indicating deeply oversold conditions, which could signal a potential short-term rebound if buying interest returns. However, the lack of strong momentum suggests traders remain wary amid broader market uncertainty.
Over the past 52 weeks, BNB has ranged between $543.18 and $1,180.01, reflecting significant volatility. The current price is near the lower end of this range, testing key support around $540–$550. A sustained break below this zone could lead to further downside, with $500 as the next psychological support. Conversely, resistance levels to watch include $580 (recent swing high) and $600 (a key psychological barrier).
Market sentiment remains mixed. While oversold conditions may attract bargain hunters, concerns about regulatory scrutiny and broader macroeconomic risks continue to weigh on investor confidence. Traders are closely monitoring Bitcoin’s price action, as BNB often correlates with BTC’s movements. Additionally, developments around Binance’s ecosystem, including adoption trends and network upgrades, could influence BNB’s near-term trajectory.
Given the low RSI, some traders may anticipate a relief rally, but caution prevails until stronger bullish signals emerge. Volume trends and institutional flows will be key in determining whether BNB can stabilize or faces further pressure.
Disclaimer
The content on MarketsFN.com is provided for educational and informational purposes only. It does not constitute financial advice or investment recommendations. All investments involve risk. Cryptocurrency markets are highly volatile. Past performance does not guarantee future results.