BNB Eyes Breakout as Price Hits $592.85, RSI Signals Opportunity
· Crypto · QuoteReporter
BNB Eyes Breakout as Price Hits $592.85, RSI Signals Opportunity
BNB (BNB/USD) | June 22, 2026 $592.8500 +1.56%
🔍 Technical Analysis
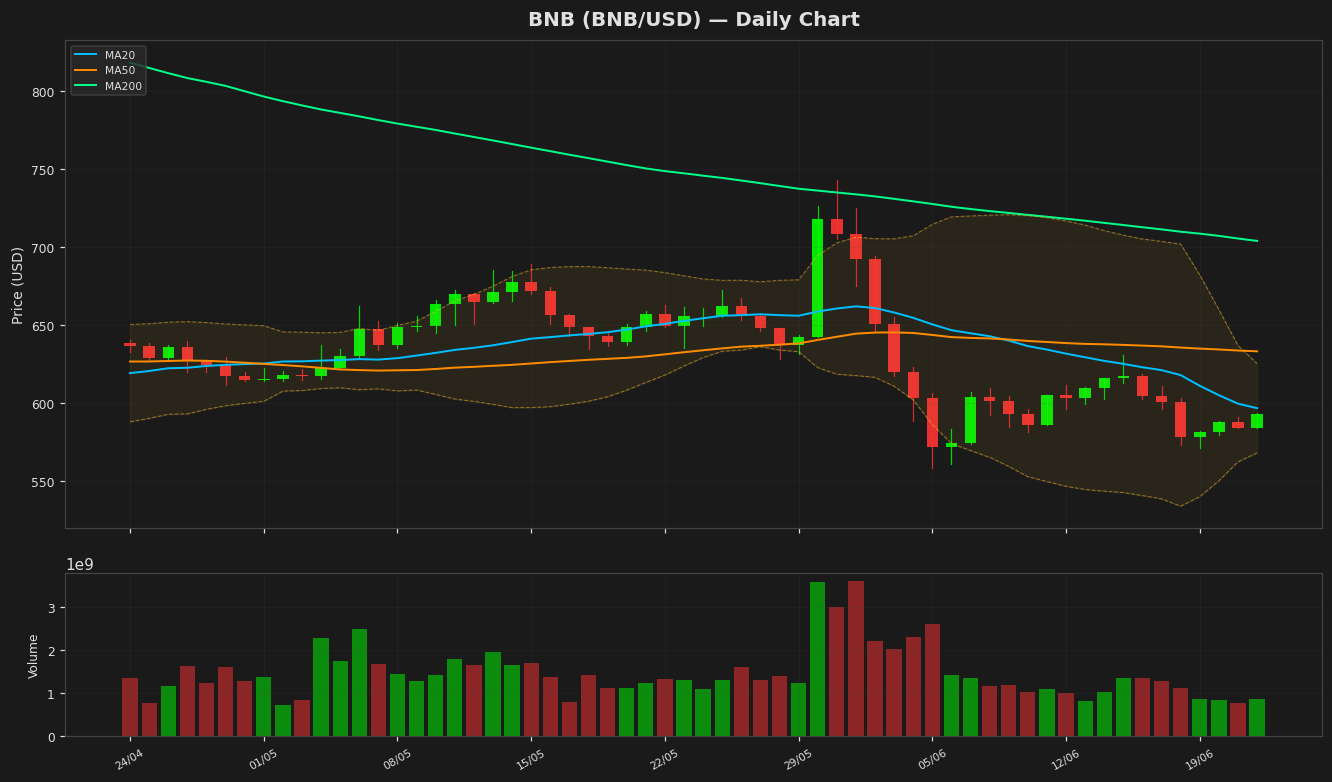
BNB is currently trading at $592.85, showing a modest daily gain of 1.56%. The price remains below its key moving averages, with the 20-day MA at $596.74, the 50-day MA at $633.21, and the 200-day MA at $704.04, indicating a bearish trend in the medium to long term. The Bollinger Bands suggest moderate volatility, with the upper band at $625.42 and the lower band at $568.06. The price hovering near the lower band signals potential oversold conditions, though it hasn’t breached the band yet. The RSI(14) stands at 46.07, reflecting neutral momentum with a slight bearish bias as it lingers below the 50 midline. The MACD histogram shows a negative value of -13.07, below the signal line at -12.73, reinforcing the bearish momentum. Key resistance levels to watch include the 20-day MA at $596.74 and the upper Bollinger Band at $625.42, while immediate support lies at the lower Bollinger Band ($568.06) and the 52-week low ($558.39). A break below this support could trigger further downside, whereas a push above the 20-day MA may signal a short-term recovery. The ATR(14) at 15.10 indicates subdued volatility, suggesting consolidation may continue unless a breakout occurs. Year-to-date, BNB remains well below its YTD high of $954.86, reflecting persistent bearish pressure. Traders should monitor these key levels for potential trend reversals or continuations.
Technical Metrics
| Metric | Value |
|---|---|
| Current Price | $592.8500 |
| Daily Change | +1.56% |
| MA 20 | $596.7416 |
| % from MA20 | -0.65% |
| MA 50 | $633.2144 |
| % from MA50 | -6.37% |
| MA 200 | $704.0378 |
| % from MA200 | -15.79% |
| BB Upper | $625.4233 |
| % from BB Upper | -5.21% |
| BB Lower | $568.0599 |
| % from BB Lower | +4.36% |
| RSI (14) | 46.07 |
| MACD | -13.071847 |
| MACD Signal | -12.727127 |
| ATR (14) | 15.097665 |
| 3-Day High | $593.7935 |
| 3-Day Low | $579.6949 |
| 52-Week High | $1,316.4071 |
| % from 52W High | -54.96% |
| 52-Week Low | $558.3898 |
| % from 52W Low | +6.17% |
| YTD High | $954.8583 |
| % from YTD High | -37.91% |
| YTD Low | $558.3898 |
| % from YTD Low | +6.17% |
📊 Market Commentary
BNB is currently trading at $592.85, up 1.56% today, as the broader crypto market shows cautious optimism. The Relative Strength Index (RSI) at 46.1 indicates neutral momentum, neither overbought nor oversold, suggesting balanced market conditions. Over the past 52 weeks, BNB has fluctuated between $558.39 and $1,316.41, reflecting significant volatility driven by broader market trends and platform-specific developments.
Market sentiment around BNB remains mixed. Traders are closely monitoring key support and resistance levels, with immediate support near $580, a level tested multiple times in recent weeks. A break below this could see further downside toward the yearly low of $558.39. On the upside, resistance is observed around $620, a level that has previously acted as both support and resistance. A sustained move above this zone could signal renewed bullish interest.
Traders are also watching Binance-related developments, including regulatory updates and ecosystem growth, as these factors often influence BNB’s price action. The token’s utility within the Binance ecosystem, including fee discounts and participation in token sales, continues to underpin its demand. However, macroeconomic factors and Bitcoin’s price movements remain critical drivers for BNB’s near-term trajectory. For now, the market appears to be in a consolidation phase, awaiting clearer signals for the next directional move.
Disclaimer
The content on MarketsFN.com is provided for educational and informational purposes only. It does not constitute financial advice or investment recommendations. All investments involve risk. Cryptocurrency markets are highly volatile. Past performance does not guarantee future results.