Crypto Market Update: Dogecoin Gains While BNB and Ripple Dip
· Crypto · QuoteReporter
Crypto Market Update: Dogecoin Gains While BNB and Ripple Dip
Crypto Market Report | August 07, 2026
📊 Crypto Market Overview
The cryptocurrency market is experiencing a cautious yet stable sentiment, with Bitcoin (BTC) trading at $64,401.48, reflecting a modest increase of 0.22% today. Ethereum (ETH) follows closely at $1,905.22, up 0.17%. The overall market shows a mix of performance among major altcoins, with Ripple (XRP) declining by 0.57%, signaling potential bearish pressure as its RSI sits at 33.5, indicating oversold conditions. Notably, Solana (SOL) has gained 0.49%, while BNB has slipped by 0.69%, highlighting a divergence in performance across the sector.
In the macro context, the market is navigating through a landscape of regulatory scrutiny and emerging news. The Japan Financial Services Agency (FSA) has urged local exchanges to implement withdrawal delays to combat rising scams, reflecting increasing regulatory measures globally. Meanwhile, the proposed CLARITY Act in the US Senate aims to provide clearer guidelines for cryptocurrency taxation, which could have significant implications for market participants.
Technical indicators reveal a mixed picture. Bitcoin's RSI stands at 51.9, suggesting a neutral stance, while its MACD at 29.1189 indicates bullish momentum. Ethereum's RSI of 55.6 also points to a healthy market condition, with its MACD at 19.9035 further supporting this view. Conversely, Ripple's MACD of -0.0165 and low RSI indicate a potential struggle ahead.
As the market awaits key economic data, including the US jobs report, traders remain vigilant. The crypto landscape is also being shaped by recent developments, such as Wintermute's launch of a US broker-dealer and the ongoing debate around Ethereum's staking rewards, which could influence investor sentiment in the coming weeks. Overall, while the market shows resilience, it is evident that external factors and regulatory developments will play a critical role in shaping its trajectory.
In the macro context, the market is navigating through a landscape of regulatory scrutiny and emerging news. The Japan Financial Services Agency (FSA) has urged local exchanges to implement withdrawal delays to combat rising scams, reflecting increasing regulatory measures globally. Meanwhile, the proposed CLARITY Act in the US Senate aims to provide clearer guidelines for cryptocurrency taxation, which could have significant implications for market participants.
Technical indicators reveal a mixed picture. Bitcoin's RSI stands at 51.9, suggesting a neutral stance, while its MACD at 29.1189 indicates bullish momentum. Ethereum's RSI of 55.6 also points to a healthy market condition, with its MACD at 19.9035 further supporting this view. Conversely, Ripple's MACD of -0.0165 and low RSI indicate a potential struggle ahead.
As the market awaits key economic data, including the US jobs report, traders remain vigilant. The crypto landscape is also being shaped by recent developments, such as Wintermute's launch of a US broker-dealer and the ongoing debate around Ethereum's staking rewards, which could influence investor sentiment in the coming weeks. Overall, while the market shows resilience, it is evident that external factors and regulatory developments will play a critical role in shaping its trajectory.
📰 Crypto News
- Coldcard exploit pushes July losses to $247M as second-worst month of 2026
- Japan FSA asks crypto exchanges to impose withdrawal delays to fight scams
- Proposed CLARITY ethics deal could save Trump millions in taxes: Bloomberg
- Bitget explores licensed crypto presence in Bhutan
- US Senate pushes CLARITY Act vote to September
- MARA swings to Q2 loss as Bitcoin’s slump masks higher output
- Crypto market maker Wintermute launches US broker-dealer
- Following primary loss, crypto PACs invest $1.5M in 3 US state races
- Ethereum staking token weETH splits from restaking as rewards debate heats up
- Live updates: Bitcoin flat at $64,300 before US jobs report, with oil back as a headwind
- Bitcoin whales load up on $1.2 billion in BTC as ETFs attract $750 million
- Bitcoin wallet dormant since 2011 moves $3.2 million toward FalconX-linked address
- A bitcoin pattern taking shape right now could send prices soaring to $76,000
- XRP leads majors losses as Clarity Act vote slips to September
- Senate won't vote on crypto Clarity Act before its summer break
🔍 Technical Analysis
Bitcoin (BTC) — +0.22%
$64,401.48 52W: $57,747.77 — $97,860.60
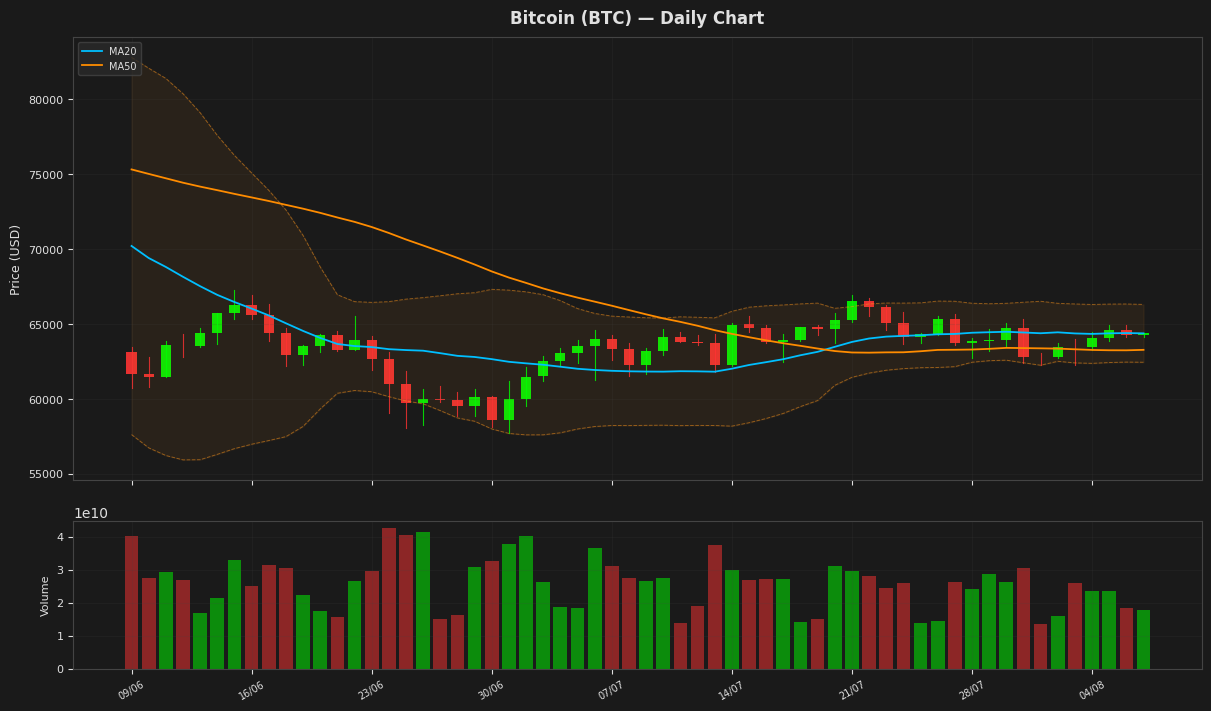
Bitcoin is currently trading at $64,401.48, reflecting a slight daily increase of 0.22%. The price is above the 20-day moving average (MA20) of $64,369.45 and the 50-day moving average (MA50) of $63,268.46, indicating a bullish trend. The RSI is at 51.85, suggesting that Bitcoin is neither overbought nor oversold, while the MACD shows positive momentum. With the price nearing the upper Bollinger Band at $66,297.45, potential resistance may be encountered in the near term.
Ethereum (ETH) — +0.17%
$1,905.22 52W: $1,506.51 — $3,446.62
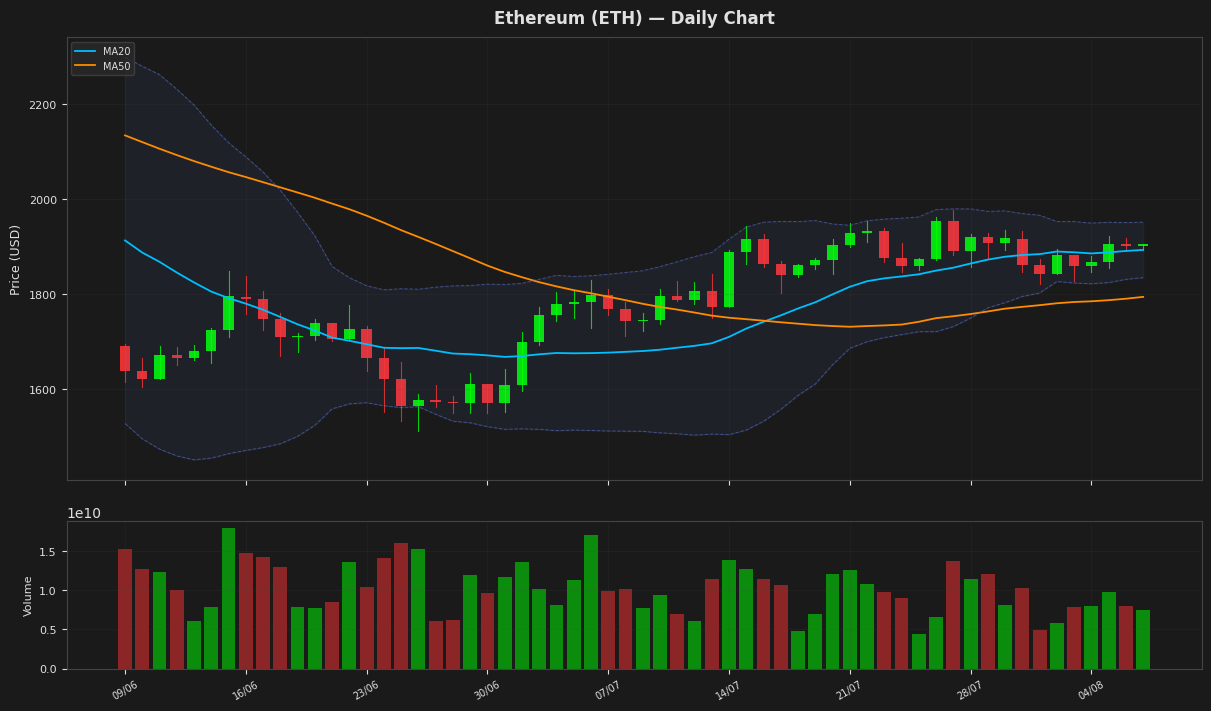
Ethereum is currently trading at $1,905.22, reflecting a slight daily increase of 0.17%. The price is above both the 20-day moving average (MA20) of $1,893.21 and the 50-day moving average (MA50) of $1,794.16, indicating a bullish trend. The Relative Strength Index (RSI) at 55.65 suggests that ETH is neither overbought nor oversold, while the MACD indicates a positive momentum. With Bollinger Bands showing upper and lower limits at $1,951.73 and $1,834.69 respectively, ETH is currently positioned within a moderate volatility range.
Ripple (XRP) — -0.57%
$1.0278 52W: $1.0098 — $2.4103
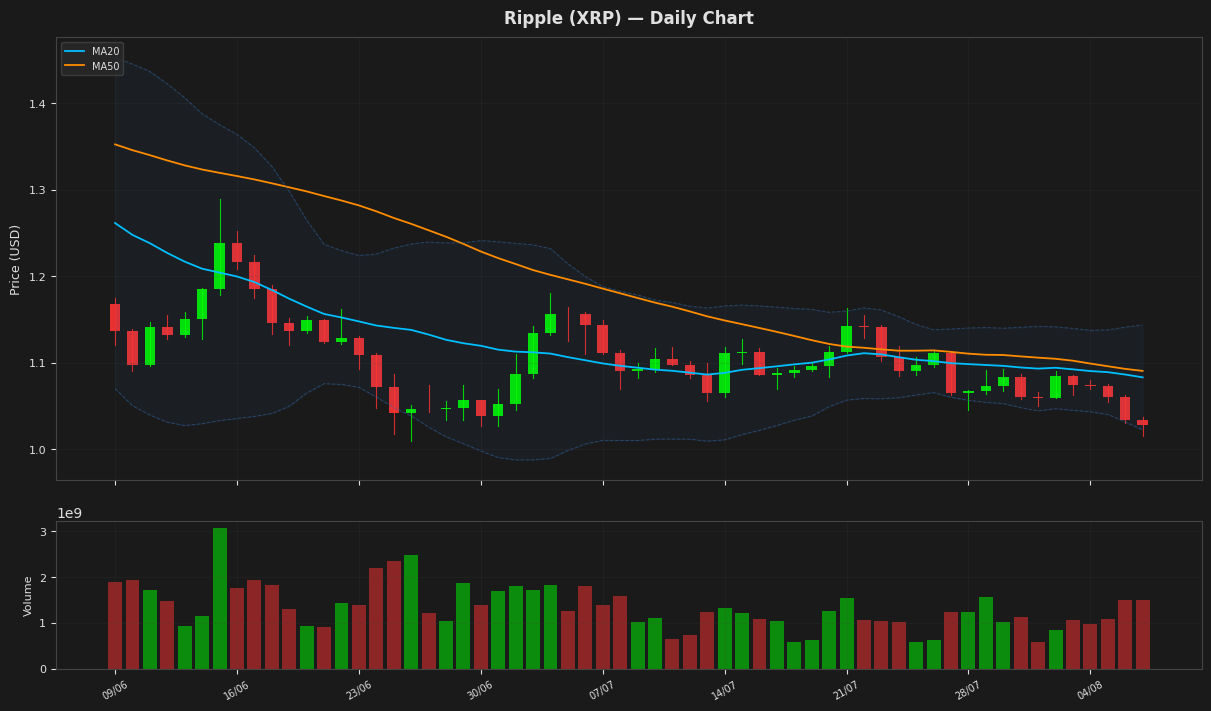
Ripple (XRP) is currently trading at $1.027800, reflecting a slight daily decline of 0.57%. The price is below both the 20-day and 50-day moving averages, which are at $1.083202 and $1.09061 respectively, indicating a bearish trend. The RSI is at 33.51, suggesting that XRP is nearing oversold conditions, while the MACD remains negative, reinforcing the downward momentum. With the price approaching the lower Bollinger Band at $1.022558, a potential support level may be tested, particularly given the 52-week low of $1.009753.
Solana (SOL) — +0.49%
$72.9300 52W: $60.4147 — $148.2160
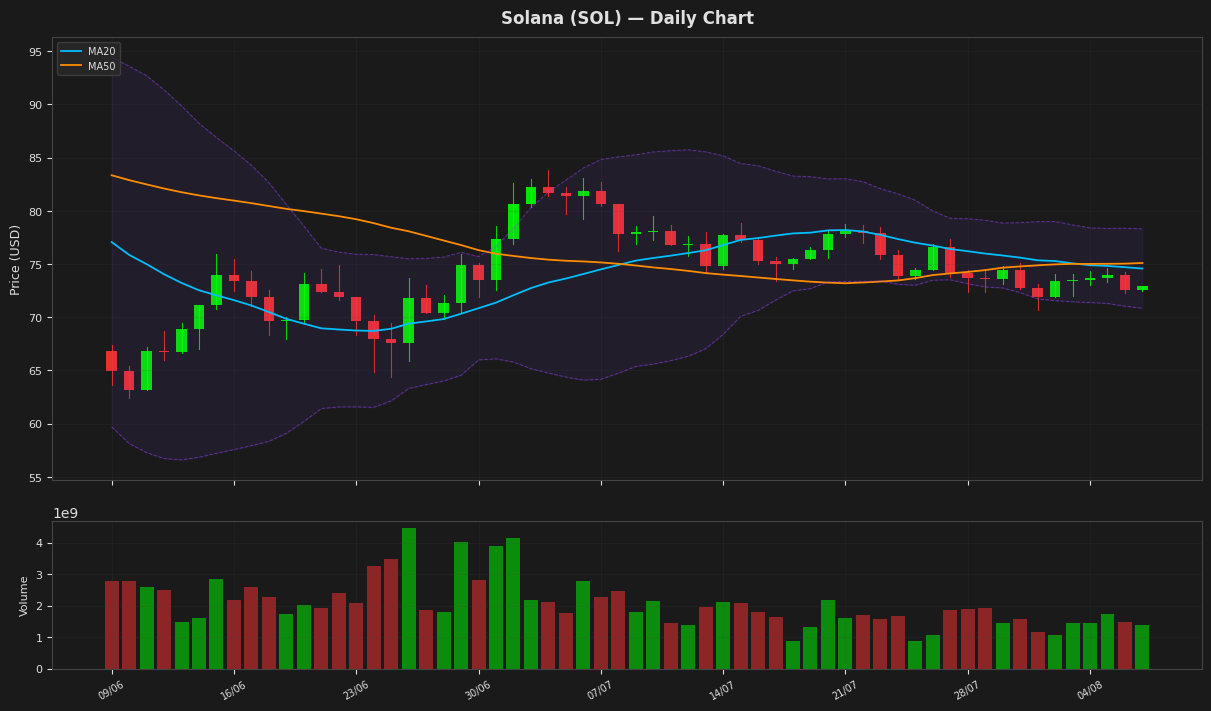
Solana is currently trading at $72.93, reflecting a slight daily increase of 0.49%. The price is below both the 20-day moving average of $74.58 and the 50-day moving average of $75.10, indicating a bearish trend. The Relative Strength Index (RSI) at 46.36 suggests that Solana is approaching neutral territory, while the MACD is negative, signaling potential downward momentum. With Bollinger Bands showing resistance at $78.31 and support at $70.85, the price may remain range-bound unless a breakout occurs.
BNB (BNB) — -0.69%
$587.5700 52W: $538.5992 — $954.8583
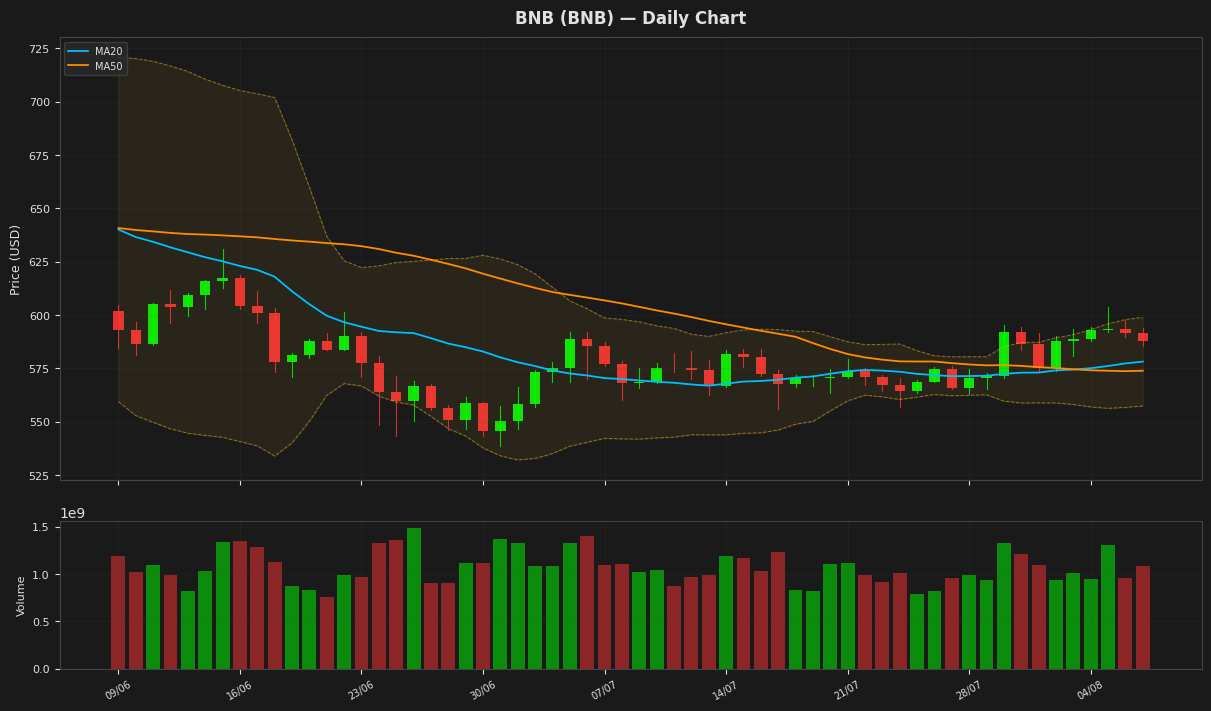
BNB is currently trading at $587.57, showing a slight daily decline of 0.69%. The price is above both the 20-day moving average (MA20) of 578.12 and the 50-day moving average (MA50) of 573.83, indicating a bullish trend. The Relative Strength Index (RSI) at 63.48 suggests that BNB is nearing overbought territory, while the MACD indicates positive momentum. The price is also within the Bollinger Bands, with the upper band at 598.94 and the lower band at 557.30, suggesting potential volatility ahead.
Tron (TRX) — +0.00%
$0.326866 52W: $0.268138 — $0.376332
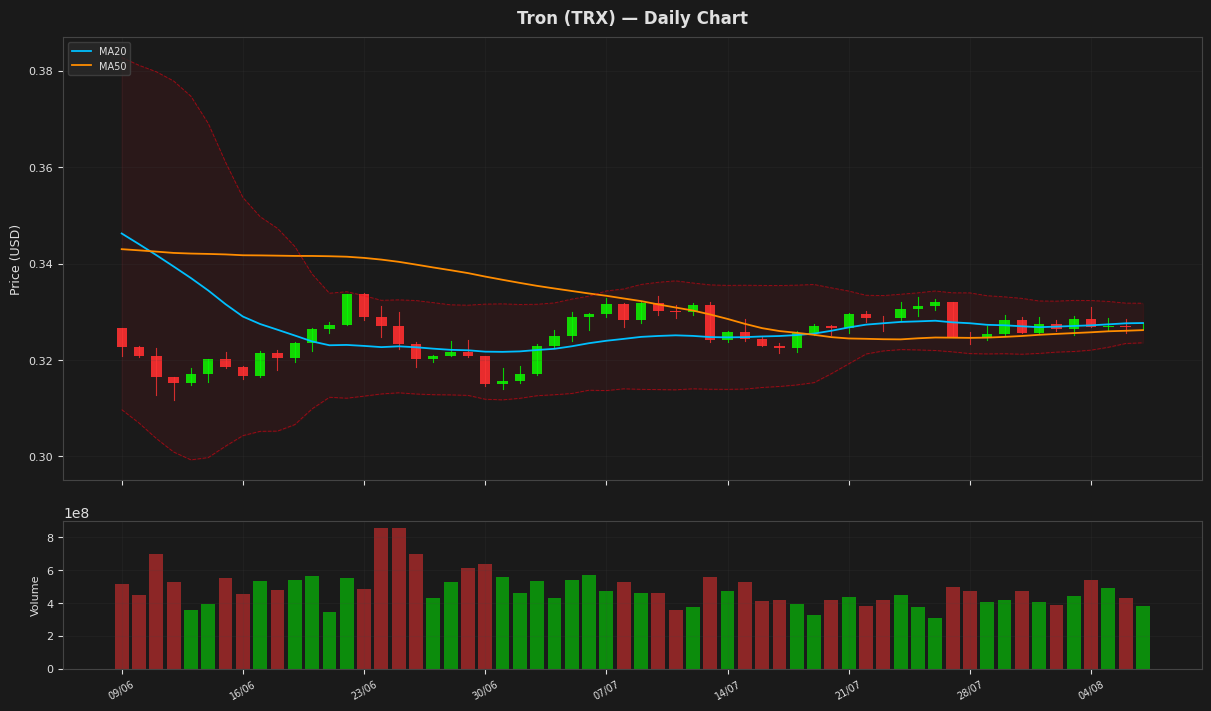
Tron (TRX) is currently priced at $0.326866, showing no daily change. The price is slightly below the 20-day moving average (MA20) of $0.327663, indicating a potential bearish trend, while the relative strength index (RSI) at 41.96 suggests that TRX is nearing oversold territory. The Bollinger Bands indicate a narrow trading range, with the upper band at $0.331765 and the lower band at $0.323561, which may lead to increased volatility if the price breaks out of this range. Overall, the technical indicators suggest a cautious outlook for Tron in the near term.
Dogecoin (DOGE) — +0.50%
$0.069330 52W: $0.067973 — $0.156091
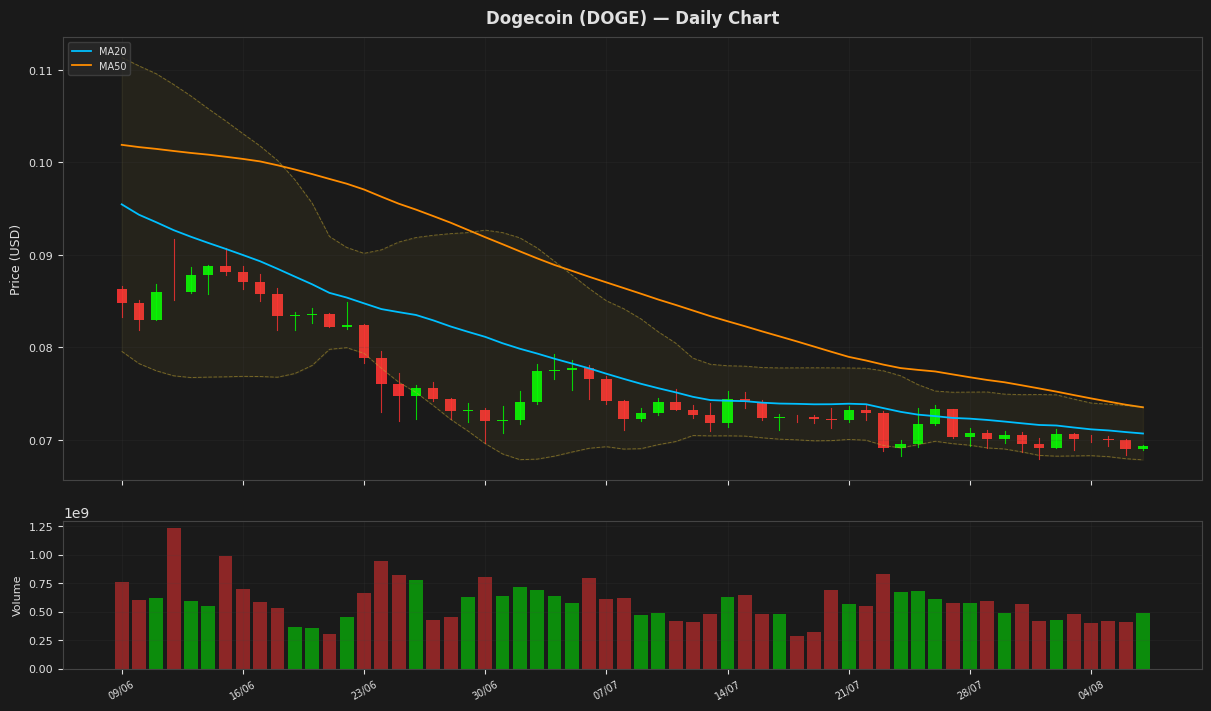
Dogecoin is currently trading at $0.069330, reflecting a modest daily increase of 0.50%. The price is below both the 20-day moving average (MA20) of $0.070689 and the 50-day moving average (MA50) of $0.073525, indicating a potential bearish trend. The Relative Strength Index (RSI) is at 49.29, suggesting that the asset is neither overbought nor oversold, while the MACD is slightly negative, indicating weak momentum. With the price hovering near the lower Bollinger Band at $0.067838, there may be limited downside risk, but a sustained move above the MA20 could signal a bullish reversal.
Disclaimer
The content on MarketsFN.com is provided for educational and informational purposes only. It does not constitute financial advice or investment recommendations. All investments involve risk. Past performance does not guarantee future results.