Crypto Market Update: Solana and Tron Lead Gains Amidst Dogecoin Slump
· Crypto · QuoteReporter
Crypto Market Update: Solana and Tron Lead Gains Amidst Dogecoin Slump
Crypto Market Report | July 01, 2026
📊 Crypto Market Overview
The cryptocurrency market is currently characterized by a mix of stability and oversold conditions. Bitcoin, the largest cryptocurrency by market capitalization, is trading at $58,526, having remained relatively flat over the past 24 hours with a marginal decline of 0.06%. The Relative Strength Index (RSI) for Bitcoin stands at 25.1, indicating that it is in oversold territory, while the Moving Average Convergence Divergence (MACD) is at -2390.7044, suggesting a bearish trend.
Other major cryptocurrencies are also displaying oversold conditions, with Ethereum's RSI at 26.8 and BNB's at 26.0. Ripple's RSI is even lower, at 15.7, and Dogecoin's is at 8.3, indicating that these assets are potentially undervalued. In contrast, Solana is trading with an RSI of 55.5, suggesting a more neutral position.
The macroeconomic context is influenced by various news headlines, including regulatory developments and high-profile cases involving cryptocurrency. Taiwan's legislature has passed regulations on crypto and stablecoins, while a former CEO has pleaded guilty in a $400 million crypto Ponzi case. Additionally, there are ongoing lawsuits involving major cryptocurrency exchanges and executives.
From a technical perspective, the MACD indicators for most major cryptocurrencies are in negative territory, indicating a prevailing bearish sentiment. However, the oversold RSI readings for several assets could be seen as a contrarian signal, potentially indicating a buying opportunity. Overall, the market sentiment remains cautious, with a focus on regulatory developments and the resolution of high-profile cases. The current technical signals suggest a continued bearish trend, but the oversold conditions may be worth monitoring for potential reversals.
📰 Crypto News
- Former Goliath Ventures CEO pleads guilty in $400M crypto Ponzi case
- Taiwan’s legislature passes crypto, stablecoin regulations
- Anthropic to bring back Fable 5 as US lifts export controls
- Here’s what happened in crypto today
- Trump earned more from crypto than real estate in 2025, filings show
- Director of ‘47 Ronin’ who gambled Netflix funds on crypto gets 30 months
- UK crypto investors sue Binance, Changpeng Zhao for $200M
- Has Strategy’s capital overhaul put an end to ‘death spiral’ fears?
- Bitcoin just $5K away from ‘best investment opportunity’ of bear market
- Massachusetts AG files amended lawsuit against Kalshi over sports betting after court ruling
- Bitmine Ether buys eclipsed by $345M ETH ETF outflows: Is sub $1.5K next?
- SEC seeks public comment on regulating next generation of ETFs
- Bitcoin’s 20% June crash looks even deadlier on the charts. Here’s why
- Live markets: U.S. spot bitcoin ETFs had their worst month ever in June, shedding $4.5 billion
- Anthropic restores AI models Fable, Mythos after the U.S. lifts export controls
🔍 Technical Analysis
Bitcoin (BTC) — -0.06%
$58,526.01 52W: $58,045.93 — $116,273.31
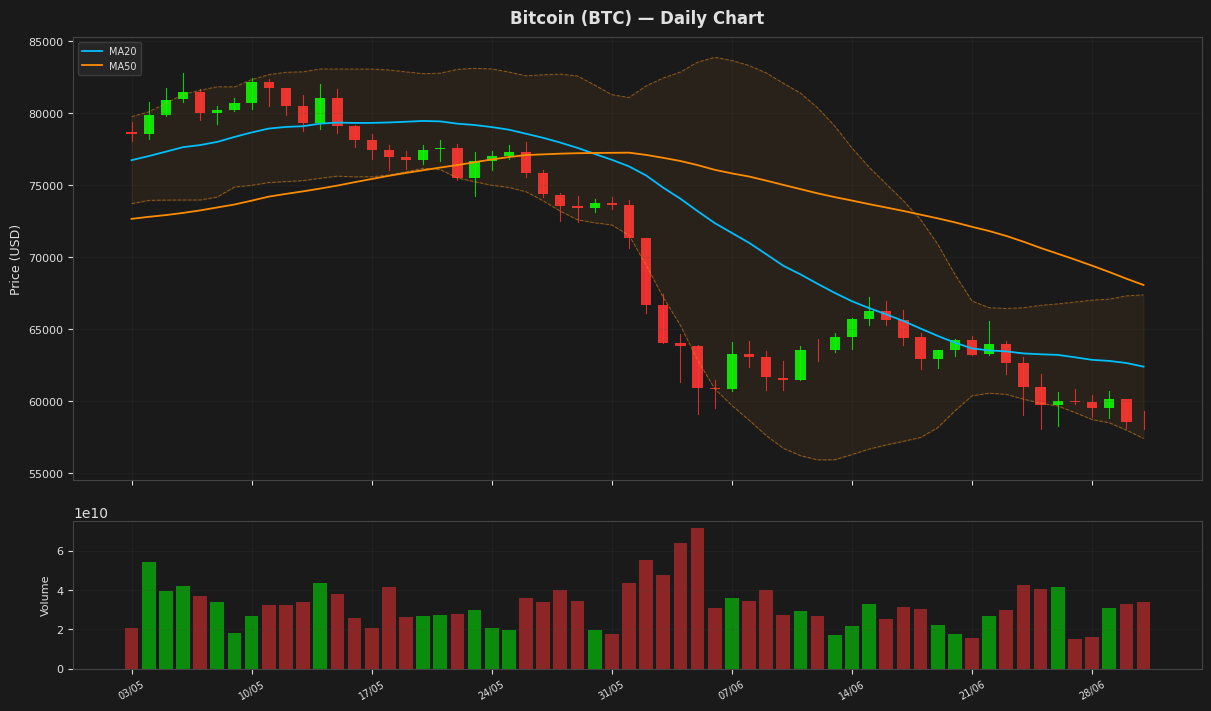
Bitcoin's price is currently at $58,526, near the lower Bollinger Band at $57,415, indicating a potential oversold condition as the RSI(14) is at 25.05, suggesting a possible bounce. The MACD is below its signal line, indicating a bearish trend. The price is also below both MA20 and MA50, further reinforcing the bearish sentiment. The ATR(14) indicates high volatility.
Ethereum (ETH) — +0.00%
$1,569.60 52W: $1,506.51 — $4,250.67
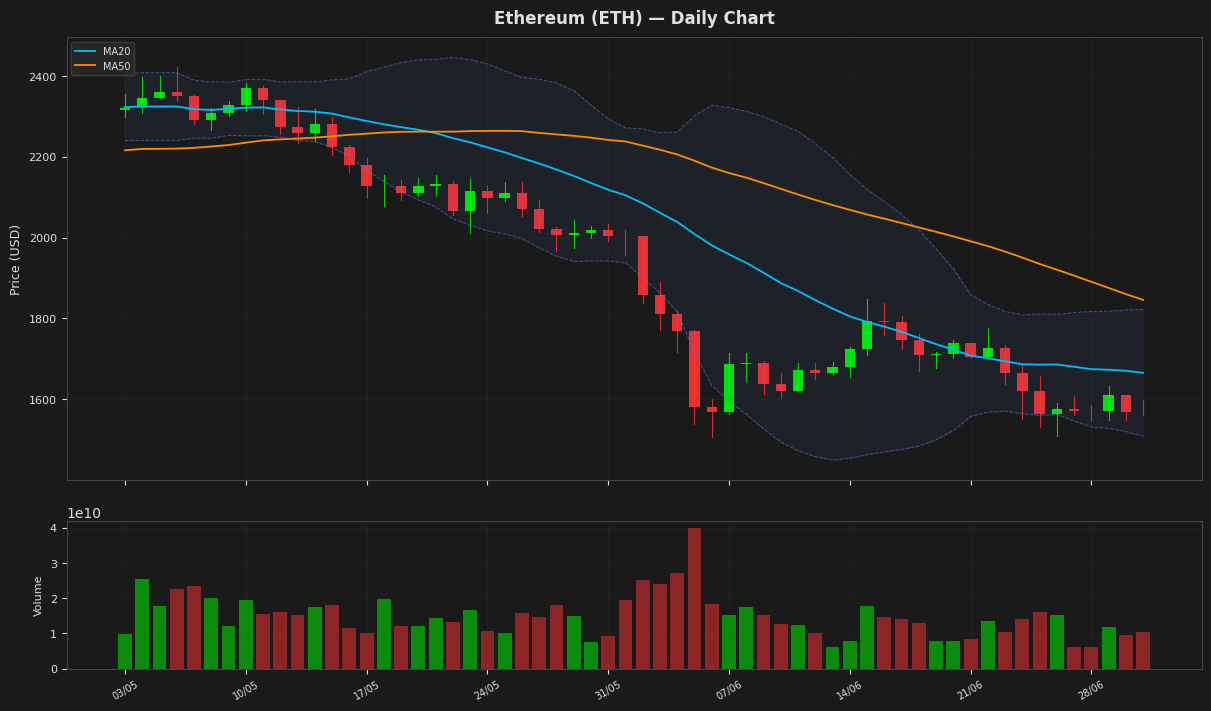
Ethereum is currently trading at $1,569.60, near its 52-week low of $1,506.51, with an RSI of 26.85 indicating oversold conditions. The price is also close to the lower Bollinger Band at $1,508.67, suggesting potential support. The MACD is below its signal line but showing a slight bullish divergence. The ATR indicates moderate volatility.
Ripple (XRP) — +0.04%
$1.0388 52W: $1.0098 — $2.6934
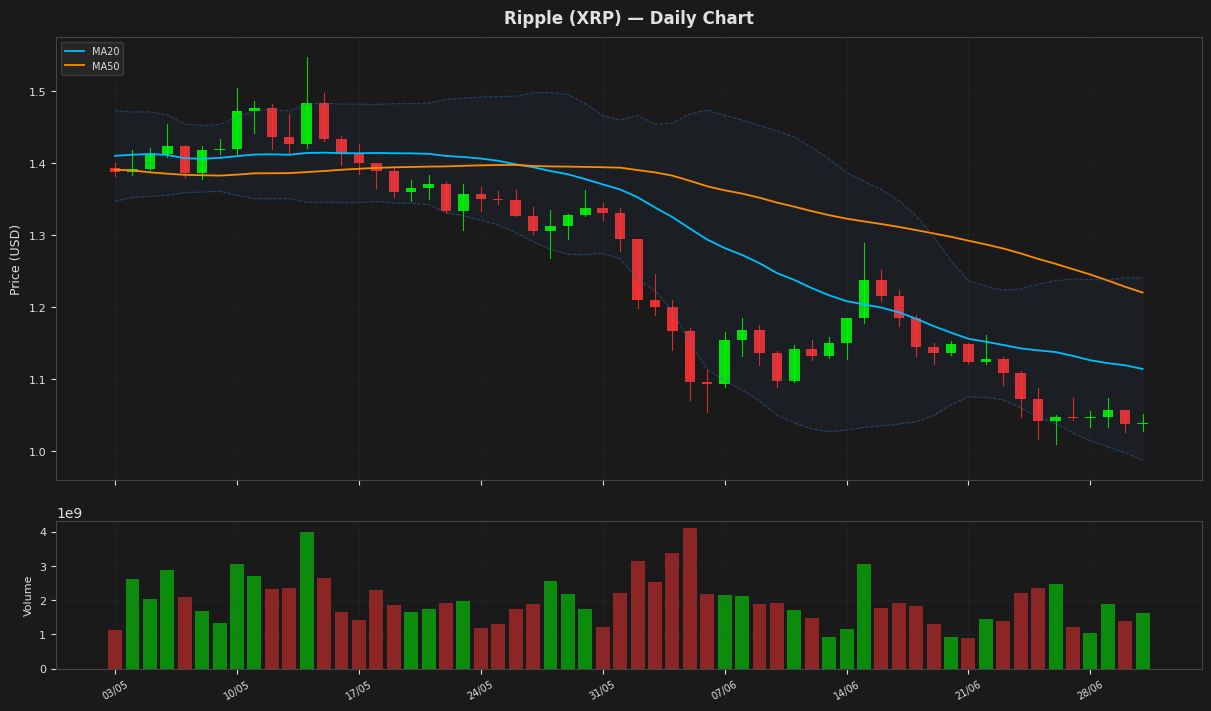
Ripple's price is currently at $1.038800, near the lower Bollinger Band at $0.988231, indicating potential support. The RSI is oversold at 15.729536, suggesting a possible bounce. The MACD is below the signal line, indicating a bearish trend, but the small gap between them suggests a potential reversal. The price is also close to its 52-week low of $1.009753.
Solana (SOL) — +1.42%
$74.5700 52W: $60.4147 — $205.0200
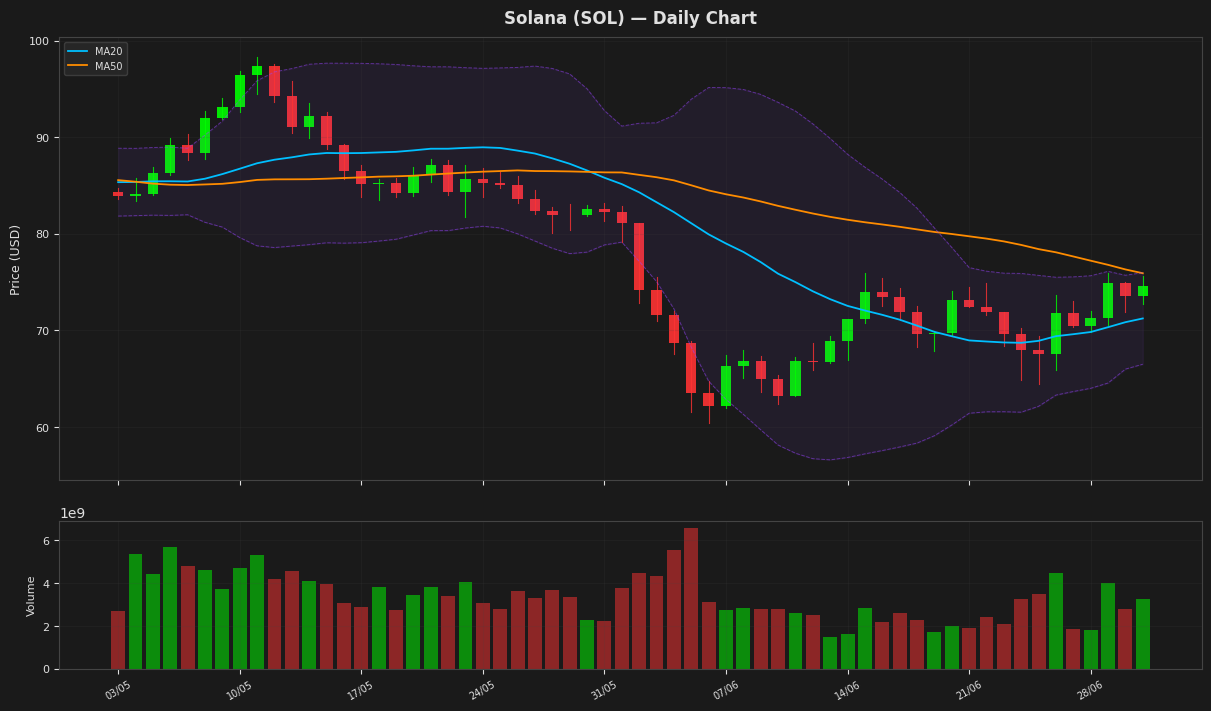
Solana's price is currently at $74.57, showing a slight increase of 1.42%. The RSI at 55.465723 indicates a neutral momentum, while the MACD line is below the signal line, suggesting a potential bearish trend. The price is near the upper Bollinger Band at 75.976377, indicating a possible resistance level. The ATR of 3.885323 suggests moderate volatility.
BNB (BNB) — -0.27%
$544.2100 52W: $542.4232 — $1,180.01
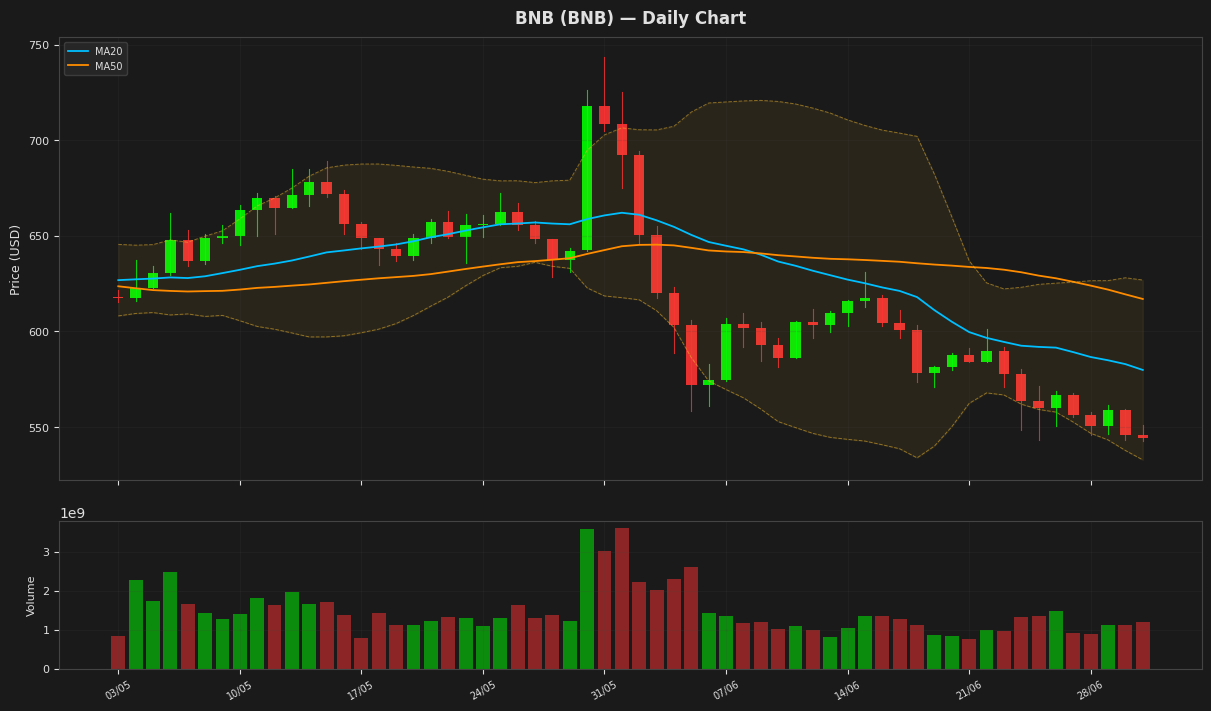
BNB is currently trading near its 52-week low at $544.21, with the RSI(14) indicating oversold conditions at 26.02. The price is close to the lower Bollinger Band at $532.75, suggesting potential support. The MACD is below the signal line, indicating a bearish trend, but the oversold RSI may signal a potential reversal. The ATR(14) suggests moderate volatility.
Tron (TRX) — +0.28%
$0.315854 52W: $0.268138 — $0.376332
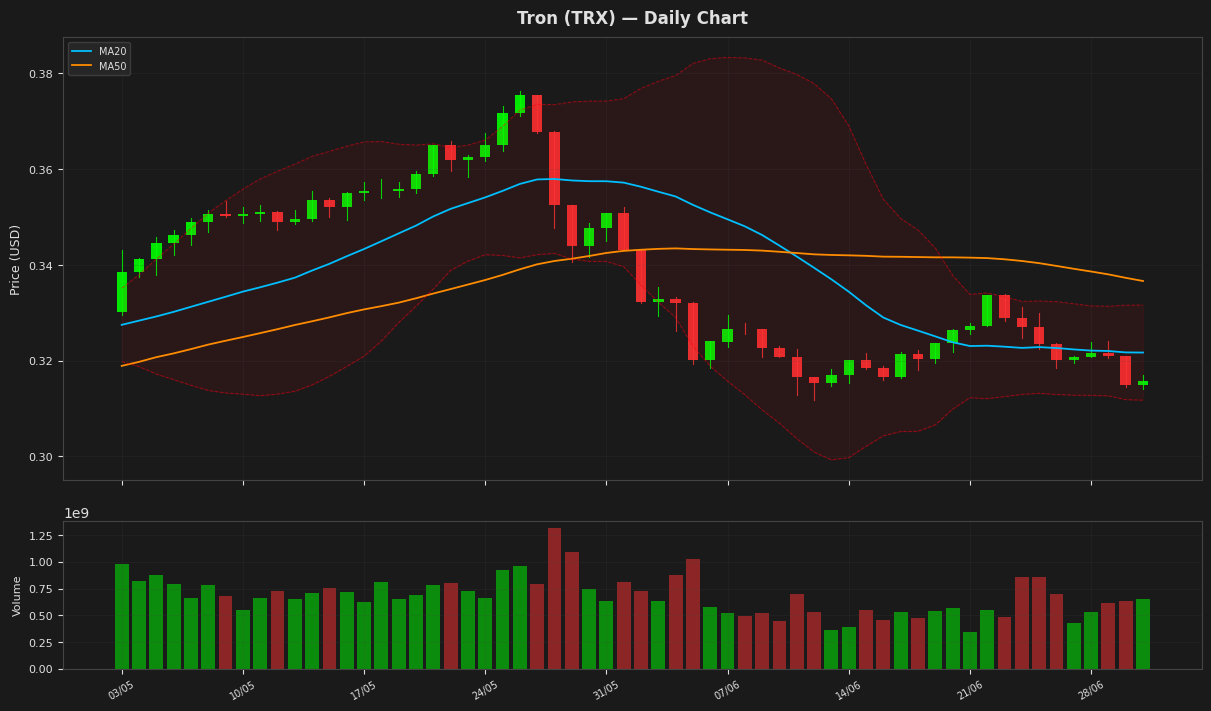
Tron's price is currently at $0.315854, showing a marginal increase of 0.28%. The RSI value of 42.392321 indicates that the asset is nearing oversold territory, while the MACD line is slightly below the signal line, suggesting a potential bearish trend. The price is also below both the MA20 and MA50, and is currently testing the lower Bollinger Band at 0.311756.
Dogecoin (DOGE) — -1.44%
$0.070960 52W: $0.069611 — $0.209315
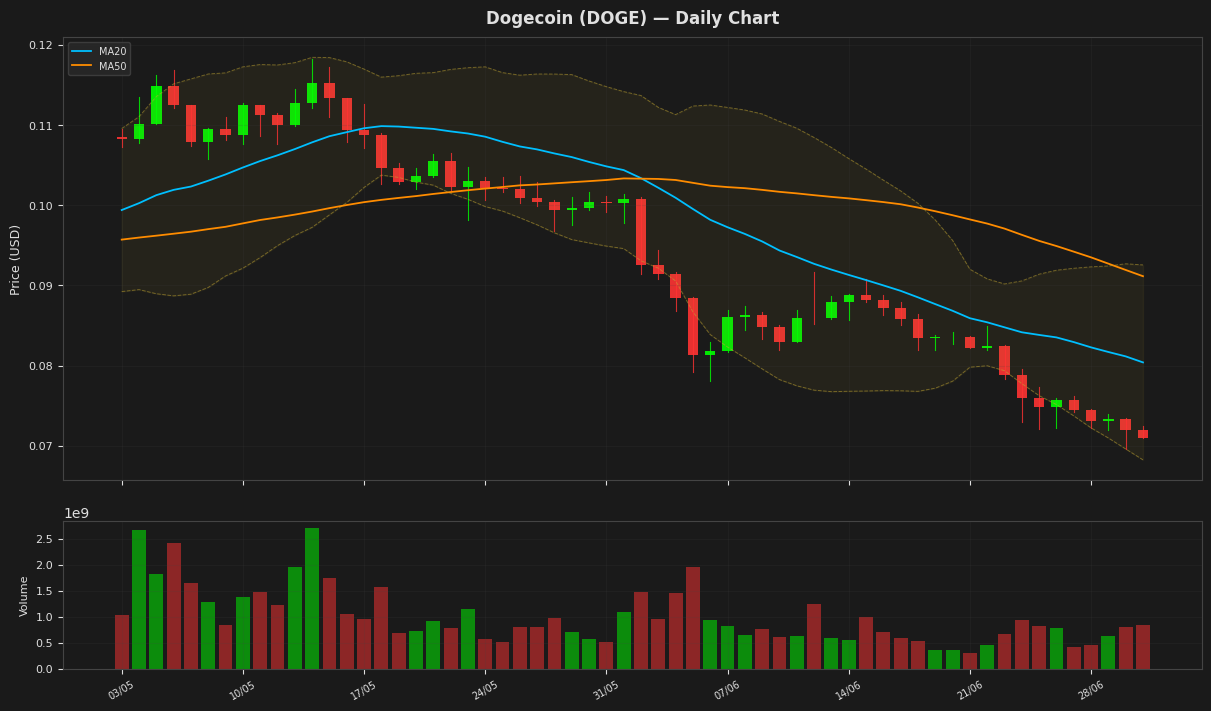
Dogecoin's price is currently at $0.070960, showing a daily decline of 1.44% and trading near the lower Bollinger Band at 0.068235, indicating oversold conditions. The RSI(14) value of 8.278519 further supports this, suggesting a potential for a bounce. The MACD is negative and below its signal line, indicating a bearish trend, but the low RSI may signal a reversal. The price is also close to its 52-week low of 0.069611.
Disclaimer
The content on MarketsFN.com is provided for educational and informational purposes only. It does not constitute financial advice or investment recommendations. All investments involve risk. Past performance does not guarantee future results.