Ethereum Surges Past $1,746 as Bulls Eye Key Resistance – RSI at 56.2
· Crypto · QuoteReporter
Ethereum Surges Past $1,746 as Bulls Eye Key Resistance – RSI at 56.2
Ethereum (ETH/USD) | June 22, 2026 $1,746.4399 +2.46%
🔍 Technical Analysis
### Ethereum (ETH) Technical Analysis
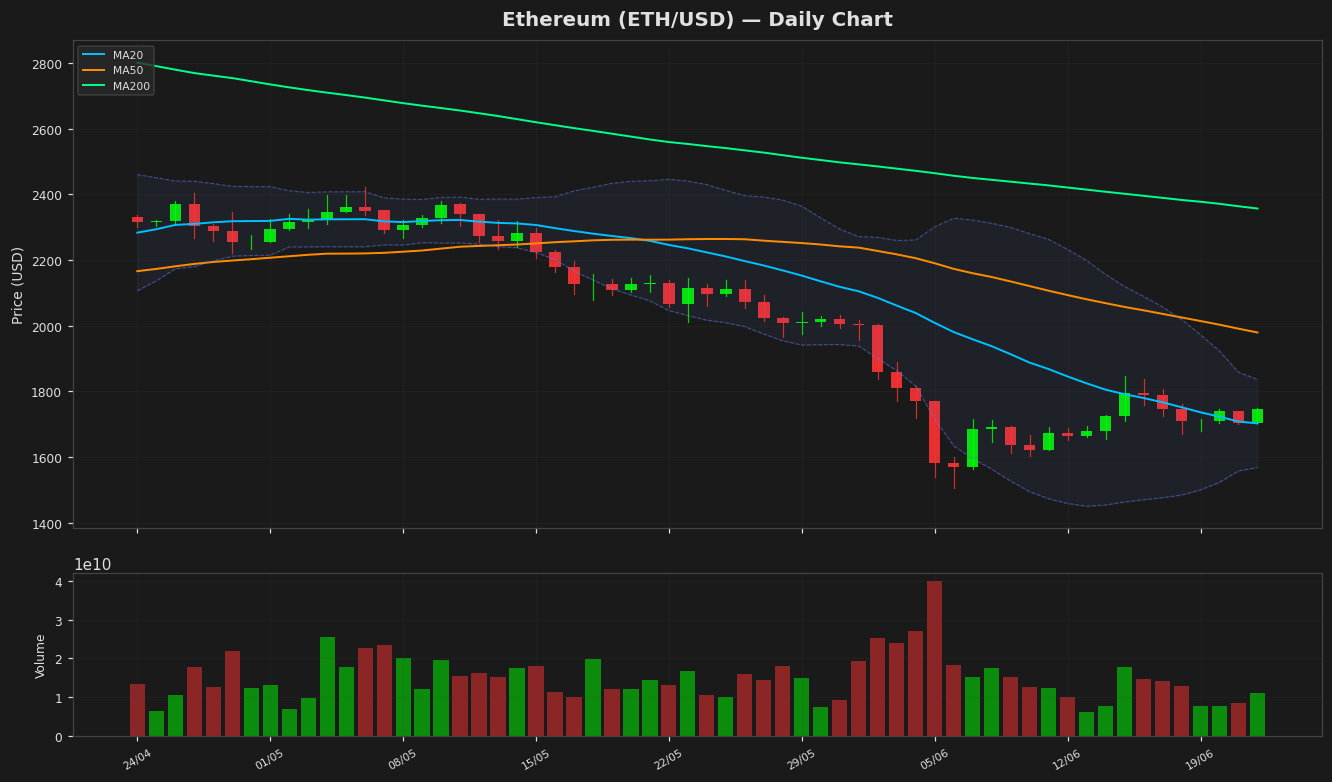
Ethereum is currently trading at **$1,746.44**, up **2.46%** on the day, showing bullish momentum. The price remains below the **MA50 ($1,979.43)** and **MA200 ($2,356.84)**, indicating a broader bearish trend in the medium to long term. However, the **MA20 ($1,702.58)** is acting as dynamic support, reinforcing short-term bullish sentiment.
Bollinger Bands show a **Upper Band at $1,836.78** and a **Lower Band at $1,568.38**, with price hovering near the mid-band, suggesting consolidation. A breakout above the upper band could signal further upside, while a drop below the lower band may indicate renewed selling pressure.
The **RSI(14) at 56.24** is neutral, neither overbought nor oversold, allowing room for further movement in either direction. The **MACD (-63.66) remains below its signal line (-85.17)**, but the histogram shows slight convergence, hinting at potential bullish momentum building.
Key resistance levels are **$1,836.78 (Upper BB)** and **$1,979.43 (MA50)**, while support lies at **$1,702.58 (MA20)** and **$1,568.38 (Lower BB)**. A breach above MA50 could target the **YTD high of $3,397.90**, while failure to hold MA20 may retest the **52W low of $1,506.51**.
The **ATR(14) at 65.54** suggests moderate volatility, reinforcing the need for confirmation before trend continuation. Traders should watch for a decisive break above MA50 or a breakdown below MA20 for directional bias.
Technical Metrics
| Metric | Value |
|---|---|
| Current Price | $1,746.4399 |
| Daily Change | +2.46% |
| MA 20 | $1,702.5825 |
| % from MA20 | +2.58% |
| MA 50 | $1,979.4255 |
| % from MA50 | -11.77% |
| MA 200 | $2,356.8425 |
| % from MA200 | -25.90% |
| BB Upper | $1,836.7832 |
| % from BB Upper | -4.92% |
| BB Lower | $1,568.3817 |
| % from BB Lower | +11.35% |
| RSI (14) | 56.24 |
| MACD | -63.658196 |
| MACD Signal | -85.166111 |
| ATR (14) | 65.535191 |
| 3-Day High | $1,750.1990 |
| 3-Day Low | $1,701.9364 |
| 52-Week High | $4,265.1055 |
| % from 52W High | -59.05% |
| 52-Week Low | $1,506.5057 |
| % from 52W Low | +15.93% |
| YTD High | $3,397.8977 |
| % from YTD High | -48.60% |
| YTD Low | $1,506.5057 |
| % from YTD Low | +15.93% |
📊 Market Commentary
Ethereum (ETH) is trading at $1,746.4399, up 2.46% today, showing moderate bullish momentum as the broader crypto market experiences cautious optimism. The Relative Strength Index (RSI) at 56.2 suggests ETH is neither overbought nor oversold, leaving room for further movement in either direction. Over the past 52 weeks, ETH has fluctuated between $1,506.5057 and $4,265.1055, reflecting the volatility typical of the crypto sector.
Market sentiment appears cautiously positive, supported by steady network activity and ongoing developments in Ethereum’s ecosystem, including layer-2 scaling solutions and protocol upgrades. Traders are closely watching the $1,800 level as a near-term resistance zone; a sustained break above could signal stronger bullish conviction. On the downside, the $1,650–$1,700 range acts as immediate support, with a drop below potentially testing the yearly low near $1,506.
Volume trends and institutional interest remain key factors, particularly with macroeconomic uncertainties influencing risk assets. ETH’s correlation with Bitcoin (BTC) continues to play a role, though Ethereum’s unique fundamentals, such as staking yields and DeFi adoption, provide additional drivers. Traders are also monitoring Ethereum’s network fees and gas usage, as spikes in activity could indicate renewed demand. For now, ETH remains in a consolidation phase, with market participants weighing technical levels against broader macroeconomic conditions.
Disclaimer
The content on MarketsFN.com is provided for educational and informational purposes only. It does not constitute financial advice or investment recommendations. All investments involve risk. Cryptocurrency markets are highly volatile. Past performance does not guarantee future results.