European Session Crude Oil Report — 19 Oct 2026
QuoteReporter
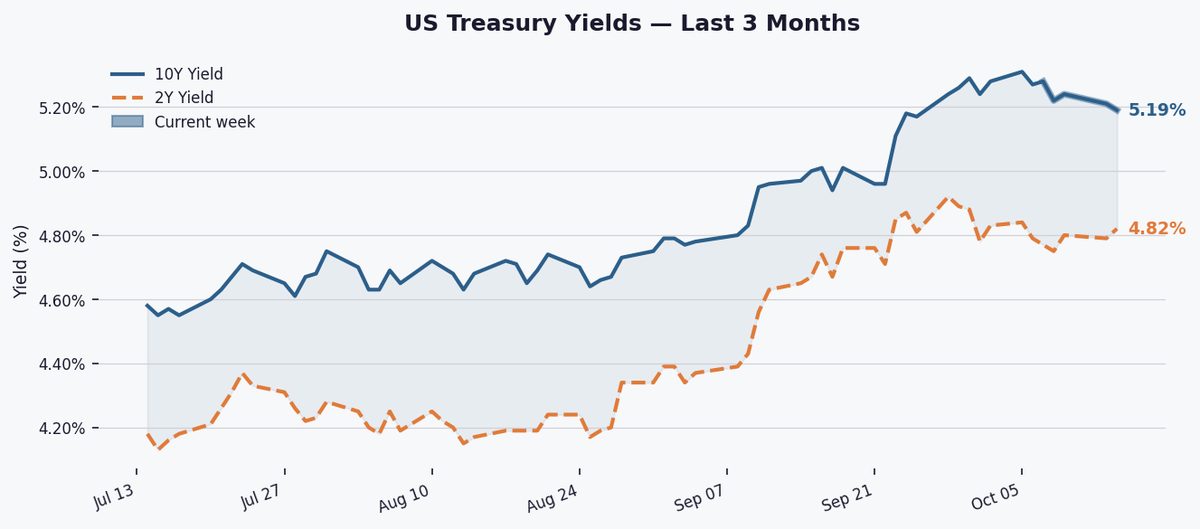
Crude oil remains under pressure as WTI extends its seven-day slide amid softening demand fears, while Brent finds modest support despite broader market volatility reflected in the S&P 500’s rally and 10-year yields holding above 5%. The tight trading ranges suggest cautious positioning ahead of key economic data, with energy markets weighing geopolitical risks against tightening monetary conditions.
WTI hovers near $90.86 in early European trade, down 0.27% on the day as it extends its seven-day slide to 3.96%, while Brent edges up 0.75% to $103.02, paring its weekly loss to 3.36%. The Asian session leaves a tight overnight range between $90.50-$91.20 for WTI and $102.40-$103.60 for Brent, with both benchmarks testing key technical levels ahead of the NYMEX open. The Brent-WTI spread holds at $12.16, pressuring European refiners already facing steep backwardation in both benchmarks.
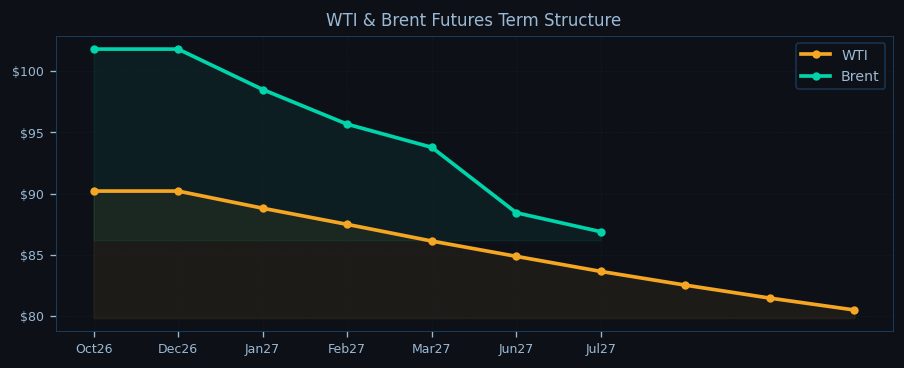
Technicals flash warning signals as WTI trades 1.6% below its 9-day EMA at $92.34, with RSI(14) deeply oversold at 22.5. The $89.46 pivot point acts as immediate support, while resistance stacks at $108.15 (R1) and $125.44 (R2). Brent’s momentum appears marginally healthier, straddling its 9-day EMA at $103.07 with RSI(14) at 38.9, but the $96.17 pivot and $117.04 (R1) cap upside. Both contracts remain anchored in backwardation—WTI’s Oct26-Jul27 spread sits at -10.8%, Brent’s at -14.6%—refining tight prompt supply despite bearish sentiment.
Geopolitical tensions simmer as Iranian IRGC forces escalate tanker interceptions in the Strait of Hormuz, threatening 20M bbl/d flows. VLCCs continue rerouting via the Cape of Good Hope due to Houthi attacks in Bab-el-Mandeb, adding seven days to voyages. These disruptions counterbalance bearish EIA data showing a ninth consecutive weekly crude inventory build (+0.9 mb to 427.3 mb), with Cushing stocks edging up to 24.3 mb. US production holds steady at 13.95 mb/d, but refinery runs at 92.5% signal robust demand ahead of winter.

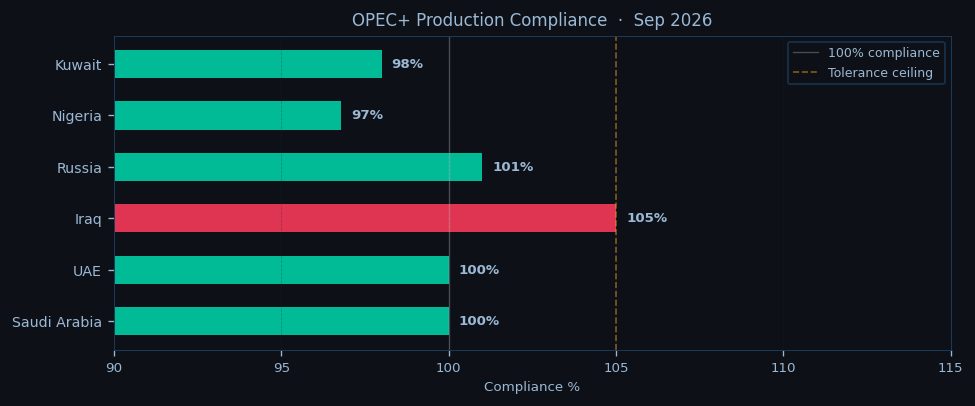
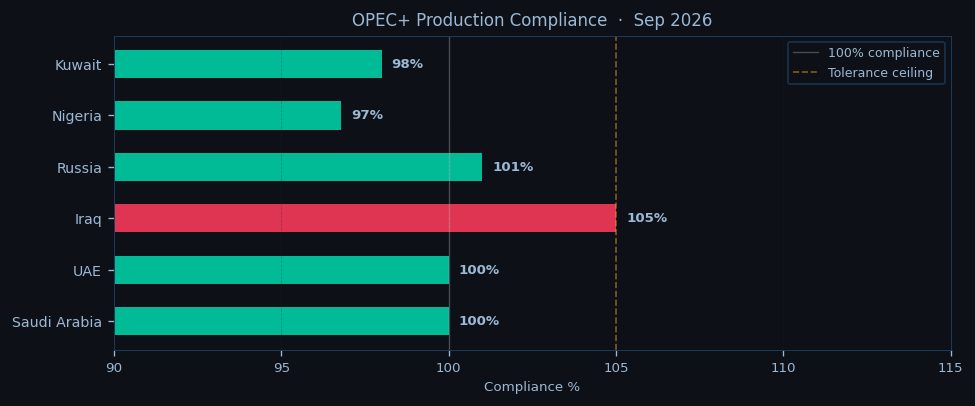
OPEC+ discipline remains a critical floor, with the group maintaining cuts through December 2026. The 0.6 mb/d deficit between OPEC’s 26.8 mb/d output and the 27.4 mb/d call underscores structural tightness, though Iraq and Russia’s overproduction chips at cohesion. Saudi Arabia’s 100% compliance lends credibility, but the market now eyes whether the alliance will deepen cuts if Brent sustains below $105.
The session’s focus shifts to the NYMEX open at 14:30 CET, with traders watching whether WTI can defend $90 amid mounting speculative shorts. Brent’s ability to hold above $102.40 (overnight low) is key for European buyers grappling with the wider Brent-WTI spread. Refiners weigh steep backwardation against still-elevated absolute prices, with prompt Brent barrels at $101.80 commanding a $14.91 premium to Jul27. Any further widening of the spread above $12.50 could trigger fresh hedging activity.
Downside risks loom if WTI breaches $89.46 (PP), targeting $72.17 (S1), though oversold conditions may invite dip-buying. Brent’s $96.17 pivot remains a critical support; a break opens $82.16 (S1). Upside requires a close above $108.15 for WTI or $117.04 for Brent to reset bearish momentum. For now, the market treads cautiously, balancing geopolitical premiums against technical exhaustion and inventory builds. The EIA’s next report—due tomorrow—could inject volatility if it signals weakening demand or further stockpile gains.

Disclaimer
The content on MarketsFN.com is provided for educational and informational purposes only. It does not constitute financial advice, investment recommendations, or trading guidance. All investments involve risks, and past performance does not guarantee future results. You are solely responsible for your investment decisions and should conduct independent research and consult a qualified financial advisor before acting. MarketsFN.com and its authors are not liable for any losses or damages arising from your use of this information.
Related Articles
- US Session Crude Oil Report — 16 Oct 2026 — WTI crude is trading at $90.86 in the NYMEX session, down 0.27% on the day as it struggles to hold above the…
- European Session Crude Oil Report — 16 Oct 2026 — **European Session Crude Oil Report — 05 Oct 2026 11:00 NY** WTI hovers near $90.86, testing the lower bounds of its…
- US Session Crude Oil Report — 15 Oct 2026 — WTI crude is trading at $90.86 in early New York session action, holding just above the pivotal $89.46 support as Brent…
- European Session Crude Oil Report — 15 Oct 2026 — **European Session Crude Oil Report – 05 Oct 2026 (11:00 NY)** Crude markets hold steady in early European trade with…
- Asian Session Crude Oil Report — 15 Oct 2026 — WTI crude is trading at $90.86 in early Asian hours, holding near overnight lows as the contract extends its seven-day…