Nasdaq 100 2026 YTD Highs & Lows Radar: AMGEN (AMGN), Applovin (APP) and more
MarketsFN Team

Nasdaq 100 2026 YTD Highs & Lows Radar: AMGEN (AMGN), Applovin (APP) and more
Screening all 101 Nasdaq 100 constituents for stocks nearest to their 2026 year-to-date high and their 2026 YTD low. Data as of August 25, 2026. % Realized = total return since Jan 1 2026.
Legend: RSI > 70 = overbought · RSI < 30 = oversold · Green % Realized = positive YTD return · Red = negative.
📈 Nearest to 2026 High
Sectors represented: Technology (2), Healthcare (1), Consumer Cyclical (1), Communication Services (1)
| Ticker | Company | Sector | Price Last | % Realized | 2026 YTD High Date | RSI | % above MA200 | Trend |
|---|---|---|---|---|---|---|---|---|
| AMGN | AMGEN Inc | Healthcare | $443.84 | +35.47% | 2026-08-24 | 74.4 | +25.3% | Above MA20, MA50, MA200 |
| ADP | Automatic Data Processing Inc | Technology | $283.01 | +11.91% | 2026-08-24 | 66.2 | +20.0% | Above MA20, MA50, MA200 |
| ABNB | Airbnb Inc | Consumer Cyclical | $190.21 | +43.00% | 2026-08-24 | 73.8 | +39.0% | Above MA20, MA50, MA200 |
| PAYX | Paychex Inc | Technology | $126.01 | +16.03% | 2026-08-24 | 65.1 | +21.8% | Above MA20, MA50, MA200 |
| EA | Electronic Arts, Inc | Communication Services | $209.70 | +0.38% | 2026-08-04 | — | — | — |
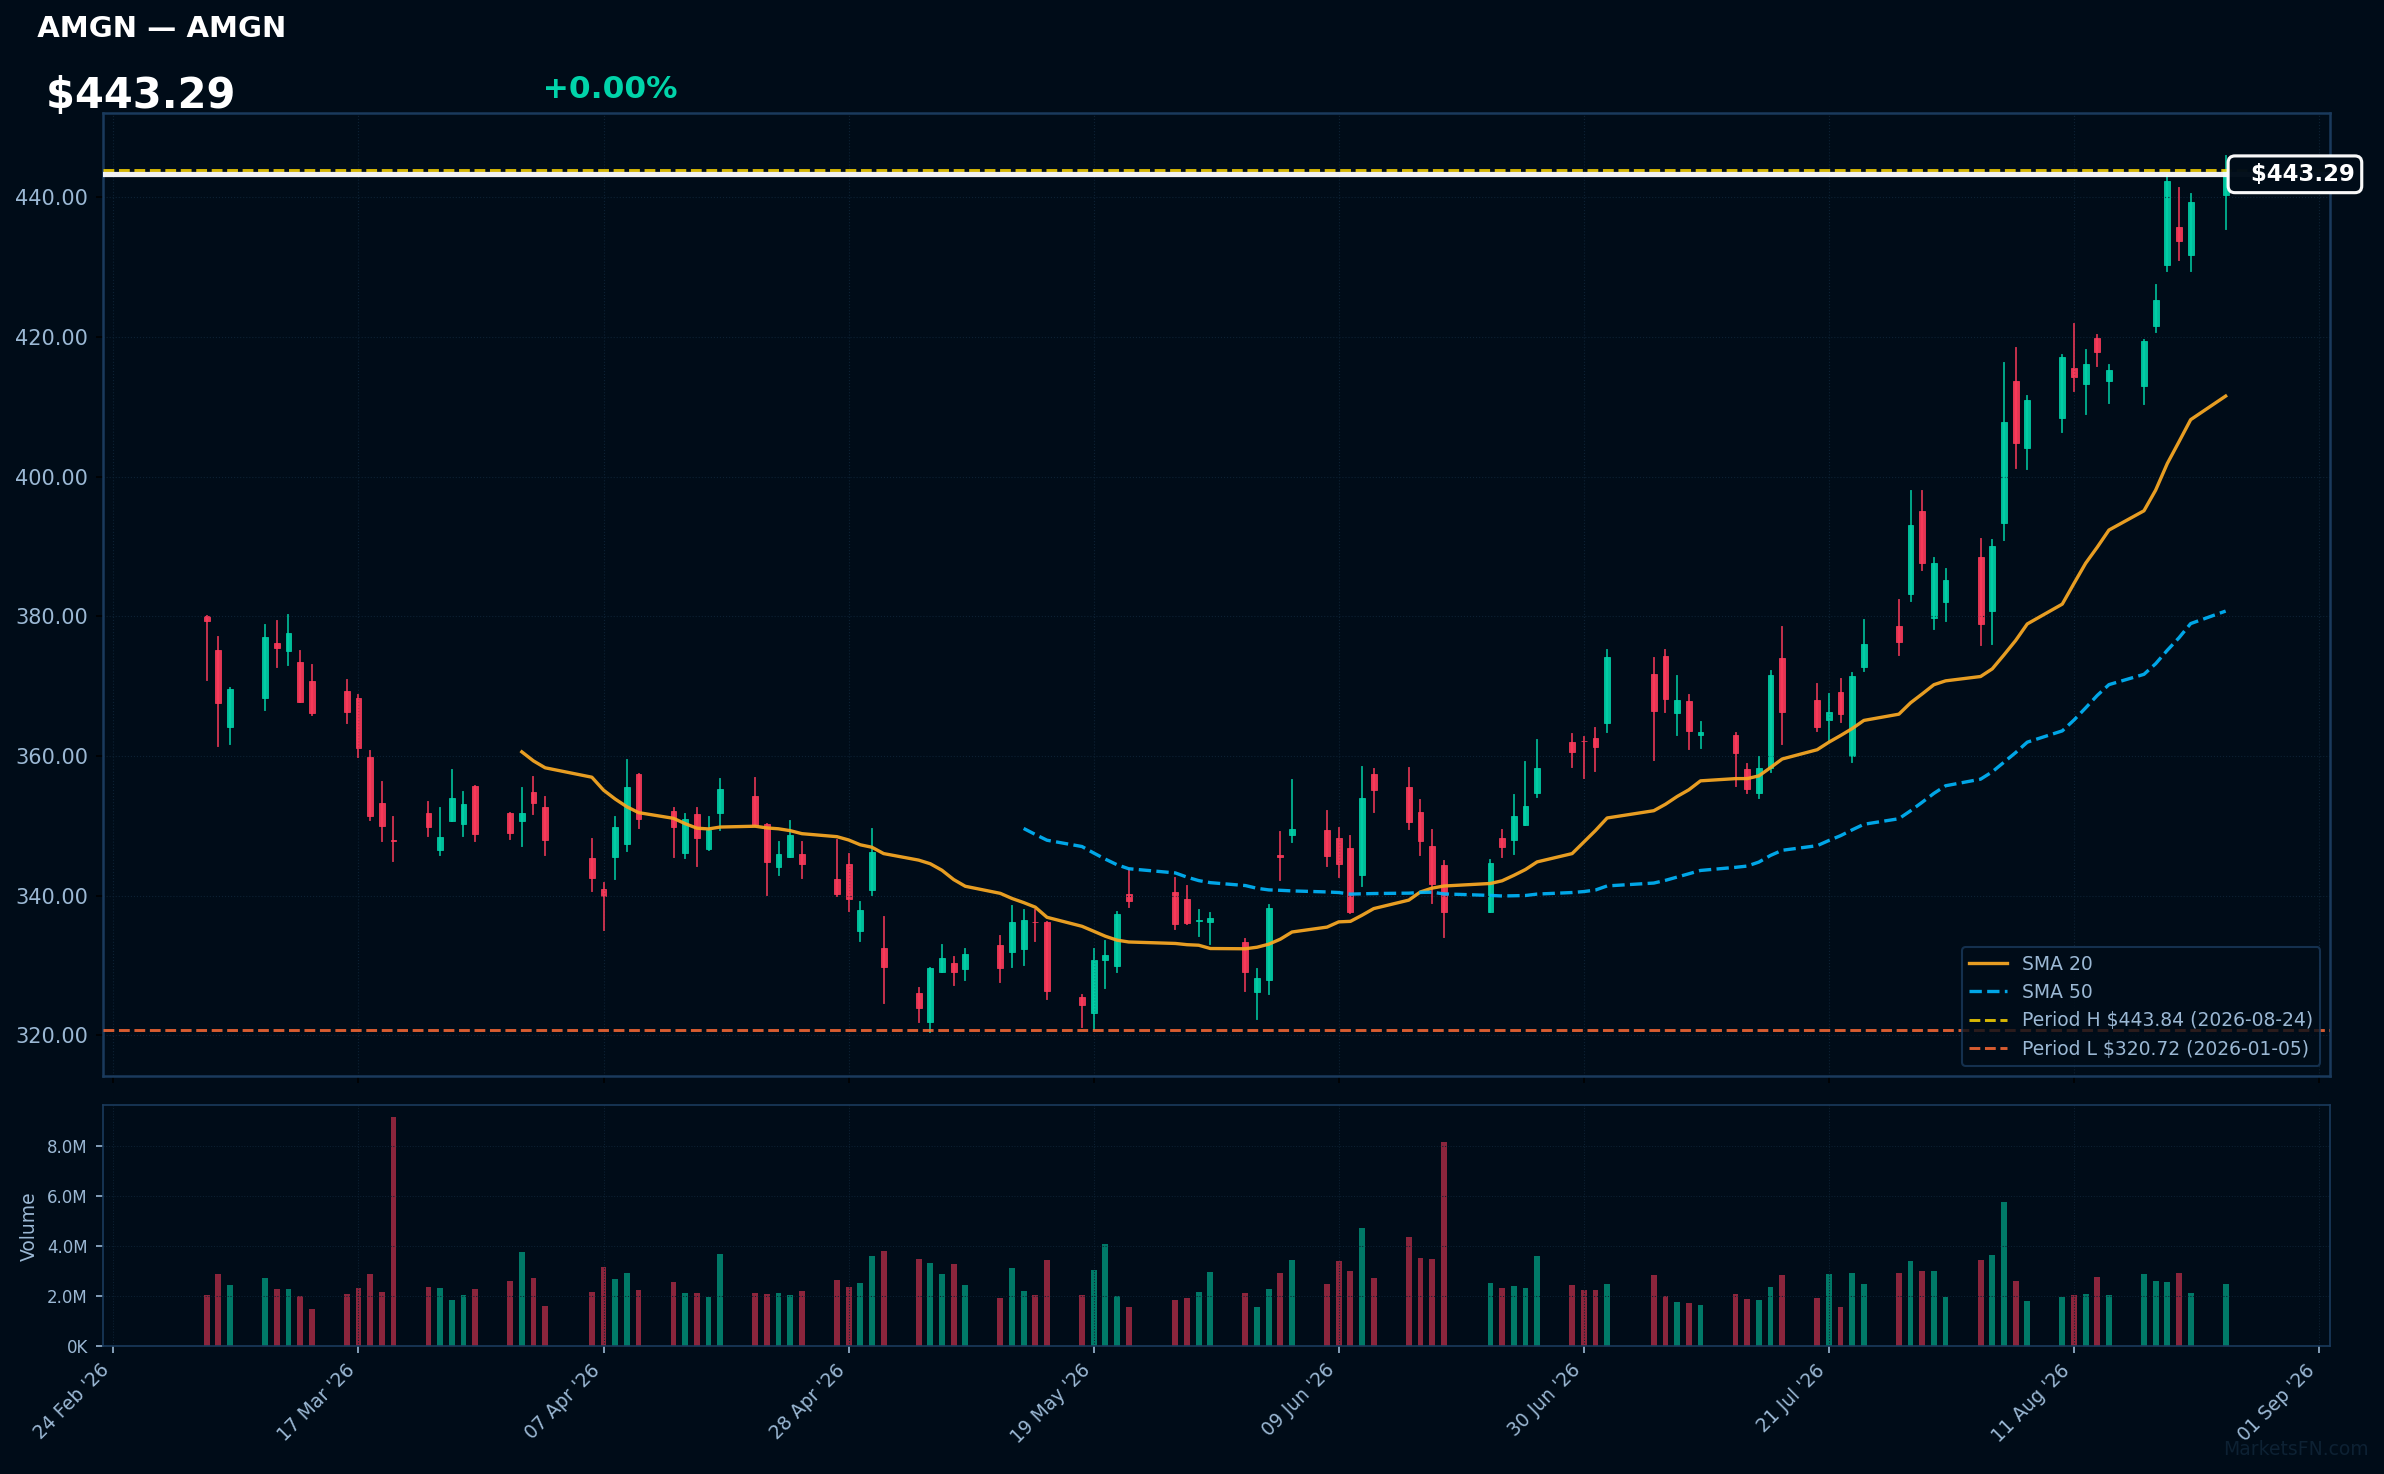
AMGN | AMGEN Inc | Healthcare | Price Last: $443.84 | % Realized: +35.47% | RSI: 74.4 | % above MA200: +25.3% | Trend: Above MA20, MA50, MA200
AMGEN Inc (AMGN) is a biotechnology company focused on developing innovative therapies for serious illnesses, particularly in oncology and inflammation. Investors should care due to its strong pipeline and market position, which can drive future growth and profitability.
AMGN shows bullish momentum with an RSI(14) of 74.4 and a strong MA alignment: price > MA20 > MA50 > MA200. The stock is 0.0% below its 2026 YTD high, indicating a potential breakout.
Related headlines
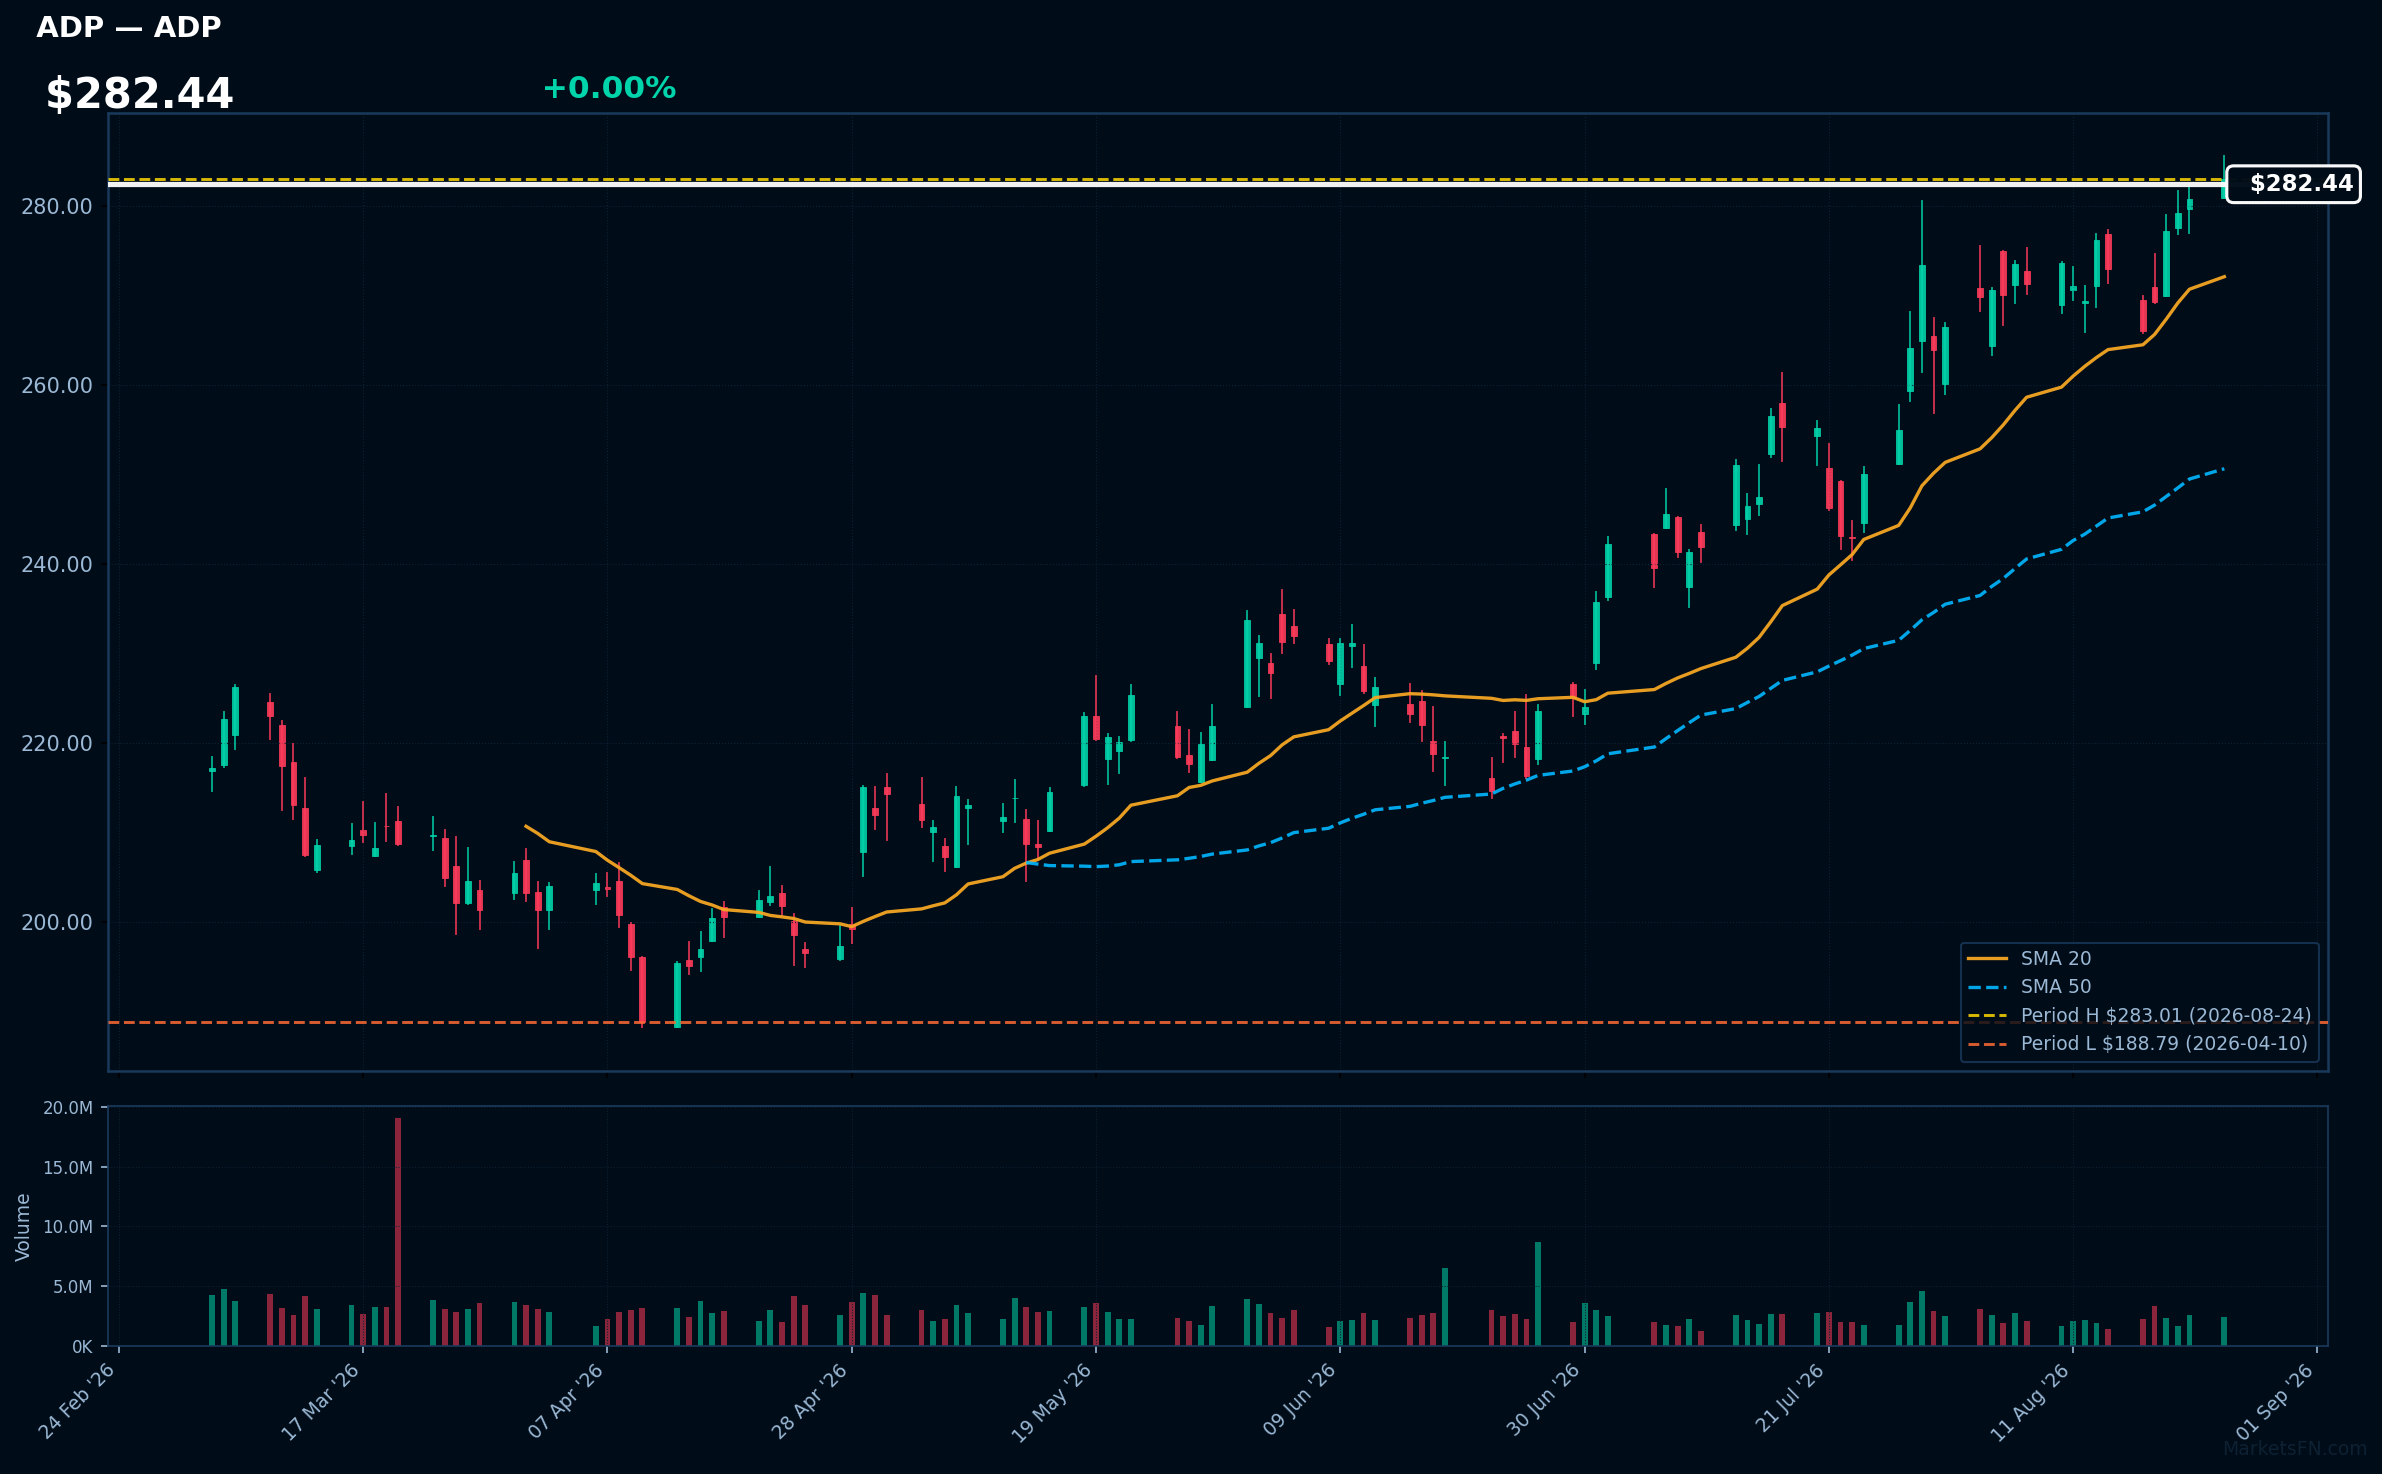
ADP | Automatic Data Processing Inc | Technology | Price Last: $283.01 | % Realized: +11.91% | RSI: 66.2 | % above MA200: +20.0% | Trend: Above MA20, MA50, MA200
Automatic Data Processing Inc (ADP) provides payroll and human capital management solutions, helping businesses streamline workforce management and compliance. Investors should care due to its strong market position and consistent demand for HR technology, which supports revenue stability and growth.
The current technical situation indicates bullish momentum, with an RSI(14) of 66.2 and a bullish MA alignment: price > MA20 > MA50 > MA200. The stock is also 0.0% below its 2026 YTD high, suggesting a potential breakout.
Related headlines
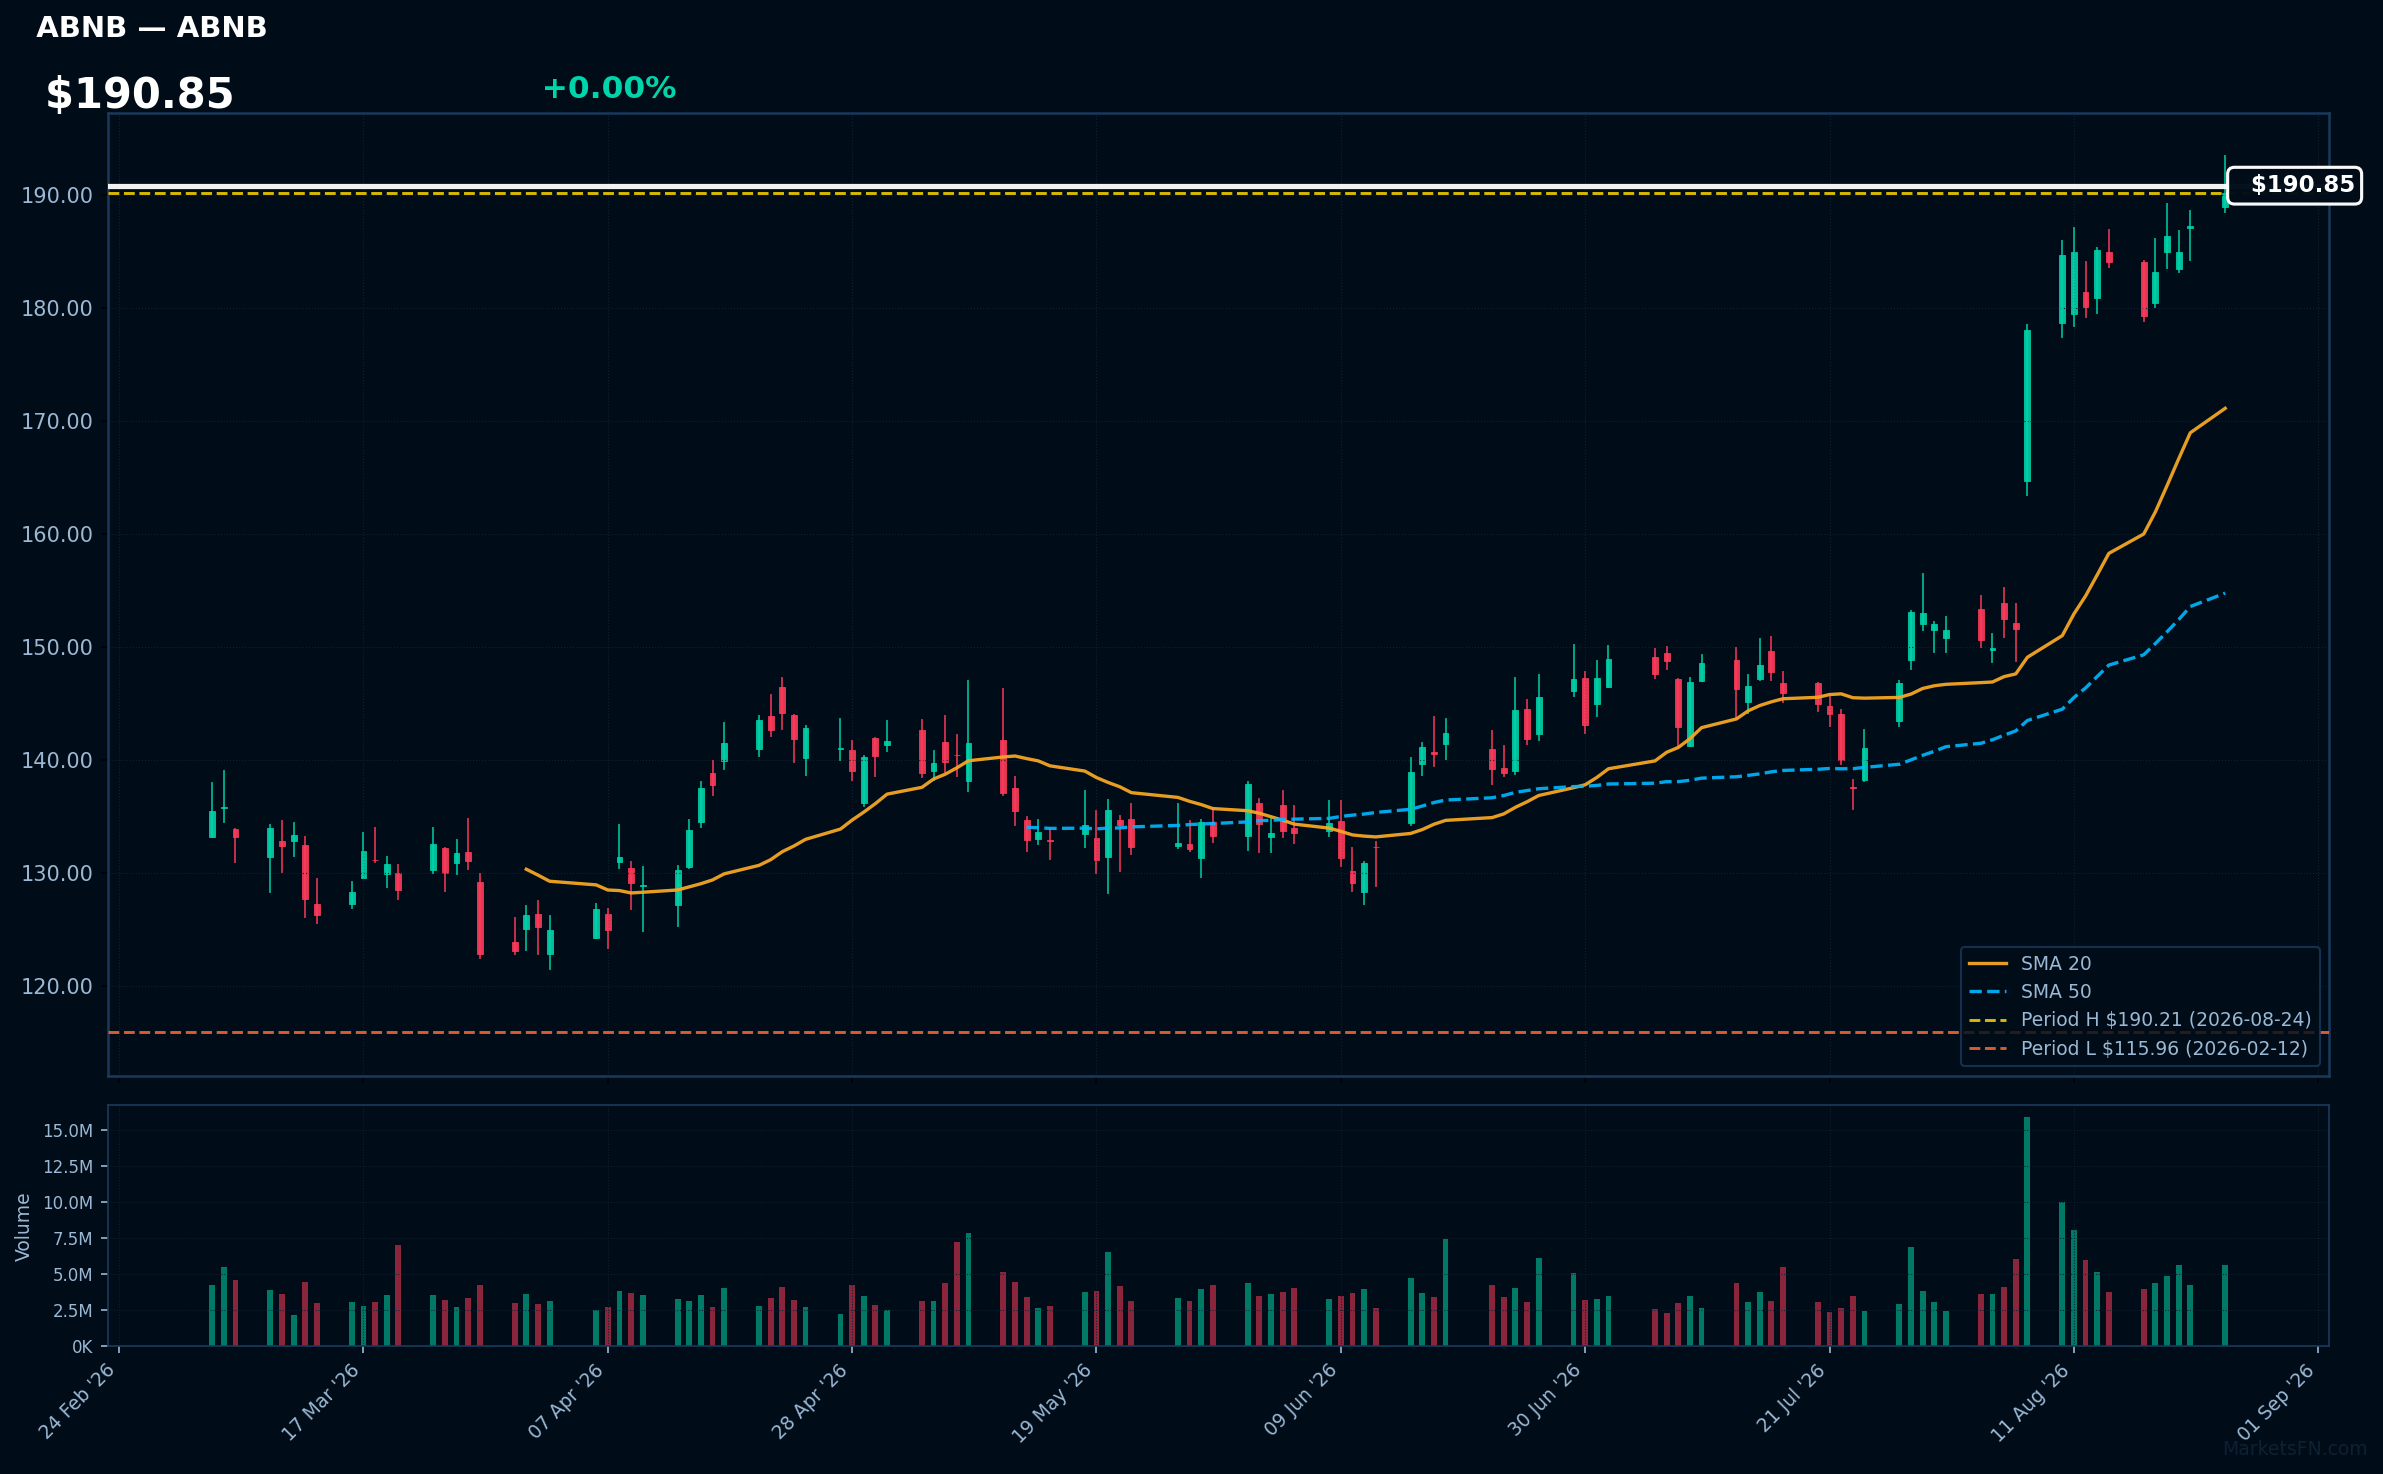
ABNB | Airbnb Inc | Consumer Cyclical | Price Last: $190.21 | % Realized: +43.00% | RSI: 73.8 | % above MA200: +39.0% | Trend: Above MA20, MA50, MA200
Airbnb Inc (ABNB) operates an online marketplace for lodging, primarily short-term rentals. Investors should care due to its innovative approach in the travel industry, capitalizing on the growing demand for unique accommodations and experiences, which can drive revenue growth and market share.
The current technical situation shows bullish momentum with an RSI(14) of 73.8 and a strong MA alignment: price > MA20 > MA50 > MA200. The stock is 0.0% below its 2026 YTD high, indicating potential for a breakout.
Related headlines
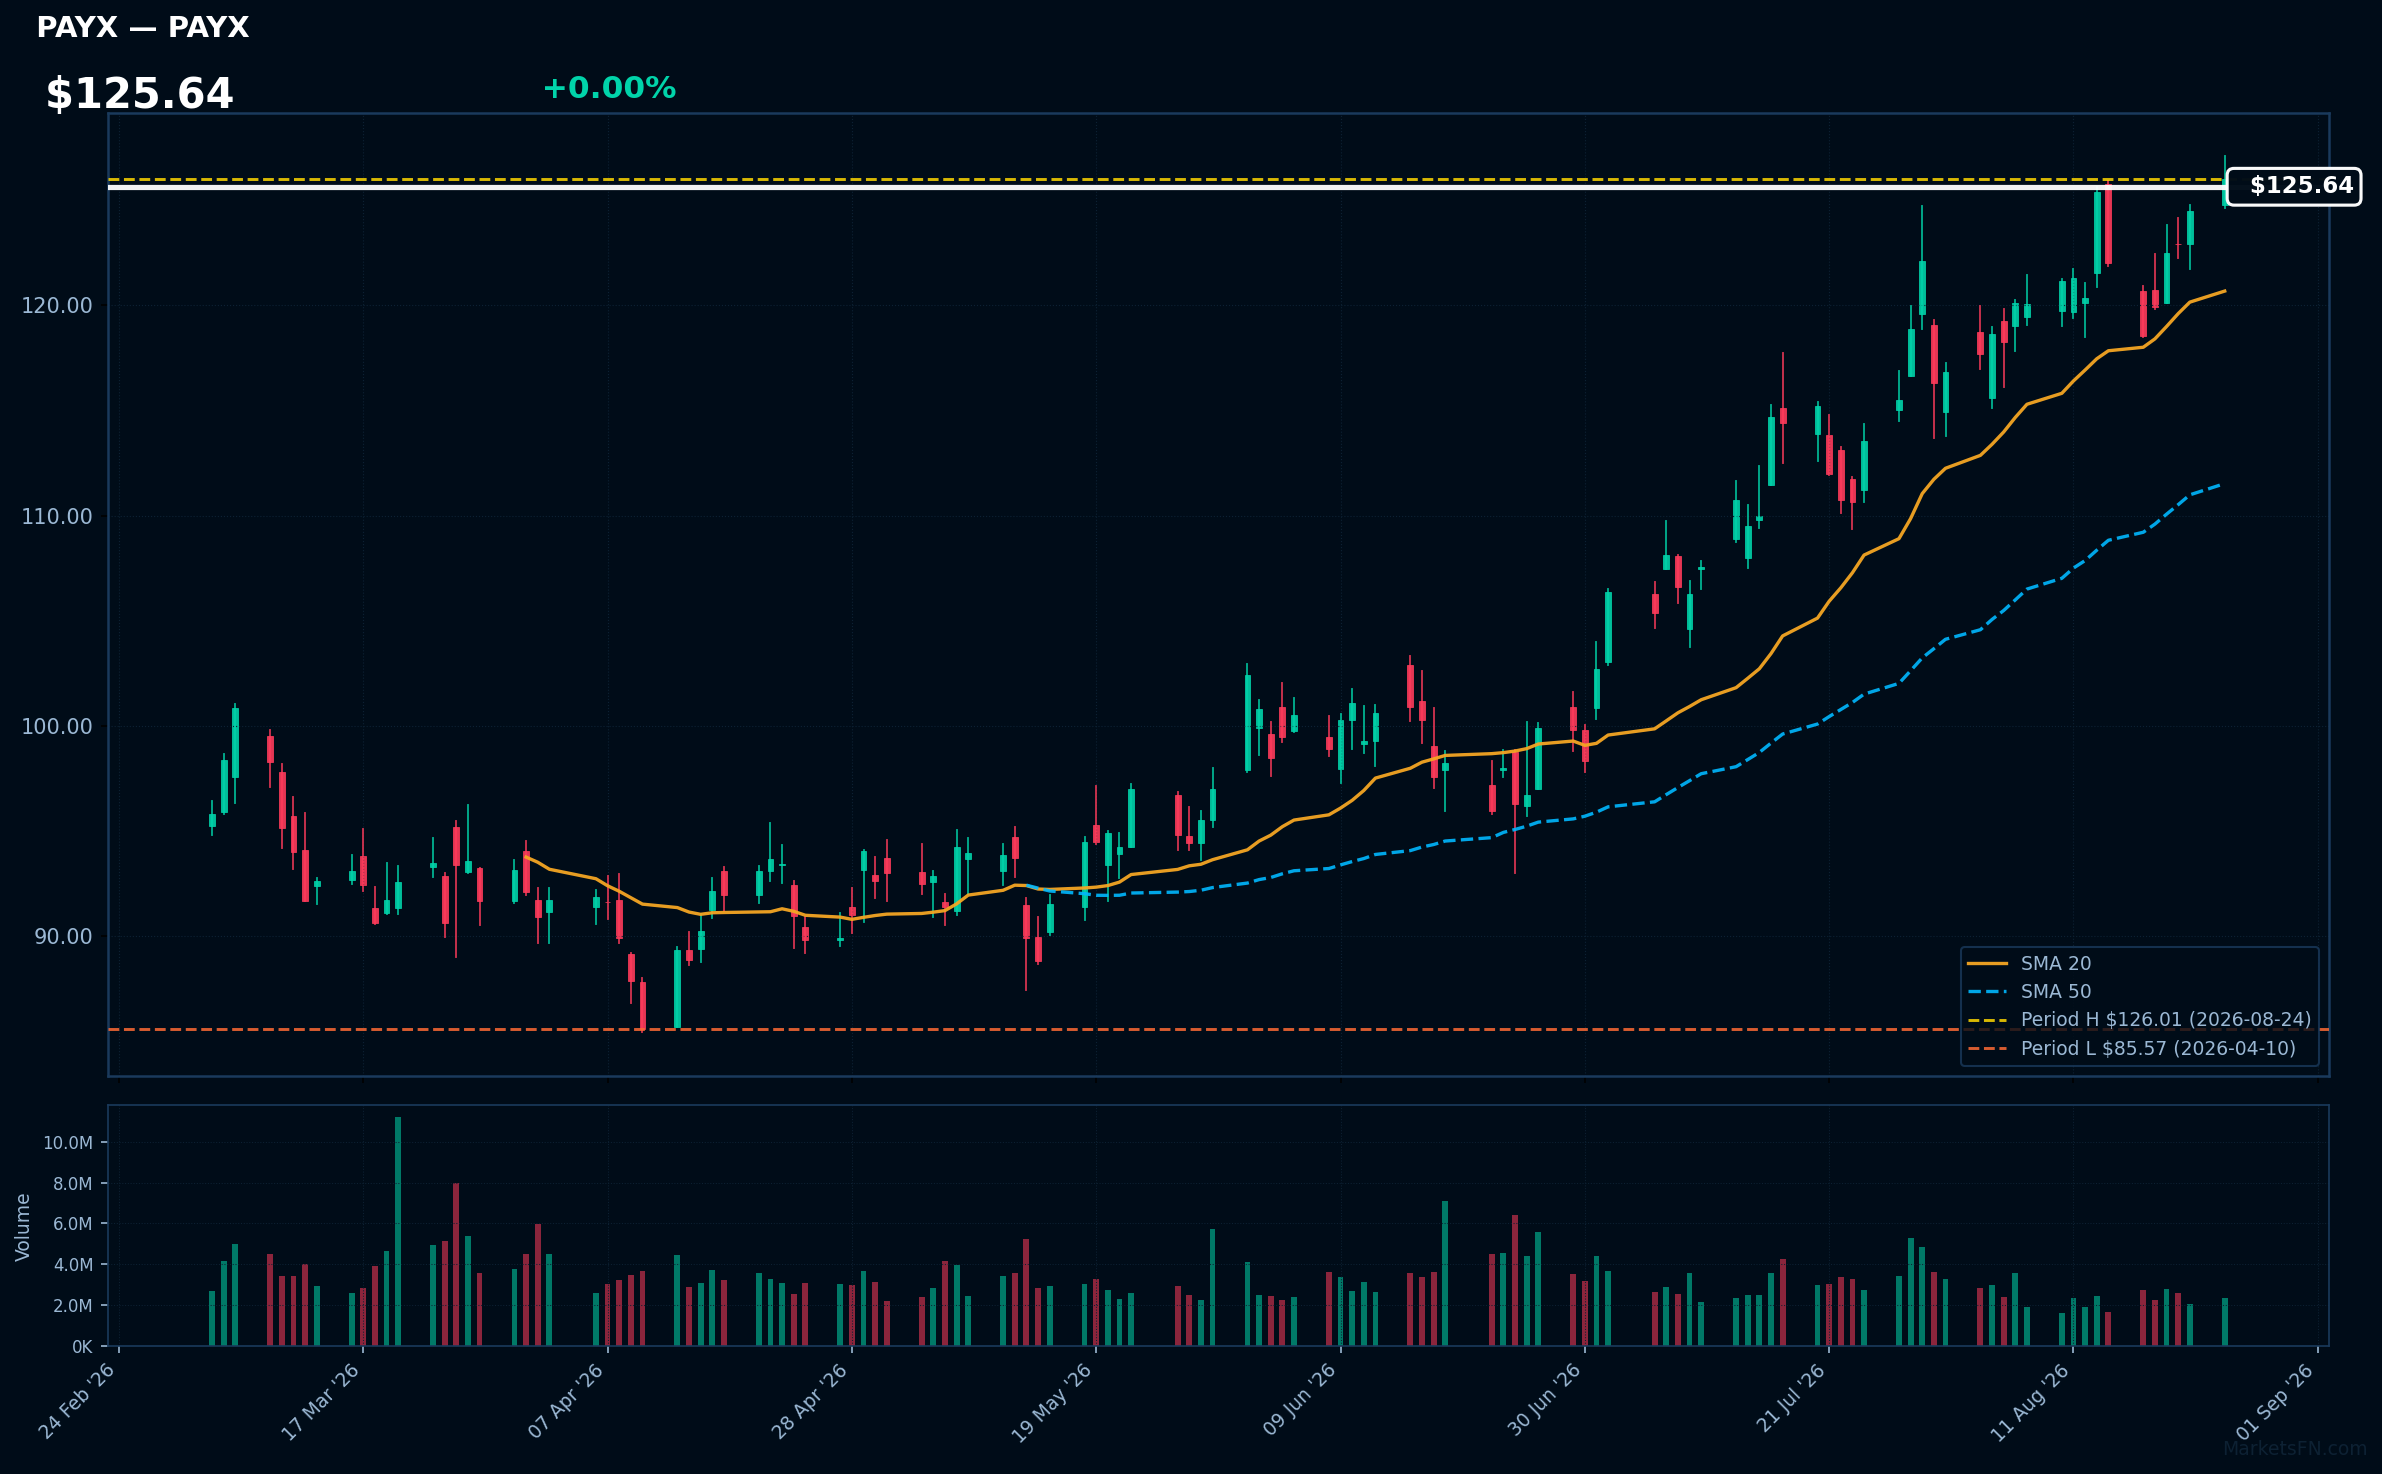
PAYX | Paychex Inc | Technology | Price Last: $126.01 | % Realized: +16.03% | RSI: 65.1 | % above MA200: +21.8% | Trend: Above MA20, MA50, MA200
Paychex Inc provides payroll, human resource, and benefits outsourcing solutions for small to medium-sized businesses. Investors should care due to its consistent revenue growth and strong market position, which are critical for navigating economic fluctuations.
The current technical situation shows bullish momentum with an RSI(14) of 65.1 and a strong MA alignment: price > MA20 > MA50 > MA200. The stock is 0.0% below its 2026 YTD high, indicating a potential breakout.
Related headlines
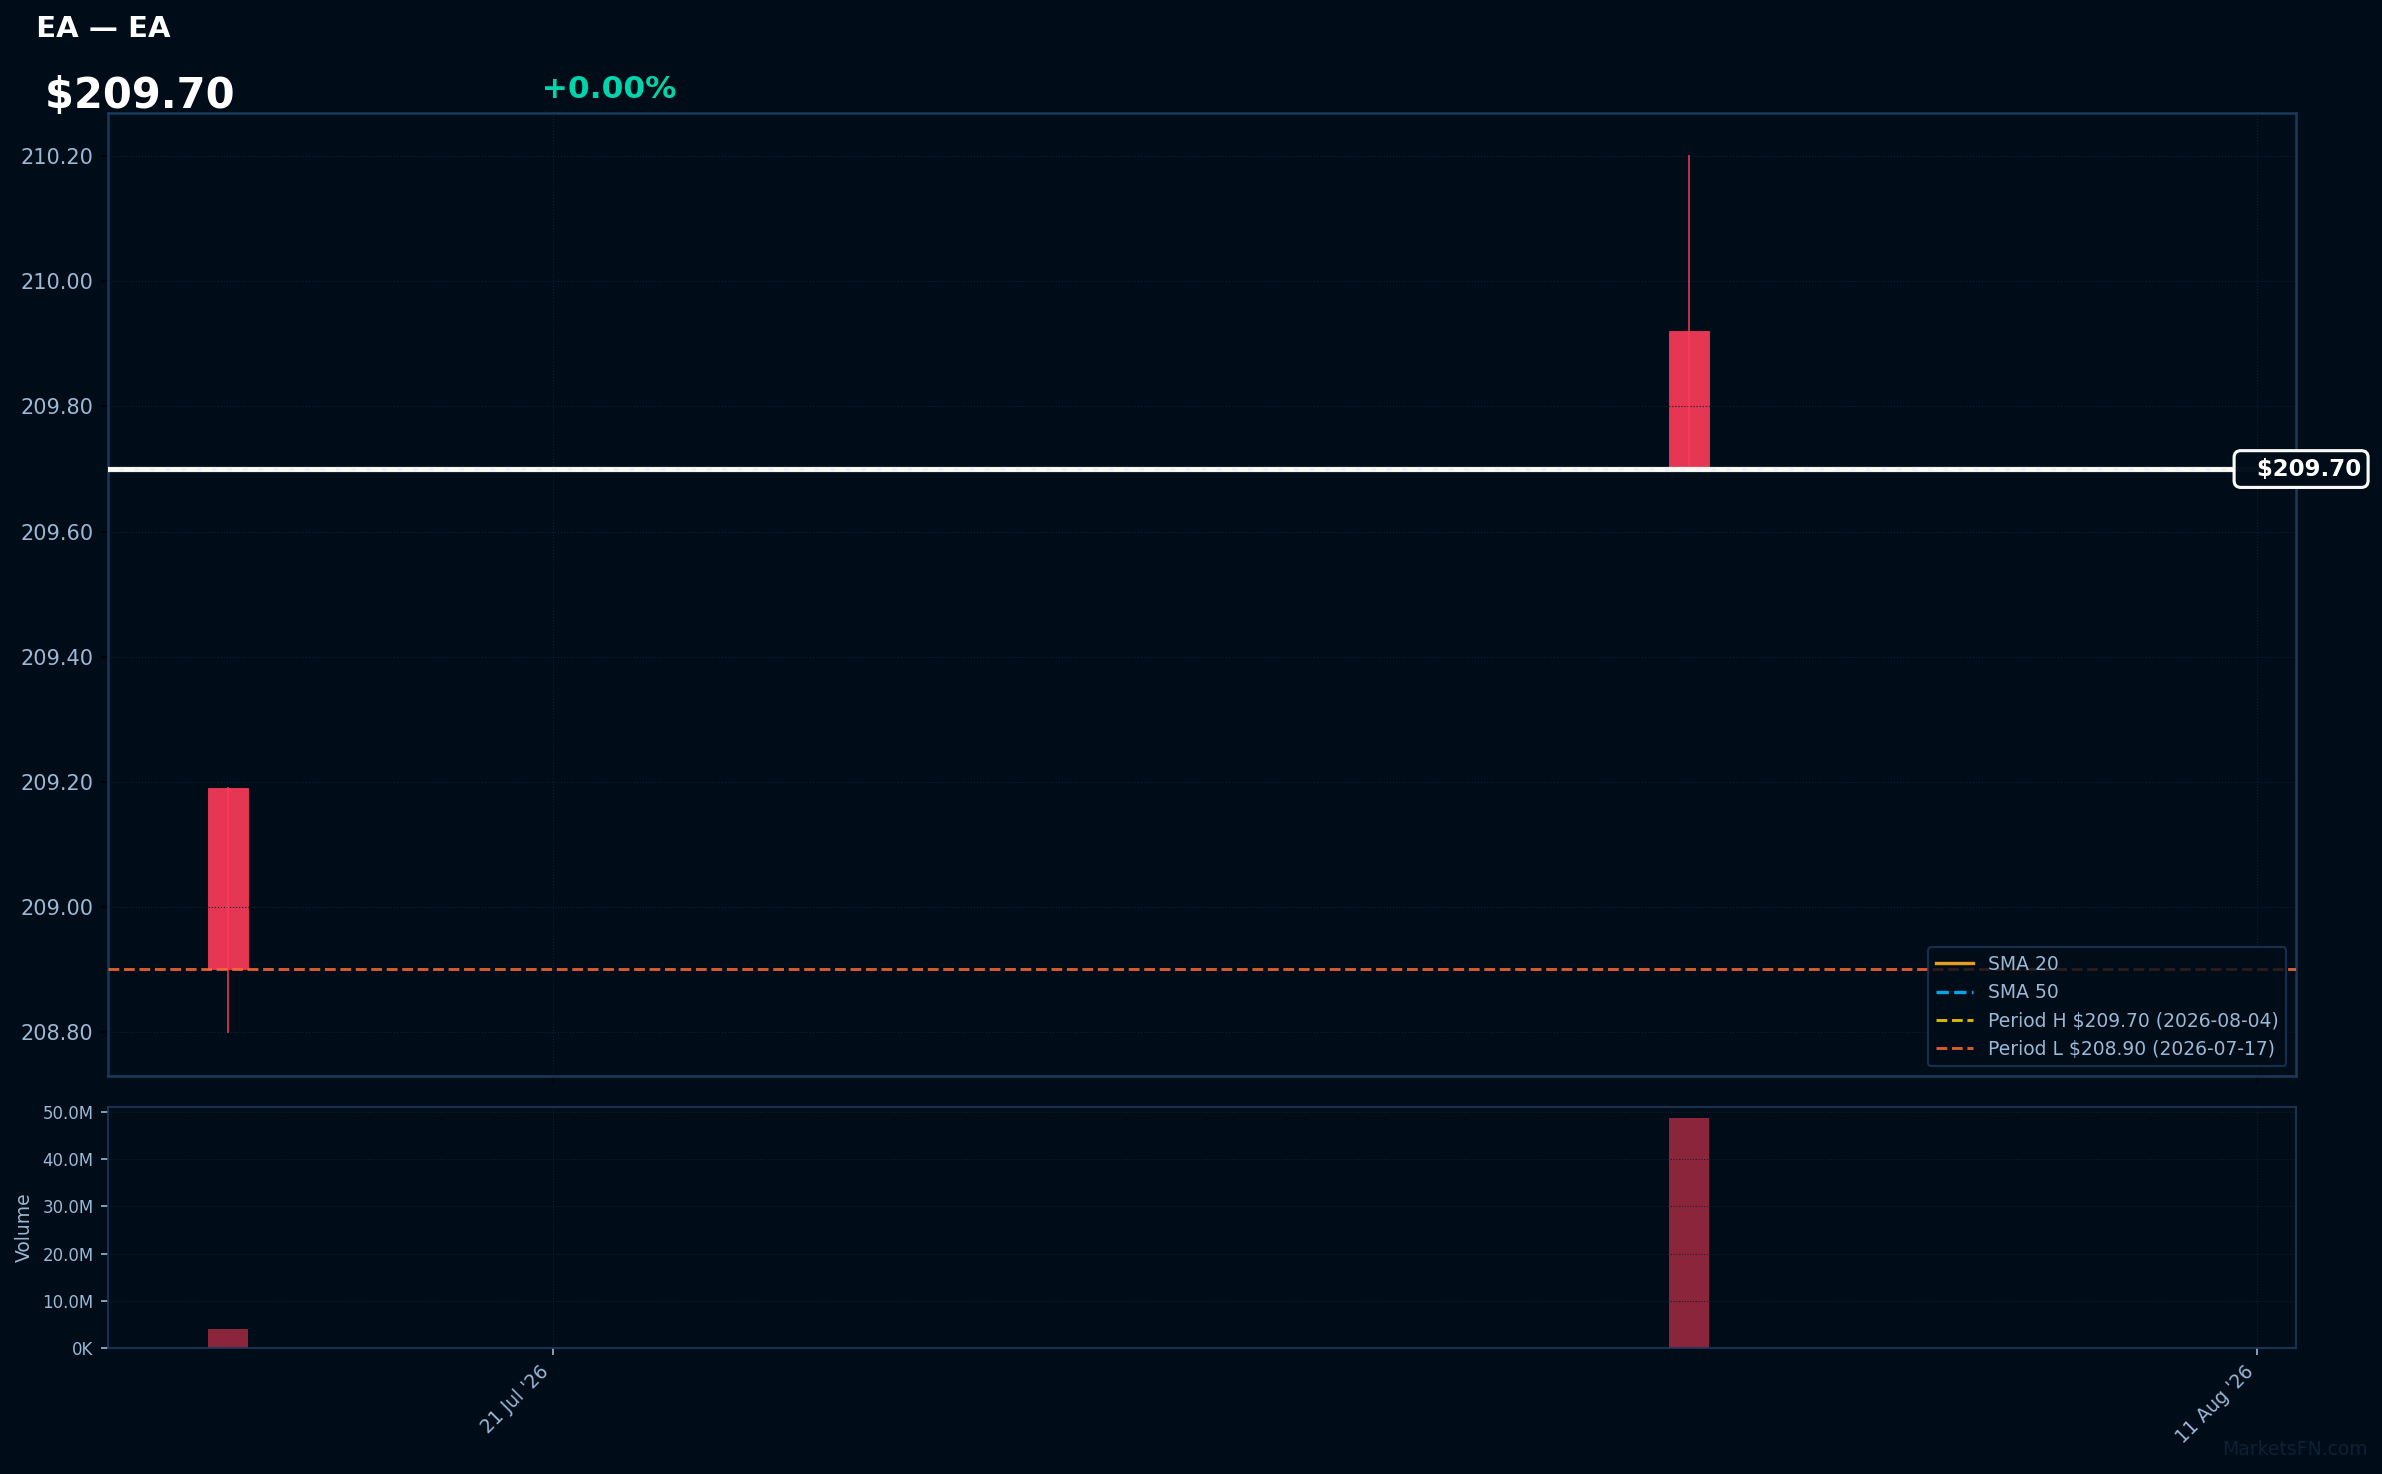
EA | Electronic Arts, Inc | Communication Services | Price Last: $209.70 | % Realized: +0.38% | RSI: — | % above MA200: — | Trend: —
Electronic Arts, Inc. develops and publishes interactive entertainment software, known for franchises like FIFA and The Sims. Investors should care due to its strong market position and potential for growth in the gaming industry, especially with increasing digital sales and engagement.
The stock is 0.0% below its 2026 YTD high, indicating a potential breakout level. However, RSI(14) data is N/A and MA data is incomplete, limiting technical analysis.
📉 Nearest to 2026 Low
Sectors represented: Communication Services (3), Utilities (1), Industrials (1)
| Ticker | Company | Sector | Price Last | % Realized | 2026 YTD Low Date | RSI | % above MA200 | Trend |
|---|---|---|---|---|---|---|---|---|
| APP | Applovin Corp | Communication Services | $298.59 | -51.71% | 2026-08-24 | 30.9 | -39.9% | Below MA20, MA50, MA200 |
| EA | Electronic Arts, Inc | Communication Services | $209.70 | +0.38% | 2026-07-17 | — | — | — |
| TTD | Trade Desk Inc | Communication Services | $13.27 | -64.78% | 2026-08-21 | 32.7 | -49.4% | Below MA20, MA50, MA200 |
| EXC | Exelon Corp | Utilities | $44.34 | +0.96% | 2026-01-12 | 37.1 | -3.6% | Below MA20, MA50, MA200 |
| HON | Honeywell International Inc | Industrials | $214.77 | +4.55% | 2026-01-02 | 32.2 | -6.4% | Below MA20, MA50, MA200 |
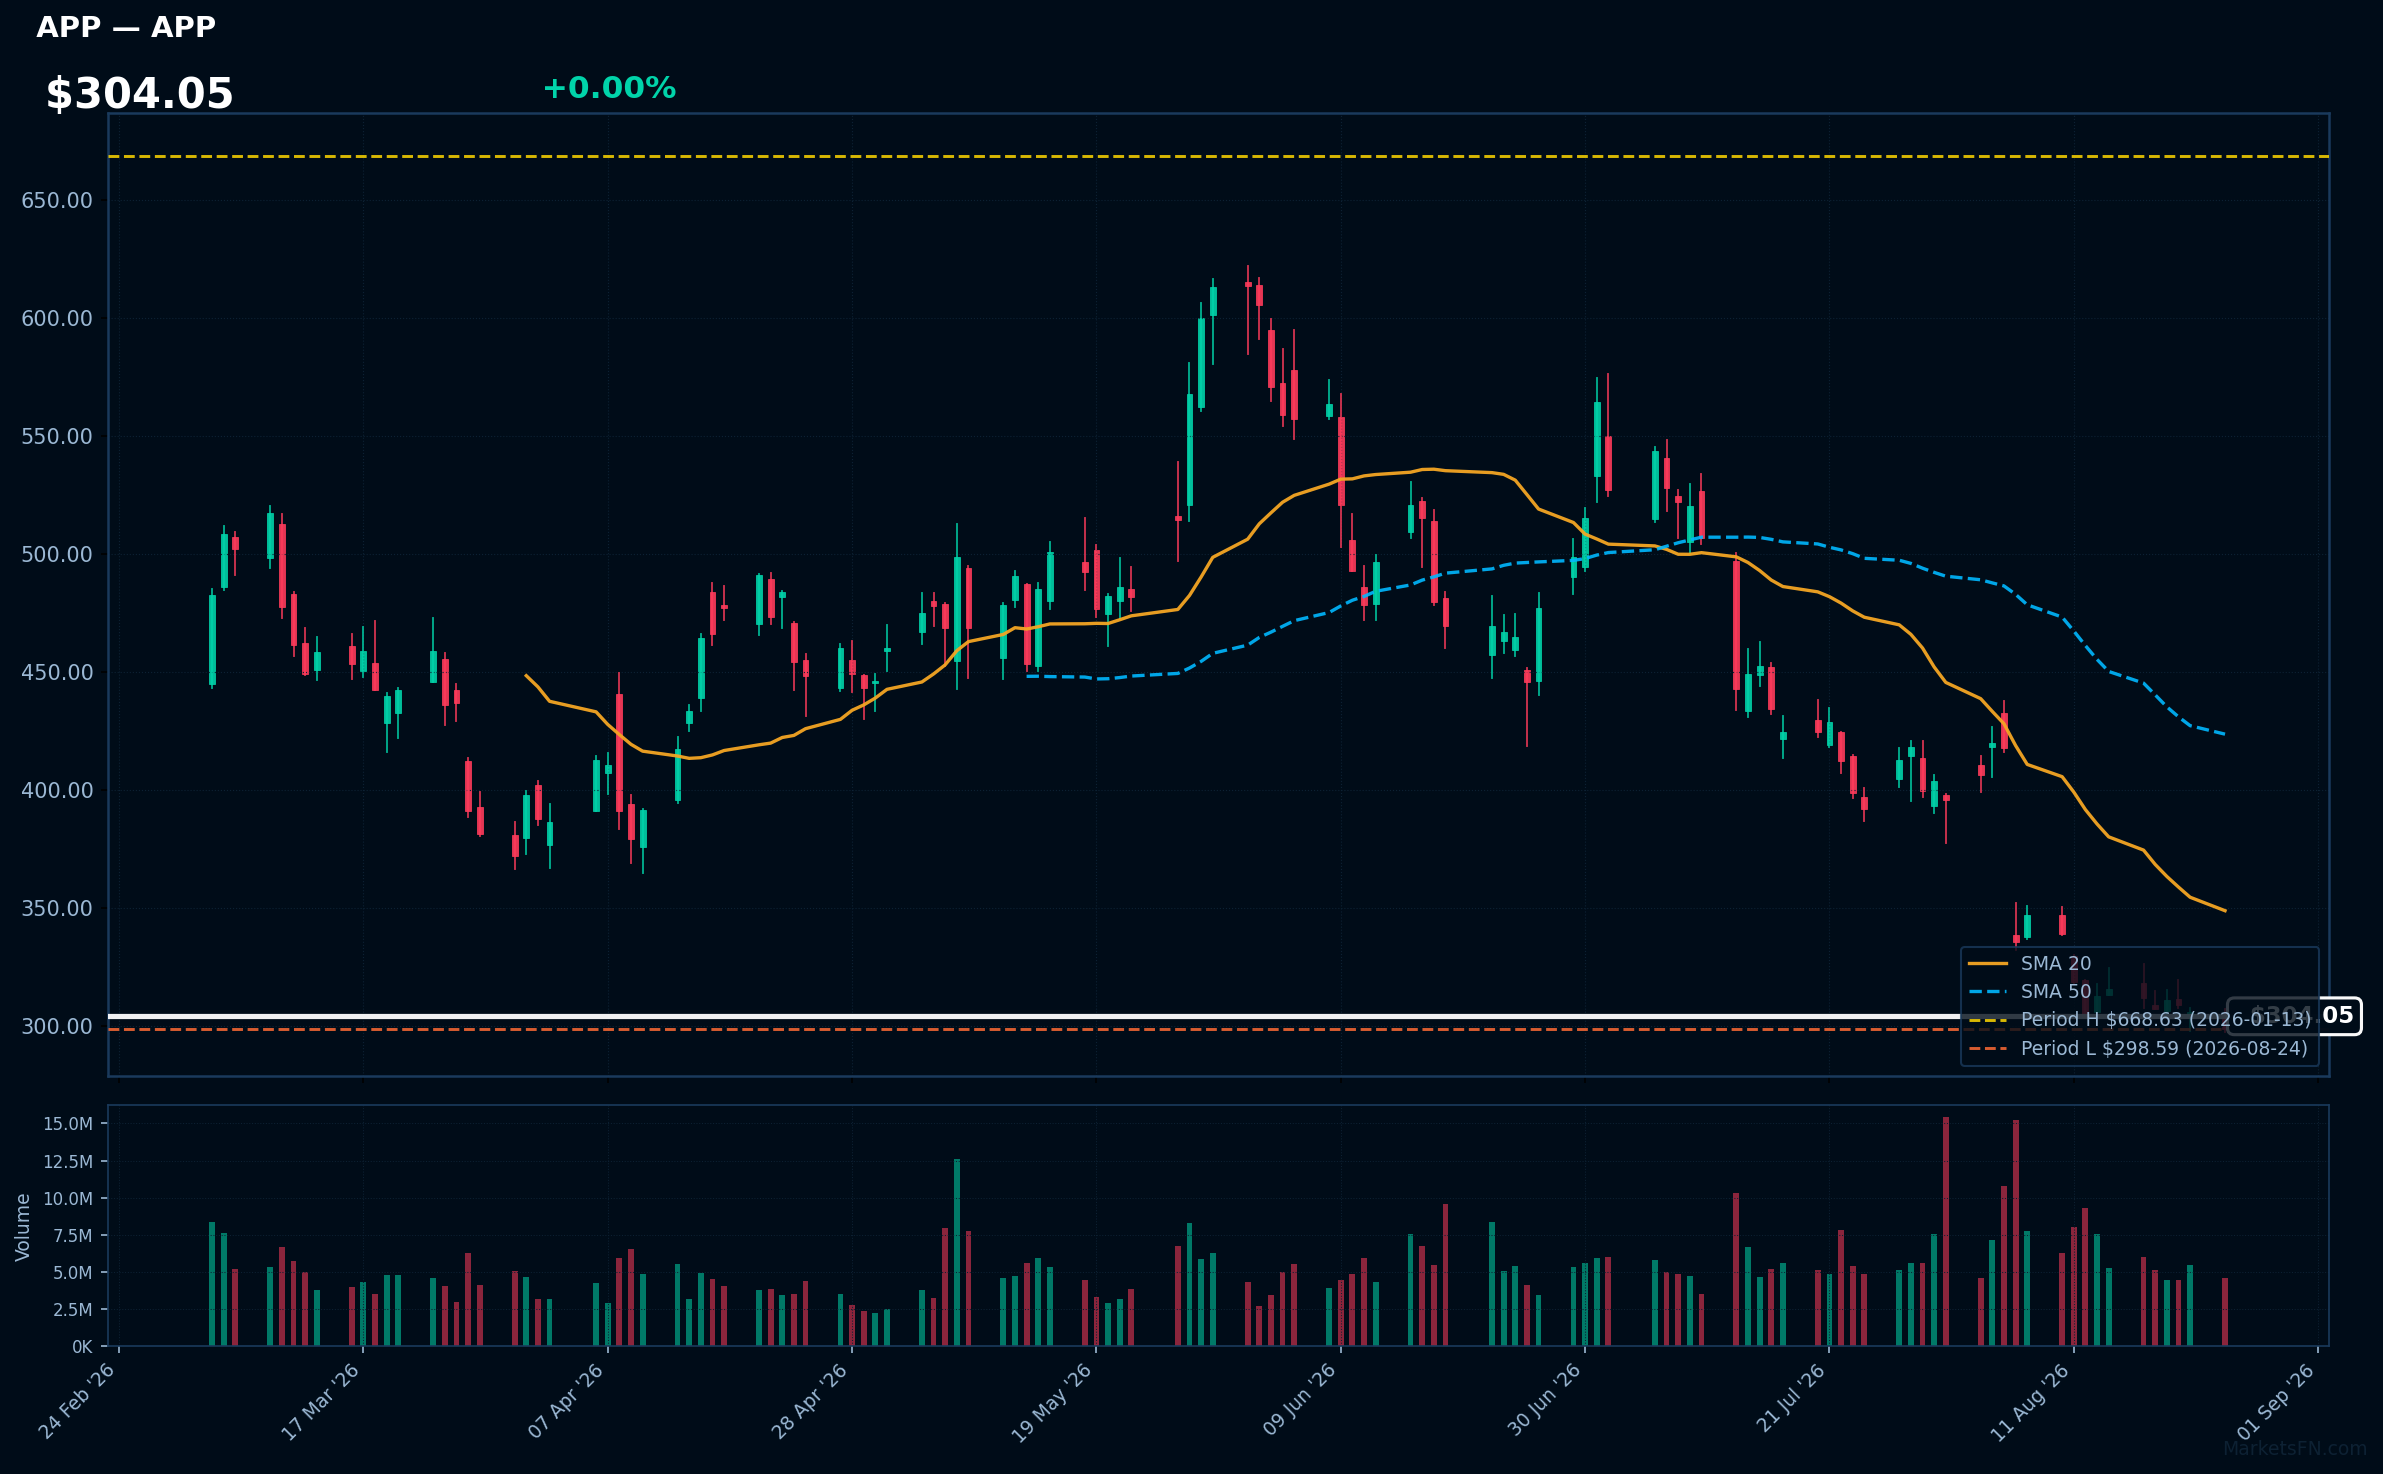
APP | Applovin Corp | Communication Services | Price Last: $298.59 | % Realized: -51.71% | RSI: 30.9 | % above MA200: -39.9% | Trend: Below MA20, MA50, MA200
Applovin Corp (APP) specializes in mobile app marketing and monetization solutions, helping developers maximize revenue through targeted advertising and analytics. Investors should care due to its significant market presence and potential for growth in the expanding mobile app ecosystem.
The current technical situation indicates a bearish trend, with an RSI(14) of 30.9 and a MA alignment of price < MA20 < MA50 < MA200, suggesting a sustained downtrend and testing major support.
Related headlines
- Why Did APP, ARRY, NFE Stocks Slump To 52-Week Lows Today?
- Why Did APP, CMS, MVIS Stocks Plunge To 52-Week Lows Last Week?
- APP Stock Dips Below $300 For First Time In Over A Year Analyst Cuts Target By $60, But Believes Business Remains High Quality
- AppLovin sentiment turns negative as bull case grows harder to find, Jefferies says
EA | Electronic Arts, Inc | Communication Services | Price Last: $209.70 | % Realized: +0.38% | RSI: — | % above MA200: — | Trend: —
Electronic Arts, Inc. develops and publishes interactive entertainment software, known for franchises like FIFA and The Sims. Investors should care due to its strong market position and potential for growth in the gaming industry, especially with increasing digital sales and engagement.
The stock is 0.0% below its 2026 YTD high, indicating a potential breakout level. However, RSI(14) data is N/A and MA data is incomplete, limiting technical analysis.
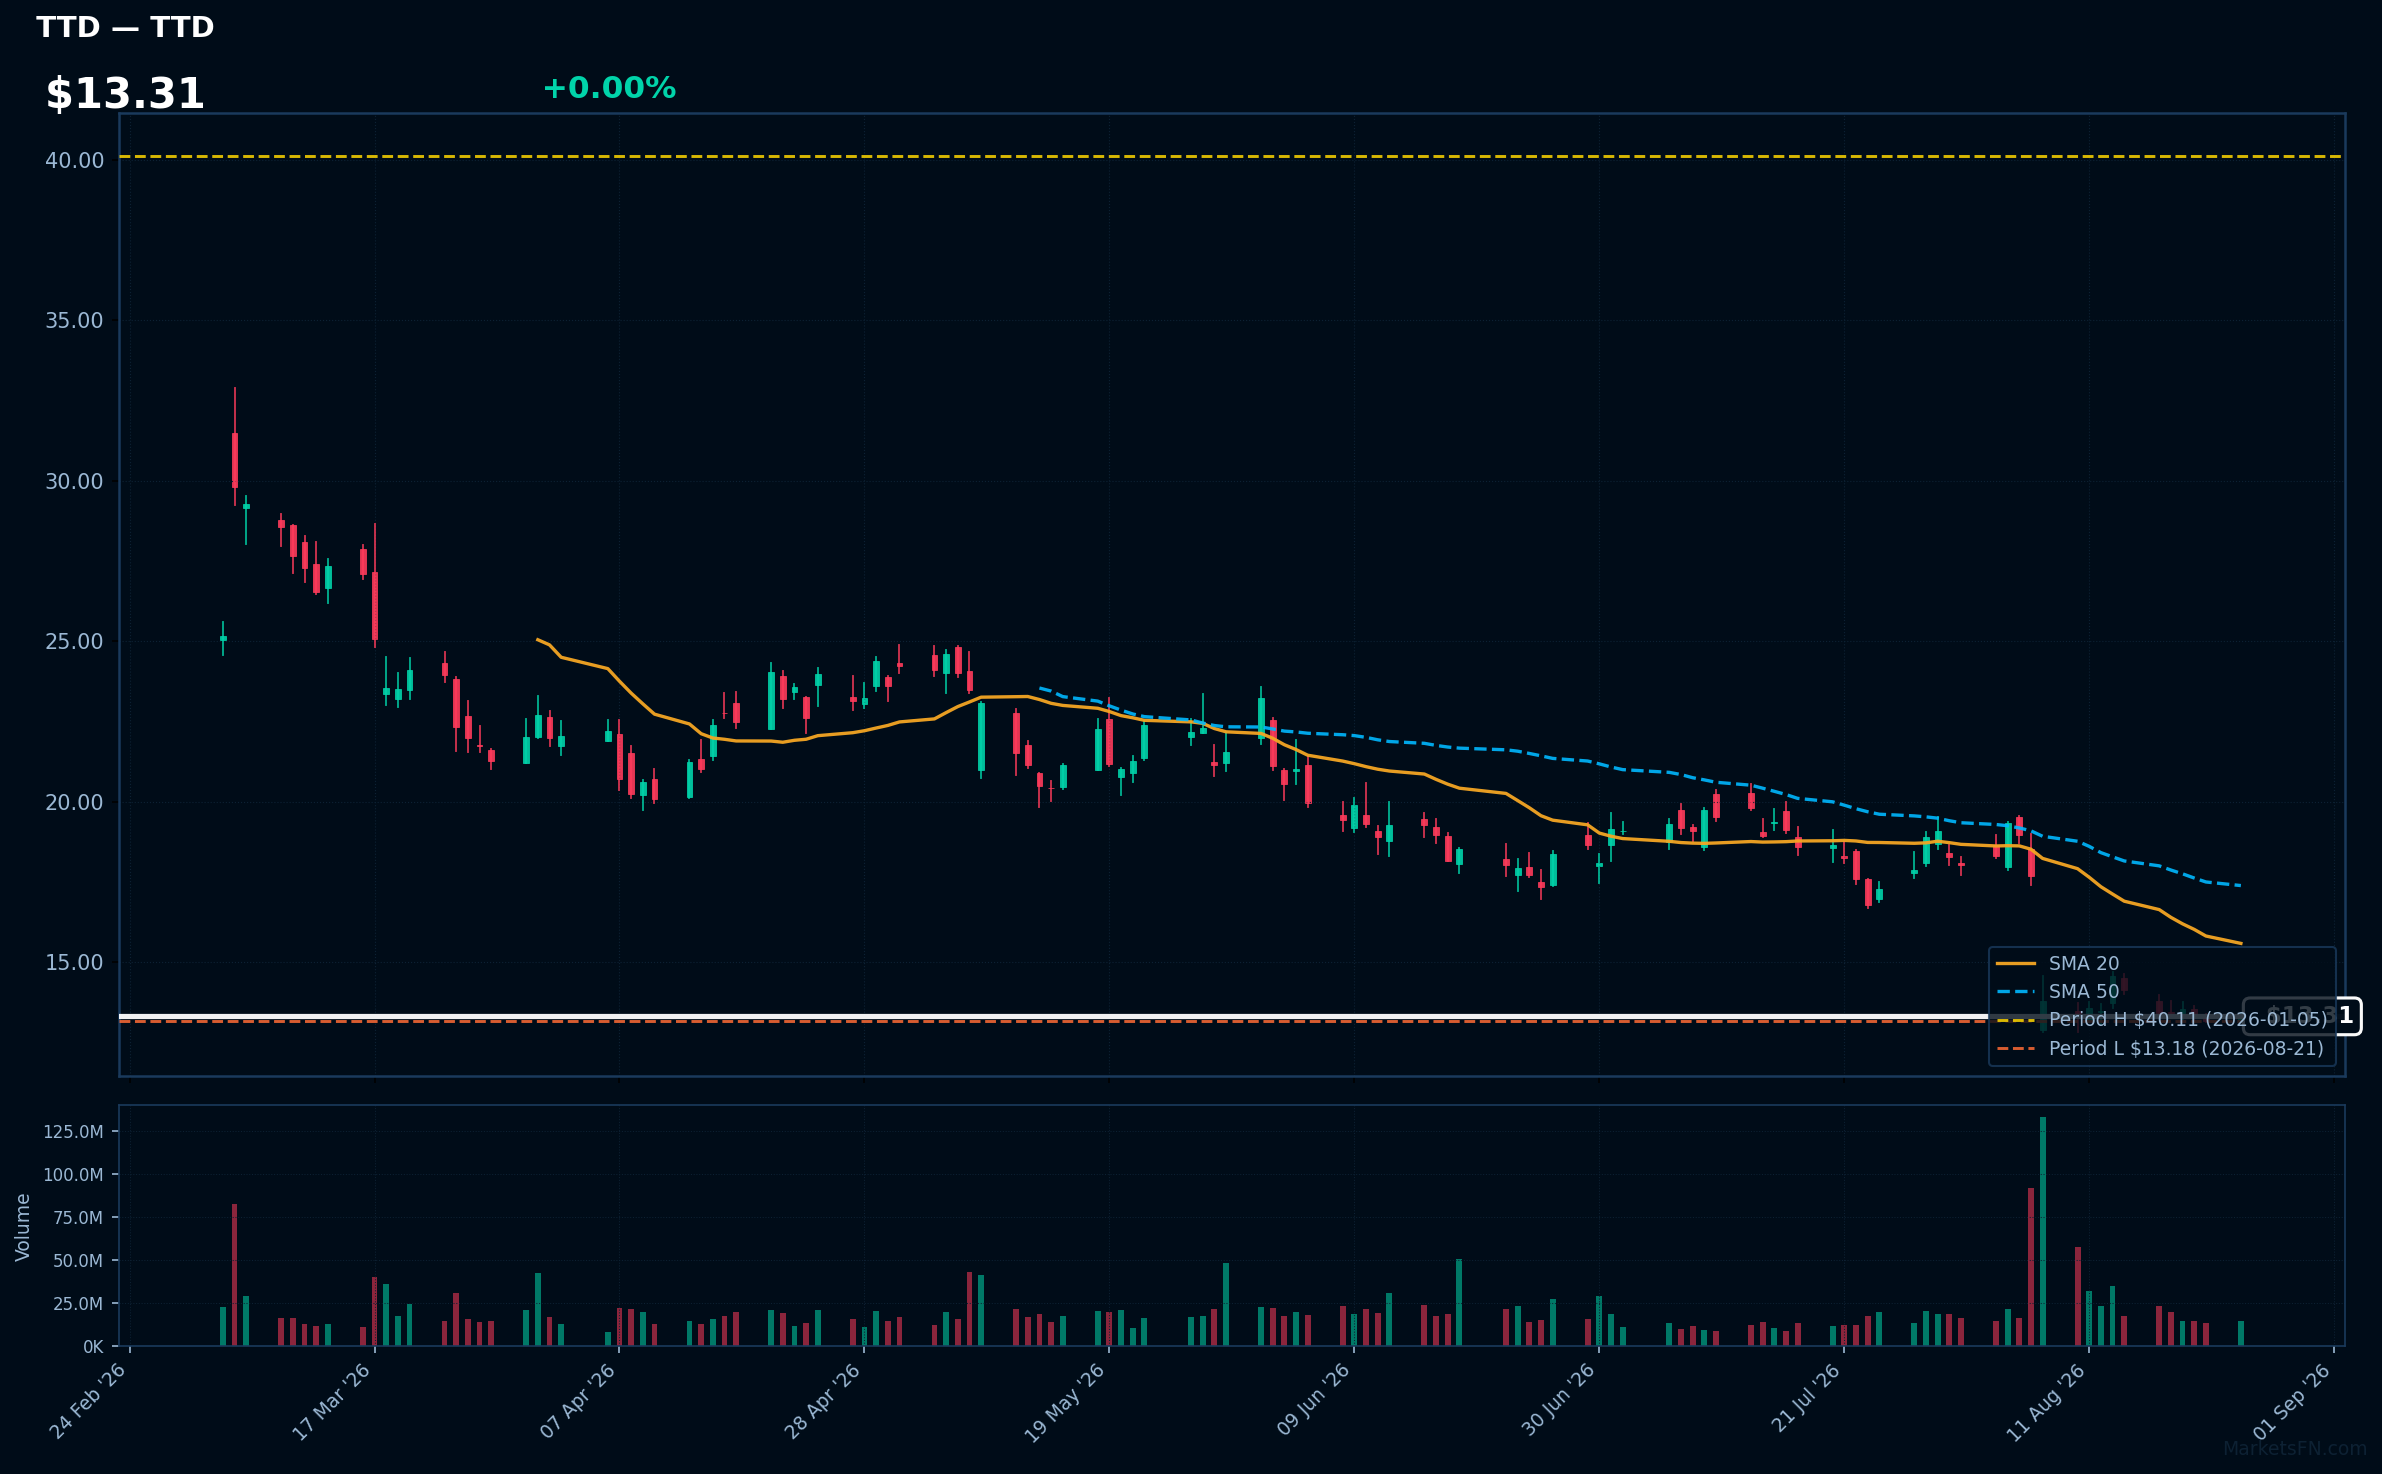
TTD | Trade Desk Inc | Communication Services | Price Last: $13.27 | % Realized: -64.78% | RSI: 32.7 | % above MA200: -49.4% | Trend: Below MA20, MA50, MA200
Trade Desk Inc (TTD) provides a technology platform for digital advertising, enabling advertisers to manage and optimize their campaigns across various channels. Investors should care due to its role in the growing programmatic advertising market, which is crucial for digital marketing efficiency.
The current technical situation indicates a bearish trend, with an RSI(14) of 32.7 and a MA alignment of price < MA20 < MA50 < MA200, suggesting sustained downtrend and potential warning signs as the stock is only 0.7% above its 2026 YTD low.
Related headlines
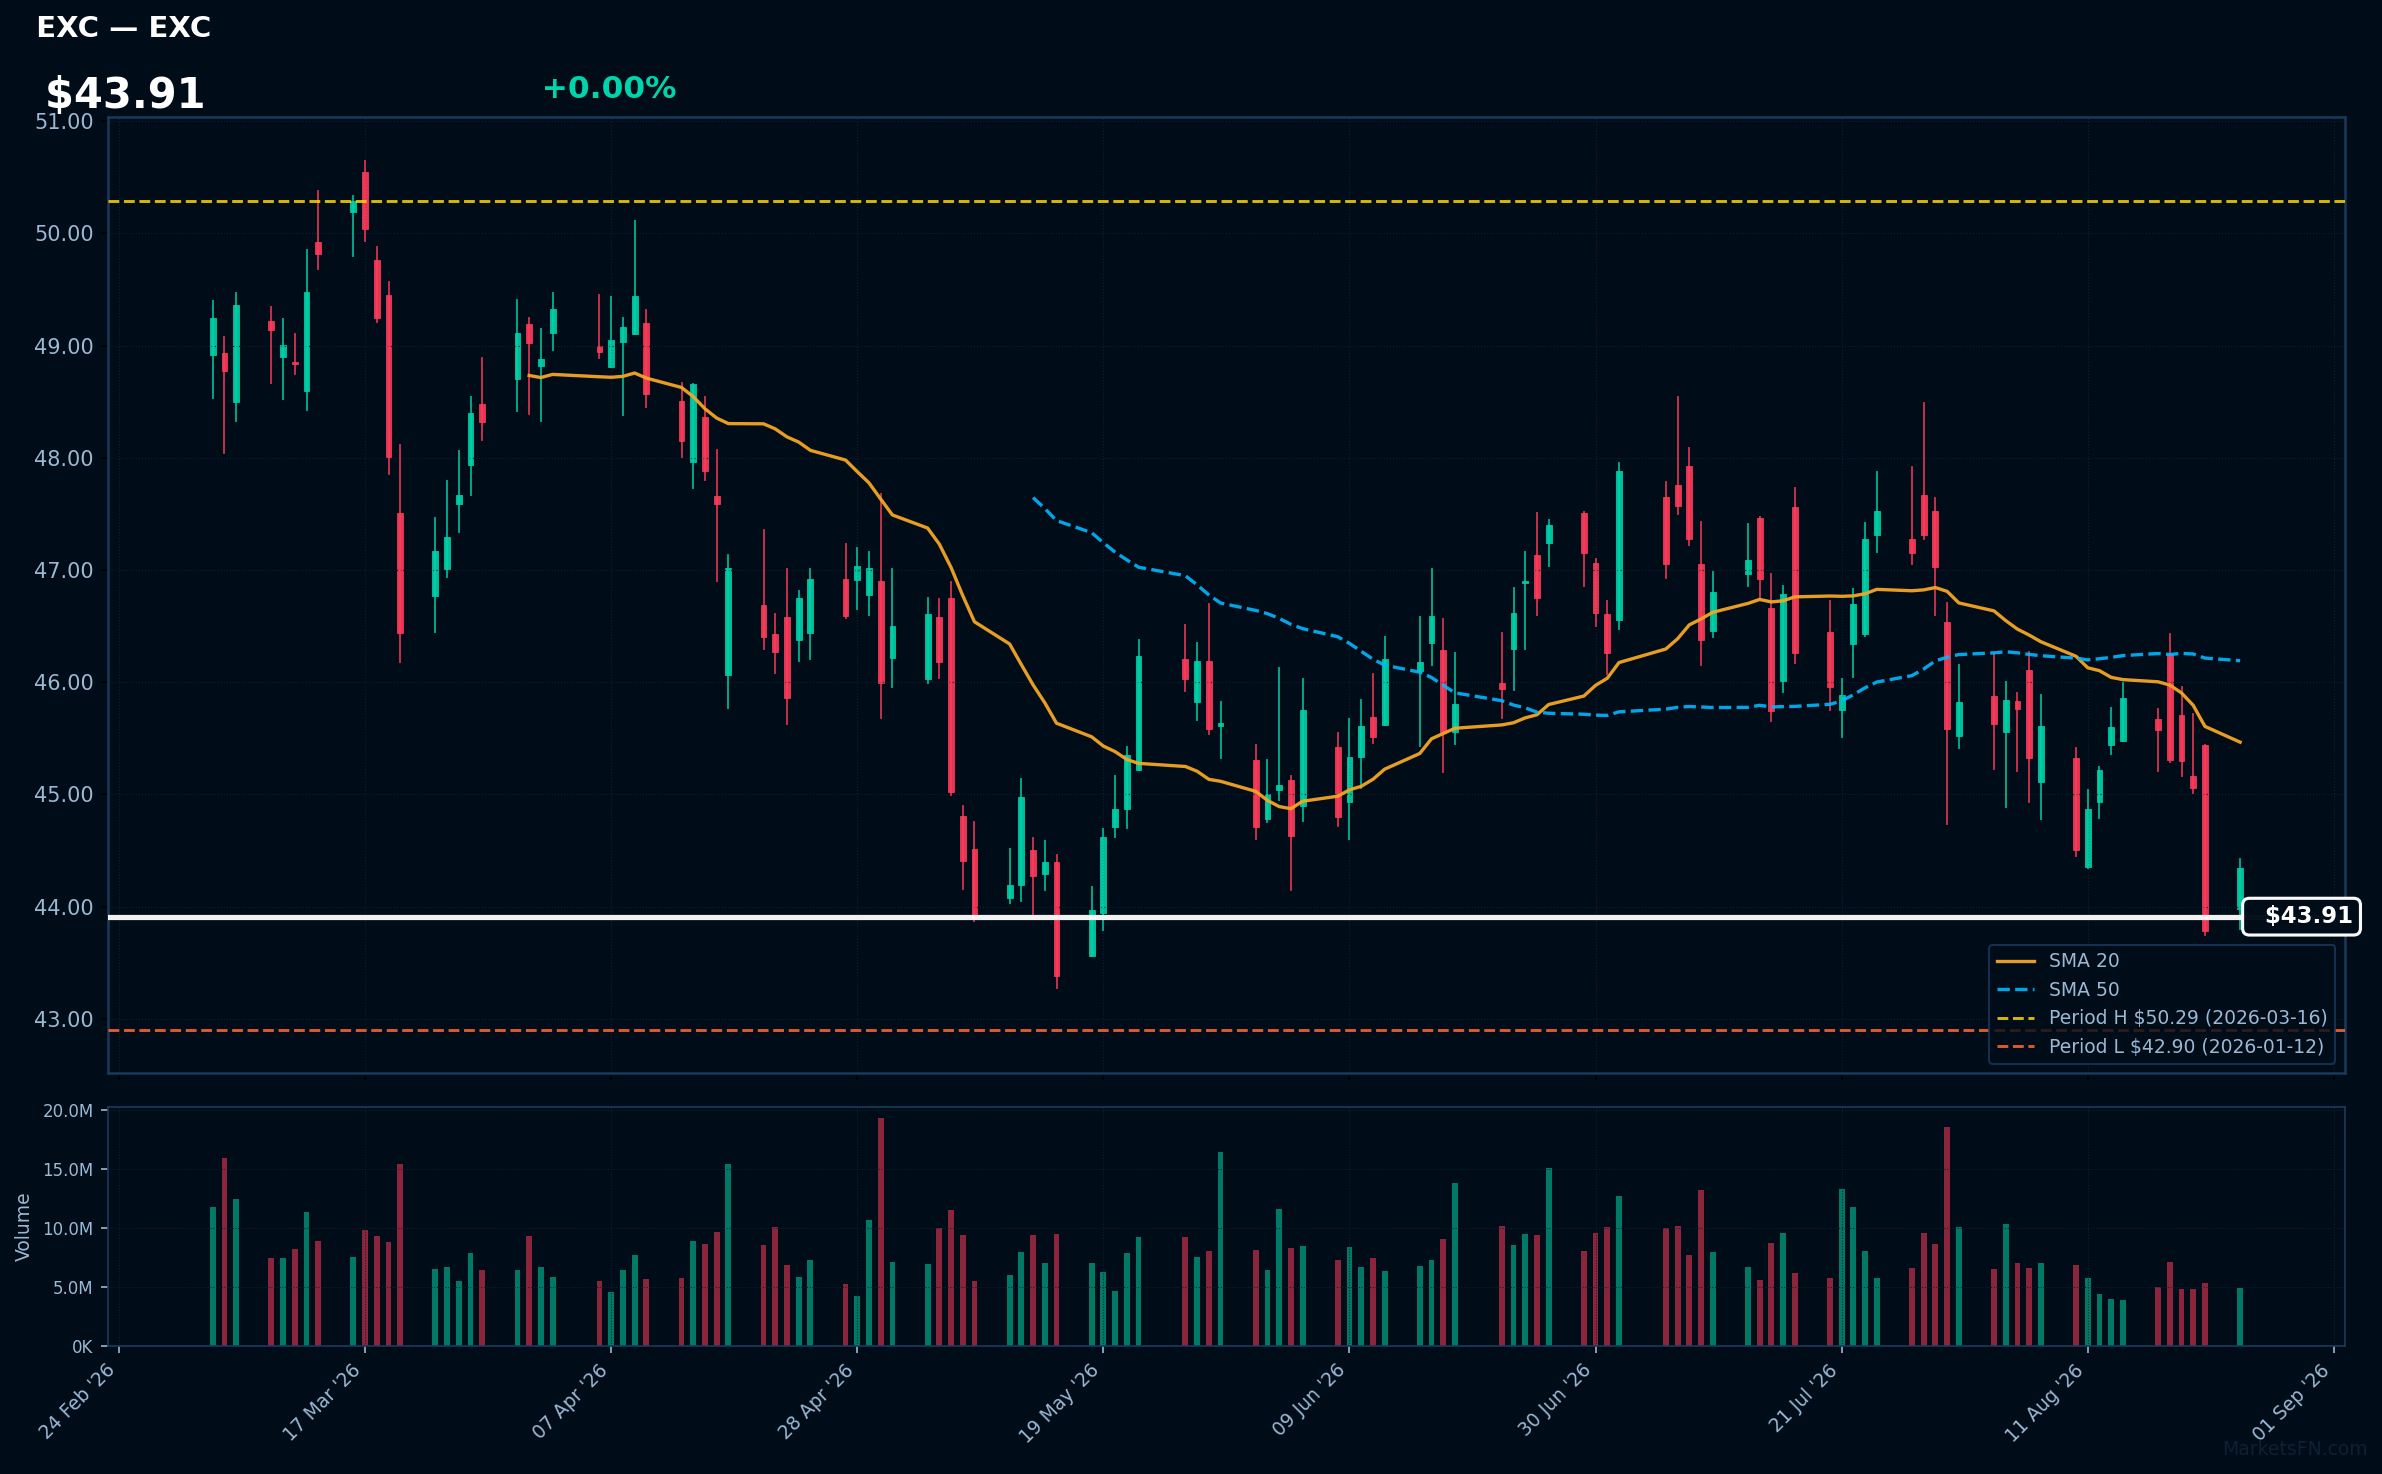
EXC | Exelon Corp | Utilities | Price Last: $44.34 | % Realized: +0.96% | RSI: 37.1 | % above MA200: -3.6% | Trend: Below MA20, MA50, MA200
Exelon Corp (EXC) is a leading energy provider, focusing on nuclear and renewable energy generation. Investors should care due to its significant role in the transition to cleaner energy, which positions it well for future growth amid increasing regulatory and consumer demand for sustainable solutions.
Currently, EXC shows mixed signals with an RSI(14) of 37.1, indicating potential oversold conditions. The stock is below MA20/MA50/MA200 and is only 3.4% above its 2026 YTD low, testing major support levels.
Related headlines
- Exelon Secures More Than $1 Billion in Customer Protections Through Pioneering Transmission Security Agreements
- Exelon high probability data center load falls 40%
- Exelon Corp (EXC) (Q2 2026) Earnings Call Highlights: Navigating Regulatory Hurdles and Data ...
- Exelon Corporation Q2 2026 Earnings Call Summary
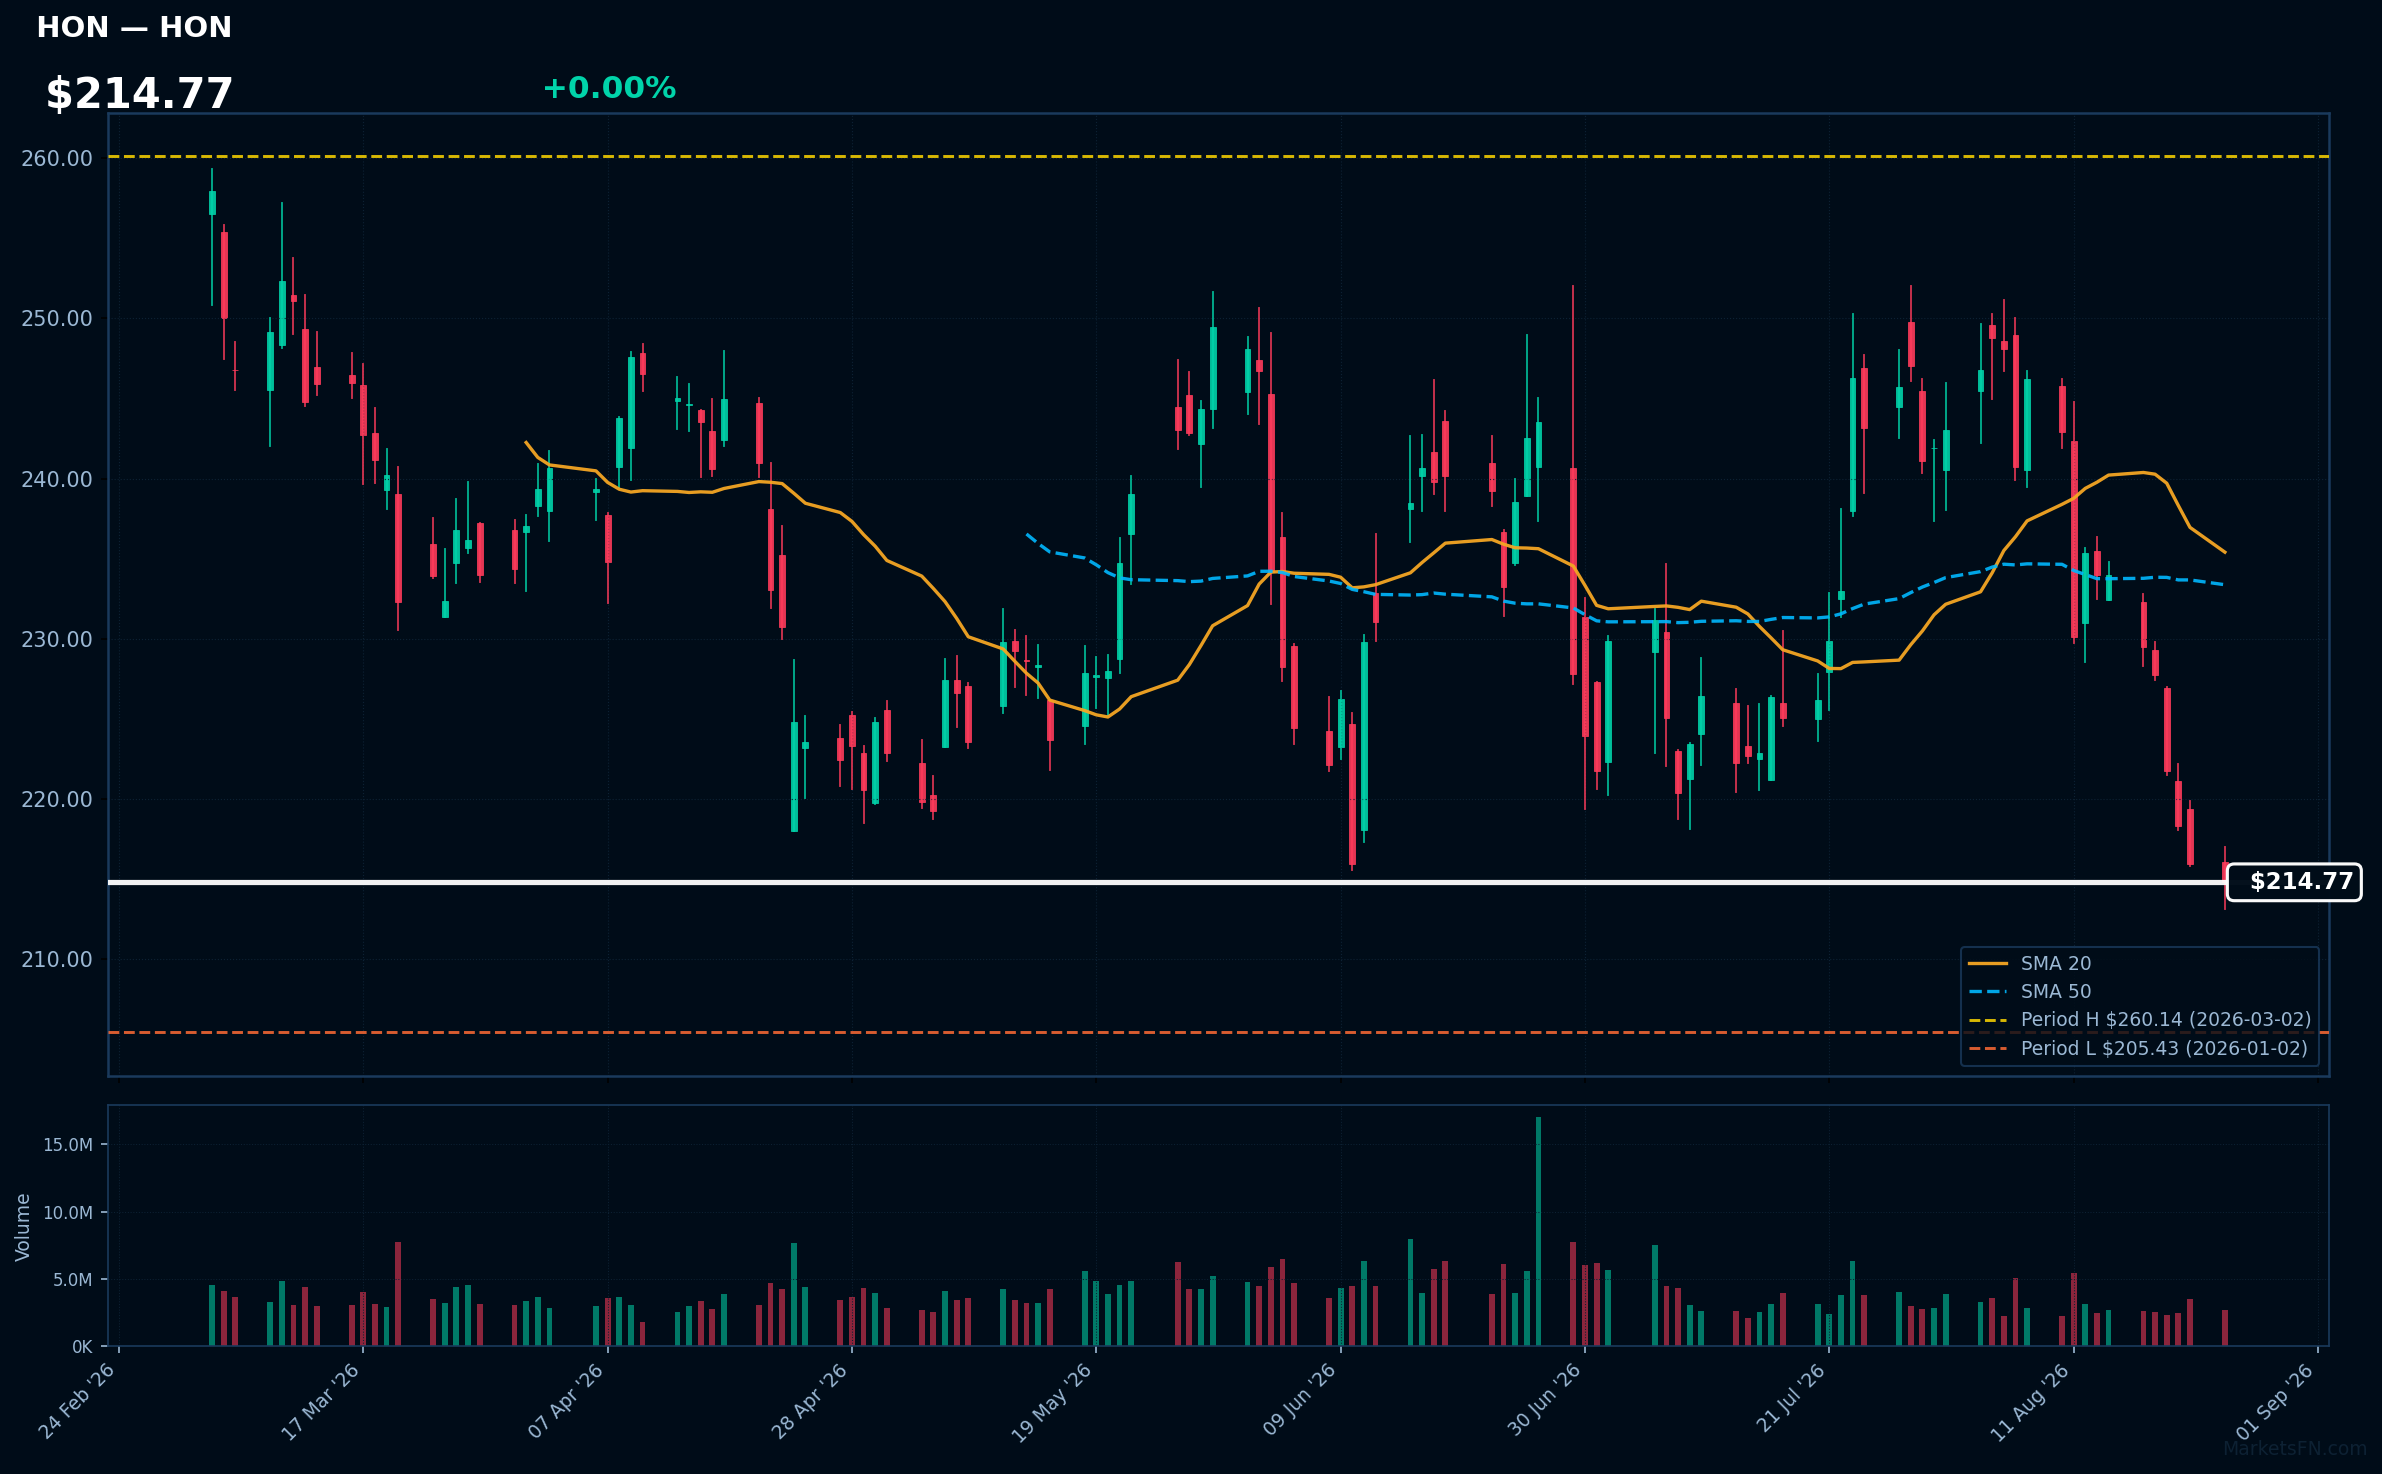
HON | Honeywell International Inc | Industrials | Price Last: $214.77 | % Realized: +4.55% | RSI: 32.2 | % above MA200: -6.4% | Trend: Below MA20, MA50, MA200
Honeywell International Inc (HON) is a diversified technology and manufacturing company, specializing in aerospace, building technologies, performance materials, and safety solutions. Investors should care due to its innovative products and strong market position, which can drive long-term growth and resilience in various economic conditions.
The current technical situation shows mixed signals with an RSI(14) of 32.2, indicating potential oversold conditions. The stock is below MA20/MA50/MA200 and is only 4.5% above its 2026 YTD low, testing major support.
Related headlines
- Honeywell Aerospace Stock Has Fallen Far Enough. Morgan Stanley Says It's Time to Buy.
- Honeywell Technologies Announces Leadership Updates for Process Technology and Building Automation
- Honeywell Aerospace targets supplier bottlenecks to boost output
- Honeywell, Alphabet Inc. Cl A share losses contribute to Dow's 162-point drop
Market Commentary
The proximity of certain Nasdaq 100 stocks to their 2026 year-to-date extremes indicates significant volatility and investor sentiment within the technology sector. Stocks like AMGN, ADP, ABNB, PAYX, and EA are currently at 0.0% from their highs, suggesting a strong bullish trend, while others like APP, EA, TTD, EXC, and HON are hovering above their lows, reflecting varying degrees of recovery potential.
This divergence can be attributed to several technology sector themes and macroeconomic conditions. Factors such as advancements in artificial intelligence, shifts in consumer behavior post-pandemic, and ongoing interest rate adjustments by central banks are influencing stock performance. The resilience of companies near their highs may indicate robust earnings growth and investor confidence, while those near their lows may be grappling with market headwinds or sector-specific challenges.
Investors and traders should closely monitor upcoming earnings reports, macroeconomic indicators, and Federal Reserve policy announcements. These elements will be crucial in determining whether the current trends will continue or reverse. Additionally, watching for shifts in consumer sentiment and technological innovations will provide insights into potential market movements in the tech sector.
Methodology: All 101 Nasdaq 100 constituents screened. Close prices downloaded from 2026-01-01. Period high = highest close since Jan 1 2026; period low = lowest close since Jan 1 2026. Distance = (current price / period extreme − 1) × 100. Technical indicators computed on up to 1 year of daily OHLCV data.
Disclaimer: For informational purposes only. Not investment advice. Past performance is not indicative of future results.