Nasdaq 100 2026 YTD Highs & Lows Radar: Apple (AAPL), Copart, (CPRT) and more
MarketsFN Team

Nasdaq 100 2026 YTD Highs & Lows Radar: Apple (AAPL), Copart, (CPRT) and more
Screening all 101 Nasdaq 100 constituents for stocks nearest to their 2026 year-to-date high and their 2026 YTD low. Data as of July 10, 2026. % Realized = total return since Jan 1 2026.
Legend: RSI > 70 = overbought · RSI < 30 = oversold · Green % Realized = positive YTD return · Red = negative.
📈 Nearest to 2026 High
Sectors represented: Technology (2), Industrials (1), Communication Services (1), Consumer Cyclical (1)
| Ticker | Company | Sector | Price Last | % Realized | 2026 YTD High Date | RSI | % above MA200 | Trend |
|---|---|---|---|---|---|---|---|---|
| AAPL | Apple Inc | Technology | $316.22 | +16.68% | 2026-07-09 | 62.2 | +16.1% | Above MA20, MA50, MA200 |
| CSX | CSX Corp | Industrials | $49.35 | +36.06% | 2026-07-09 | 66.1 | +22.9% | Above MA20, MA50, MA200 |
| FTNT | Fortinet Inc | Technology | $163.73 | +110.23% | 2026-07-09 | 66.2 | +72.1% | Above MA20, MA50, MA200 |
| EA | Electronic Arts, Inc | Communication Services | $206.56 | +1.05% | 2026-07-09 | 70.2 | +2.4% | Above MA20, MA50, MA200 |
| SBUX | Starbucks Corp | Consumer Cyclical | $106.41 | +26.72% | 2026-05-15 | 63.8 | +14.1% | Above MA20, MA50, MA200 |
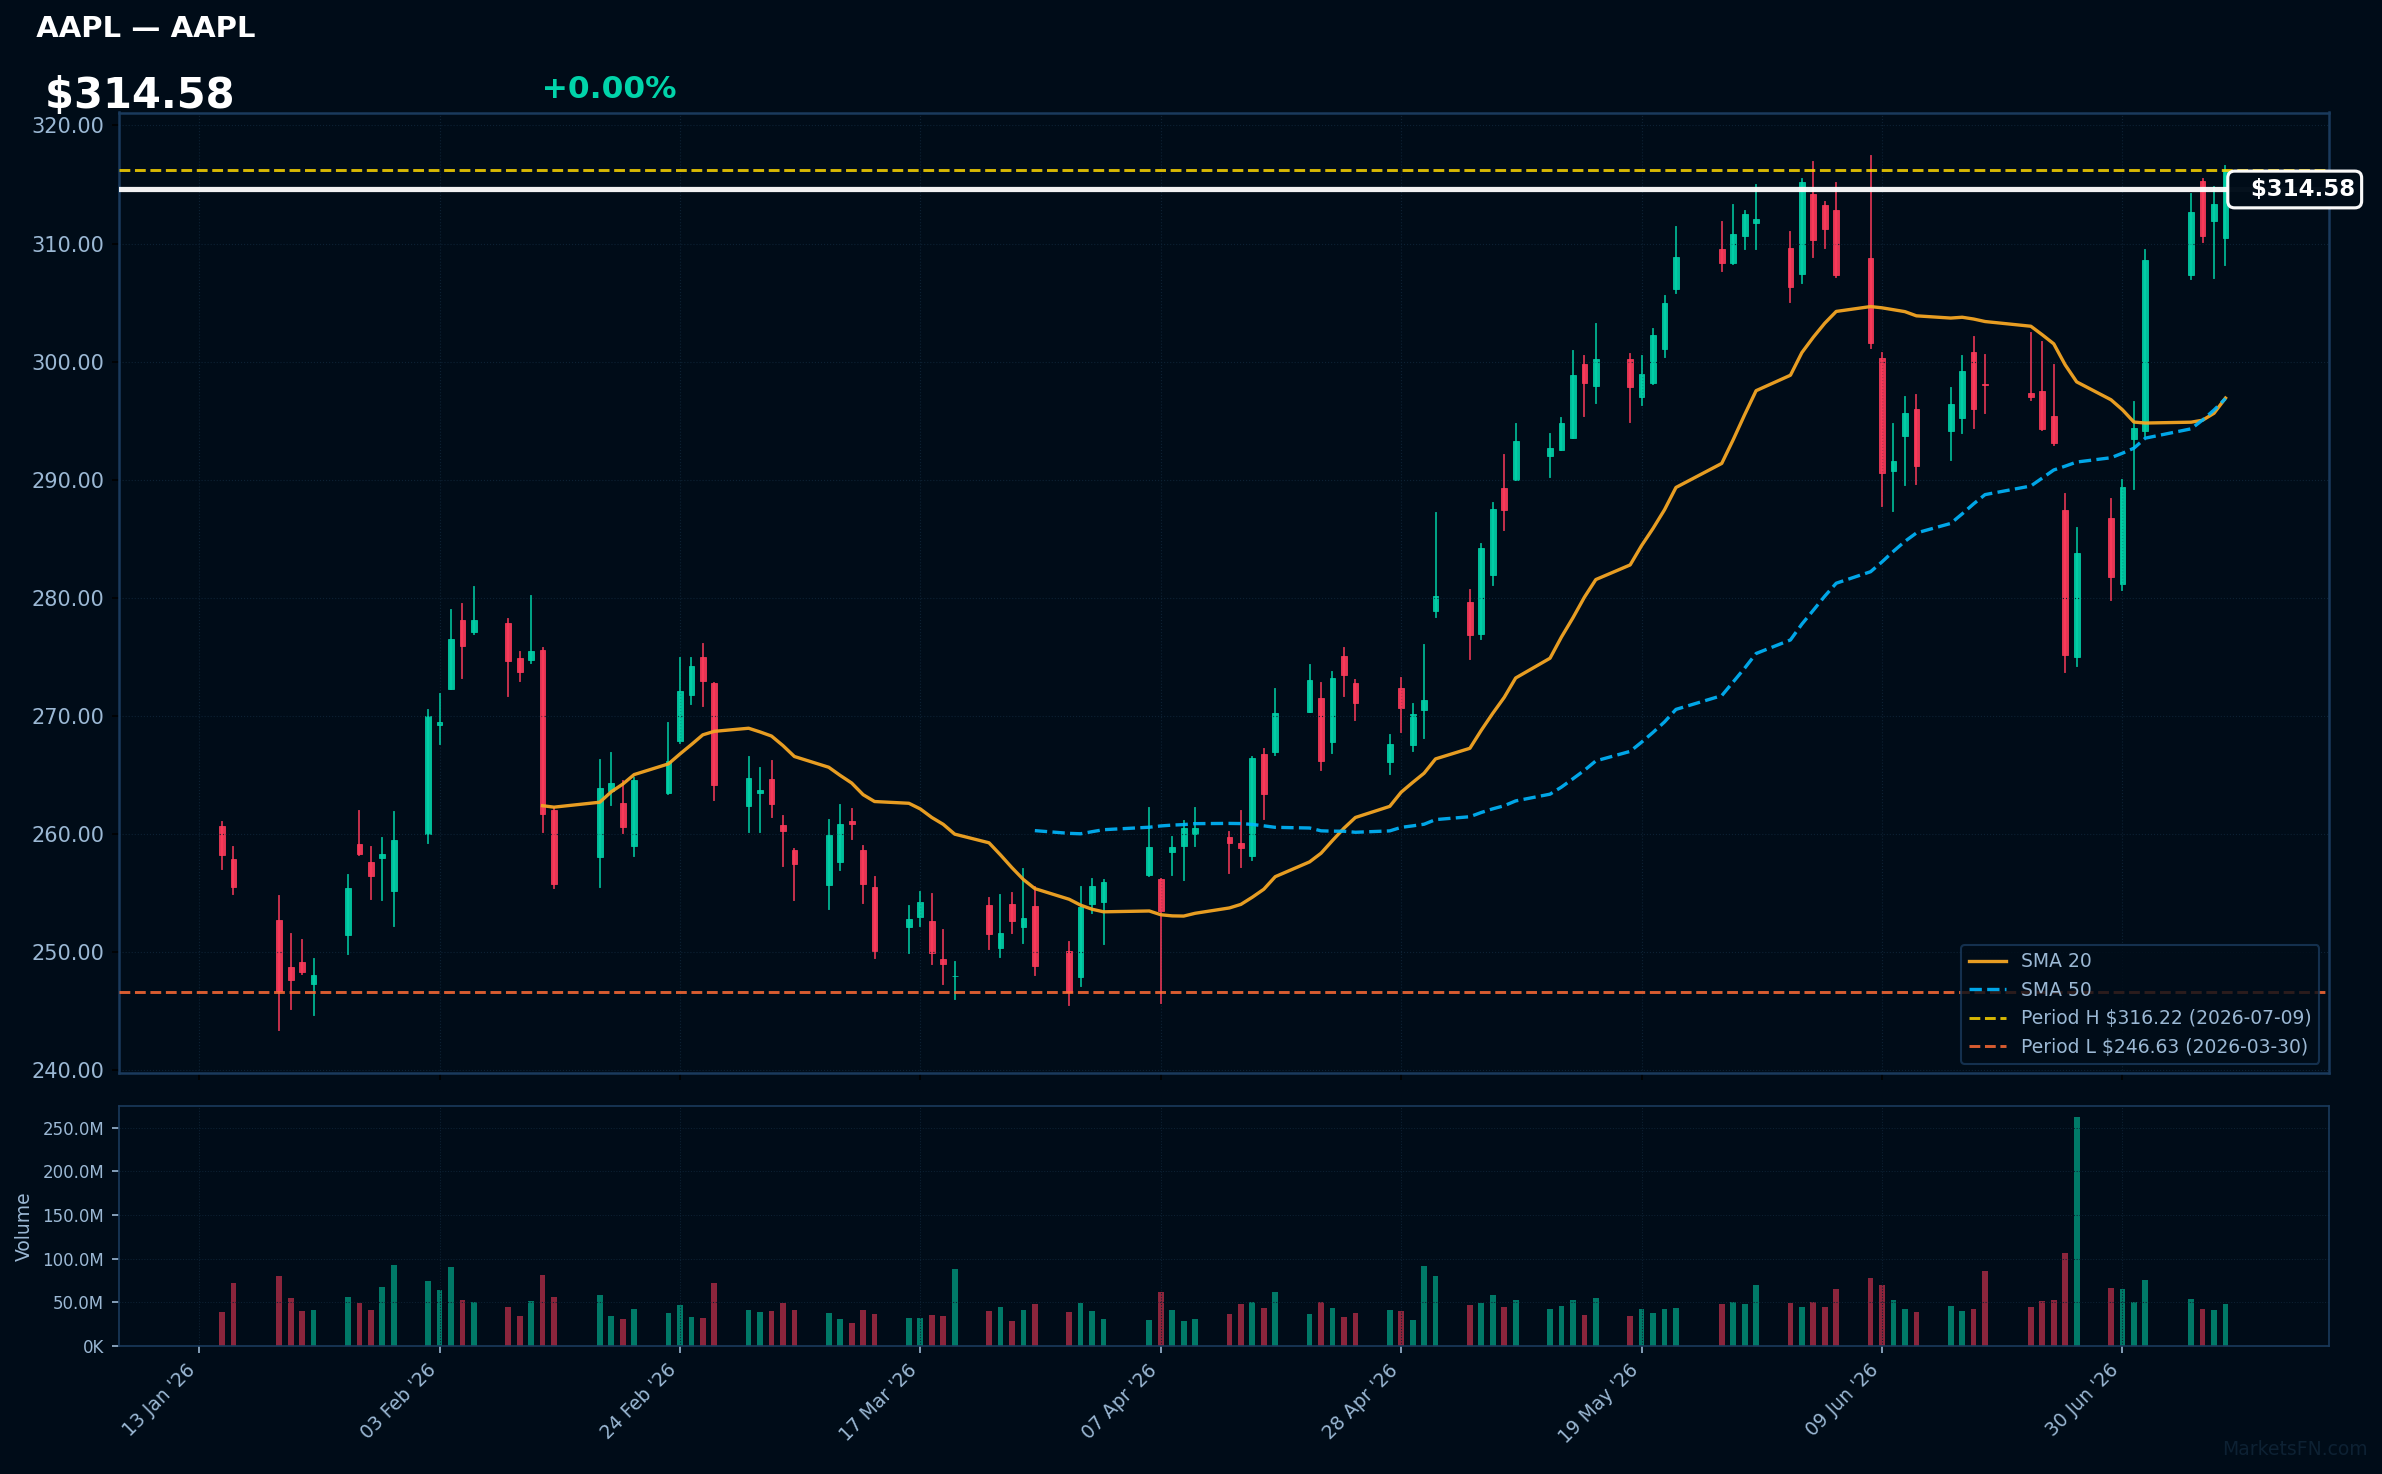
AAPL | Apple Inc | Technology | Price Last: $316.22 | % Realized: +16.68% | RSI: 62.2 | % above MA200: +16.1% | Trend: Above MA20, MA50, MA200
Apple Inc designs, manufactures, and markets consumer electronics, software, and services, generating revenue primarily from iPhone sales and services like Apple Music and iCloud. Investors care about its innovation pipeline and ecosystem lock-in.
AAPL's RSI(14) is 62.2, indicating rising momentum. The MA alignment (price > MA20 > MA50 > MA200) suggests a sustained uptrend. With the stock 0.0% below its 2026 YTD high, it nears a potential breakout level, reinforcing the bullish technical picture.
Related headlines
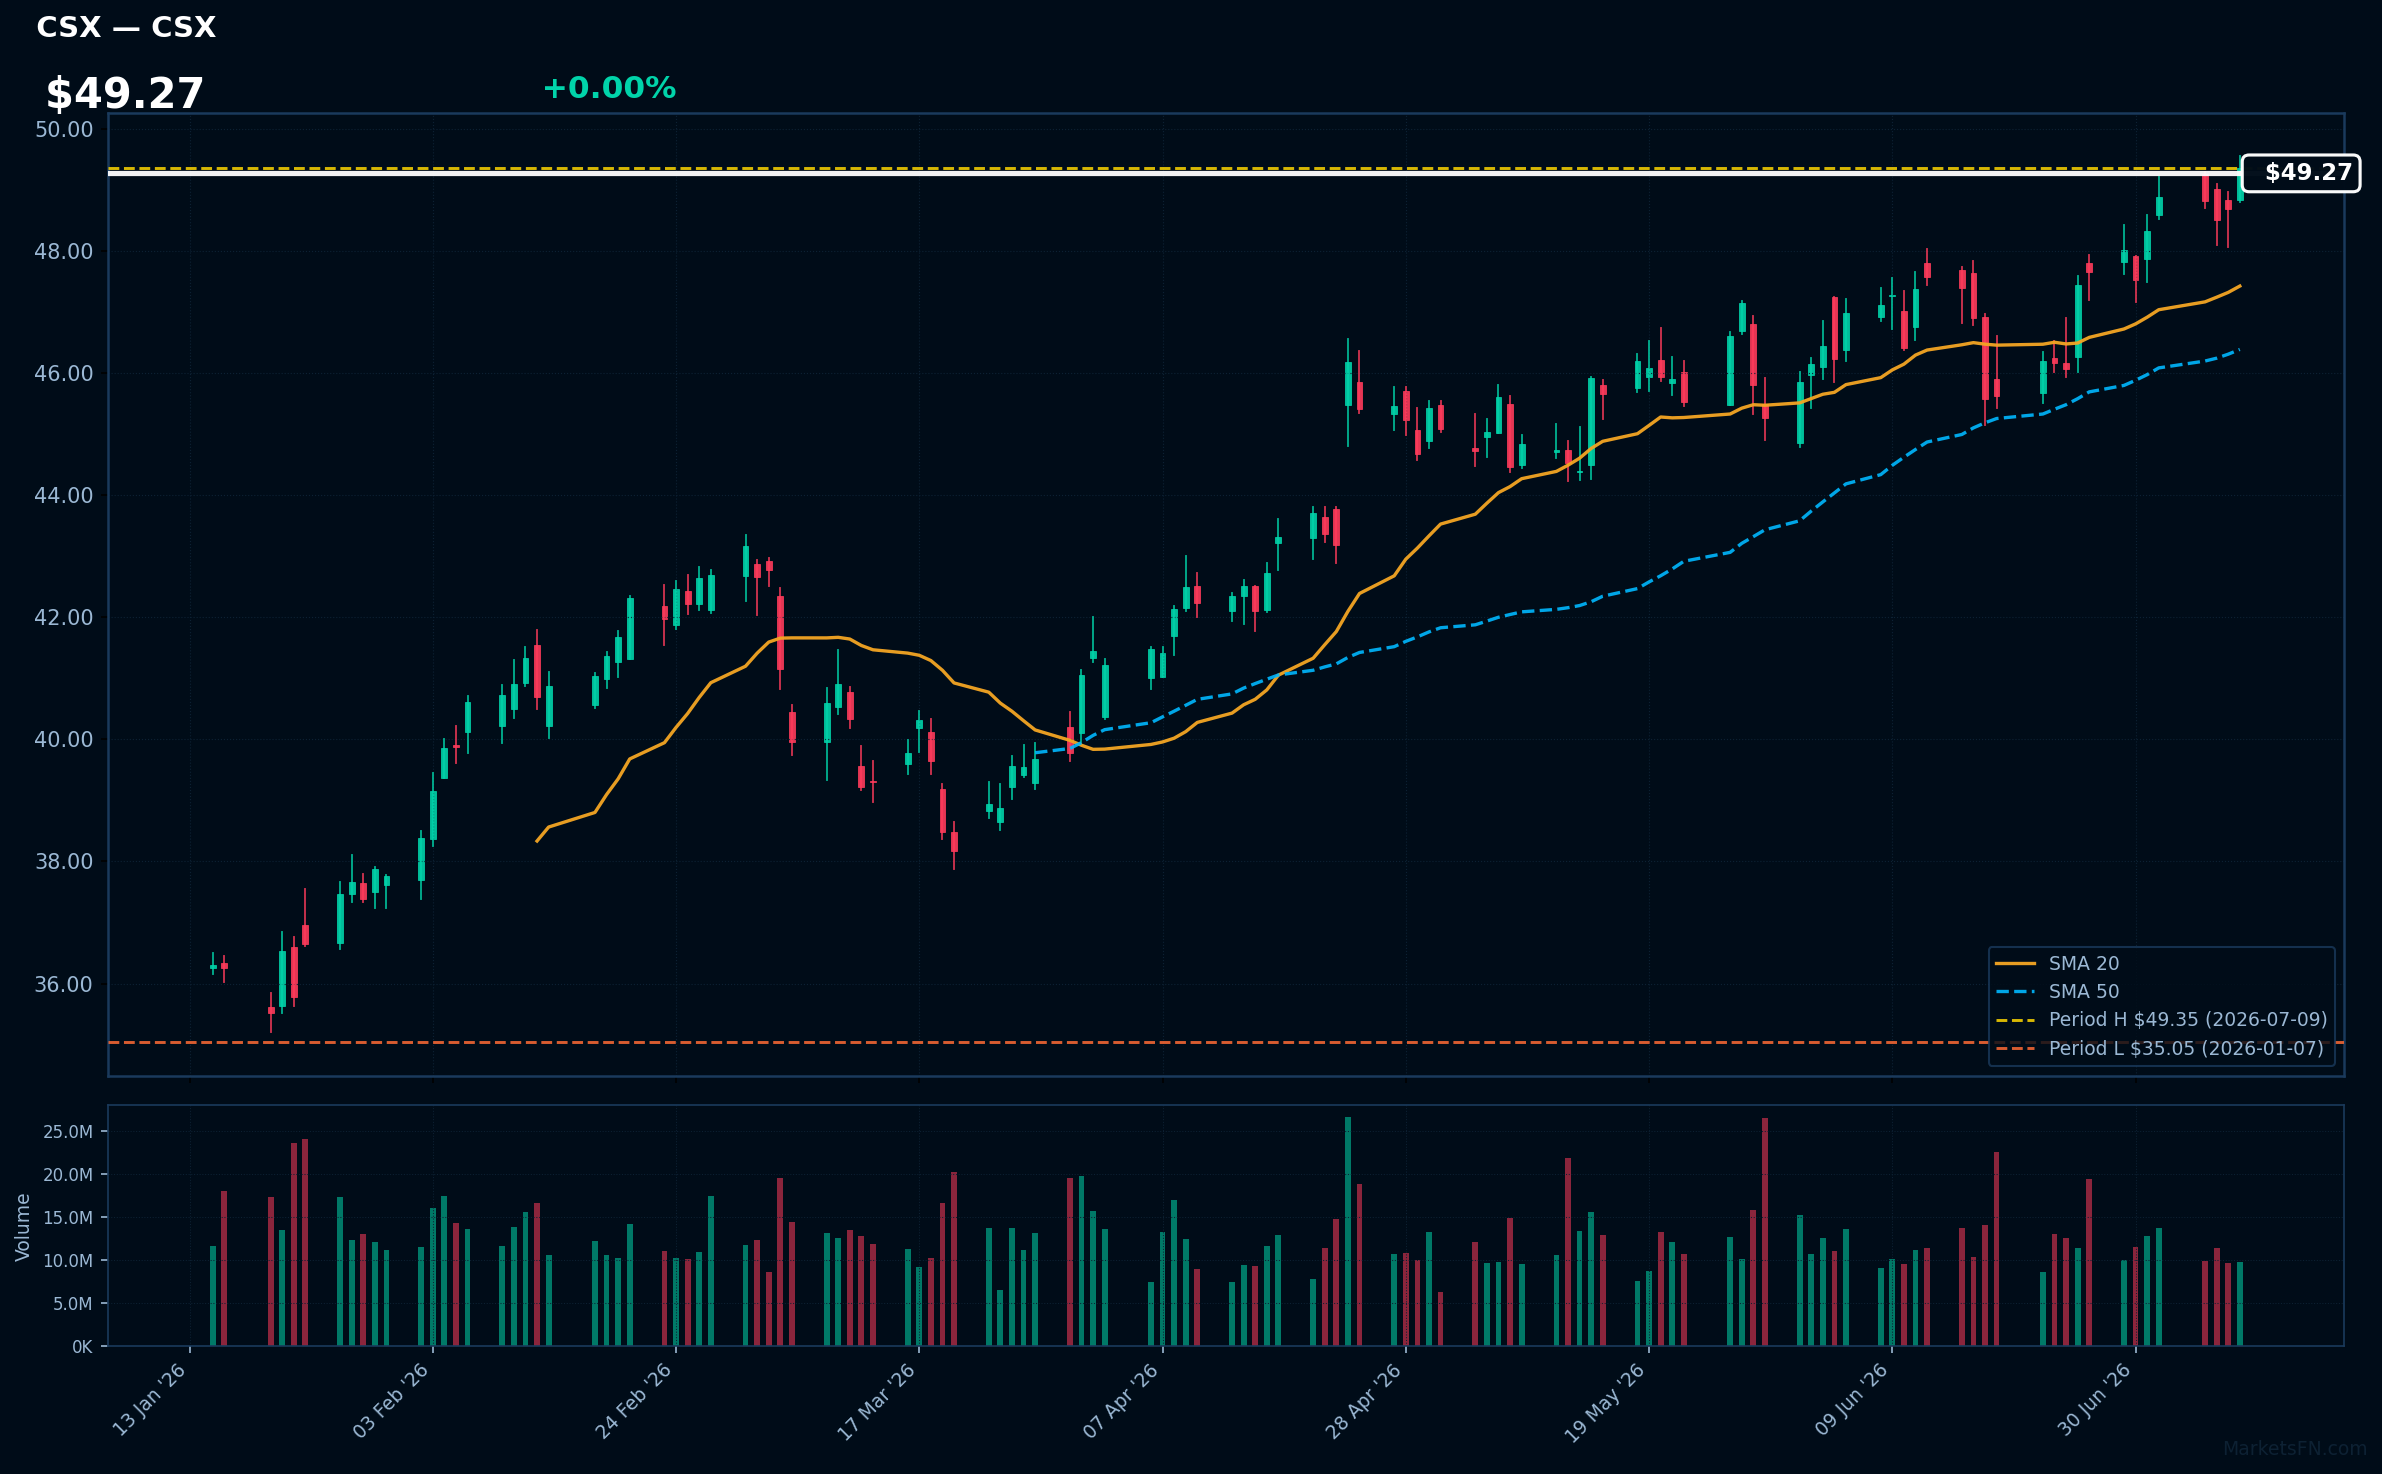
CSX | CSX Corp | Industrials | Price Last: $49.35 | % Realized: +36.06% | RSI: 66.1 | % above MA200: +22.9% | Trend: Above MA20, MA50, MA200
CSX Corp operates a rail network transporting coal, intermodal containers, and automotive goods, making it a key player in North American freight infrastructure; investors should care about its performance as it reflects industrial activity and economic growth.
CSX Corp's technicals indicate sustained uptrend with price > MA20 > MA50 > MA200, RSI(14) at 66.1, and 0.0% below its 2026 YTD high, suggesting momentum; the stock is near a potential breakout level with a 36.1% 2026 YTD return.
Related headlines
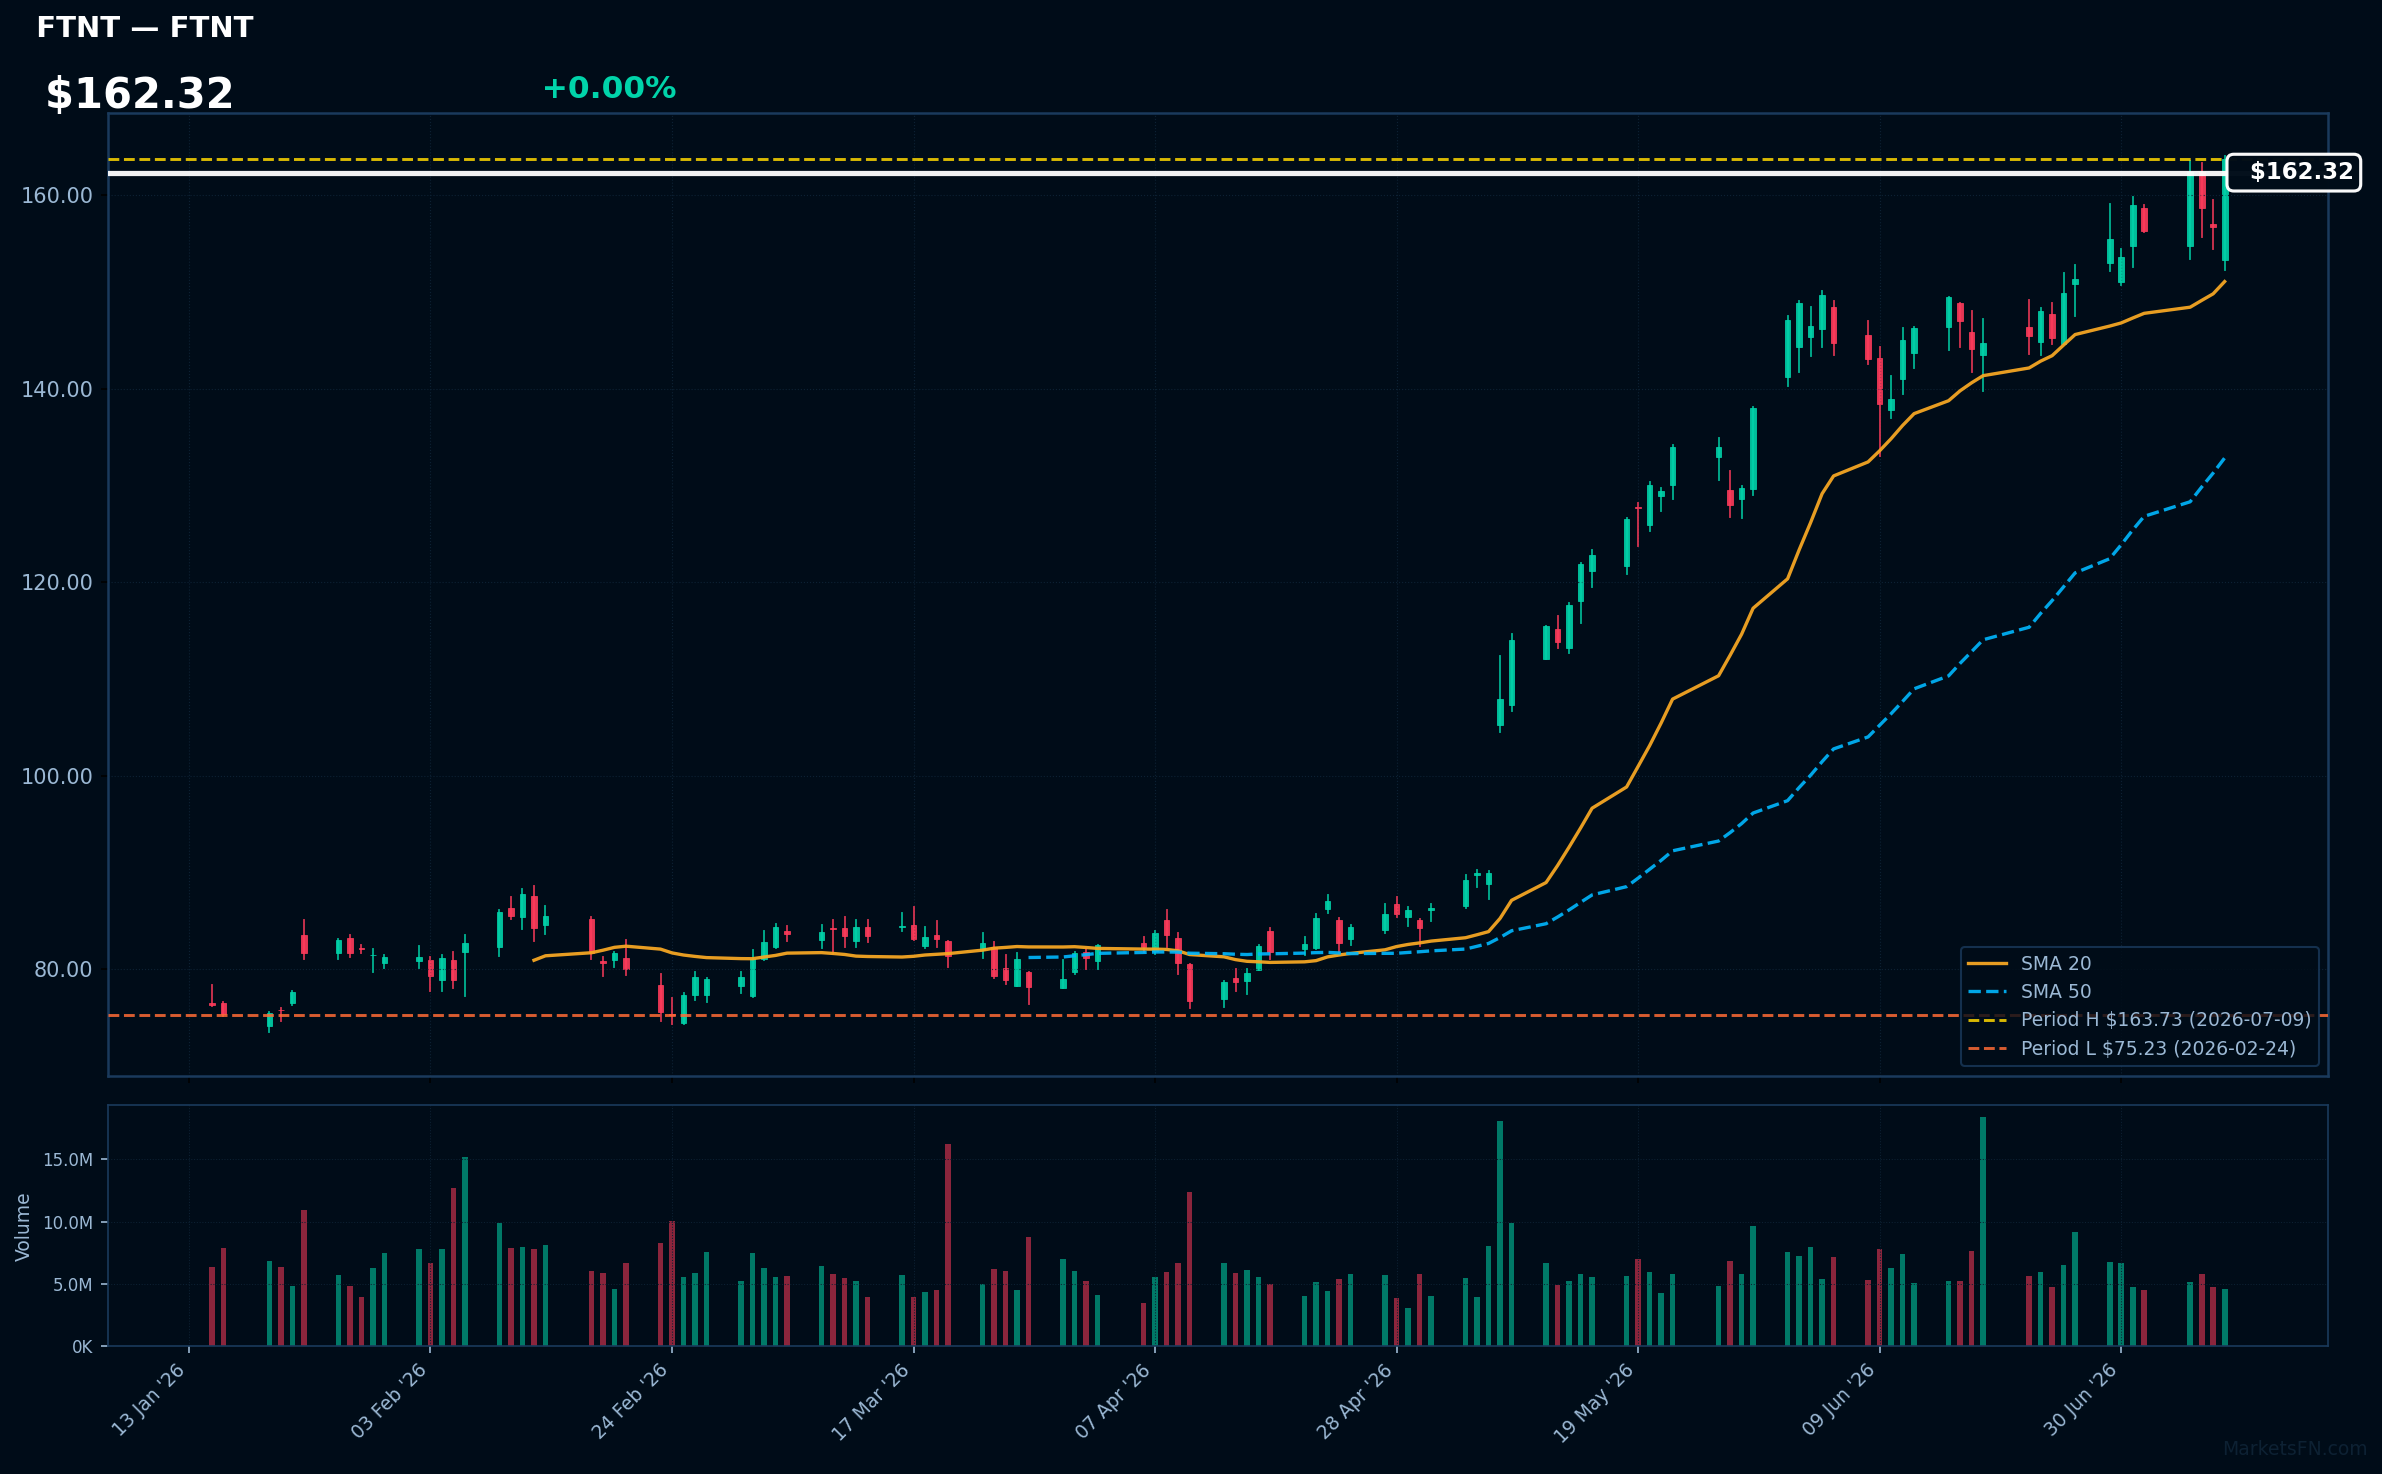
FTNT | Fortinet Inc | Technology | Price Last: $163.73 | % Realized: +110.23% | RSI: 66.2 | % above MA200: +72.1% | Trend: Above MA20, MA50, MA200
Fortinet Inc is a cybersecurity company providing network security solutions, including firewalls and threat intelligence. Investors should care due to its strong position in the growing cybersecurity market, driven by increasing threats and digital transformation.
Fortinet Inc shows bullish technicals with RSI(14) at 66.2, indicating rising momentum. The MA alignment (price > MA20 > MA50 > MA200) confirms a sustained uptrend. The stock is 0.0% below its 2026 YTD high, nearing a potential breakout.
Related headlines
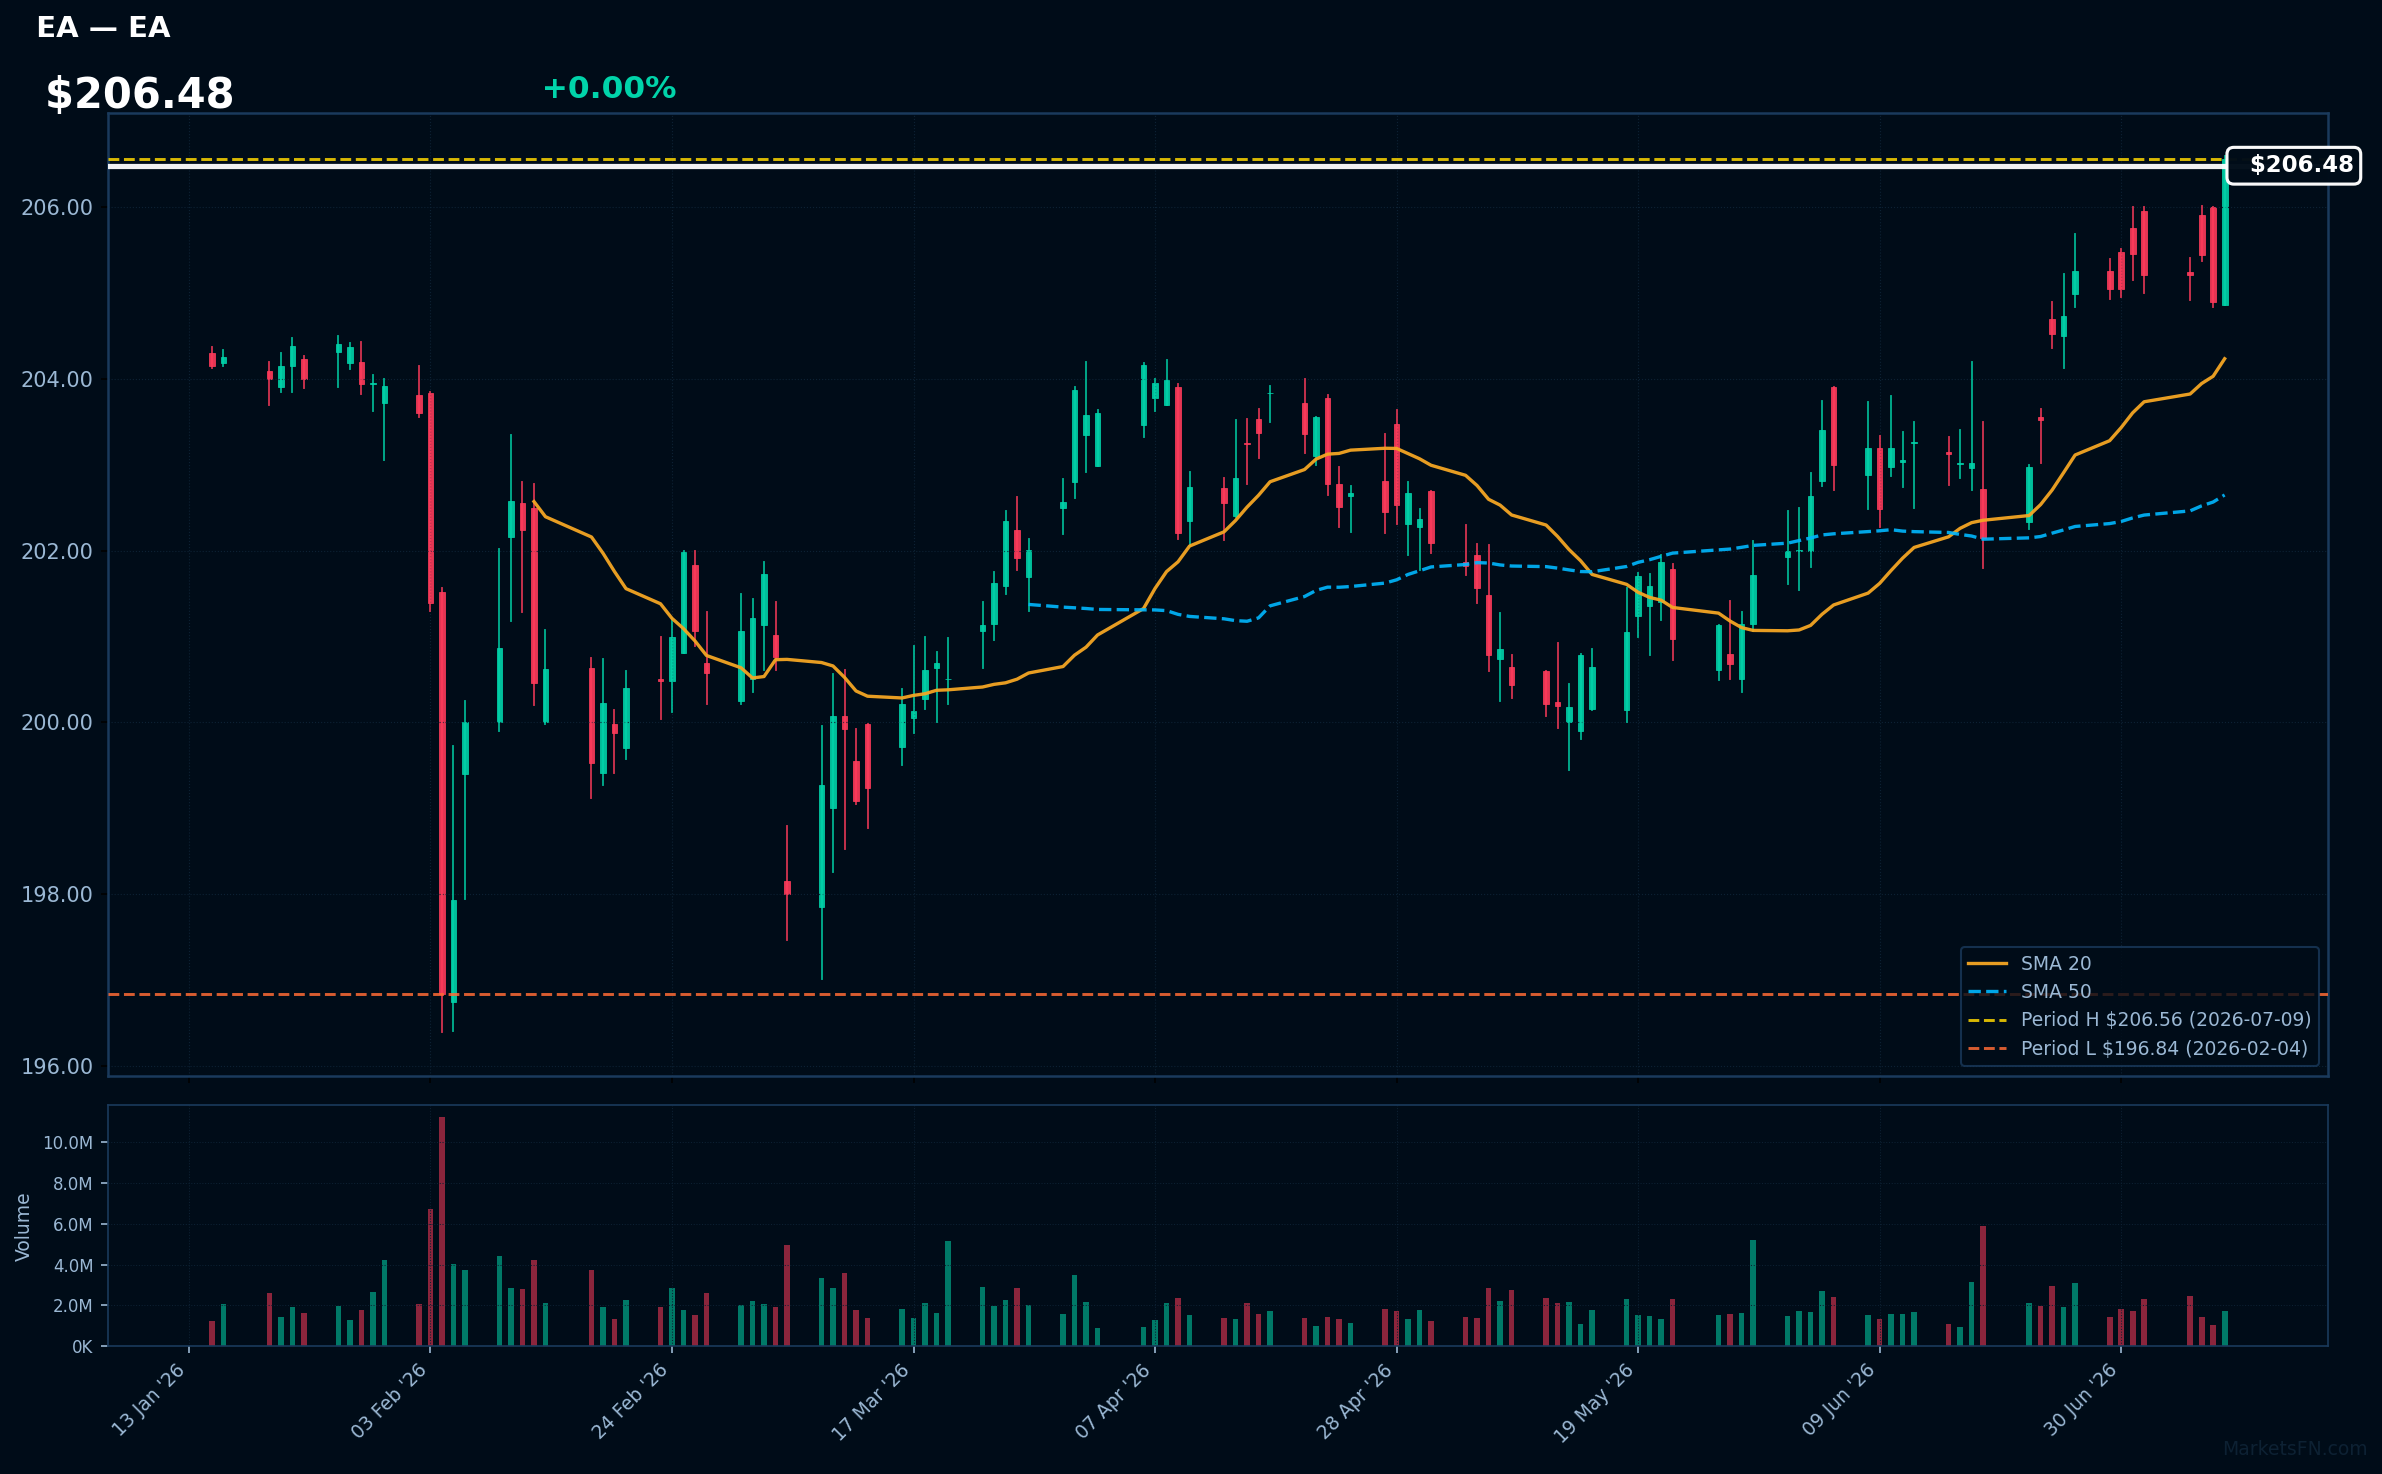
EA | Electronic Arts, Inc | Communication Services | Price Last: $206.56 | % Realized: +1.05% | RSI: 70.2 | % above MA200: +2.4% | Trend: Above MA20, MA50, MA200
Electronic Arts, Inc (EA) is a leading interactive entertainment software company that develops and publishes games such as FIFA, Madden NFL, and The Sims. Investors should care about its performance in the gaming market and its ability to innovate and release successful titles.
EA's current technical situation indicates strong momentum with an RSI(14) of 70.2 and a bullish MA alignment (price > MA20 > MA50 > MA200). The stock is near its 2026 YTD high, up 1.1% YTD, suggesting potential for a breakout.
Related headlines
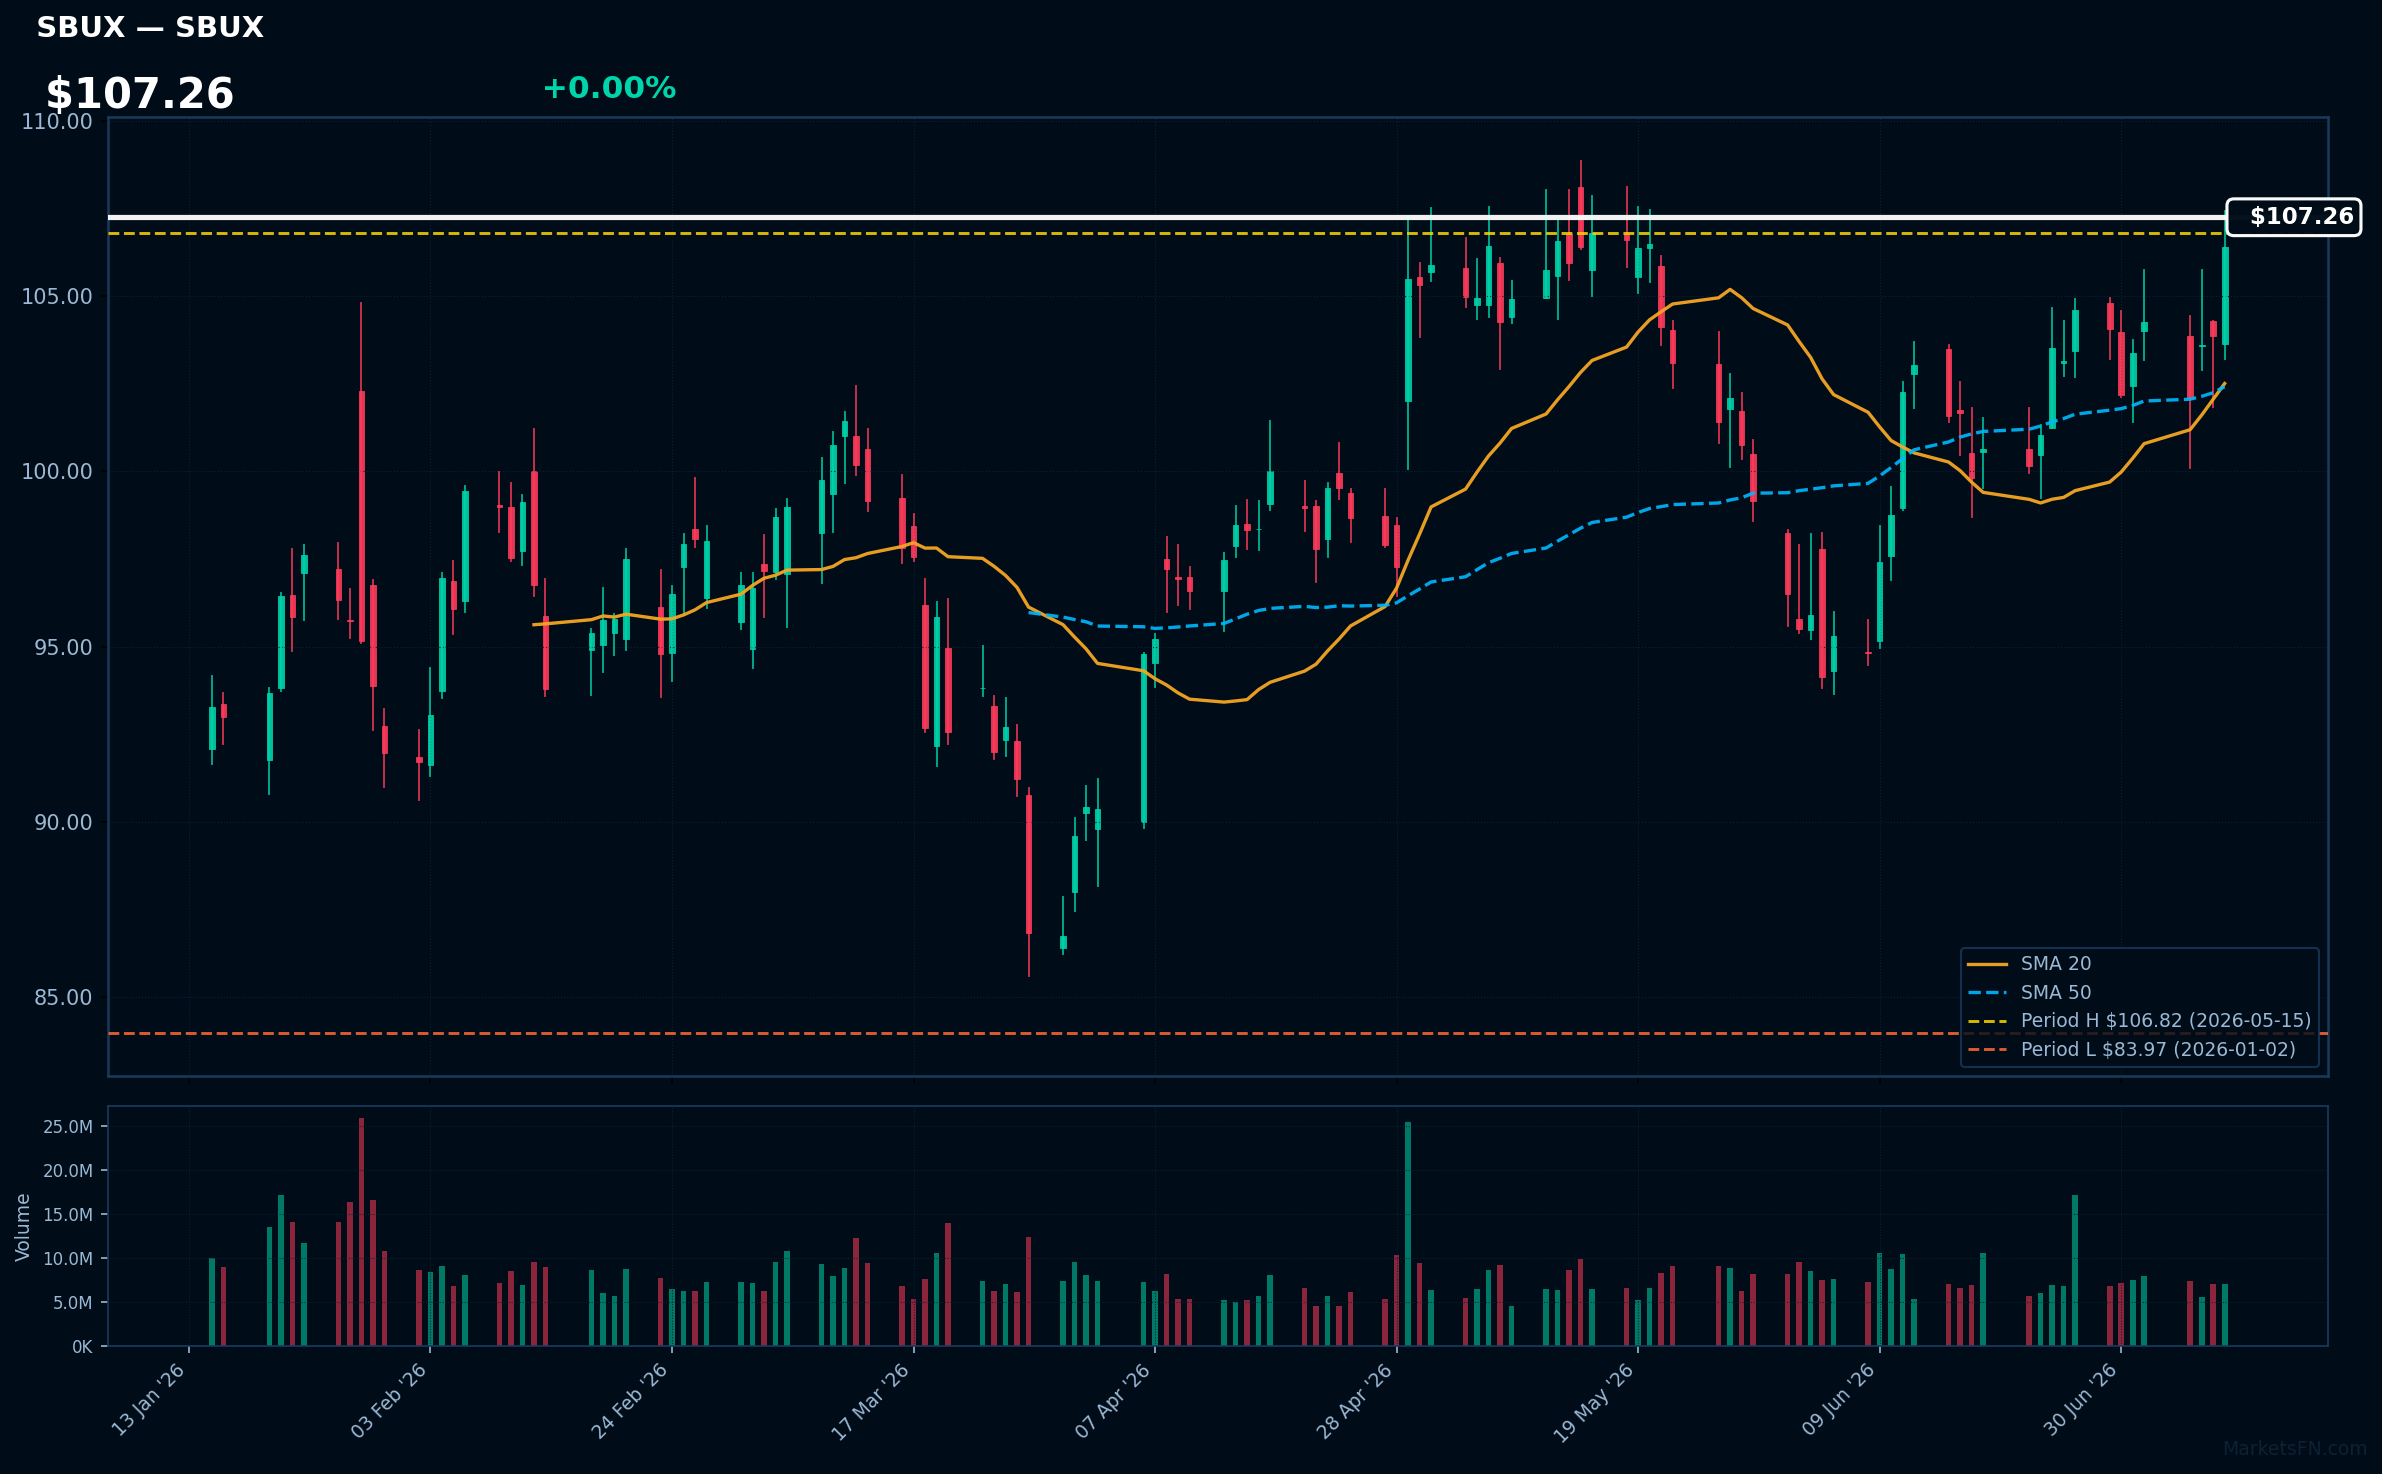
SBUX | Starbucks Corp | Consumer Cyclical | Price Last: $106.41 | % Realized: +26.72% | RSI: 63.8 | % above MA200: +14.1% | Trend: Above MA20, MA50, MA200
Starbucks Corp operates a global chain of coffeehouses, offering a wide range of coffee, tea, and food products. Investors should care about its brand strength, global expansion, and same-store sales growth, which drive revenue and profitability.
The stock is in a sustained uptrend with price > MA20 > MA50 > MA200, RSI(14) at 63.8, indicating momentum. It's 0.4% below its 2026 YTD high, nearing a potential breakout, with 26.7% 2026 YTD return, reinforcing the bullish technical picture.
Related headlines
- S&P 500, Nasdaq, Dow End Higher Led By Chipmaker Stocks As Investors Look Past US-Iran Hostility ORCL, SBUX, WULF, PANW, FATE In Focus
- SBUX Stock Set For Best Day In Two Months Starbucks Steps Up AI Push To Cut Reliance On MSFT, IBM
- Starbucks Targets $400 Million Software Spend With AI Shift
- Starbucks Develops AI Software to Reduce Reliance on Microsoft and IBM, Report Says (SBUX)
📉 Nearest to 2026 Low
Sectors represented: Industrials (1), Consumer Cyclical (1), Consumer Defensive (1), Communication Services (1), Healthcare (1)
| Ticker | Company | Sector | Price Last | % Realized | 2026 YTD Low Date | RSI | % above MA200 | Trend |
|---|---|---|---|---|---|---|---|---|
| CPRT | Copart, Inc | Industrials | $28.33 | -24.99% | 2026-06-29 | 38.0 | -23.6% | Below MA20, MA50, MA200 |
| ORLY | O'Reilly Automotive, Inc | Consumer Cyclical | $85.12 | -5.78% | 2026-07-06 | 40.7 | -9.8% | Below MA20, MA50, MA200 |
| PEP | PepsiCo Inc | Consumer Defensive | $137.86 | -3.07% | 2026-06-30 | 38.9 | -8.1% | Below MA20, MA50, MA200 |
| WBD | Warner Bros. Discovery Inc | Communication Services | $26.63 | -6.59% | 2026-07-06 | 49.7 | +2.8% | Above MA200 · Below MA20, MA50 |
| AZN | Astrazeneca plc ADR | Healthcare | $178.49 | -2.54% | 2026-06-18 | 39.7 | -3.1% | Below MA20, MA50, MA200 |
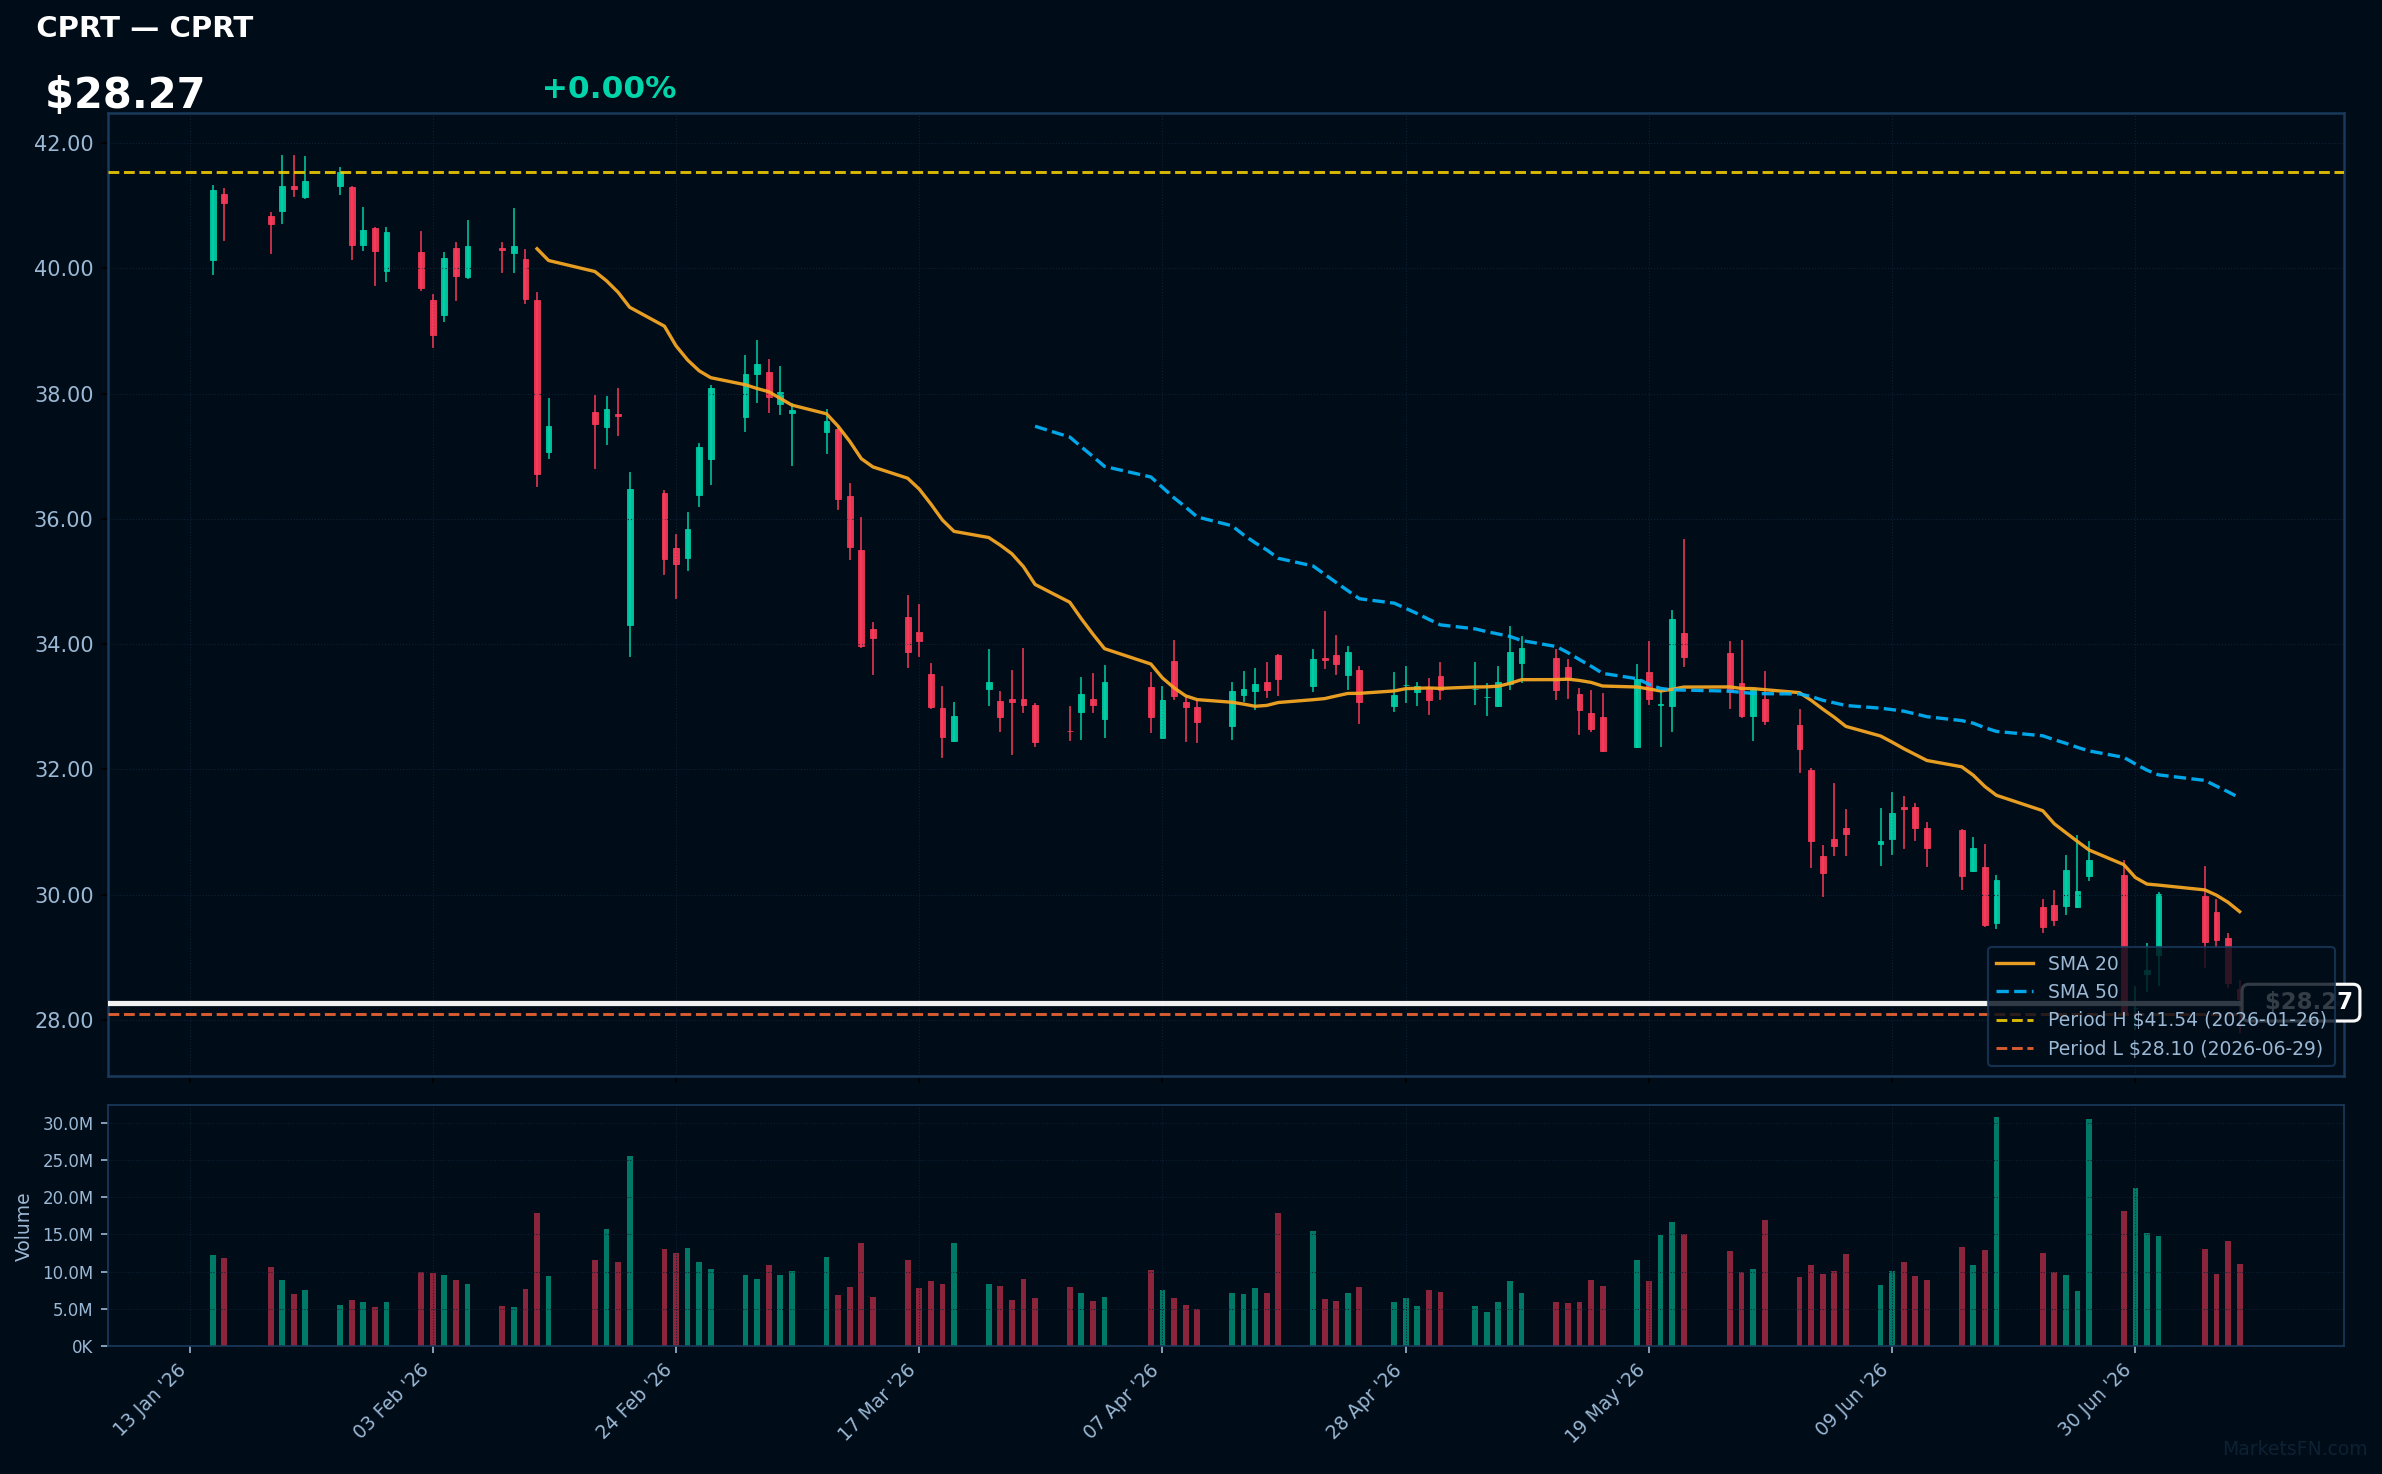
CPRT | Copart, Inc | Industrials | Price Last: $28.33 | % Realized: -24.99% | RSI: 38.0 | % above MA200: -23.6% | Trend: Below MA20, MA50, MA200
Copart, Inc (CPRT) operates online vehicle auction platforms, connecting buyers and sellers in the automotive salvage and used vehicle markets. Investors should care because CPRT's market dominance and pricing power impact its revenue growth and profitability.
CPRT's technical situation is bearish, with RSI(14) at 38.0, indicating weakening momentum. The sustained downtrend (price < MA20 < MA50 < MA200) and proximity to its 2026 YTD low (0.8% above) raise concerns, suggesting a potential further decline.
Related headlines
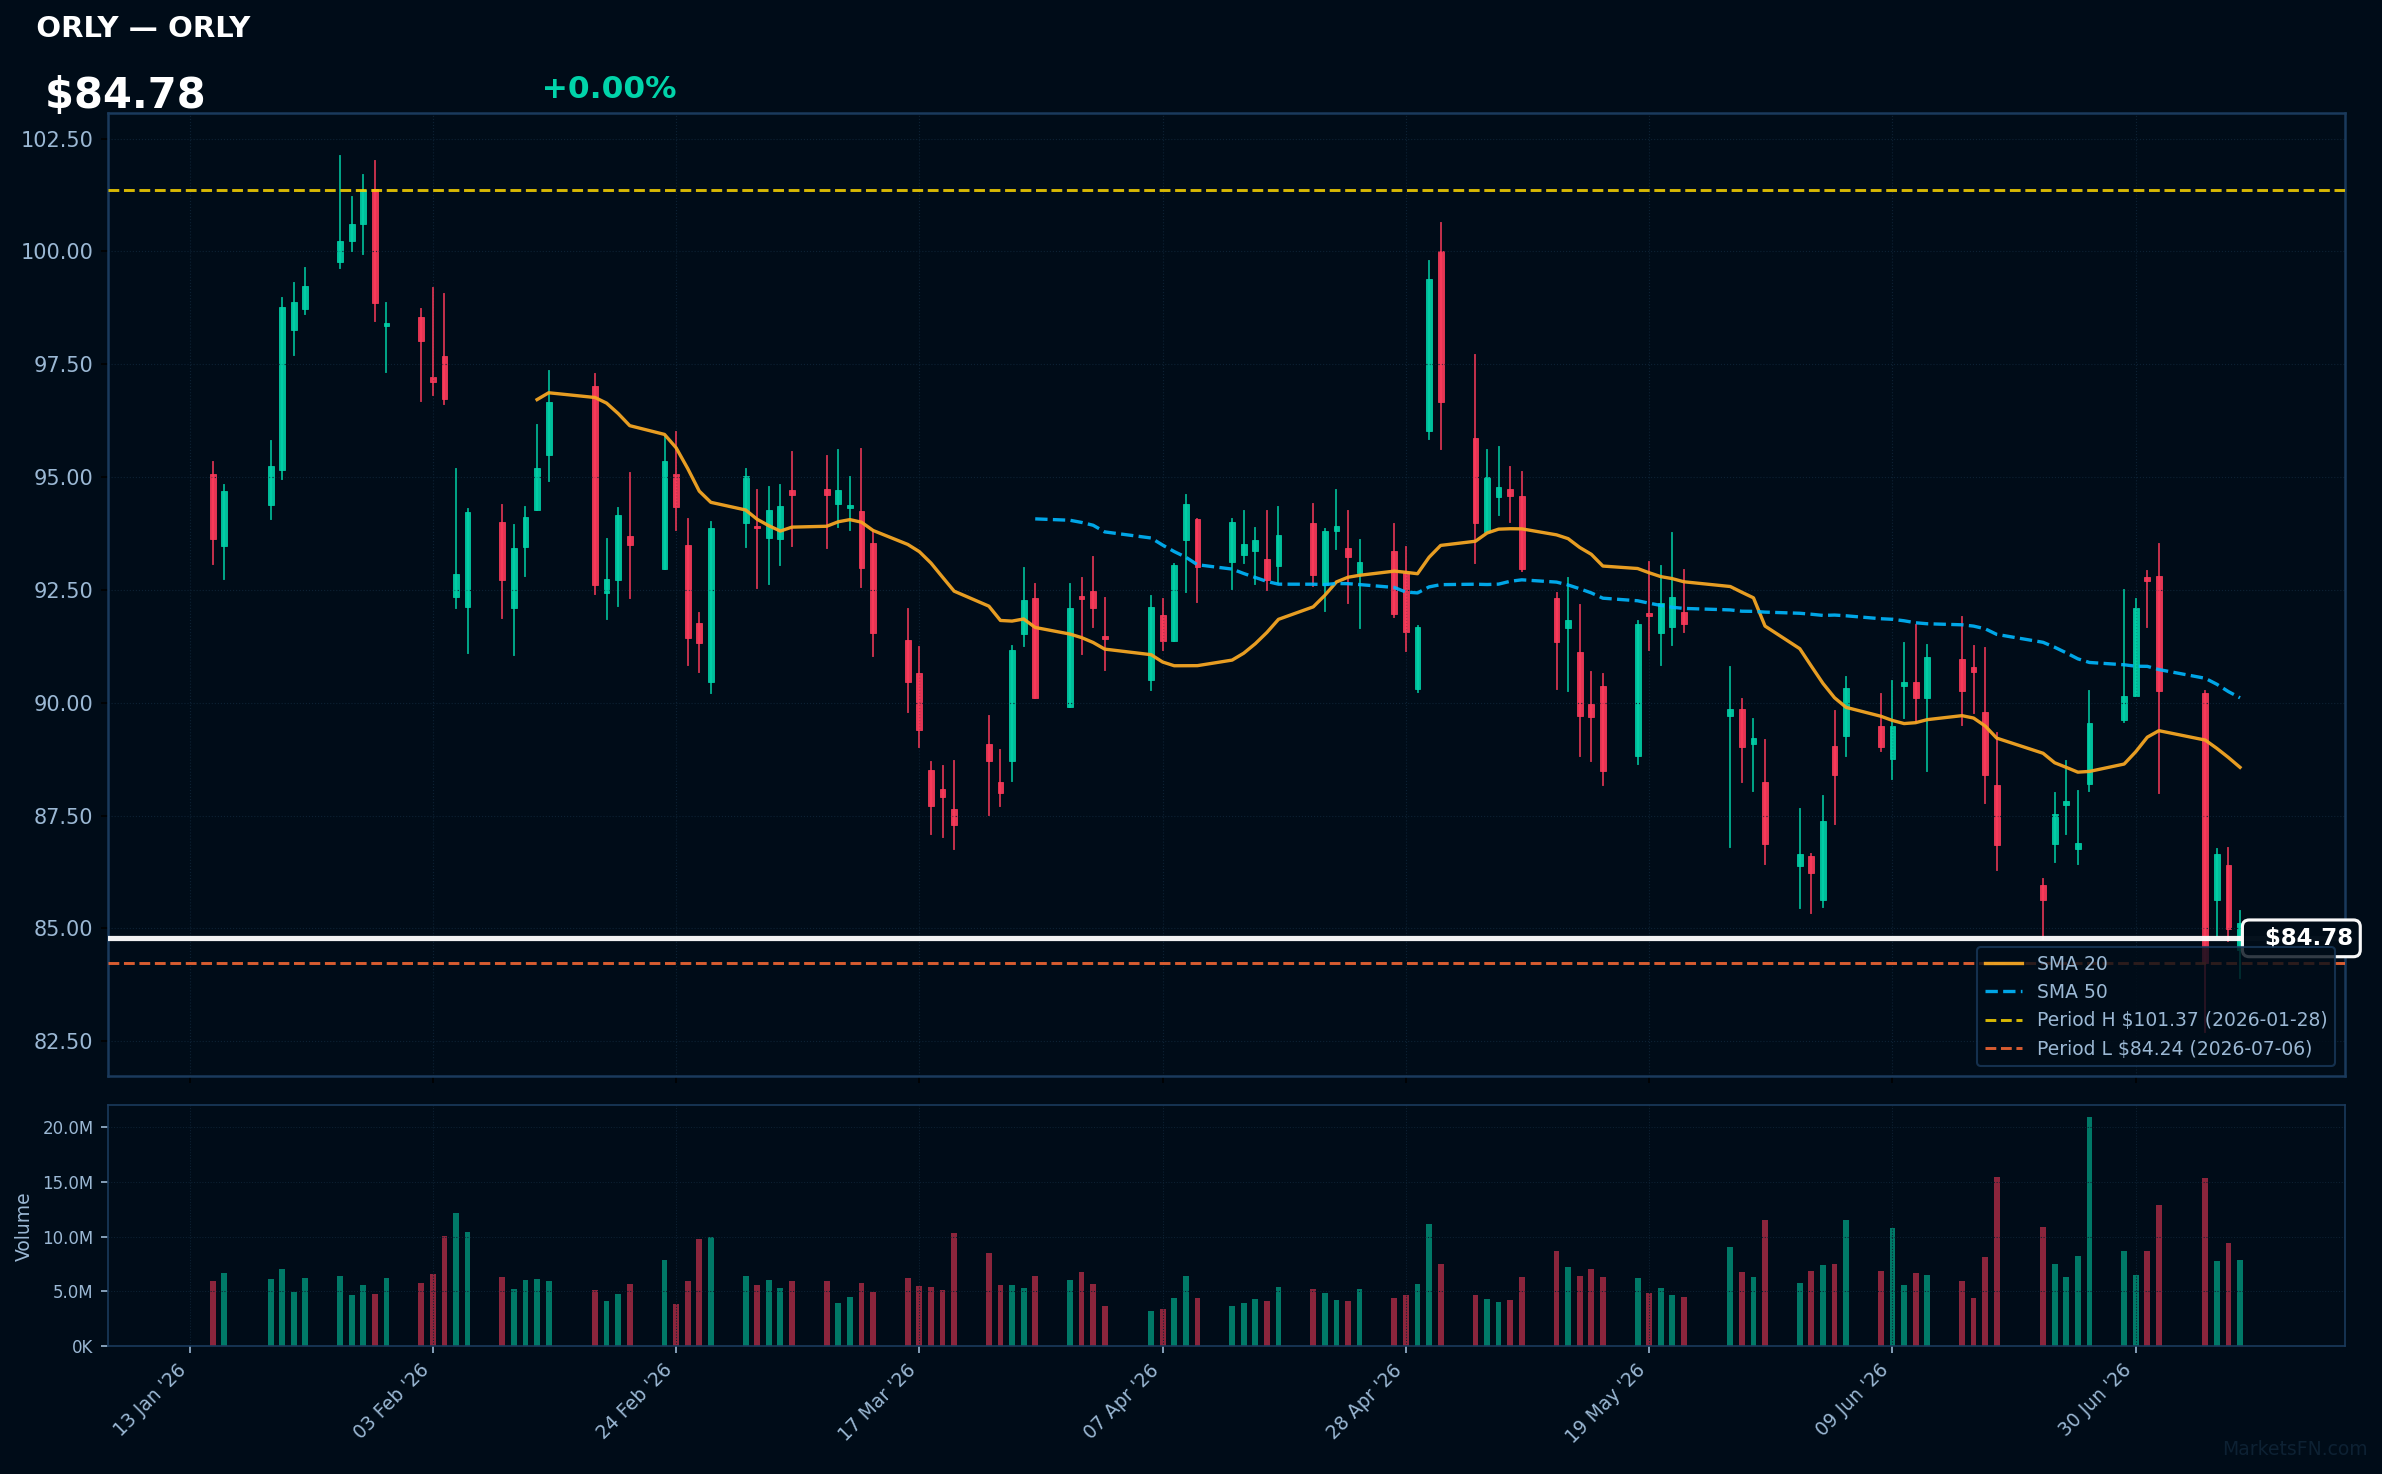
ORLY | O'Reilly Automotive, Inc | Consumer Cyclical | Price Last: $85.12 | % Realized: -5.78% | RSI: 40.7 | % above MA200: -9.8% | Trend: Below MA20, MA50, MA200
O'Reilly Automotive, Inc (ORLY) operates a network of retail stores selling automotive aftermarket parts, tools, and supplies. Investors care due to its market share and exposure to the large and relatively stable automotive repair industry.
ORLY's technicals indicate a sustained downtrend with price ($84.78) below MA20, MA50, and MA200. The RSI(14) is 40.7, nearing oversold territory. The stock is 1.0% above its 2026 YTD low, testing major support, with a -5.8% 2026 YTD return, signaling potential further downside.
Related headlines
- Why Did REE, HTZ, ORLY Stocks Slump To 52-Week Lows Today?
- O'Reilly Stock Sinks on Report of Possible NAPA Bid
- GPC Stock Pops 13%, ORLY Falls 5% OReilly Makes Cash Bid For Genuine Parts $10B Auto Unit, Says Report
- O'Reilly Automotive, Inc. Announces Dates for Its Second Quarter 2026 Earnings Release and Conference Call
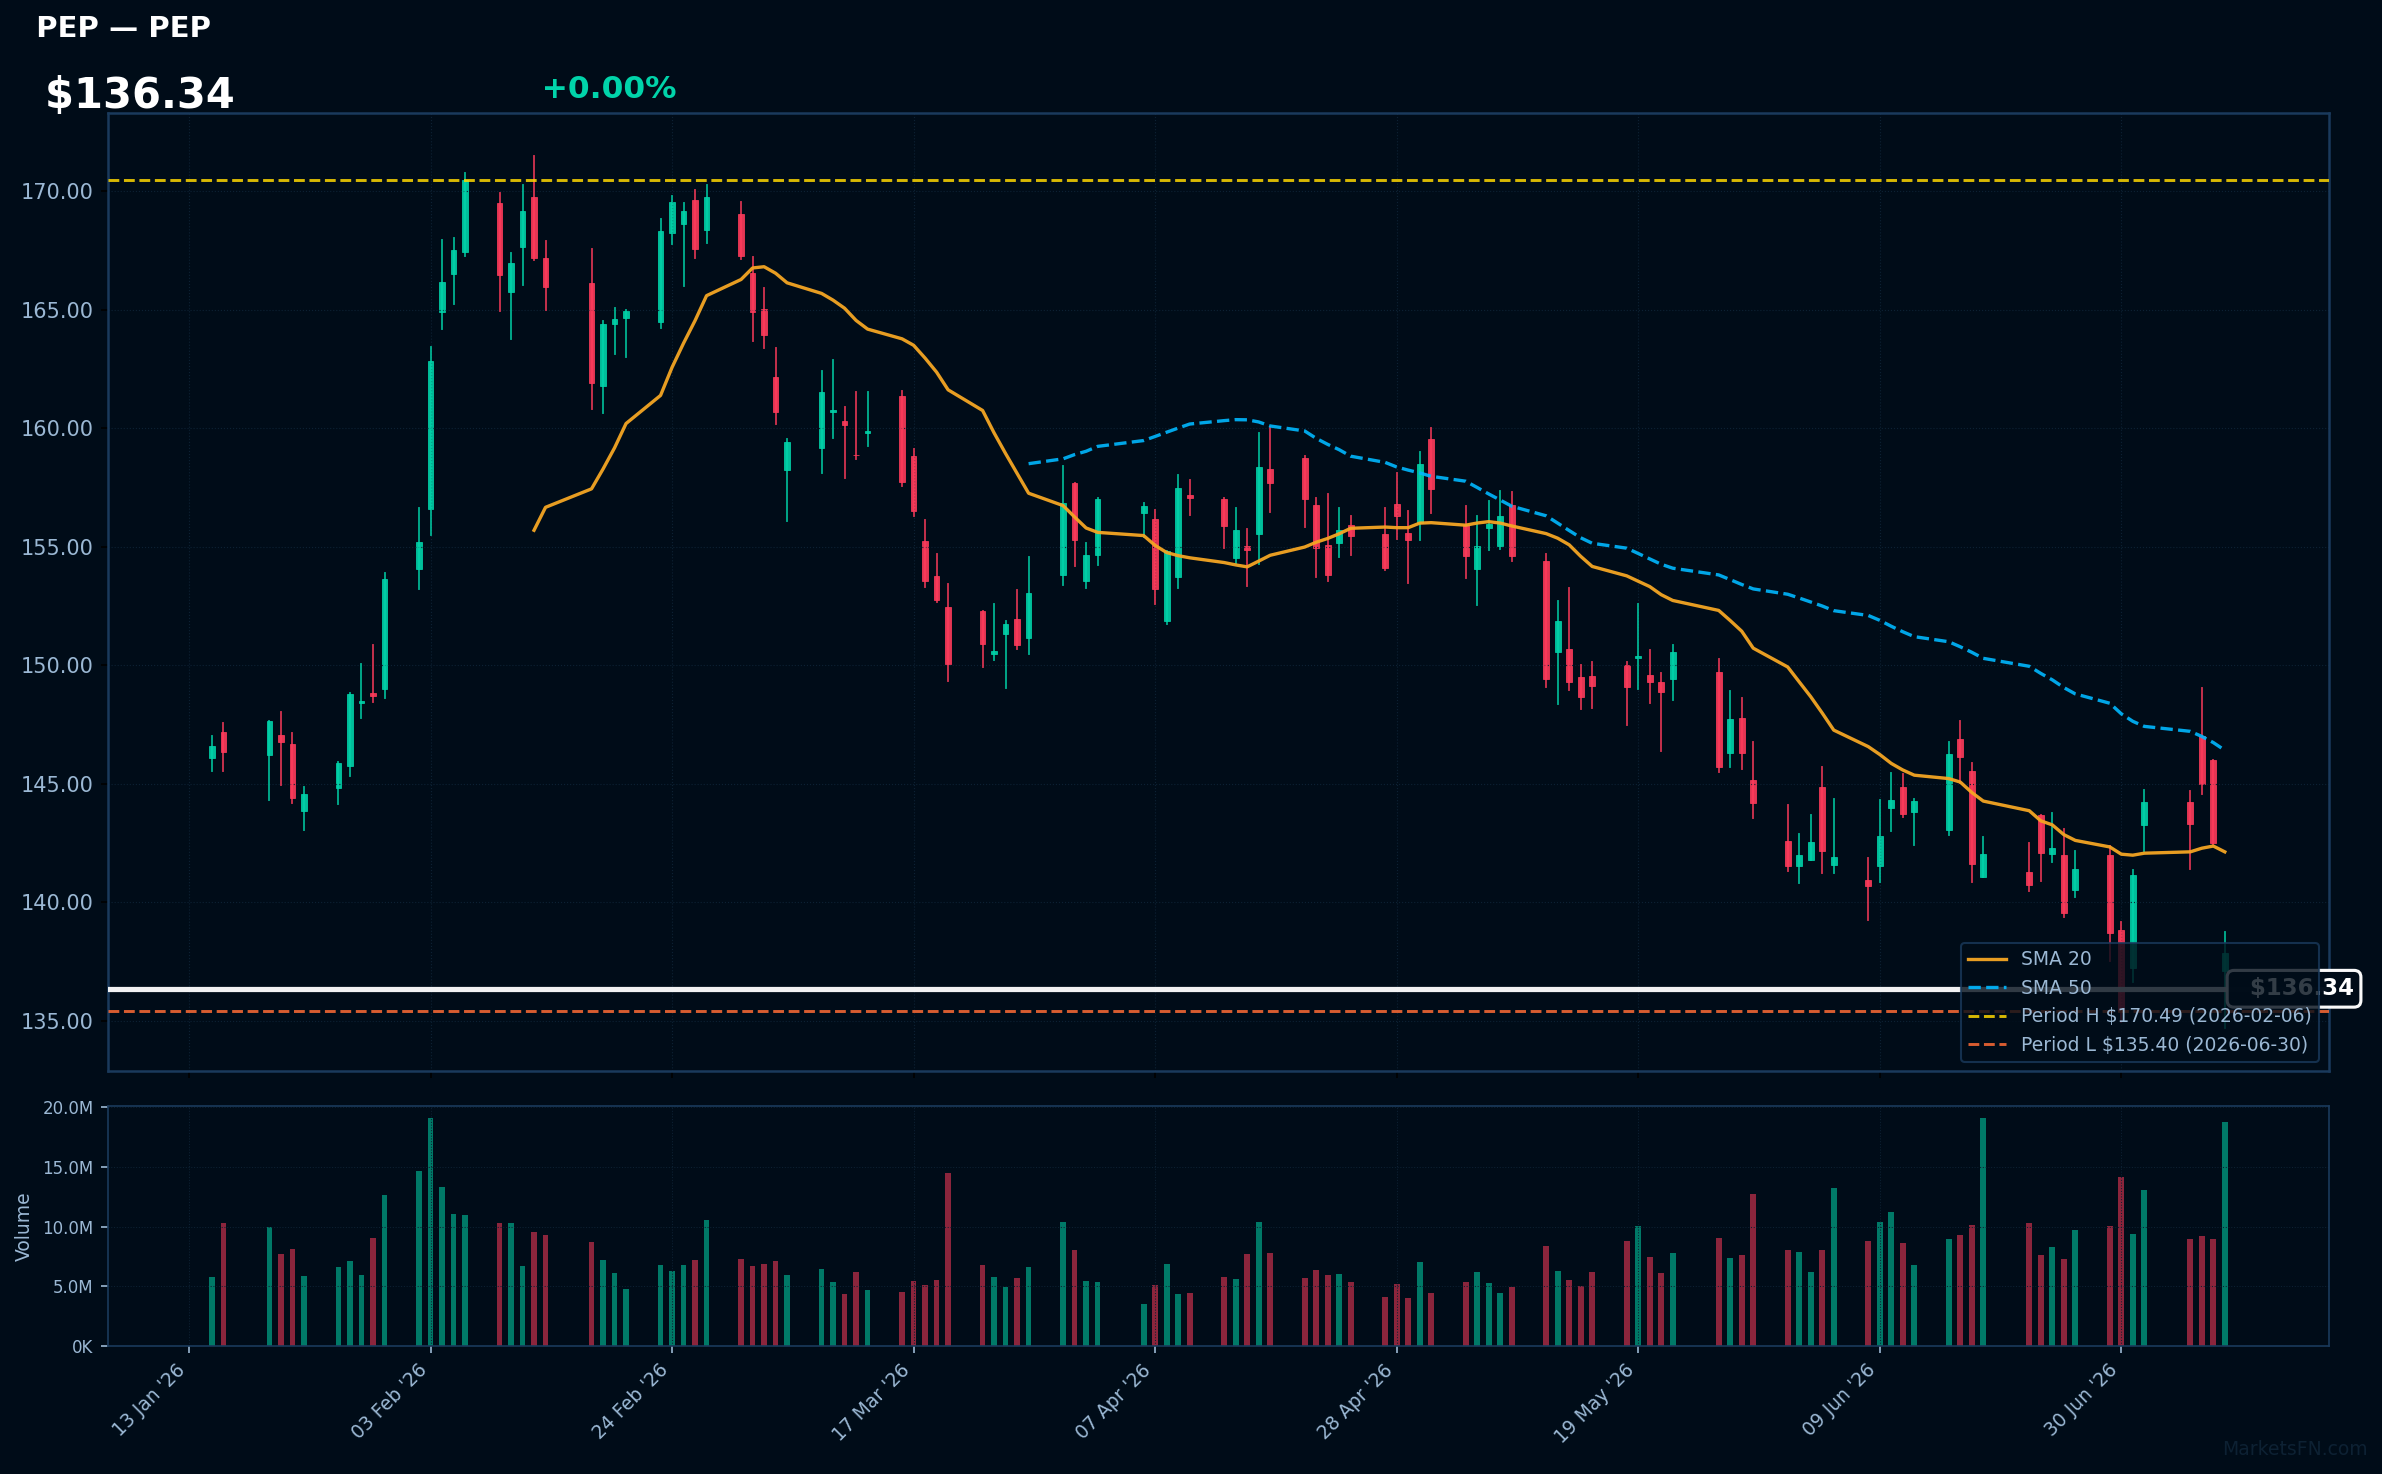
PEP | PepsiCo Inc | Consumer Defensive | Price Last: $137.86 | % Realized: -3.07% | RSI: 38.9 | % above MA200: -8.1% | Trend: Below MA20, MA50, MA200
PepsiCo Inc is a multinational food and beverage corporation that generates revenue through the sale of popular brands such as Pepsi, Lay's, and Gatorade, making it a significant player in the consumer staples sector, with investors caring about its stable cash flows and dividend yield.
PepsiCo's current technical situation indicates a sustained downtrend with price ($136.34) below MA20, MA50, and MA200, and an RSI(14) of 38.9, suggesting bearish momentum; the stock is testing major support, only 1.8% above its 2026 YTD low, a potential warning sign.
Related headlines
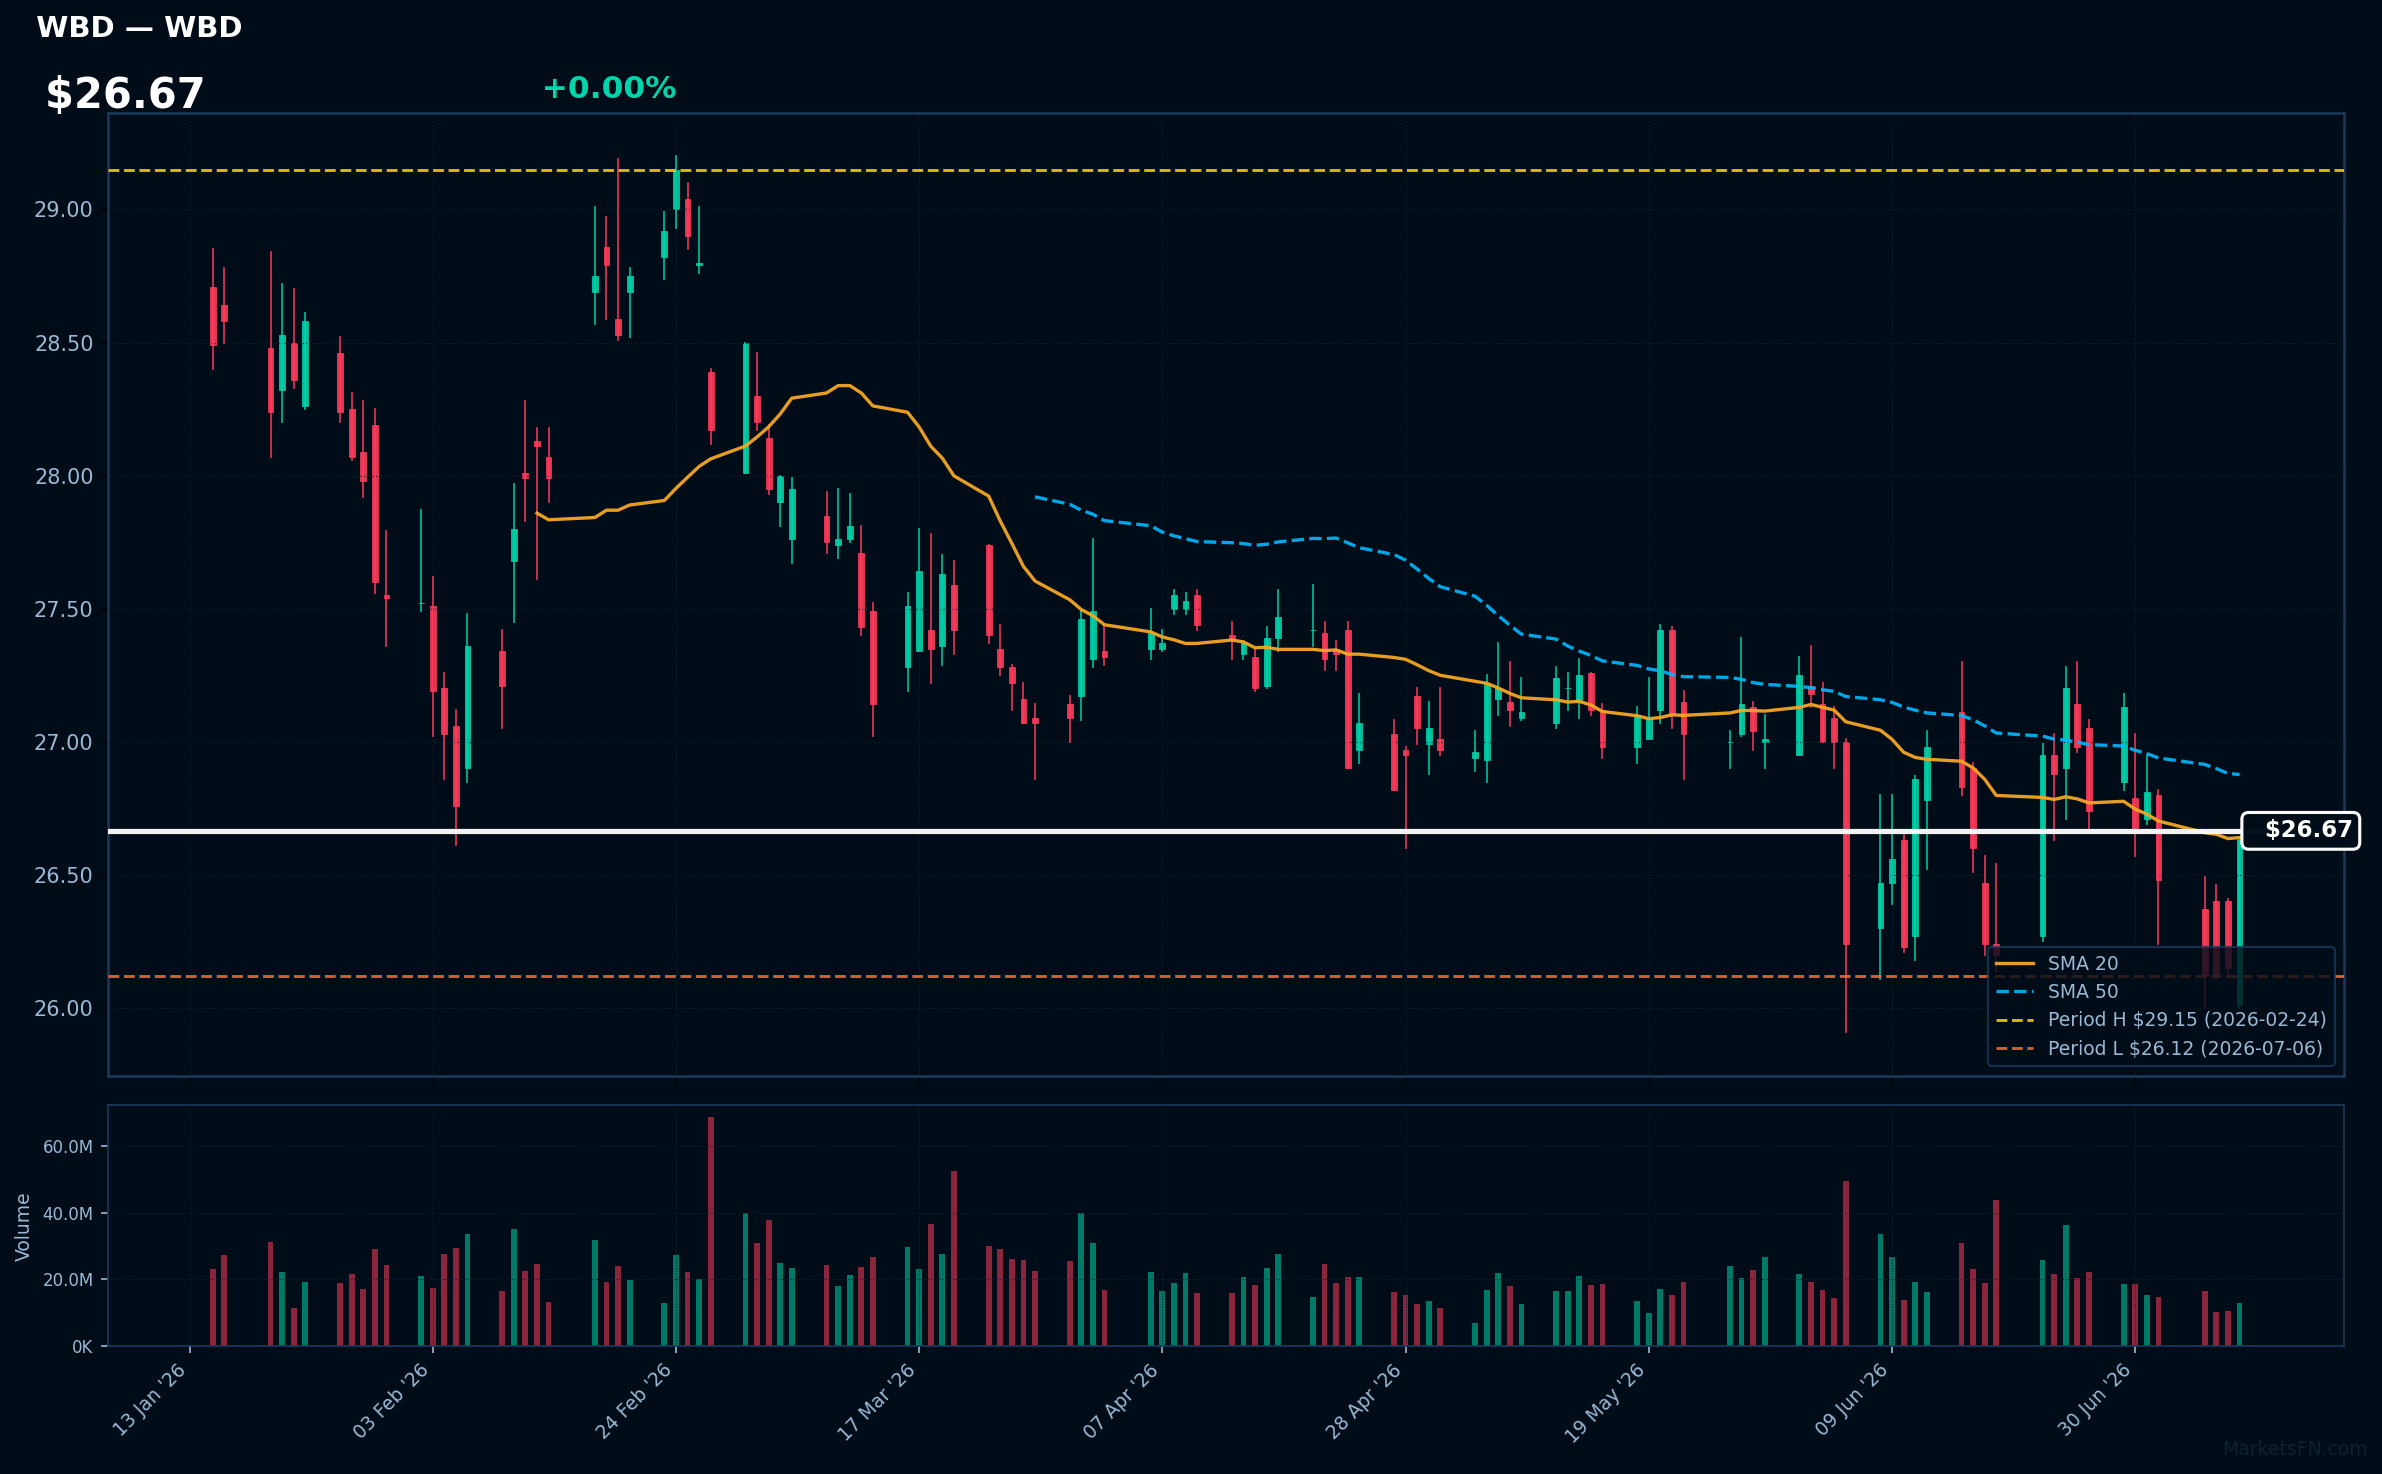
WBD | Warner Bros. Discovery Inc | Communication Services | Price Last: $26.63 | % Realized: -6.59% | RSI: 49.7 | % above MA200: +2.8% | Trend: Above MA200 · Below MA20, MA50
Warner Bros. Discovery Inc is a media conglomerate owning major entertainment brands such as HBO, Warner Bros., and Discovery Channel, generating revenue through content creation, distribution, and advertising. Investors care about its content pipeline and streaming growth.
WBD's technicals show mixed signals: RSI(14) at 49.7 indicates neutral momentum, with price above MA20/MA200 but below MA50. The stock is 2.0% above its 2026 YTD low, testing major support, and has returned -6.6% YTD, indicating potential weakness.
Related headlines
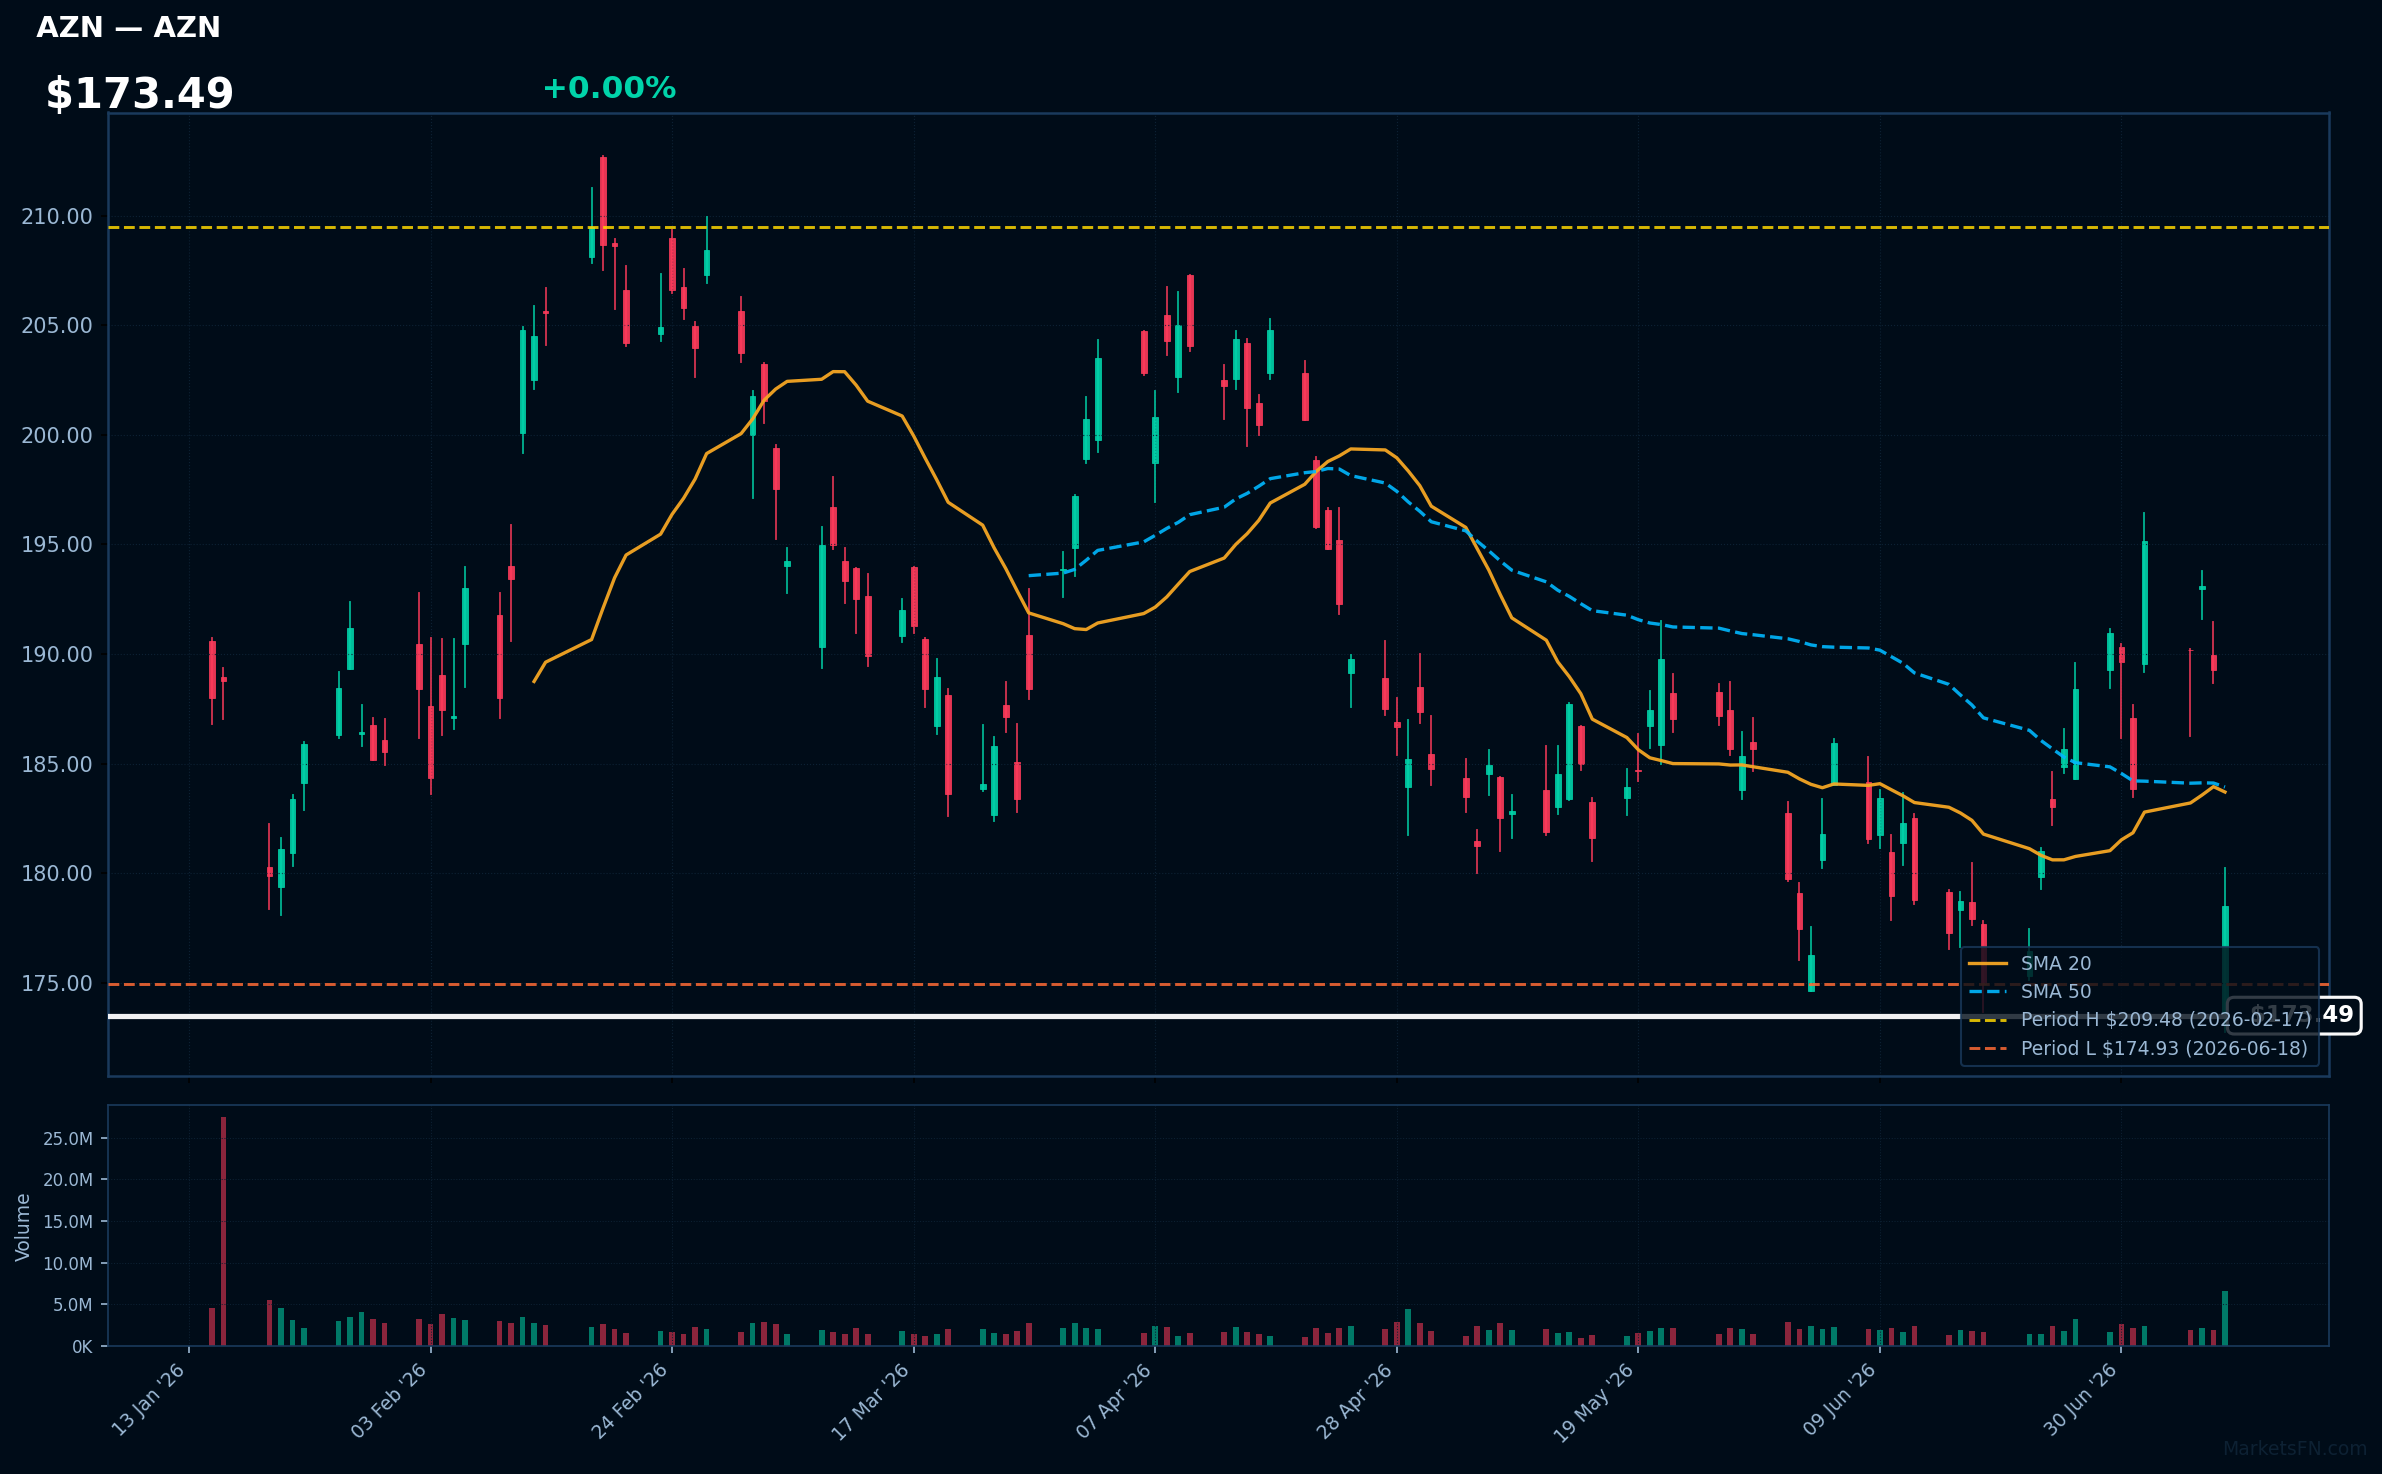
AZN | Astrazeneca plc ADR | Healthcare | Price Last: $178.49 | % Realized: -2.54% | RSI: 39.7 | % above MA200: -3.1% | Trend: Below MA20, MA50, MA200
Astrazeneca plc ADR is a biopharmaceutical company that discovers, develops, and commercializes prescription medicines. Investors should care about its pipeline and product portfolio, particularly for treatments in oncology, cardiovascular, and respiratory diseases, which drive revenue growth.
Astrazeneca plc ADR's current technical situation is bearish, with an RSI(14) of 39.7 indicating weakening momentum. The sustained downtrend is evident as the price ($173.49) is below MA20, MA50, and MA200, and is 2.0% above its 2026 YTD low, testing major support.
Related headlines
Market Commentary
The Nasdaq 100 stocks listed are near their 2026 year-to-date (YTD) extremes, with some at their highs and others at their lows. Stocks like AAPL, CSX, FTNT, and EA are at their 2026 YTD highs, indicating strong performance, while CPRT, ORLY, PEP, WBD, and AZN are near their YTD lows, having risen slightly above them.
The technology sector and related stocks are influenced by various macro conditions and themes. The stocks at their YTD highs, such as AAPL and FTNT, may be driven by factors like innovation, demand for their products, and overall market sentiment. Conversely, those near their lows may be impacted by sector-specific challenges or broader economic concerns.
Investors and traders should monitor these stocks' movements and the factors driving them. Key areas to watch include the overall Nasdaq 100 performance, sector-specific news, and macroeconomic indicators that could influence these stocks' trajectories. As the year progresses, observing whether these stocks continue near their extremes or move away from them will be crucial for understanding market trends and making informed investment decisions.
Methodology: All 101 Nasdaq 100 constituents screened. Close prices downloaded from 2026-01-01. Period high = highest close since Jan 1 2026; period low = lowest close since Jan 1 2026. Distance = (current price / period extreme − 1) × 100. Technical indicators computed on up to 1 year of daily OHLCV data.
Disclaimer: For informational purposes only. Not investment advice. Past performance is not indicative of future results.

