S&P 500 52-Week Highs & Lows Radar: Arista Networks (ANET), EQT (EQT) and more
MarketsFN Team

S&P 500 52-Week Highs & Lows Radar: Arista Networks (ANET), EQT (EQT) and more
Screening all 503 S&P 500 constituents for stocks nearest to their 52-week high and their 52-week low. Data as of July 10, 2026. % Realized = 52-week total return.
Legend: RSI > 70 = overbought · RSI < 30 = oversold · Green % Realized = positive 52W return · Red = negative.
📈 Nearest to 52-Week High
Sectors represented: Technology (1), Industrials (1), Consumer Cyclical (1), Financial (1), Energy (1)
| Ticker | Company | Sector | Price Last | % Realized | 52-Week High Date | RSI | % above MA200 | Trend |
|---|---|---|---|---|---|---|---|---|
| ANET | Arista Networks Inc | Technology | $185.94 | +74.94% | 2026-07-10 | 62.3 | +29.2% | Above MA20, MA50, MA200 |
| UNP | Union Pacific Corp | Industrials | $285.91 | +20.64% | 2026-07-10 | 67.1 | +16.2% | Above MA20, MA50, MA200 |
| SBUX | Starbucks Corp | Consumer Cyclical | $107.14 | +12.60% | 2026-07-10 | 63.8 | +14.9% | Above MA20, MA50, MA200 |
| AFL | Aflac Inc | Financial | $122.16 | +19.44% | 2026-07-10 | 63.6 | +8.8% | Above MA20, MA50, MA200 |
| MPC | Marathon Petroleum Corp | Energy | $285.43 | +56.61% | 2026-07-10 | 70.4 | +34.0% | Above MA20, MA50, MA200 |
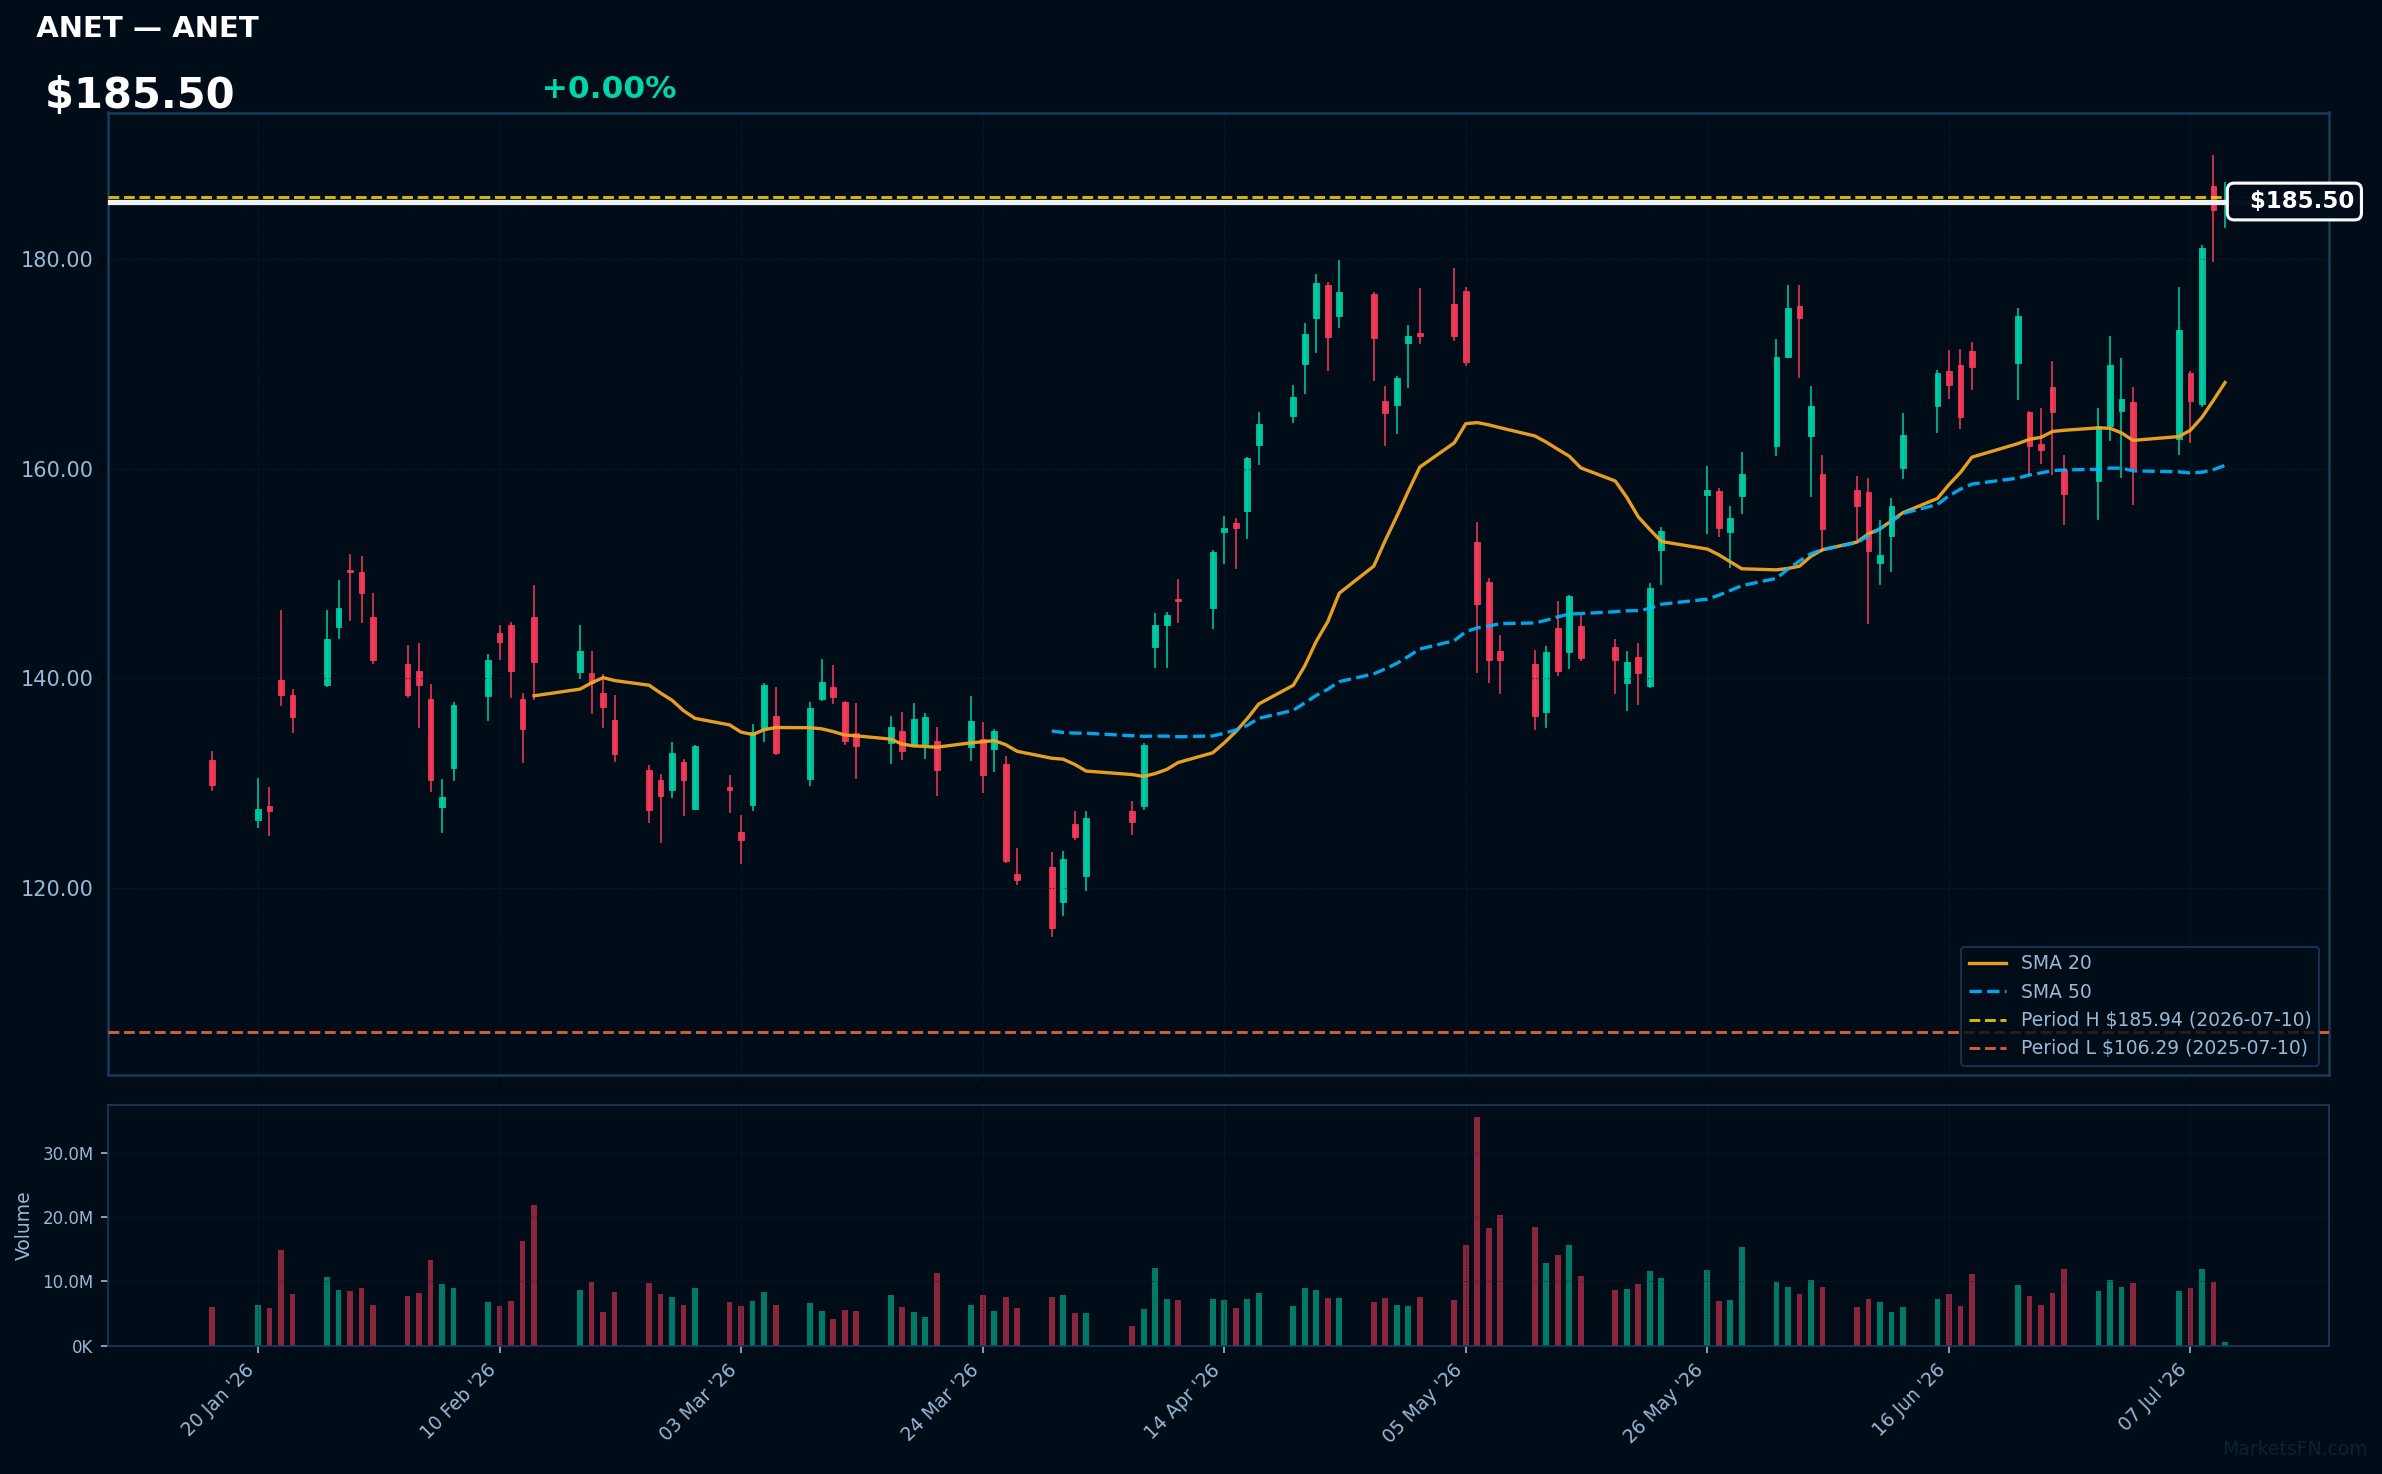
ANET | Arista Networks Inc | Technology | Price Last: $185.94 | % Realized: +74.94% | RSI: 62.3 | % above MA200: +29.2% | Trend: Above MA20, MA50, MA200
Arista Networks Inc is a cloud networking company providing high-performance switching solutions for data centers. Investors should care because its products enable scalable, efficient data center operations, driving demand from cloud providers and large enterprises.
Arista Networks Inc is in a sustained uptrend with price ($185.50) above MA20 > MA50 > MA200. RSI(14) is 62.3, nearing overbought territory. The stock is 0.0% below its 52-Week high, indicating potential breakout momentum.
Related headlines
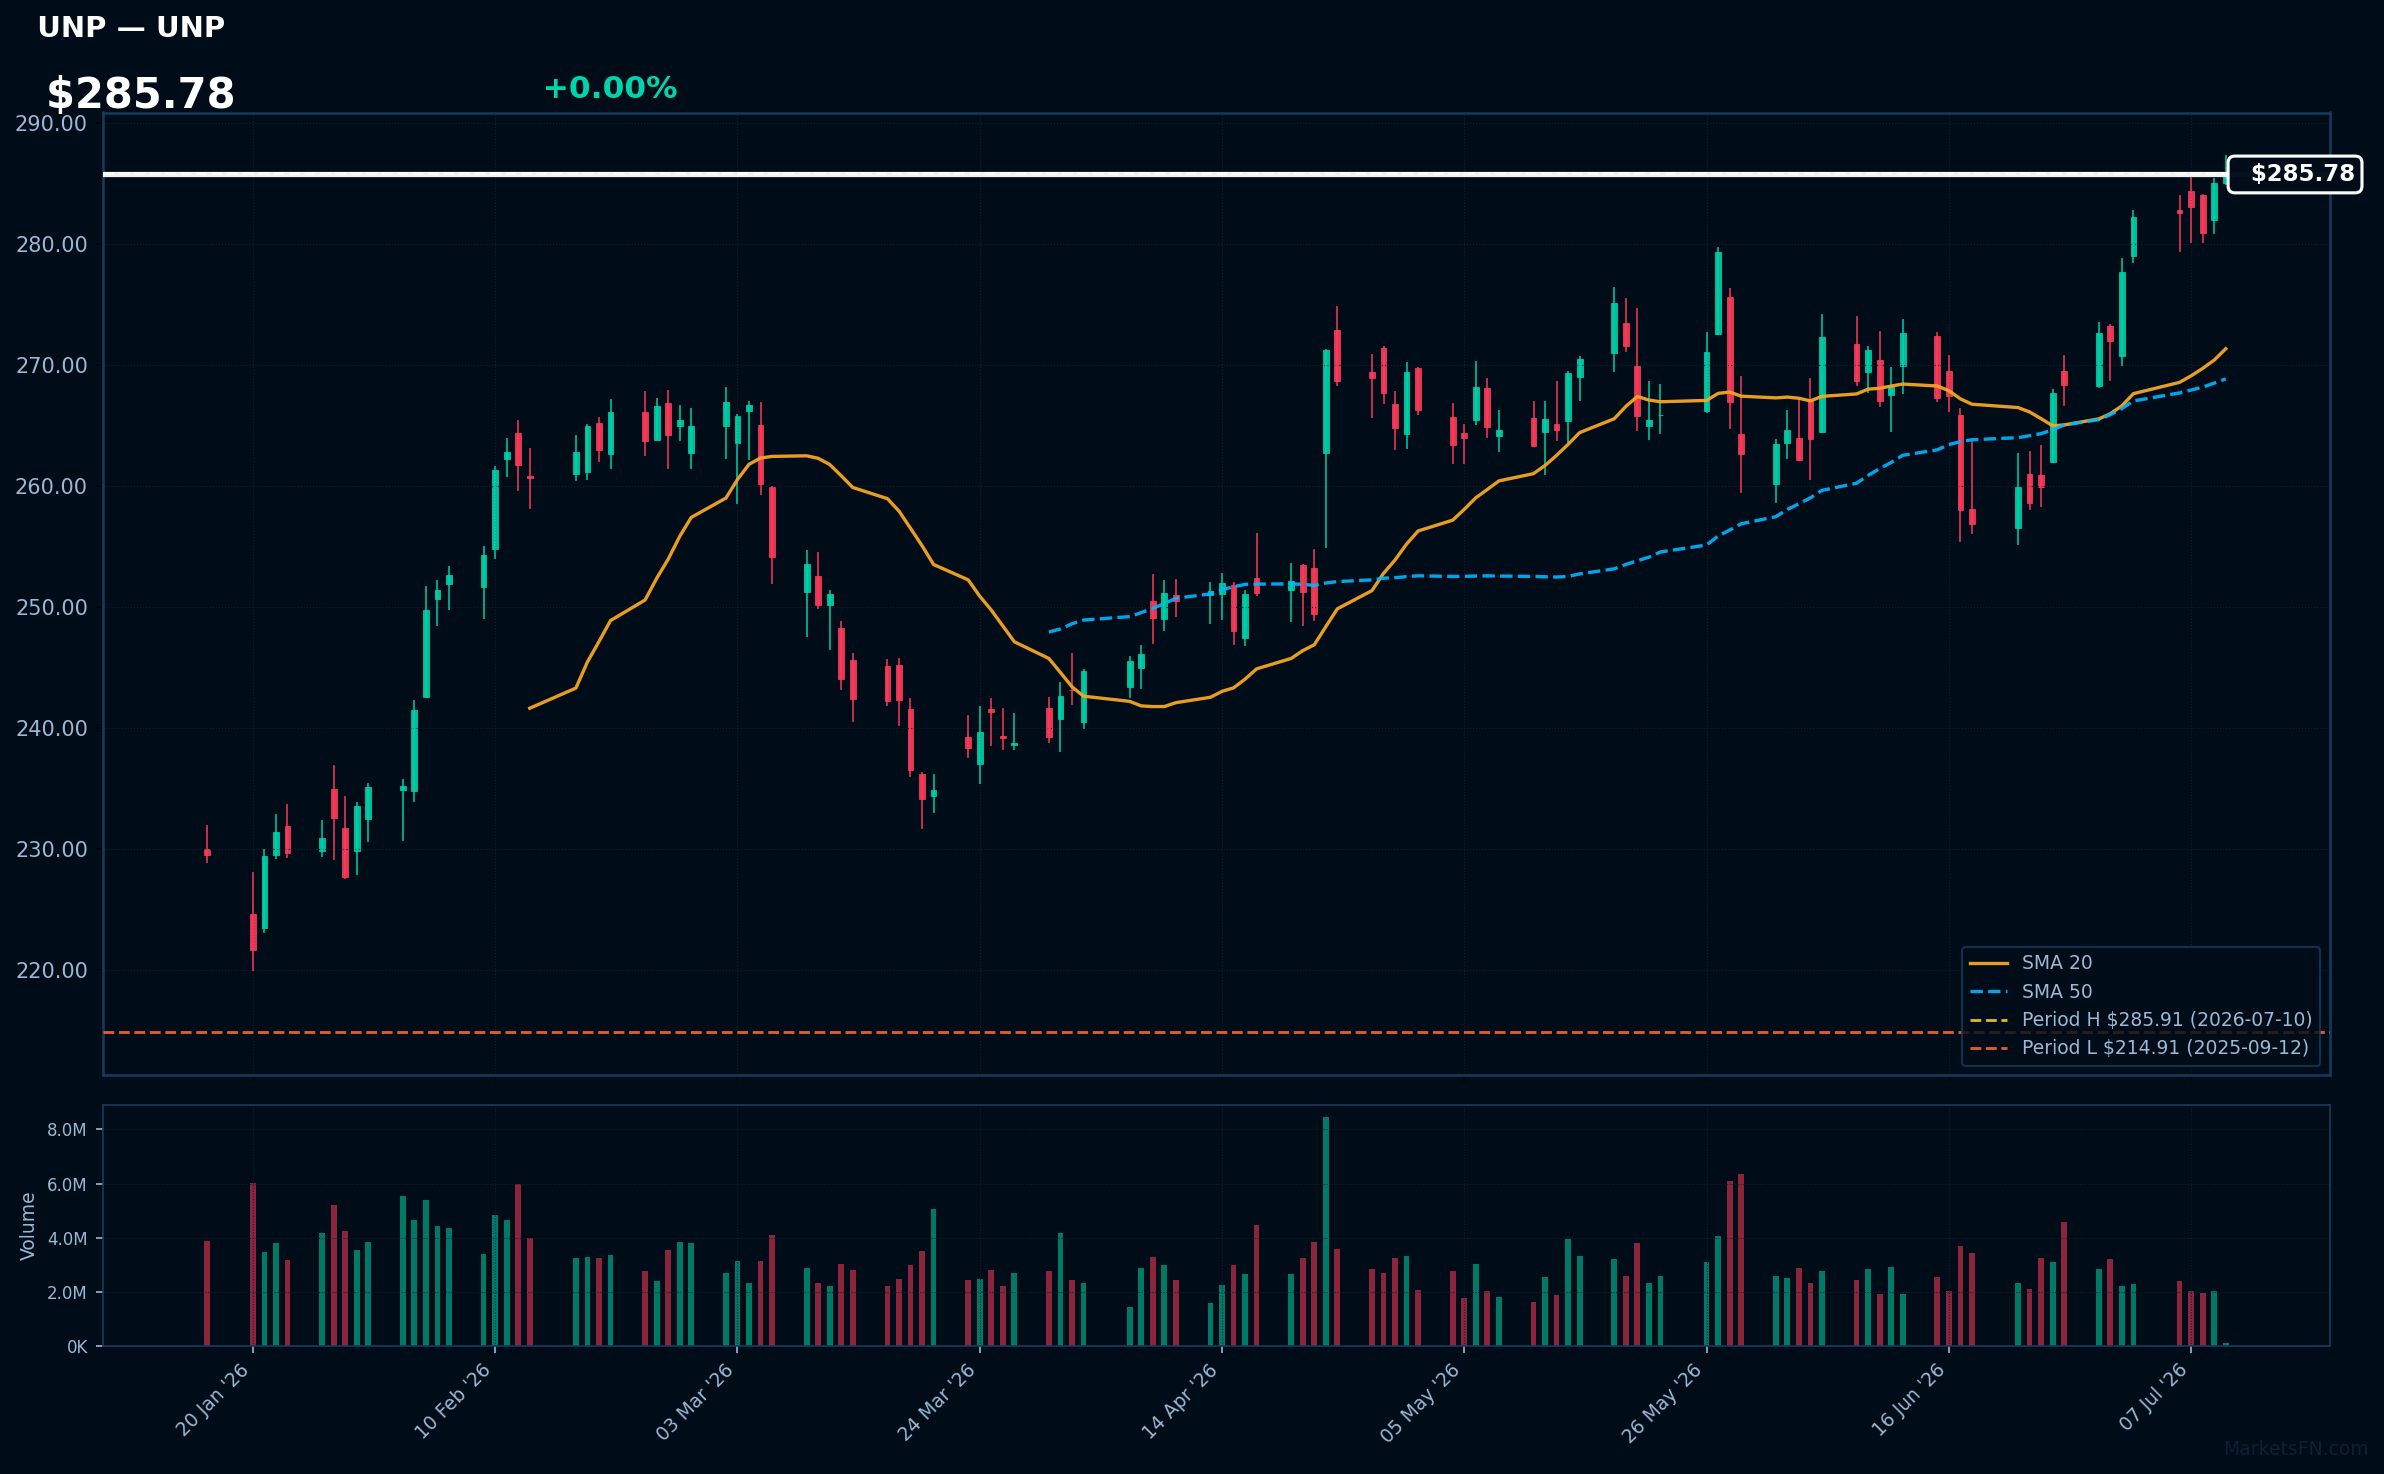
UNP | Union Pacific Corp | Industrials | Price Last: $285.91 | % Realized: +20.64% | RSI: 67.1 | % above MA200: +16.2% | Trend: Above MA20, MA50, MA200
Union Pacific Corp (UNP) operates North America's largest railroad network, transporting goods like coal, intermodal containers, and automotive products. Investors care about its efficiency, pricing power, and volume growth, which drive revenue and profitability.
UNP's technicals indicate sustained uptrend with price > MA20 > MA50 > MA200, RSI(14) at 67.1, and 0.0% below 52-Week high, suggesting momentum with no immediate signs of overbought conditions or reversal.
Related headlines
- EXCLUSIVE: Union Pacific, Norfolk Southern CEOs talk about the rail merger that could reshape the U.S. economy
- Union Pacific, Norfolk Southern submit more merger data
- Union Pacific and Norfolk Southern Respond to STB's Request for Supplemental Information, Submitting First Round of Their Responses
- Union Pacific and Norfolk Southern Celebrate Americas 250th Anniversary with Worlds Largest Steam Locomotive in Philadelphia
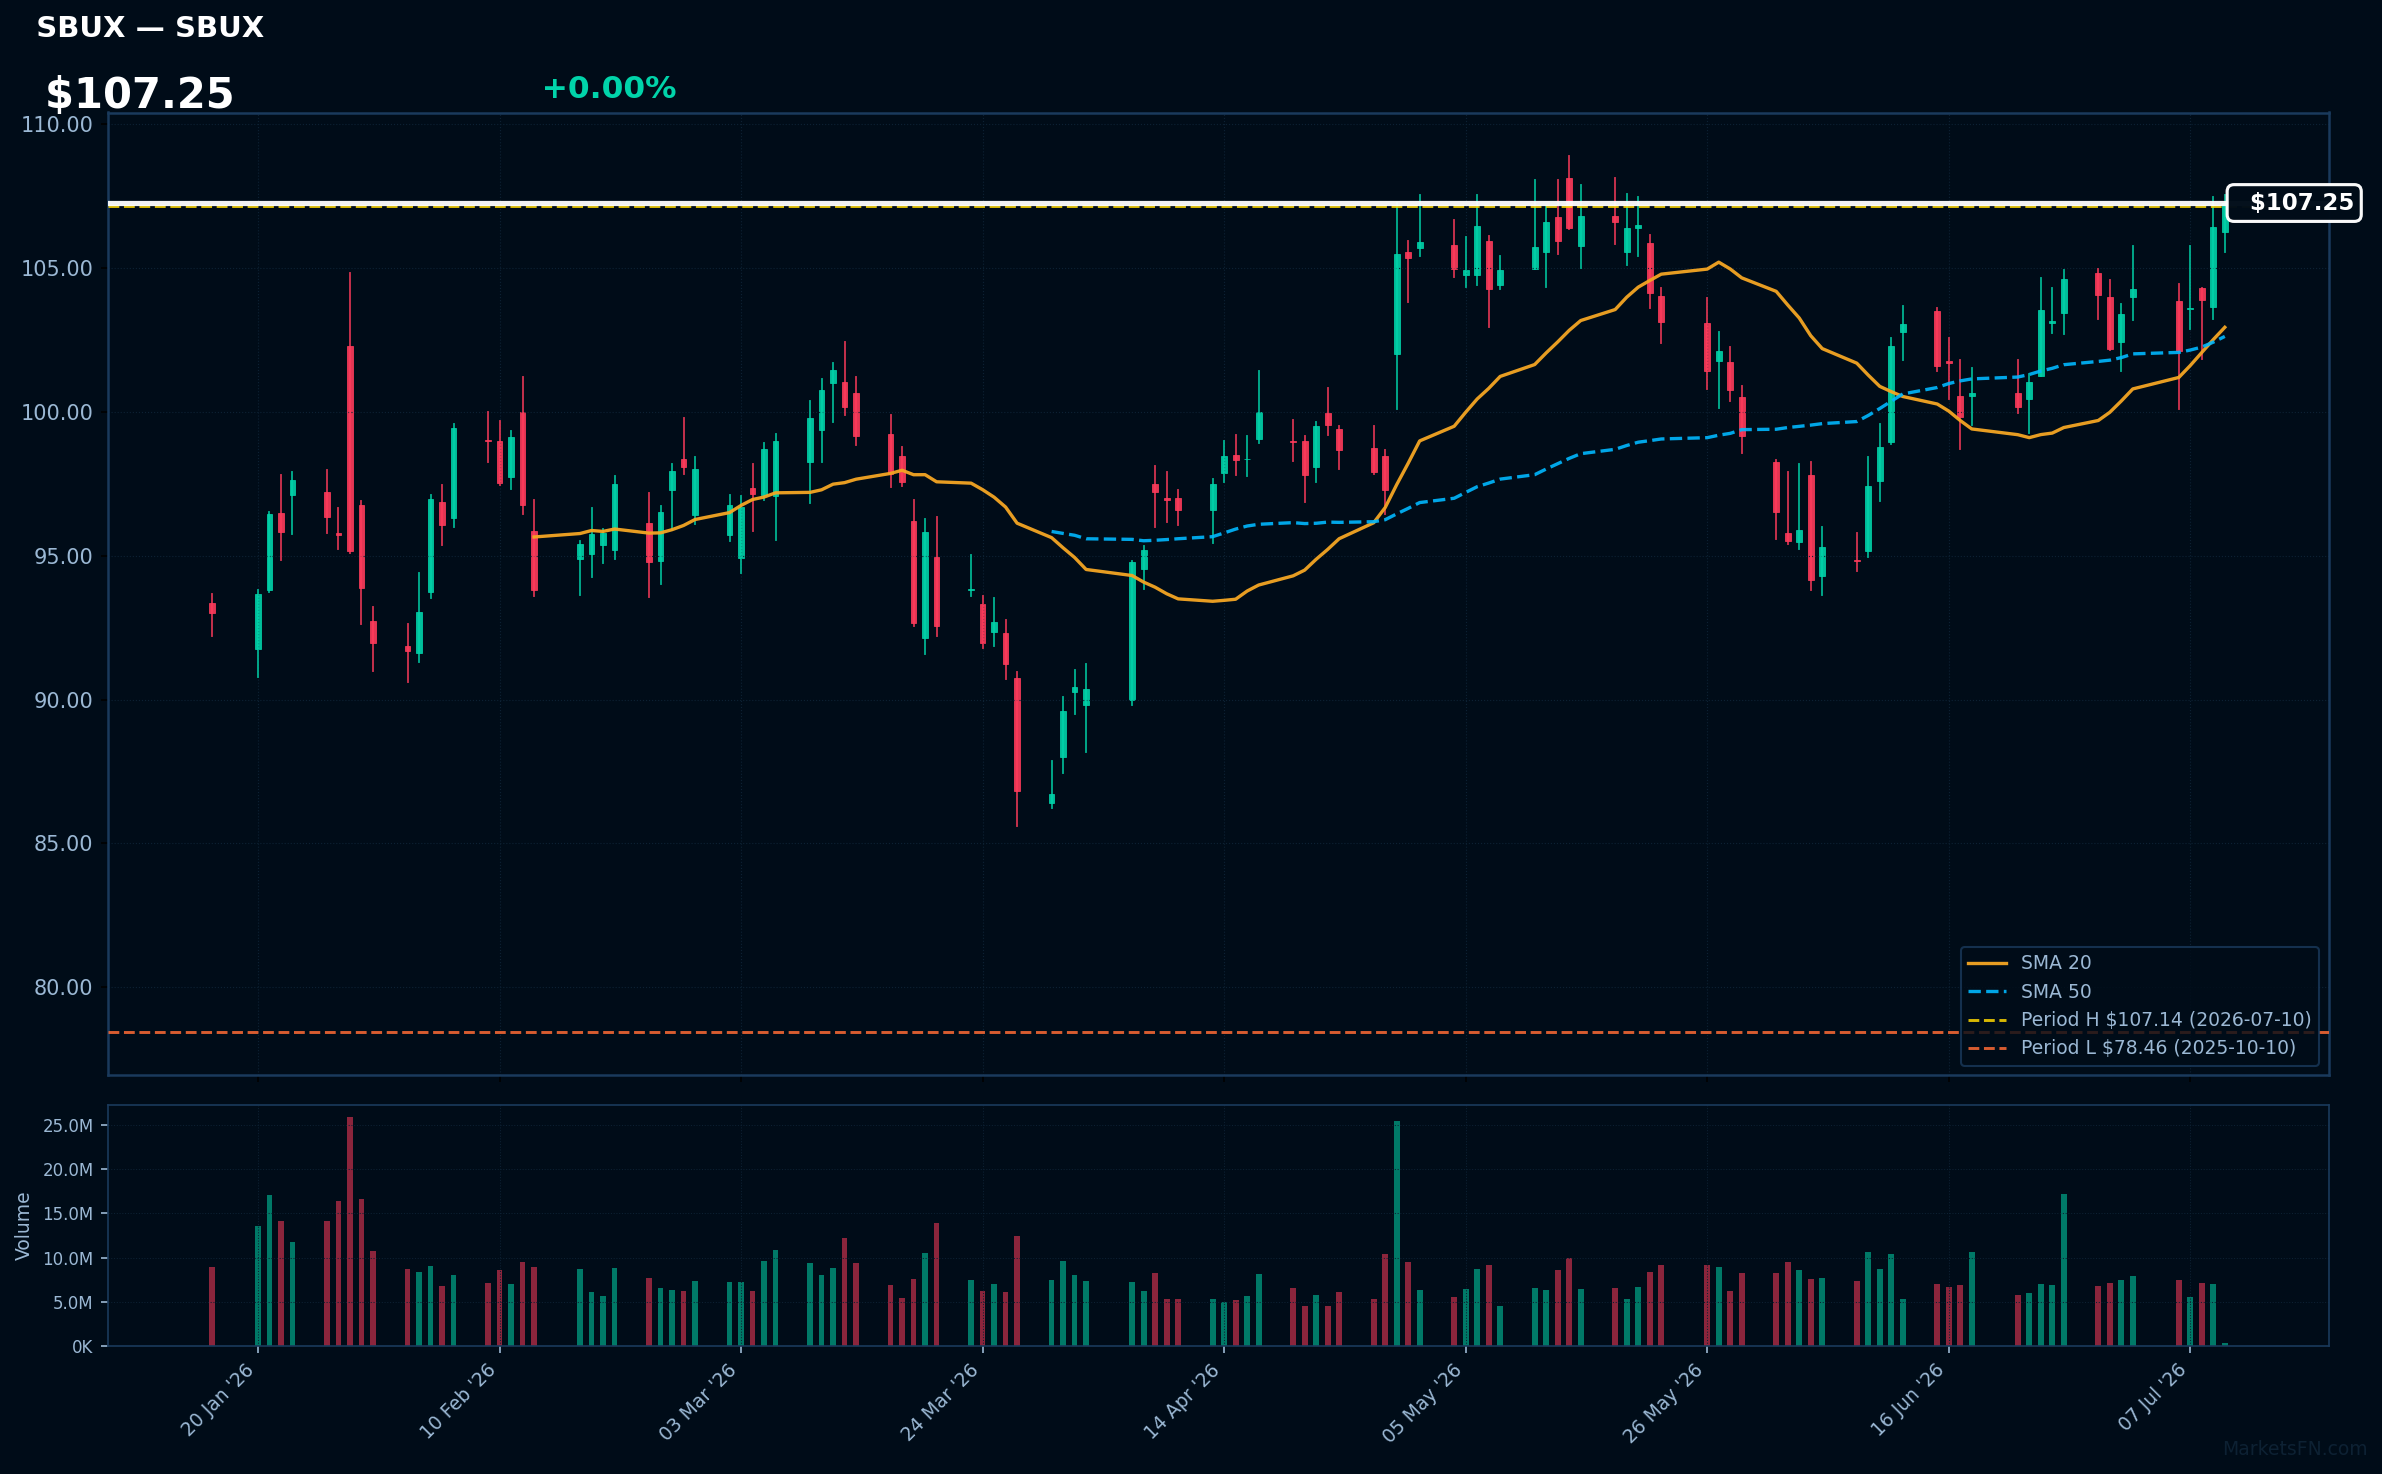
SBUX | Starbucks Corp | Consumer Cyclical | Price Last: $107.14 | % Realized: +12.60% | RSI: 63.8 | % above MA200: +14.9% | Trend: Above MA20, MA50, MA200
Starbucks Corp operates a global chain of coffeehouses, offering a wide range of coffee beverages and food products. Investors should care about its ability to maintain brand loyalty and expand its customer base, driving revenue growth.
The stock is in a sustained uptrend with price > MA20 > MA50 > MA200, RSI(14) at 63.8, and is 0.0% below its 52-Week high, indicating strong momentum with no clear warning signs.
Related headlines
- S&P 500, Nasdaq, Dow End Higher Led By Chipmaker Stocks As Investors Look Past US-Iran Hostility ORCL, SBUX, WULF, PANW, FATE In Focus
- SBUX Stock Set For Best Day In Two Months Starbucks Steps Up AI Push To Cut Reliance On MSFT, IBM
- Starbucks Targets $400 Million Software Spend With AI Shift
- Starbucks Develops AI Software to Reduce Reliance on Microsoft and IBM, Report Says (SBUX)
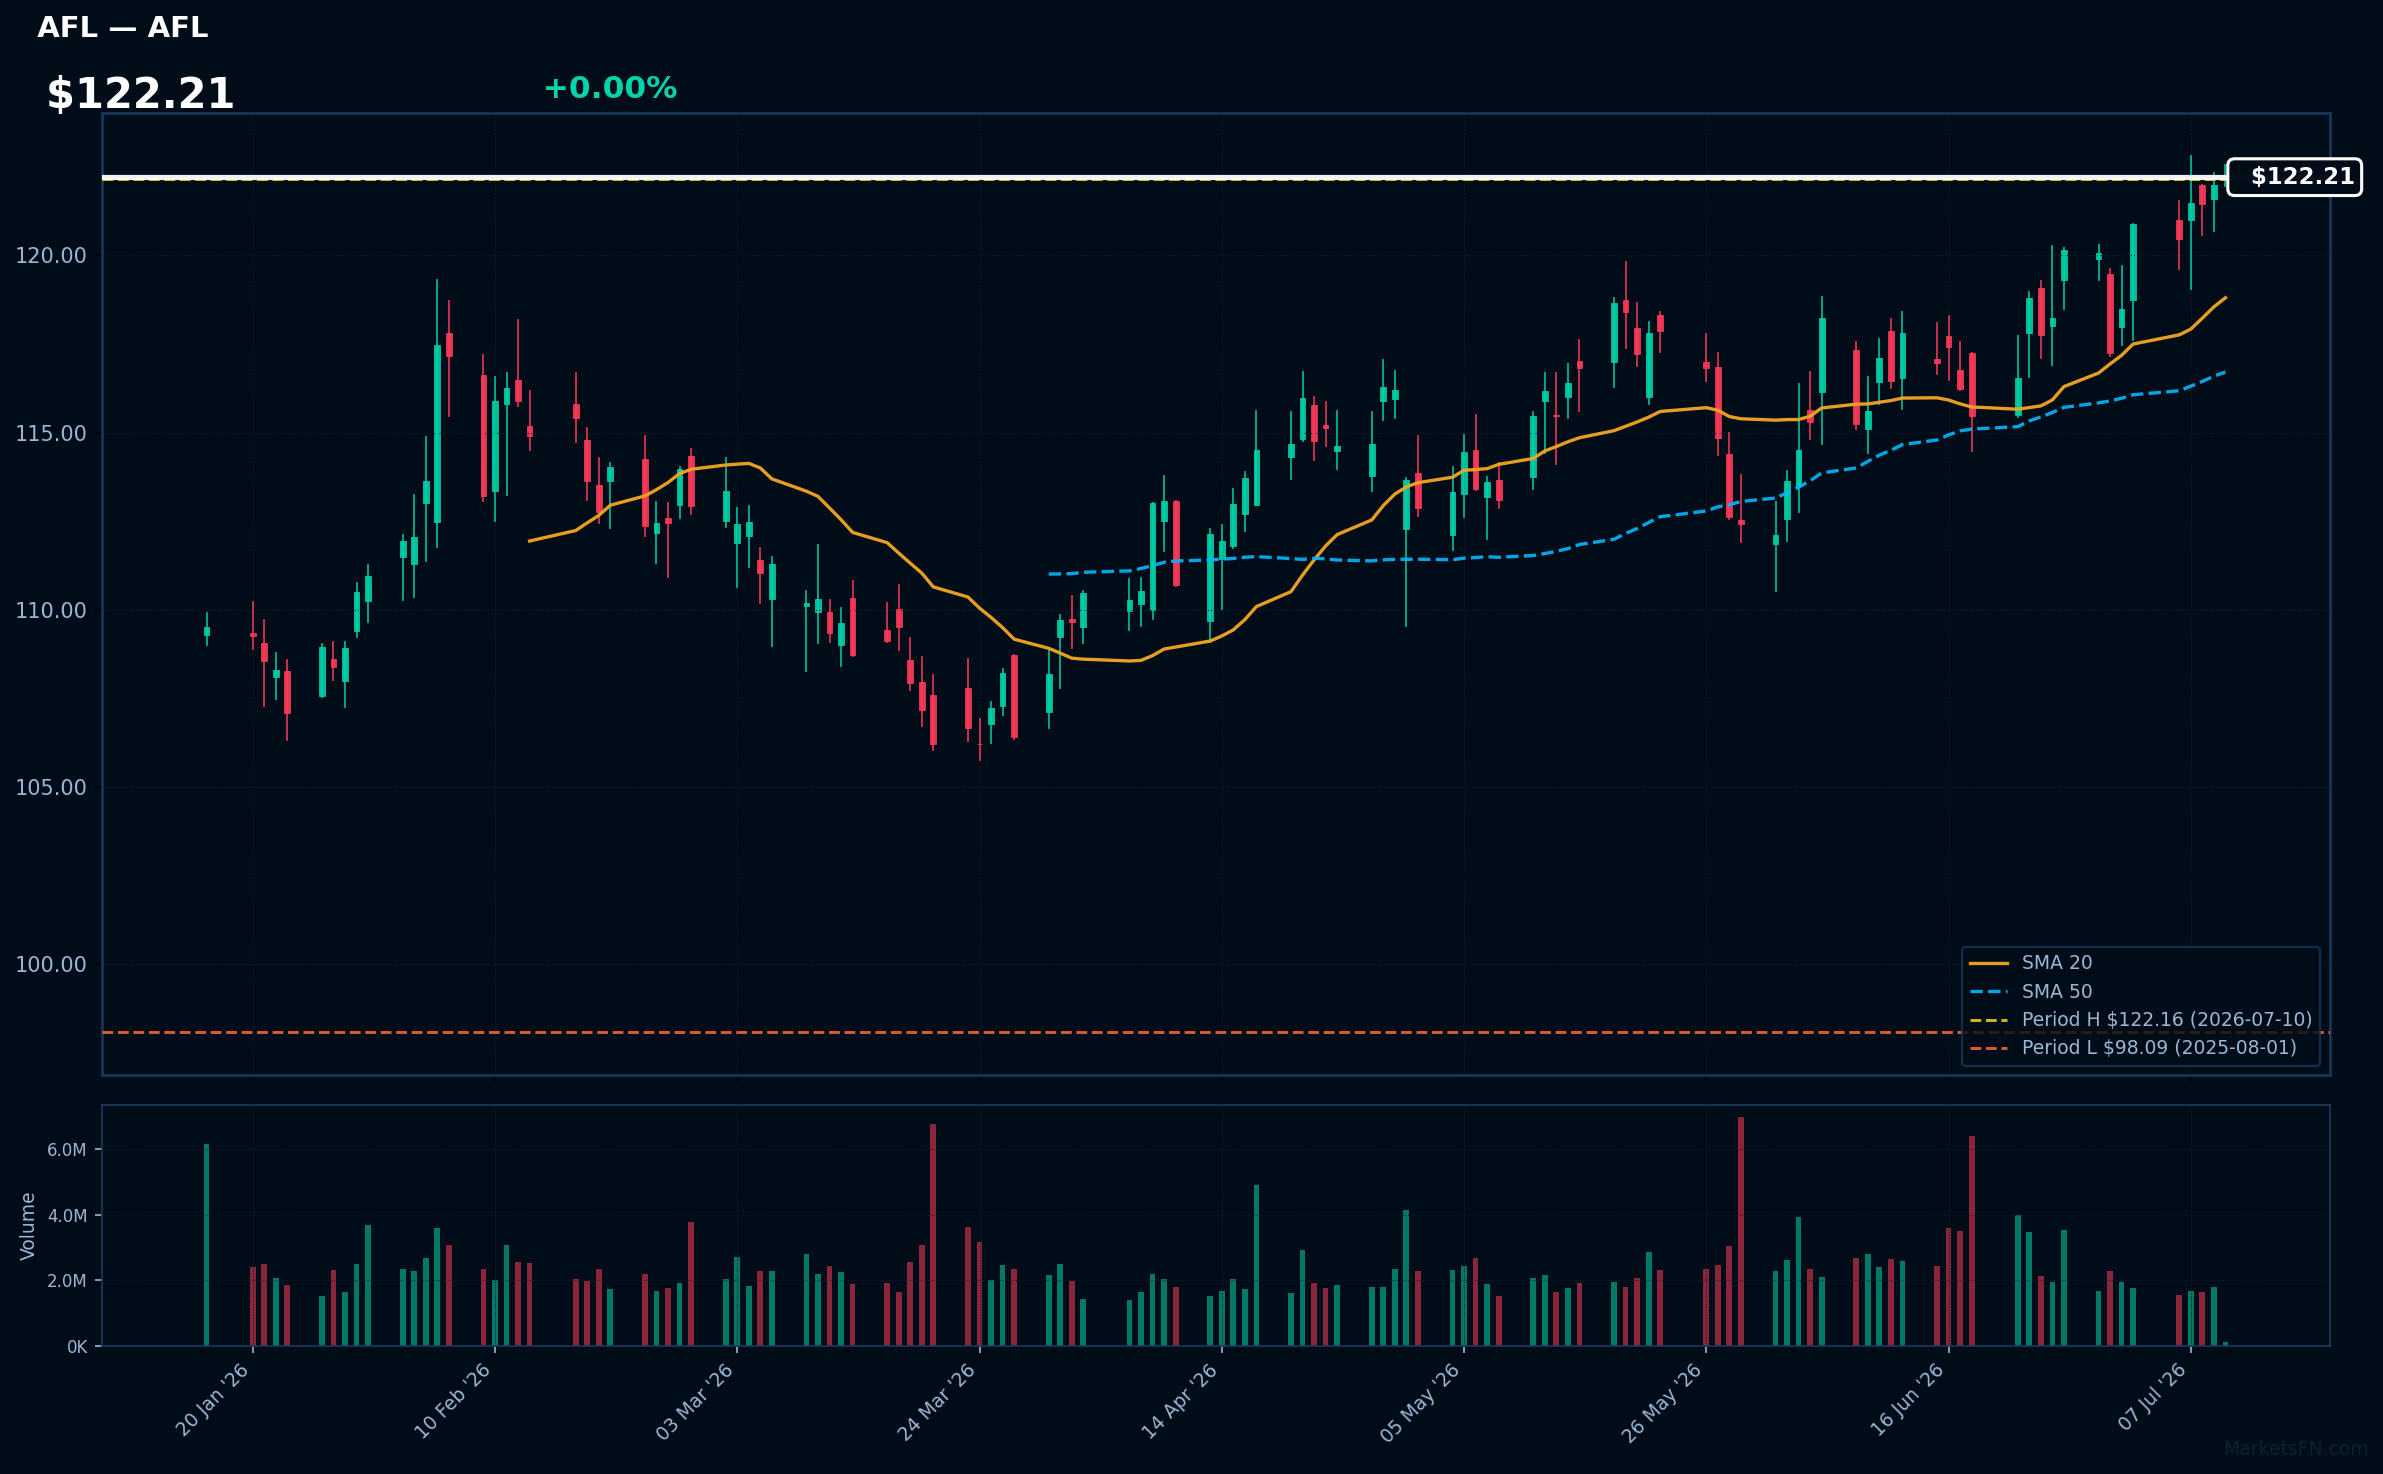
AFL | Aflac Inc | Financial | Price Last: $122.16 | % Realized: +19.44% | RSI: 63.6 | % above MA200: +8.8% | Trend: Above MA20, MA50, MA200
Aflac Inc (AFL) is a supplemental insurance provider, primarily offering accident and health insurance products in the U.S. and Japan. Investors should care about its ability to generate revenue through premiums and its exposure to currency fluctuations, particularly the yen-dollar exchange rate.
Aflac Inc's current technical situation indicates momentum, with an RSI(14) of 63.6 and a bullish MA alignment (price > MA20 > MA50 > MA200). The stock is 0.0% below its 52-Week high, suggesting a potential breakout.
Related headlines
- Aflac Incorporated to Release Second Quarter Results and CFO Video Update on August 6, 2026 and Host Webcast on August 7, 2026
- Designer Rachel Zoe and Aflac make fashion statement to urge Americans to check for cancer
- Aflac, Uplift Her and the African American Male Wellness Agency welcome Grammy-nominated artist Raheem DeVaughn to promote wellness and cancer screenings
- Aflac Incorporated to Present at the Morgan Stanley U.S. Financials Conference
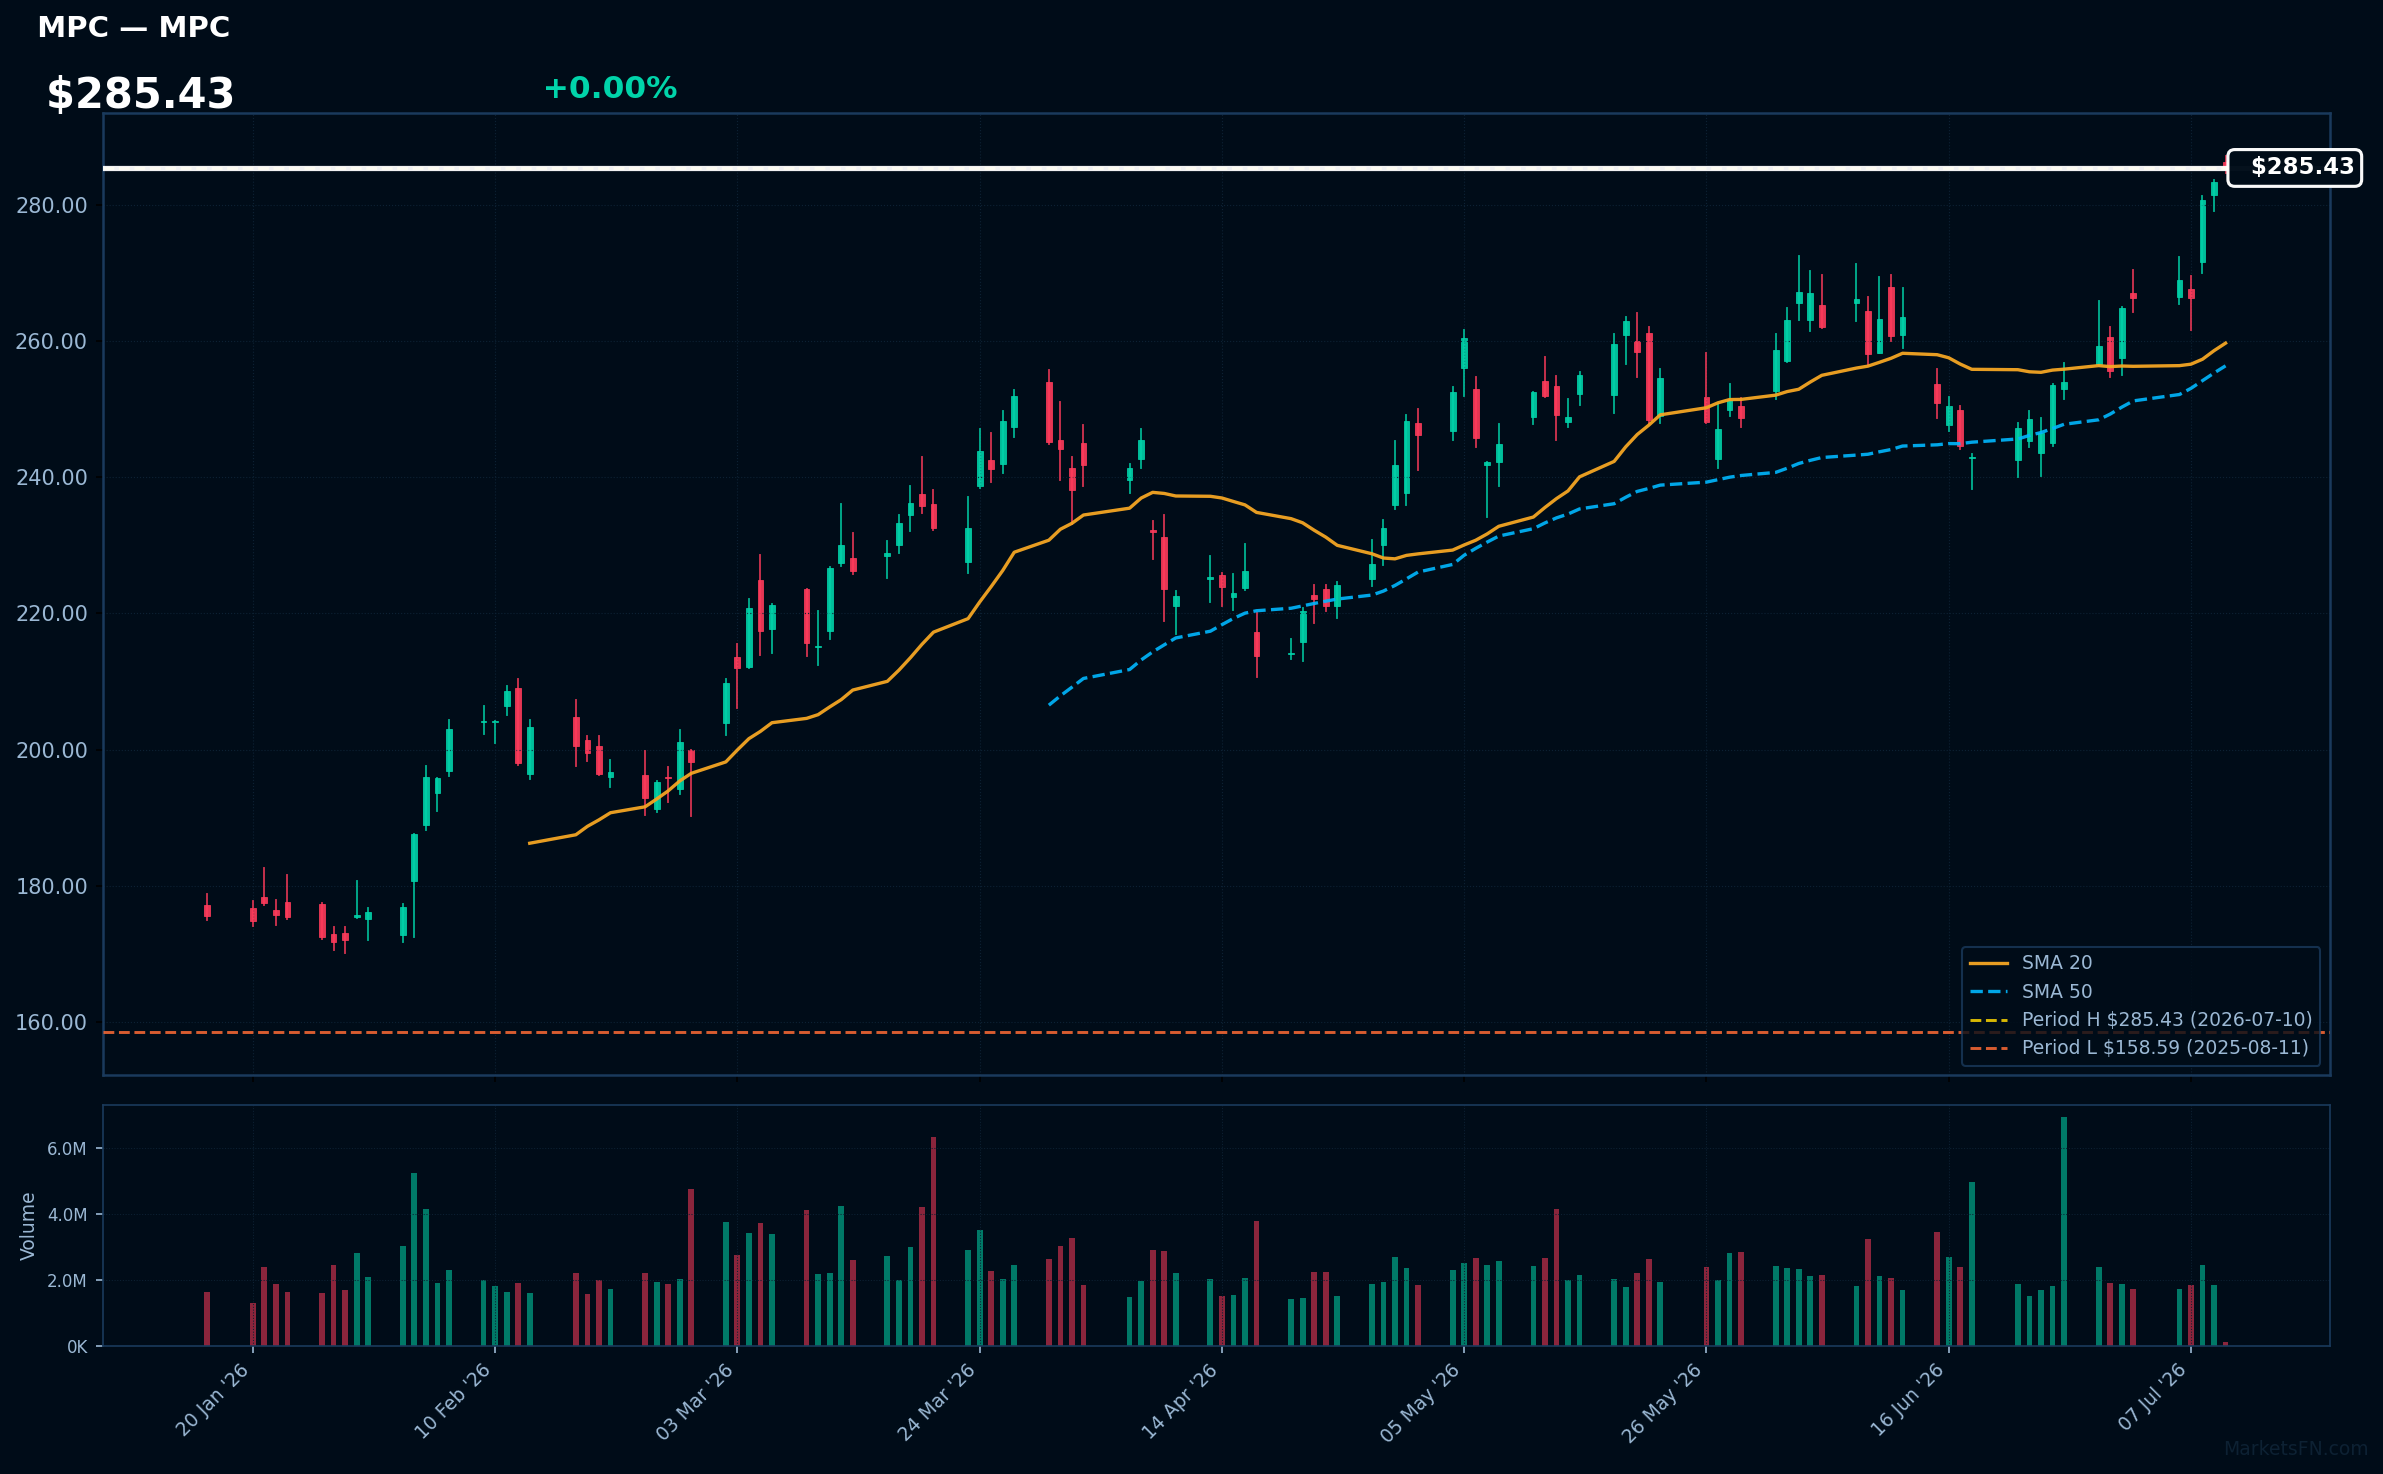
MPC | Marathon Petroleum Corp | Energy | Price Last: $285.43 | % Realized: +56.61% | RSI: 70.4 | % above MA200: +34.0% | Trend: Above MA20, MA50, MA200
Marathon Petroleum Corp is an energy company that refines, markets, and transports petroleum products. Investors should care because its performance is tied to energy demand, refining margins, and supply chain dynamics, making it sensitive to global economic trends and energy price fluctuations.
Marathon Petroleum Corp is near a potential breakout, with its price at $285.43, 0.0% below its 52-Week high. The RSI(14) is 70.4, indicating strong momentum. The MA alignment is bullish (price > MA20 > MA50 > MA200), suggesting a sustained uptrend.
Related headlines
- BP, Marathon, 7-Eleven, Walmart sued for allegedly using AI to boost California gas prices
- Marathon Petroleum Corp. to Report Second-Quarter Financial Results on August 4, 2026
- Marathon Petroleum Corp. names Brian Worthington vice president, Investor Relations; Kristina Kazarian to become vice president, Finance and Treasurer
- MPC- A US Refiner Benefitting from Tighter Jet Fuel Market
📉 Nearest to 52-Week Low
Sectors represented: Energy (2), Industrials (1), Real Estate (1), Consumer Cyclical (1)
| Ticker | Company | Sector | Price Last | % Realized | 52-Week Low Date | RSI | % above MA200 | Trend |
|---|---|---|---|---|---|---|---|---|
| EQT | EQT Corp | Energy | $48.77 | -10.55% | 2026-07-10 | 30.3 | -13.9% | Below MA20, MA50, MA200 |
| EXE | Expand Energy Corp | Energy | $86.76 | -17.53% | 2026-07-10 | 39.7 | -16.4% | Below MA20, MA50, MA200 |
| CPRT | Copart, Inc | Industrials | $28.16 | -41.33% | 2026-06-29 | 37.4 | -24.1% | Below MA20, MA50, MA200 |
| VICI | VICI Properties Inc | Real Estate | $26.05 | -22.55% | 2026-07-09 | 39.8 | -9.6% | Below MA20, MA50, MA200 |
| ORLY | O'Reilly Automotive, Inc | Consumer Cyclical | $84.78 | -8.23% | 2026-07-06 | 40.7 | -10.2% | Below MA20, MA50, MA200 |
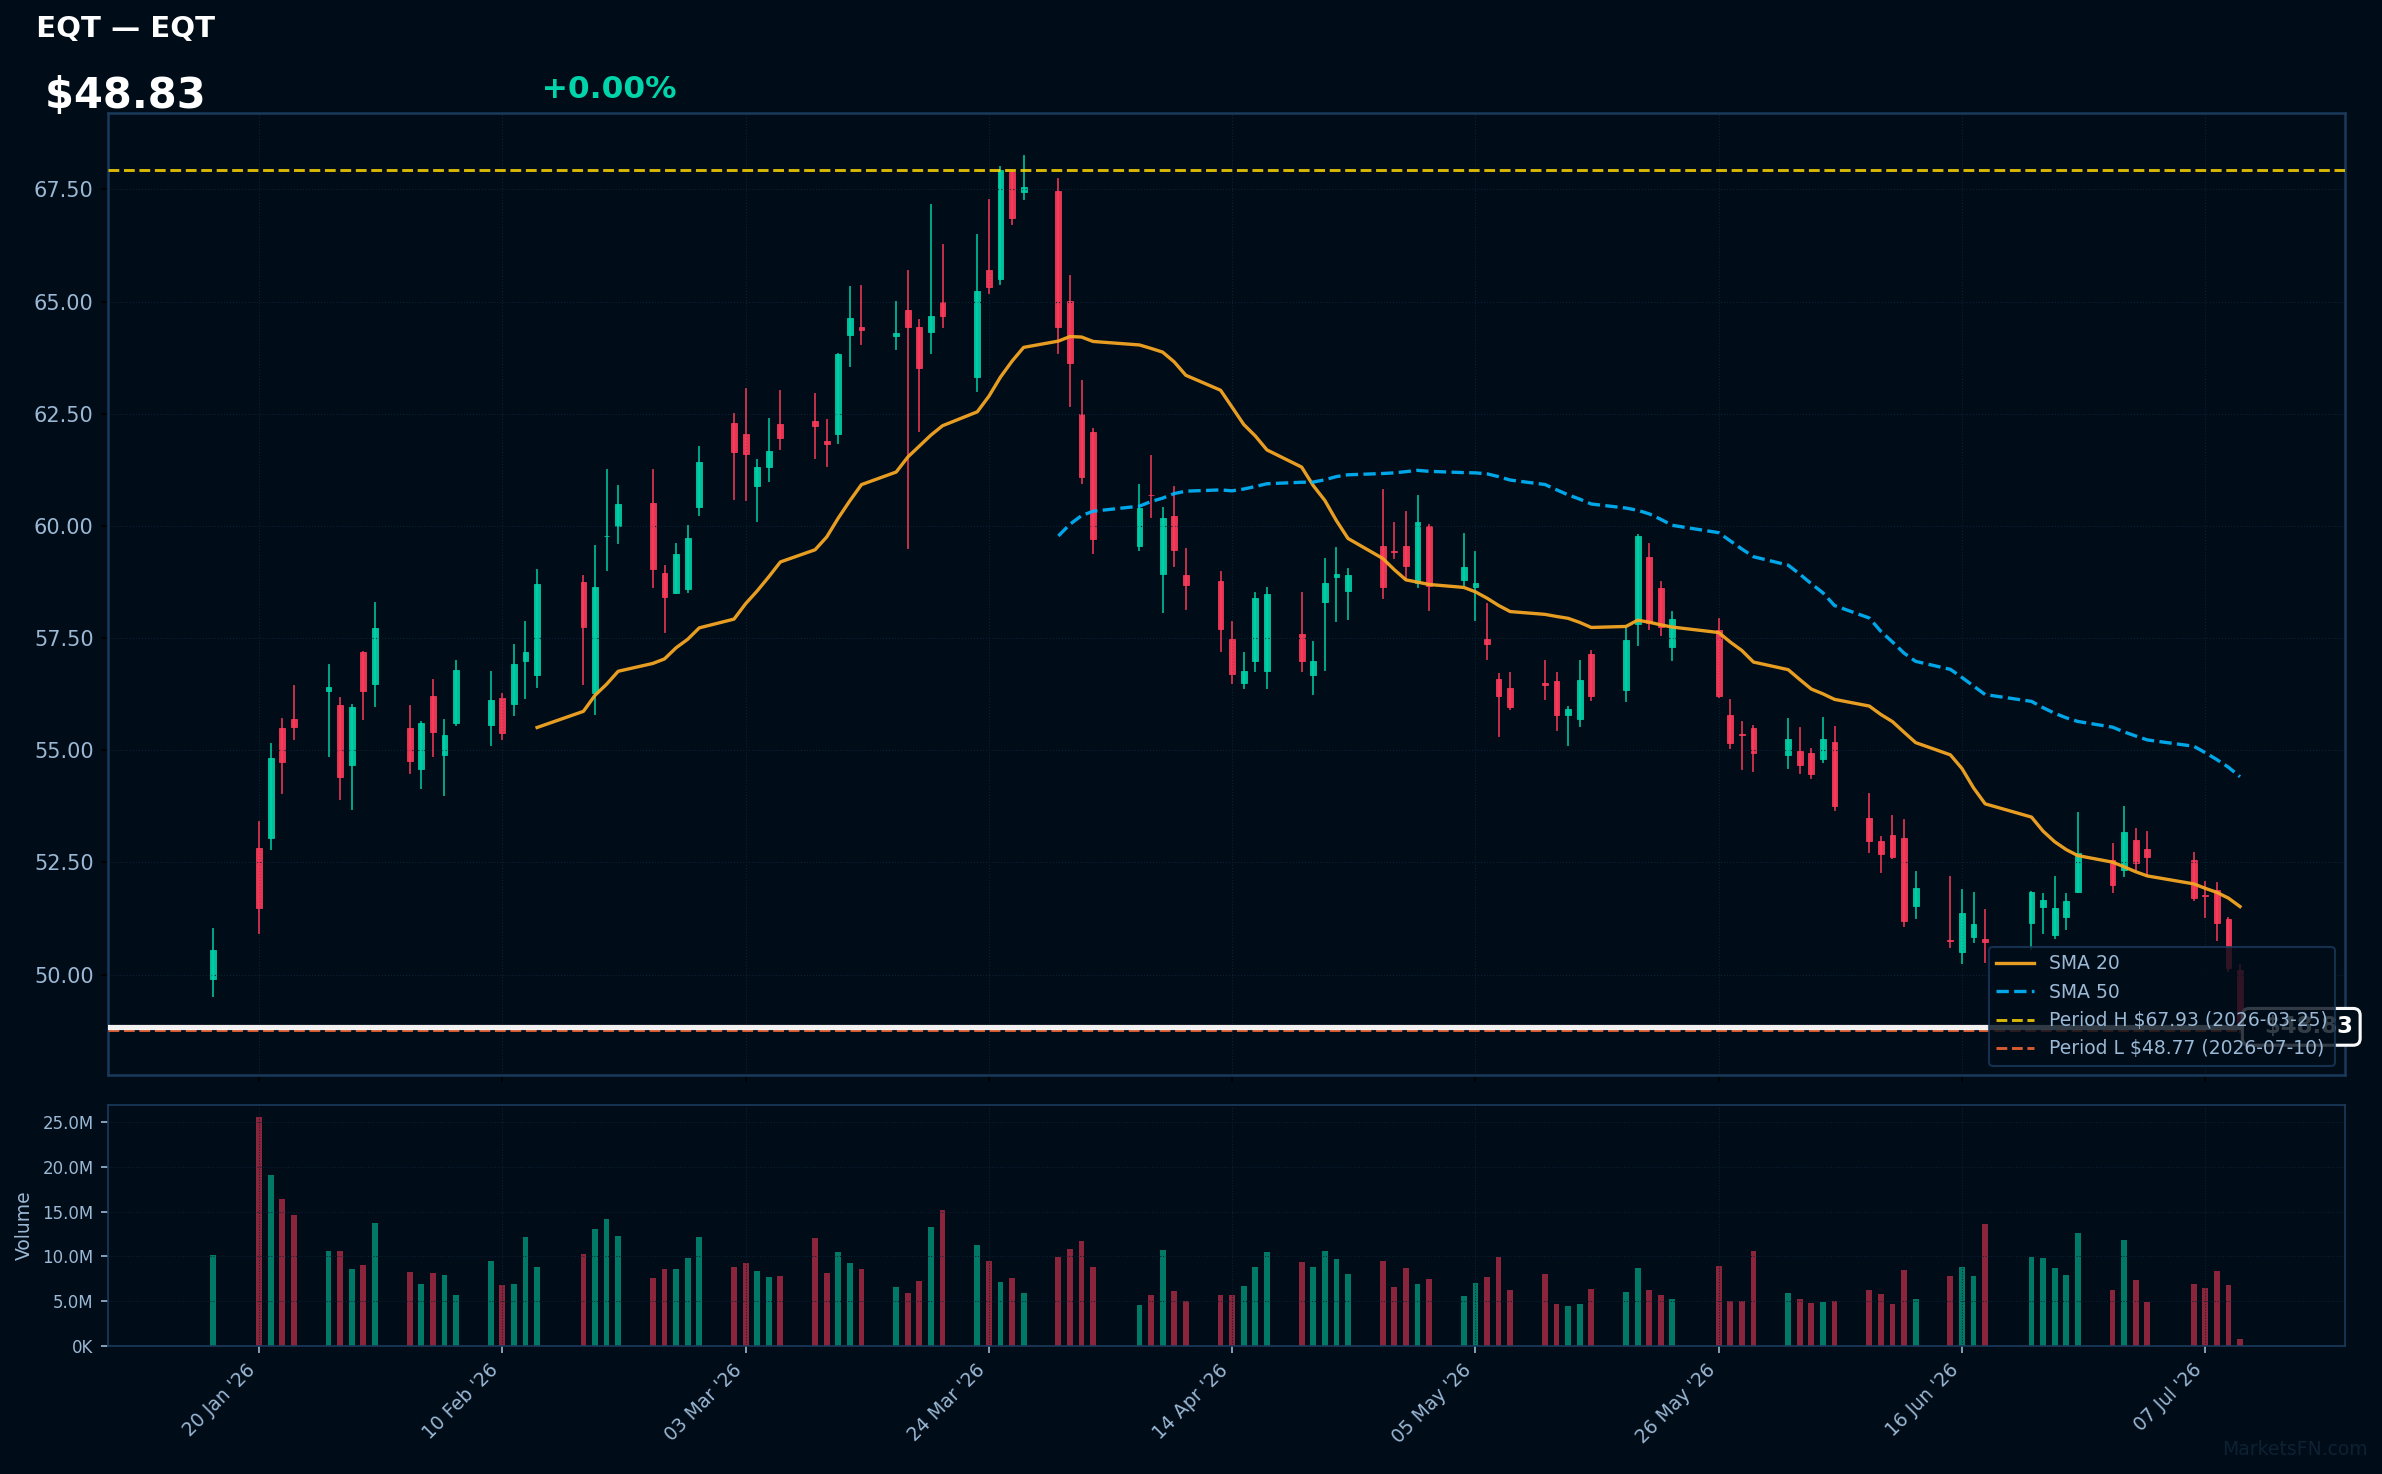
EQT | EQT Corp | Energy | Price Last: $48.77 | % Realized: -10.55% | RSI: 30.3 | % above MA200: -13.9% | Trend: Below MA20, MA50, MA200
EQT Corp is a natural gas production company. Investors should care because its performance is tied to energy demand and commodity prices. As a major producer, its operational efficiency and production volumes directly impact its financials and stock performance.
EQT Corp's technical situation is bearish, with an RSI(14) of 30.3 indicating oversold conditions. The sustained downtrend is evident as price ($48.83) < MA20 < MA50 < MA200, and it's testing major support at its 52-Week low.
Related headlines
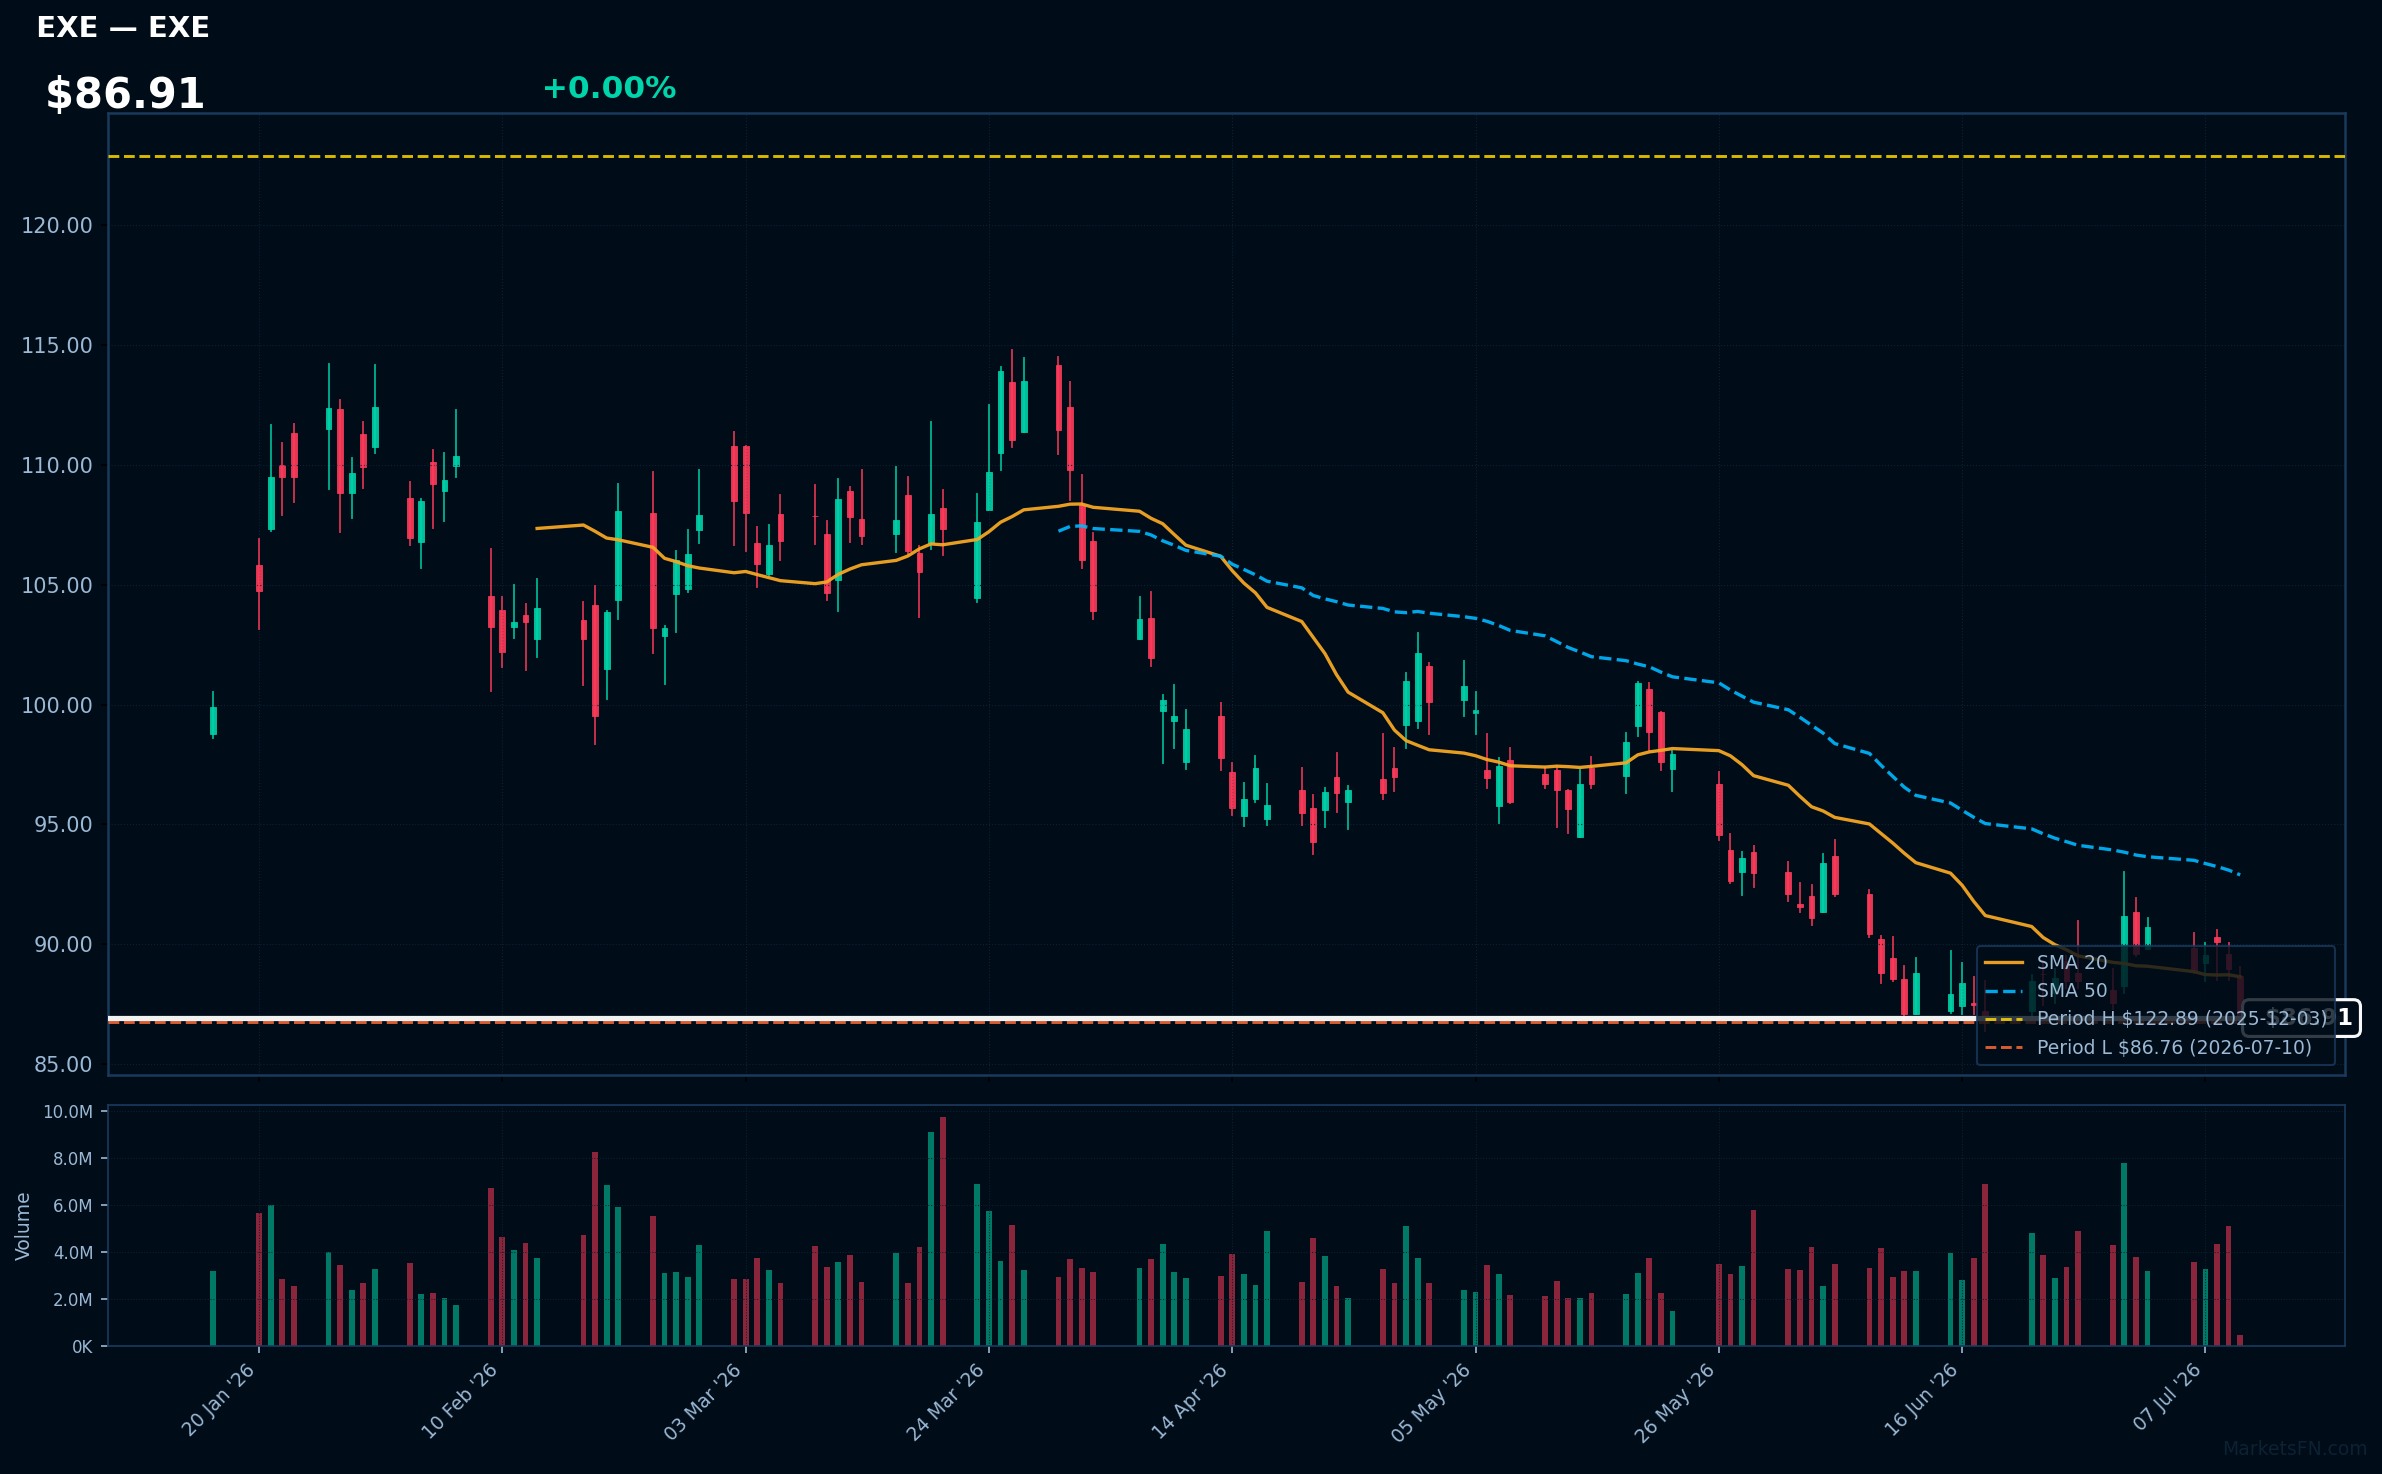
EXE | Expand Energy Corp | Energy | Price Last: $86.76 | % Realized: -17.53% | RSI: 39.7 | % above MA200: -16.4% | Trend: Below MA20, MA50, MA200
Expand Energy Corp's specific business operations and investor relevance are not detailed in the provided data; thus, a factual description cannot be given.
The stock is in a sustained downtrend with price ($86.91) below all MAs (MA20, MA50, MA200), RSI(14) at 39.7, and is 0.0% above its 52-Week low, indicating a technical warning sign.
Related headlines
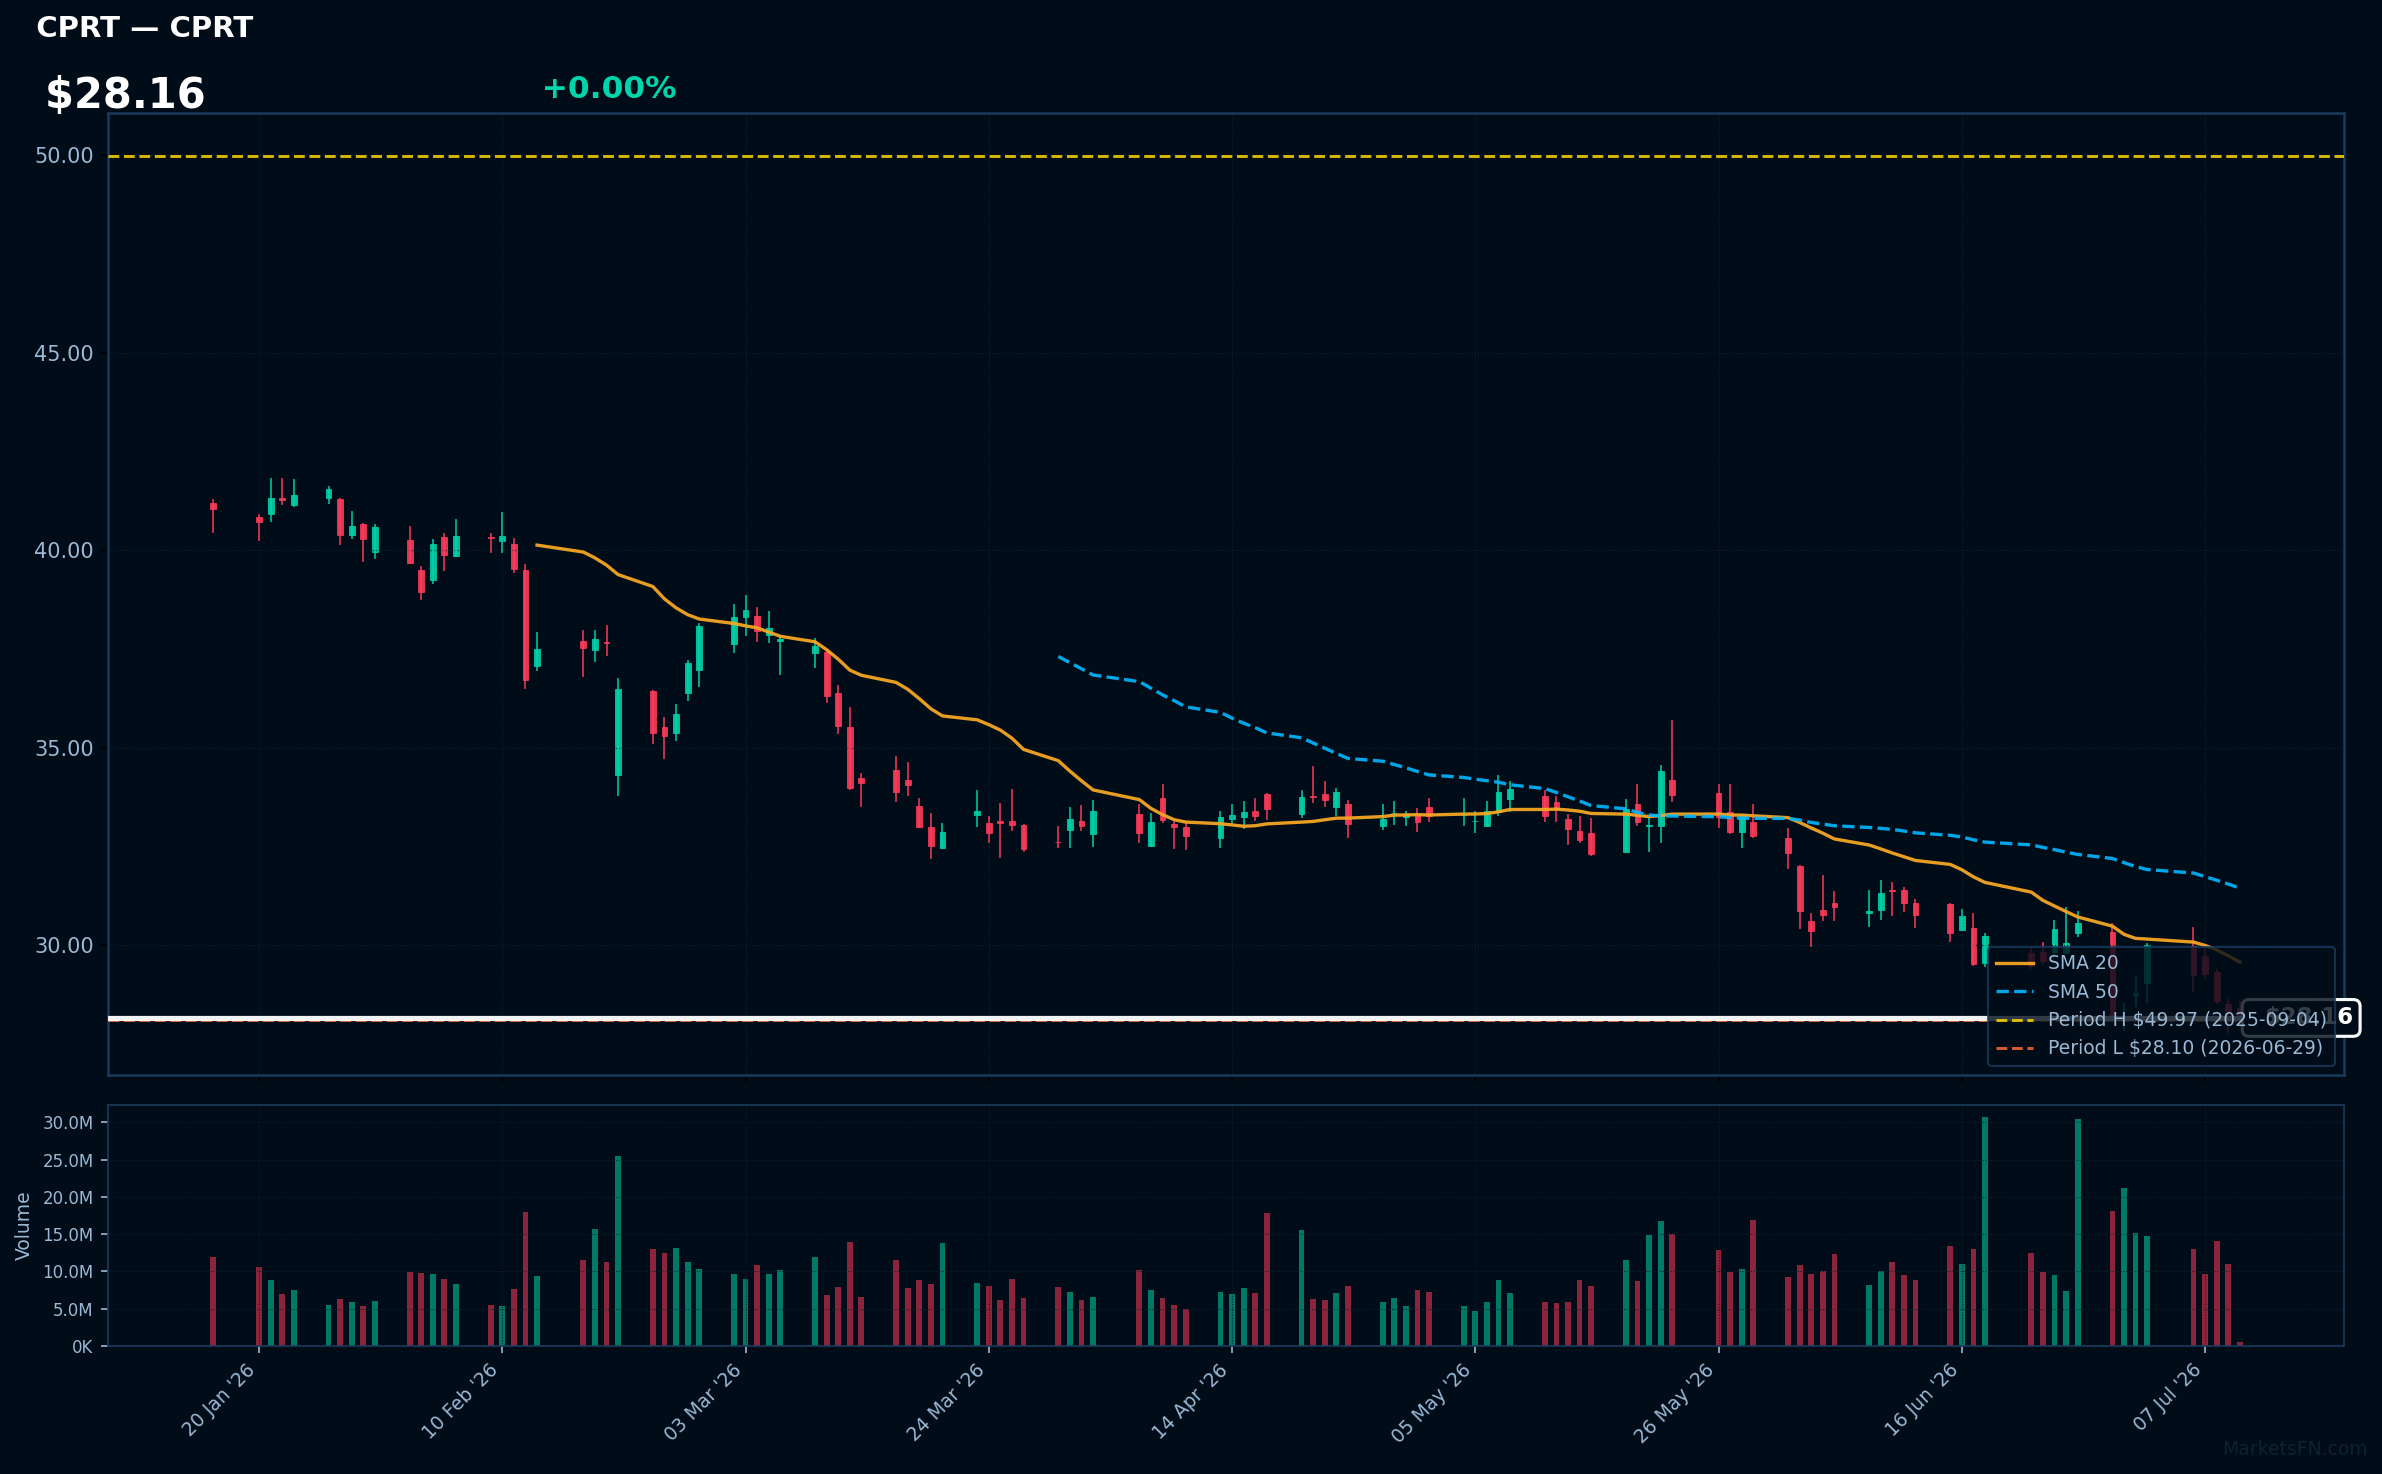
CPRT | Copart, Inc | Industrials | Price Last: $28.16 | % Realized: -41.33% | RSI: 37.4 | % above MA200: -24.1% | Trend: Below MA20, MA50, MA200
Copart, Inc (CPRT) operates online vehicle auction platforms, providing salvage and used vehicle sales. Investors should care about its market share, revenue growth, and profitability as it indicates the company's ability to capitalize on the growing online vehicle auction market.
CPRT's technicals indicate a sustained downtrend with price ($28.16) below MA20, MA50, and MA200. RSI(14) at 37.4 suggests bearish momentum. The stock is near its 52-Week low, down 41.3% over the period, warning of potential further decline.
Related headlines
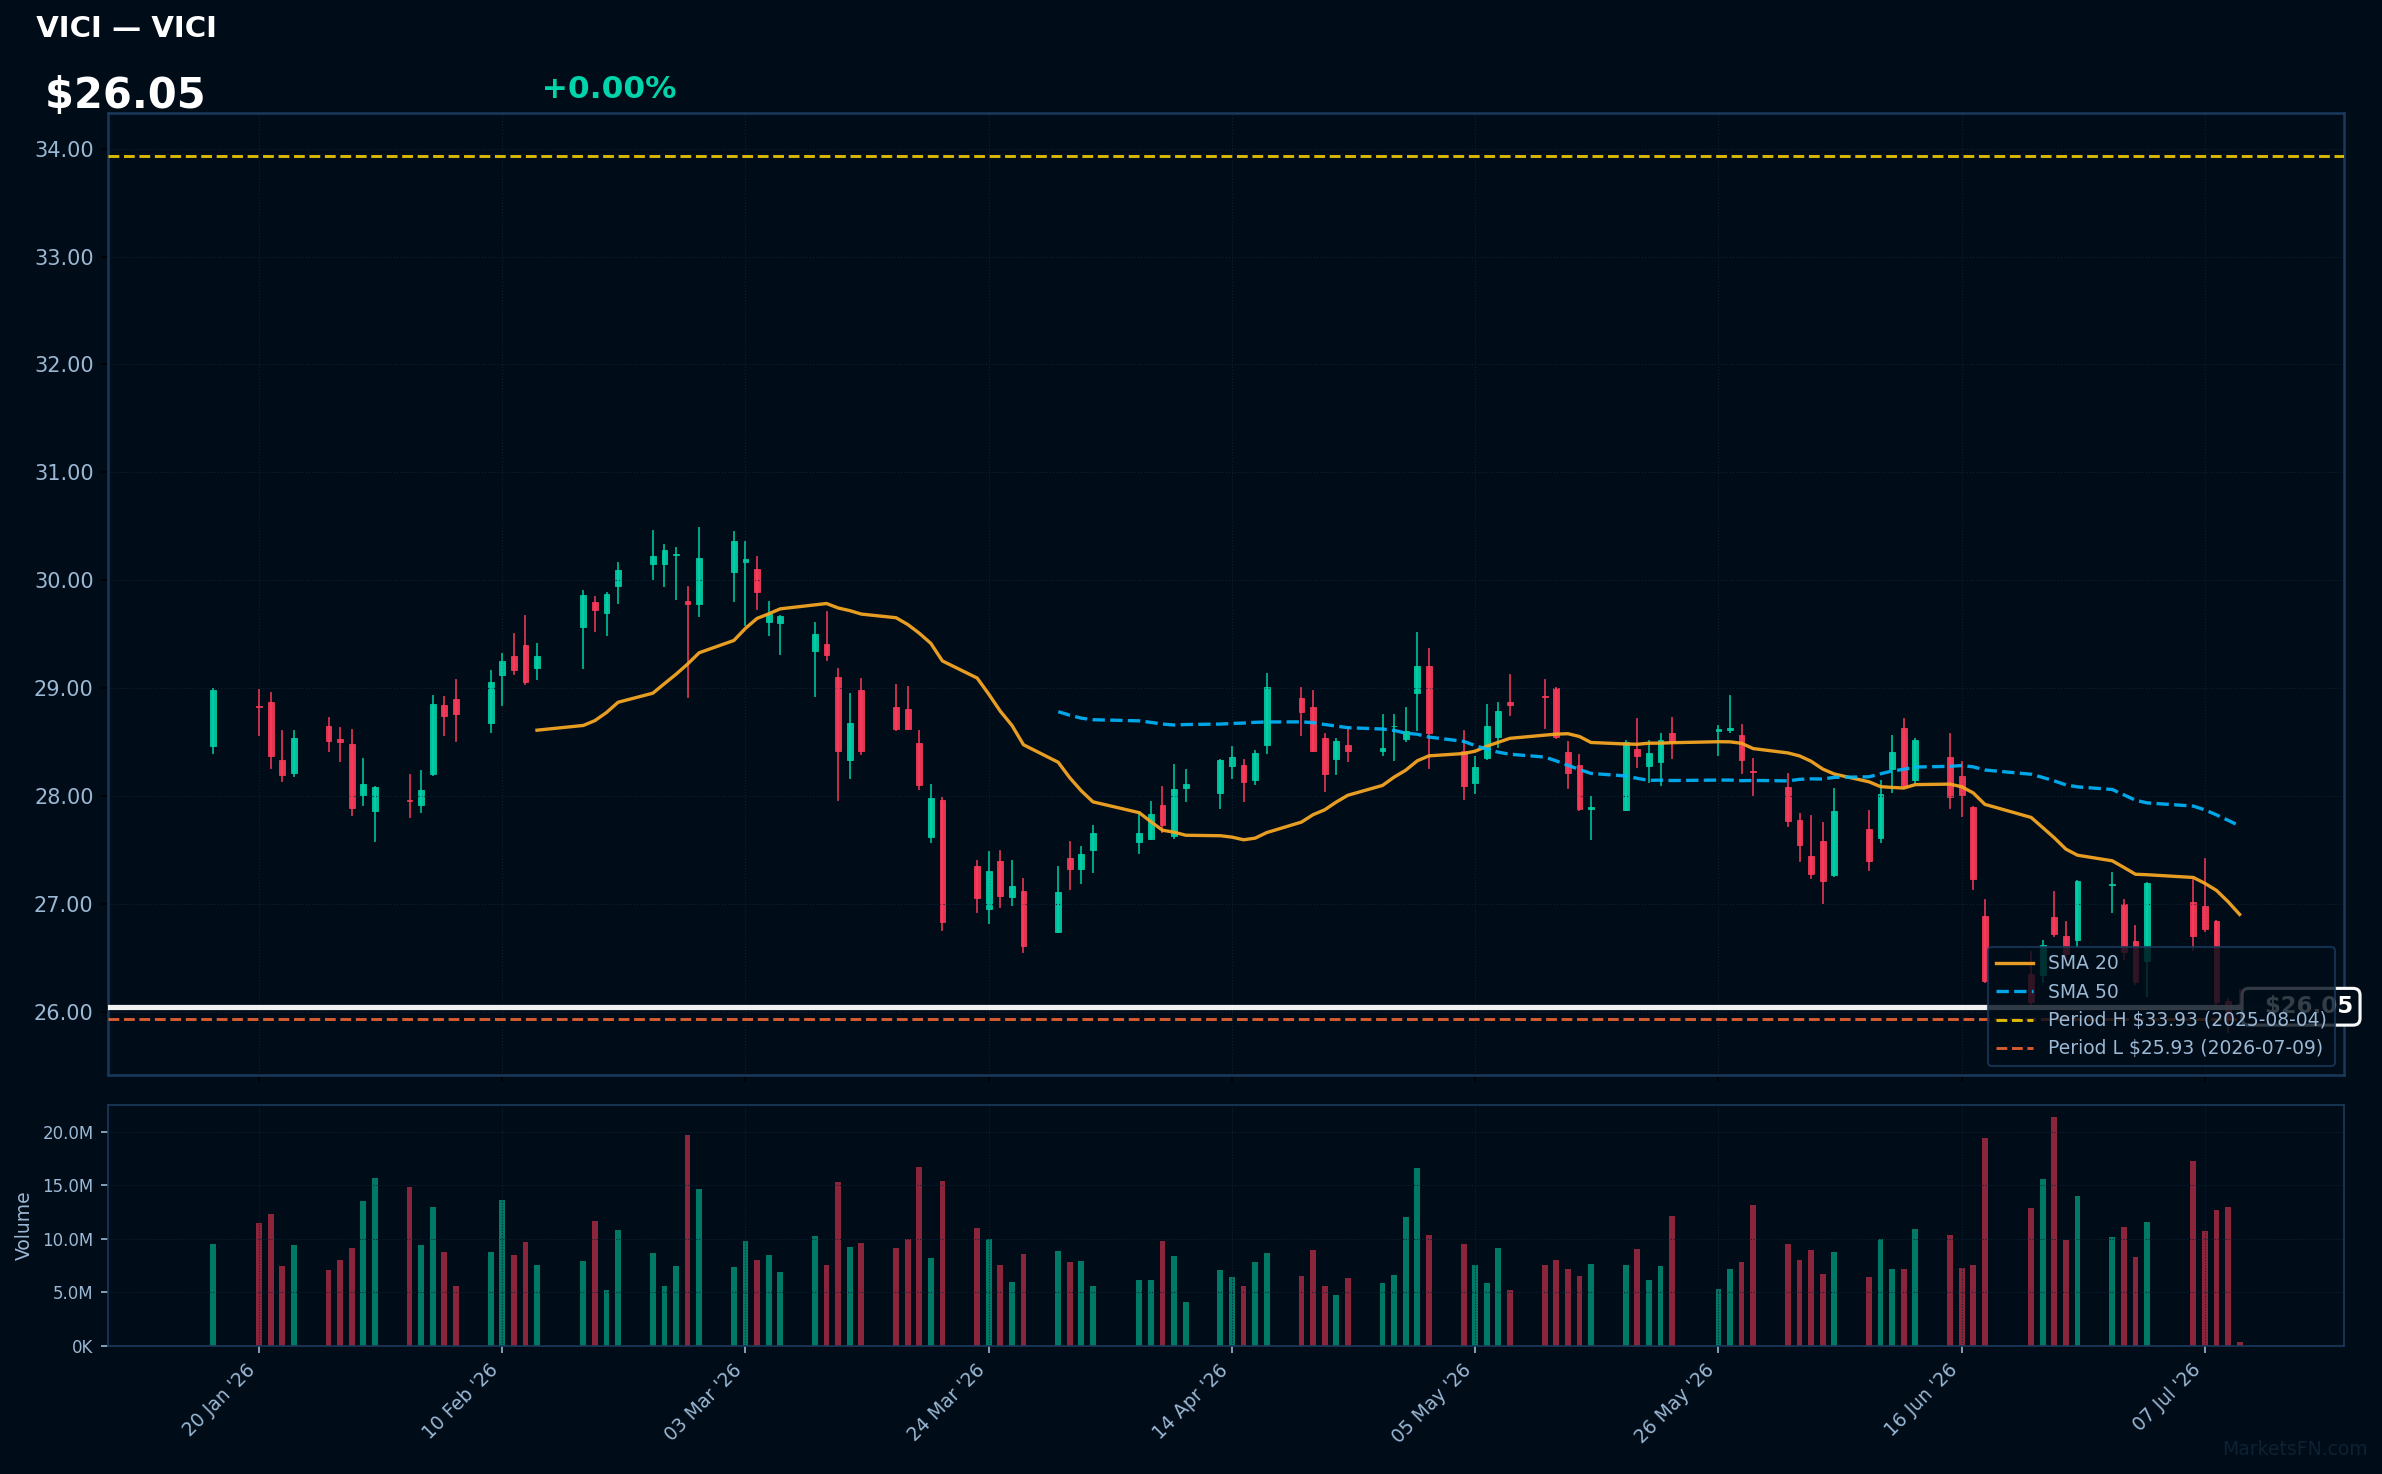
VICI | VICI Properties Inc | Real Estate | Price Last: $26.05 | % Realized: -22.55% | RSI: 39.8 | % above MA200: -9.6% | Trend: Below MA20, MA50, MA200
VICI Properties Inc is a real estate investment trust (REIT) that owns and acquires entertainment, hospitality, and gaming properties. Investors should care because its performance is tied to the recovery and growth of these sectors.
VICI's technical situation is bearish, with an RSI(14) of 39.8, price below MA20, MA50, and MA200, and a 52-Week low proximity of 0.4%, indicating a sustained downtrend and testing major support, potentially a warning sign.
Related headlines
- VICI Properties Inc. Announces Release Date for Second Quarter 2026 Results
- VICI Properties Inc. Completes Sale-Leaseback of Canadian Portfolio in Connection With Pure Casino Entertainment's Acquisition of Gamehost
- VICI Properties and Club Med Announce Acquisition and Redevelopment of Carambola Beach Resort in St. Croix
- CLUB MED ADVANCES STRATEGIC NORTH AMERICAN EXPANSION WITH THE REDEVELOPMENT OF CARAMBOLA BEACH RESORT IN ST. CROIX IN PARTNERSHIP WITH VICI PROPERTIES
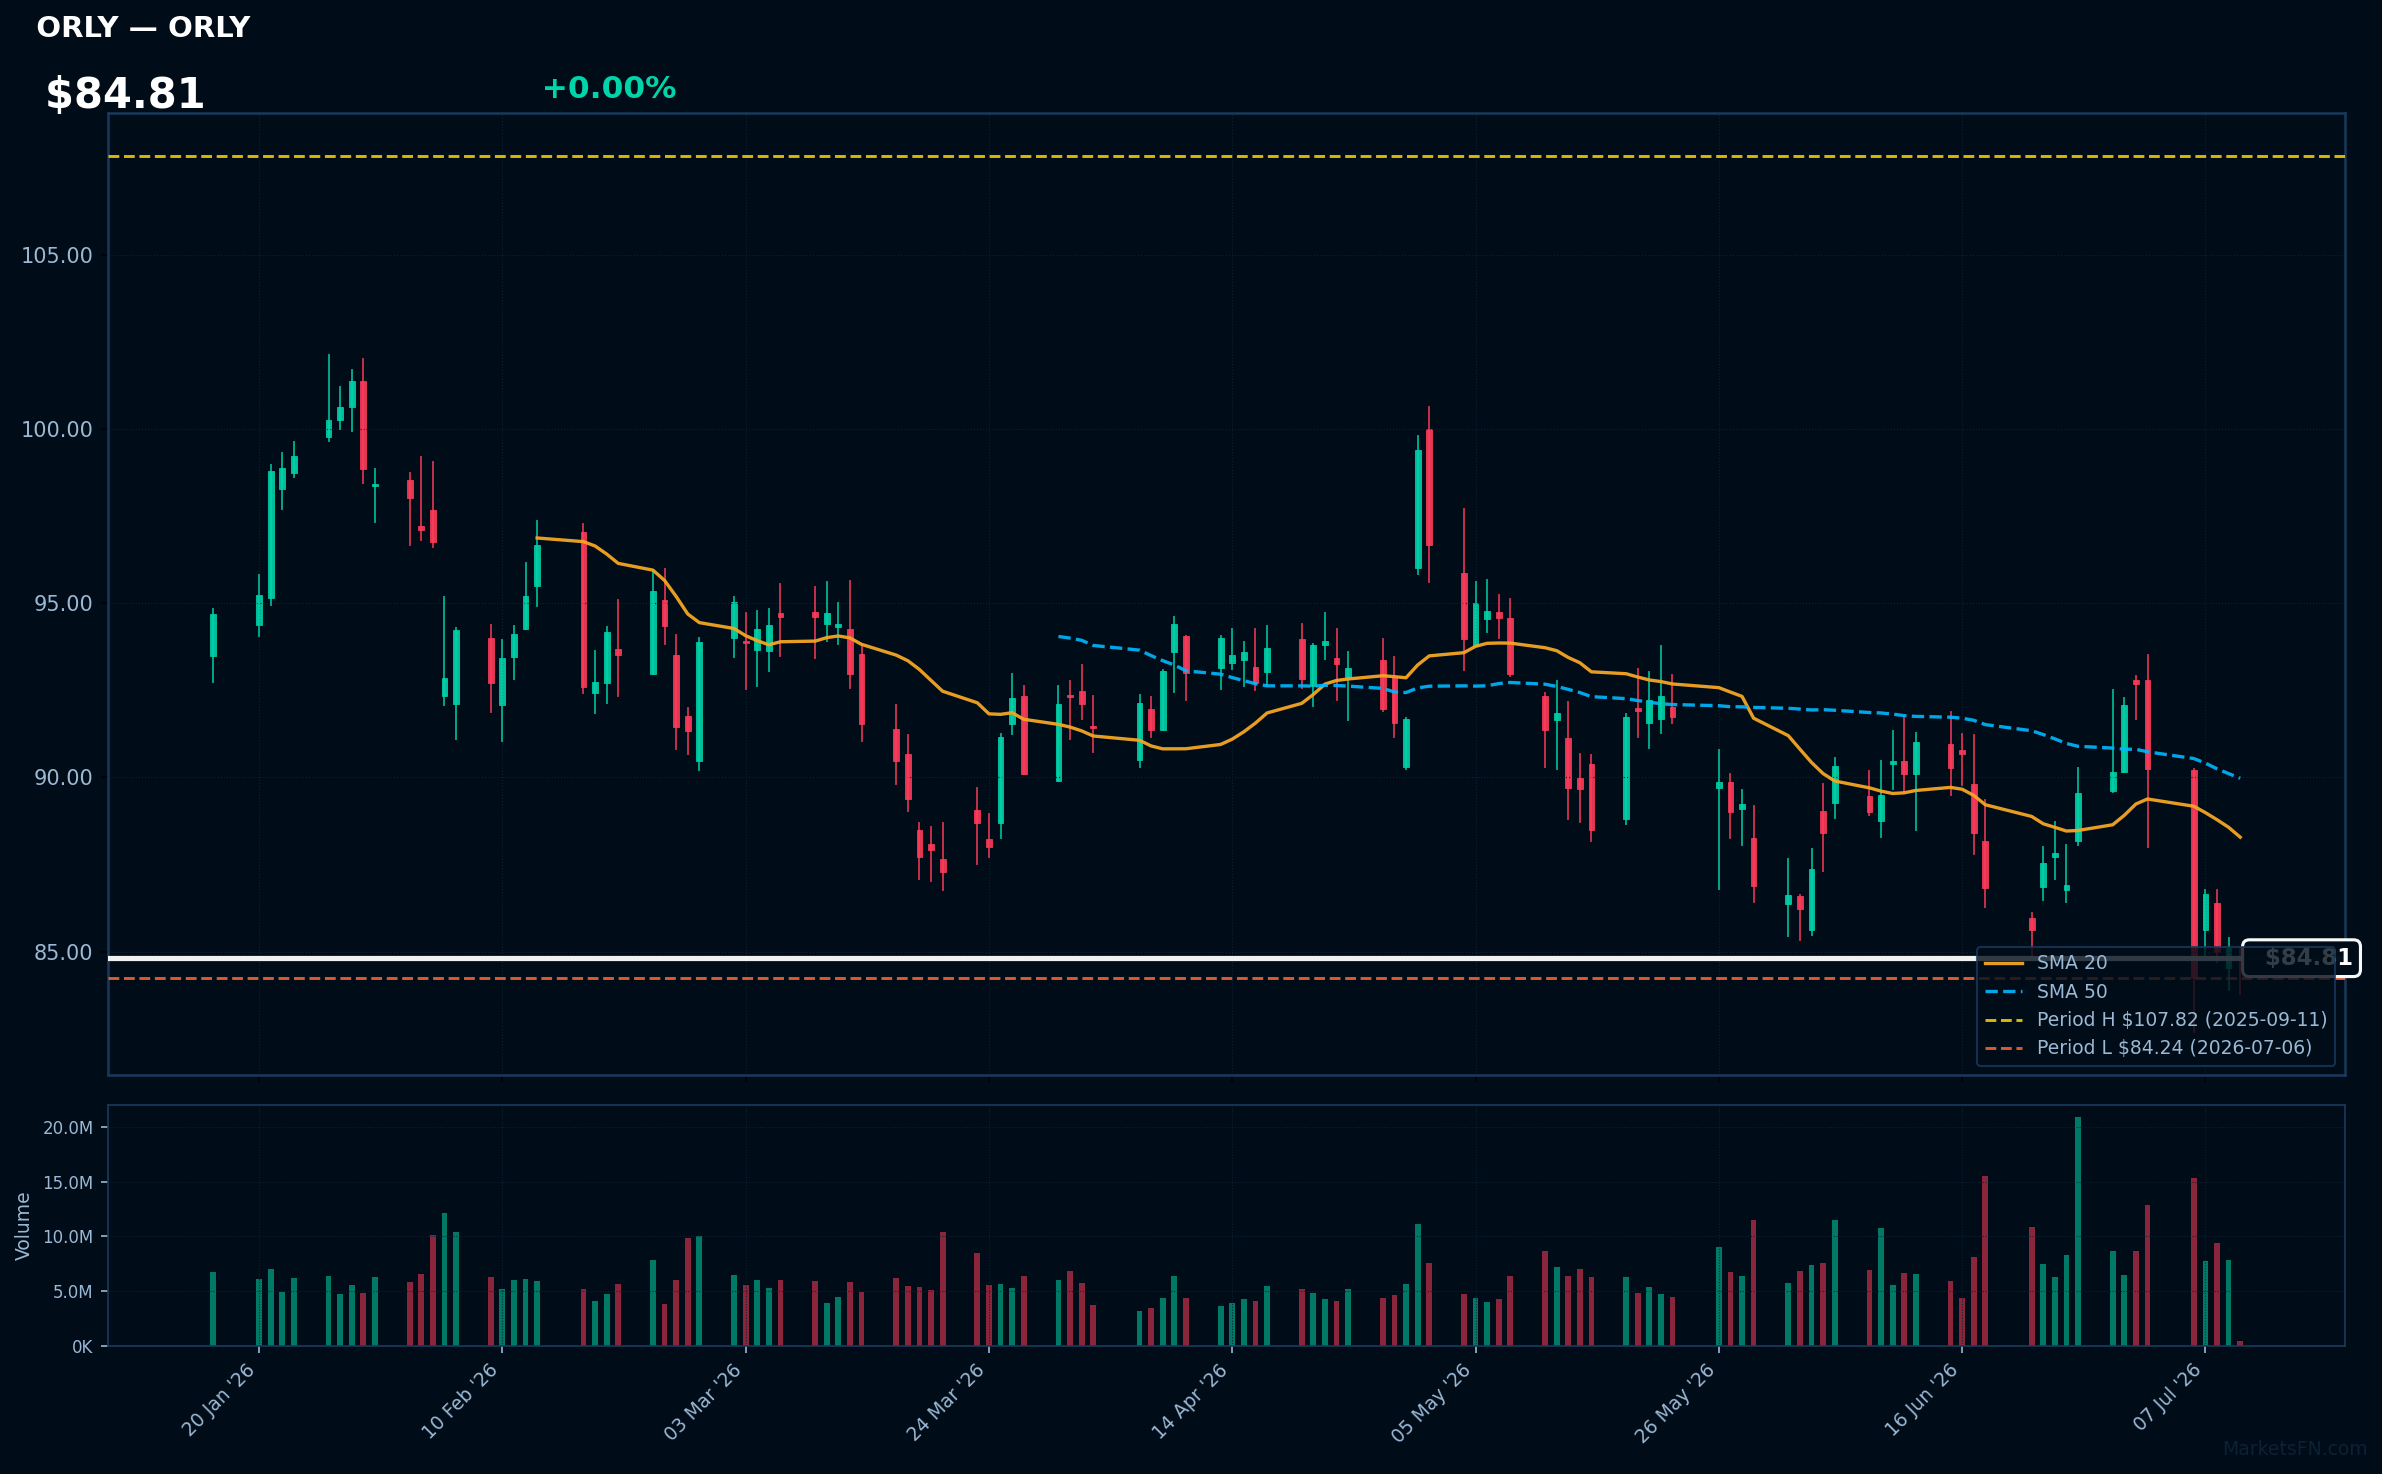
ORLY | O'Reilly Automotive, Inc | Consumer Cyclical | Price Last: $84.78 | % Realized: -8.23% | RSI: 40.7 | % above MA200: -10.2% | Trend: Below MA20, MA50, MA200
O'Reilly Automotive, Inc is a leading auto parts retailer with a vast store network. Investors should care about its ability to navigate the aftermarket parts industry, which is influenced by vehicle demographics and repair trends.
ORLY's technicals indicate a sustained downtrend with price ($84.81) below MA20, MA50, and MA200. RSI(14) is 40.7, nearing oversold territory. The stock is 0.6% above its 52-Week low, testing major support, with a -8.2% 52-Week return, signaling potential further downside.
Related headlines
- Why Did REE, HTZ, ORLY Stocks Slump To 52-Week Lows Today?
- O'Reilly Stock Sinks on Report of Possible NAPA Bid
- GPC Stock Pops 13%, ORLY Falls 5% OReilly Makes Cash Bid For Genuine Parts $10B Auto Unit, Says Report
- O'Reilly Automotive, Inc. Announces Dates for Its Second Quarter 2026 Earnings Release and Conference Call
Market Commentary
The S&P 500 stocks listed near 52-week extremes indicate a significant price movement, with some stocks reaching new highs and others hovering near their lows. Stocks like ANET, UNP, SBUX, AFL, and MPC are at their 52-week highs, while EQT and EXE are at their 52-week lows, with CPRT, VICI, and ORLY marginally above their lows.
The stocks near 52-week highs span various sectors, including technology (ANET), industrials (UNP), consumer staples (SBUX), financials (AFL), and energy (MPC), suggesting a broad-based market movement. In contrast, the stocks near 52-week lows are primarily from the energy sector (EQT, EXE) and real estate (VICI), potentially indicating sector rotation and macro themes related to energy prices and interest rates.
Key levels to watch include the 52-week extremes for these stocks, as a breach or sustainment above/below these levels could signal further price movements. Potential catalysts include earnings reports, macroeconomic data releases, and sector-specific news that could impact these stocks and the broader market.
Methodology: All 503 S&P 500 constituents screened. 52-week high = highest daily close over the past 252 trading days (approx. 1 year). 52-week low = lowest daily close over the same period. Distance = (current price / extreme − 1) × 100. Technical indicators computed on up to 1 year of daily OHLCV data.
Disclaimer: For informational purposes only. Not investment advice. Past performance is not indicative of future results.

