S&P 500 2026 YTD Highs & Lows Radar: Apple (AAPL), VICI Properties (VICI) and more
MarketsFN Team

S&P 500 2026 YTD Highs & Lows Radar: Apple (AAPL), VICI Properties (VICI) and more
Screening all 503 S&P 500 constituents for stocks nearest to their 2026 year-to-date high and their 2026 YTD low. Data as of July 10, 2026. % Realized = total return since Jan 1 2026.
Legend: RSI > 70 = overbought · RSI < 30 = oversold · Green % Realized = positive YTD return · Red = negative.
📈 Nearest to 2026 High
Sectors represented: Technology (2), Industrials (2), Healthcare (1)
| Ticker | Company | Sector | Price Last | % Realized | 2026 YTD High Date | RSI | % above MA200 | Trend |
|---|---|---|---|---|---|---|---|---|
| AAPL | Apple Inc | Technology | $316.22 | +16.68% | 2026-07-09 | 63.9 | +16.1% | Above MA20, MA50, MA200 |
| UNH | Unitedhealth Group Inc | Healthcare | $431.68 | +28.32% | 2026-07-09 | 61.1 | +27.2% | Above MA20, MA50, MA200 |
| ANET | Arista Networks Inc | Technology | $184.69 | +38.24% | 2026-07-09 | 62.3 | +28.3% | Above MA20, MA50, MA200 |
| UNP | Union Pacific Corp | Industrials | $285.04 | +22.91% | 2026-07-09 | 67.4 | +15.9% | Above MA20, MA50, MA200 |
| CSX | CSX Corp | Industrials | $49.35 | +36.06% | 2026-07-09 | 66.5 | +22.9% | Above MA20, MA50, MA200 |
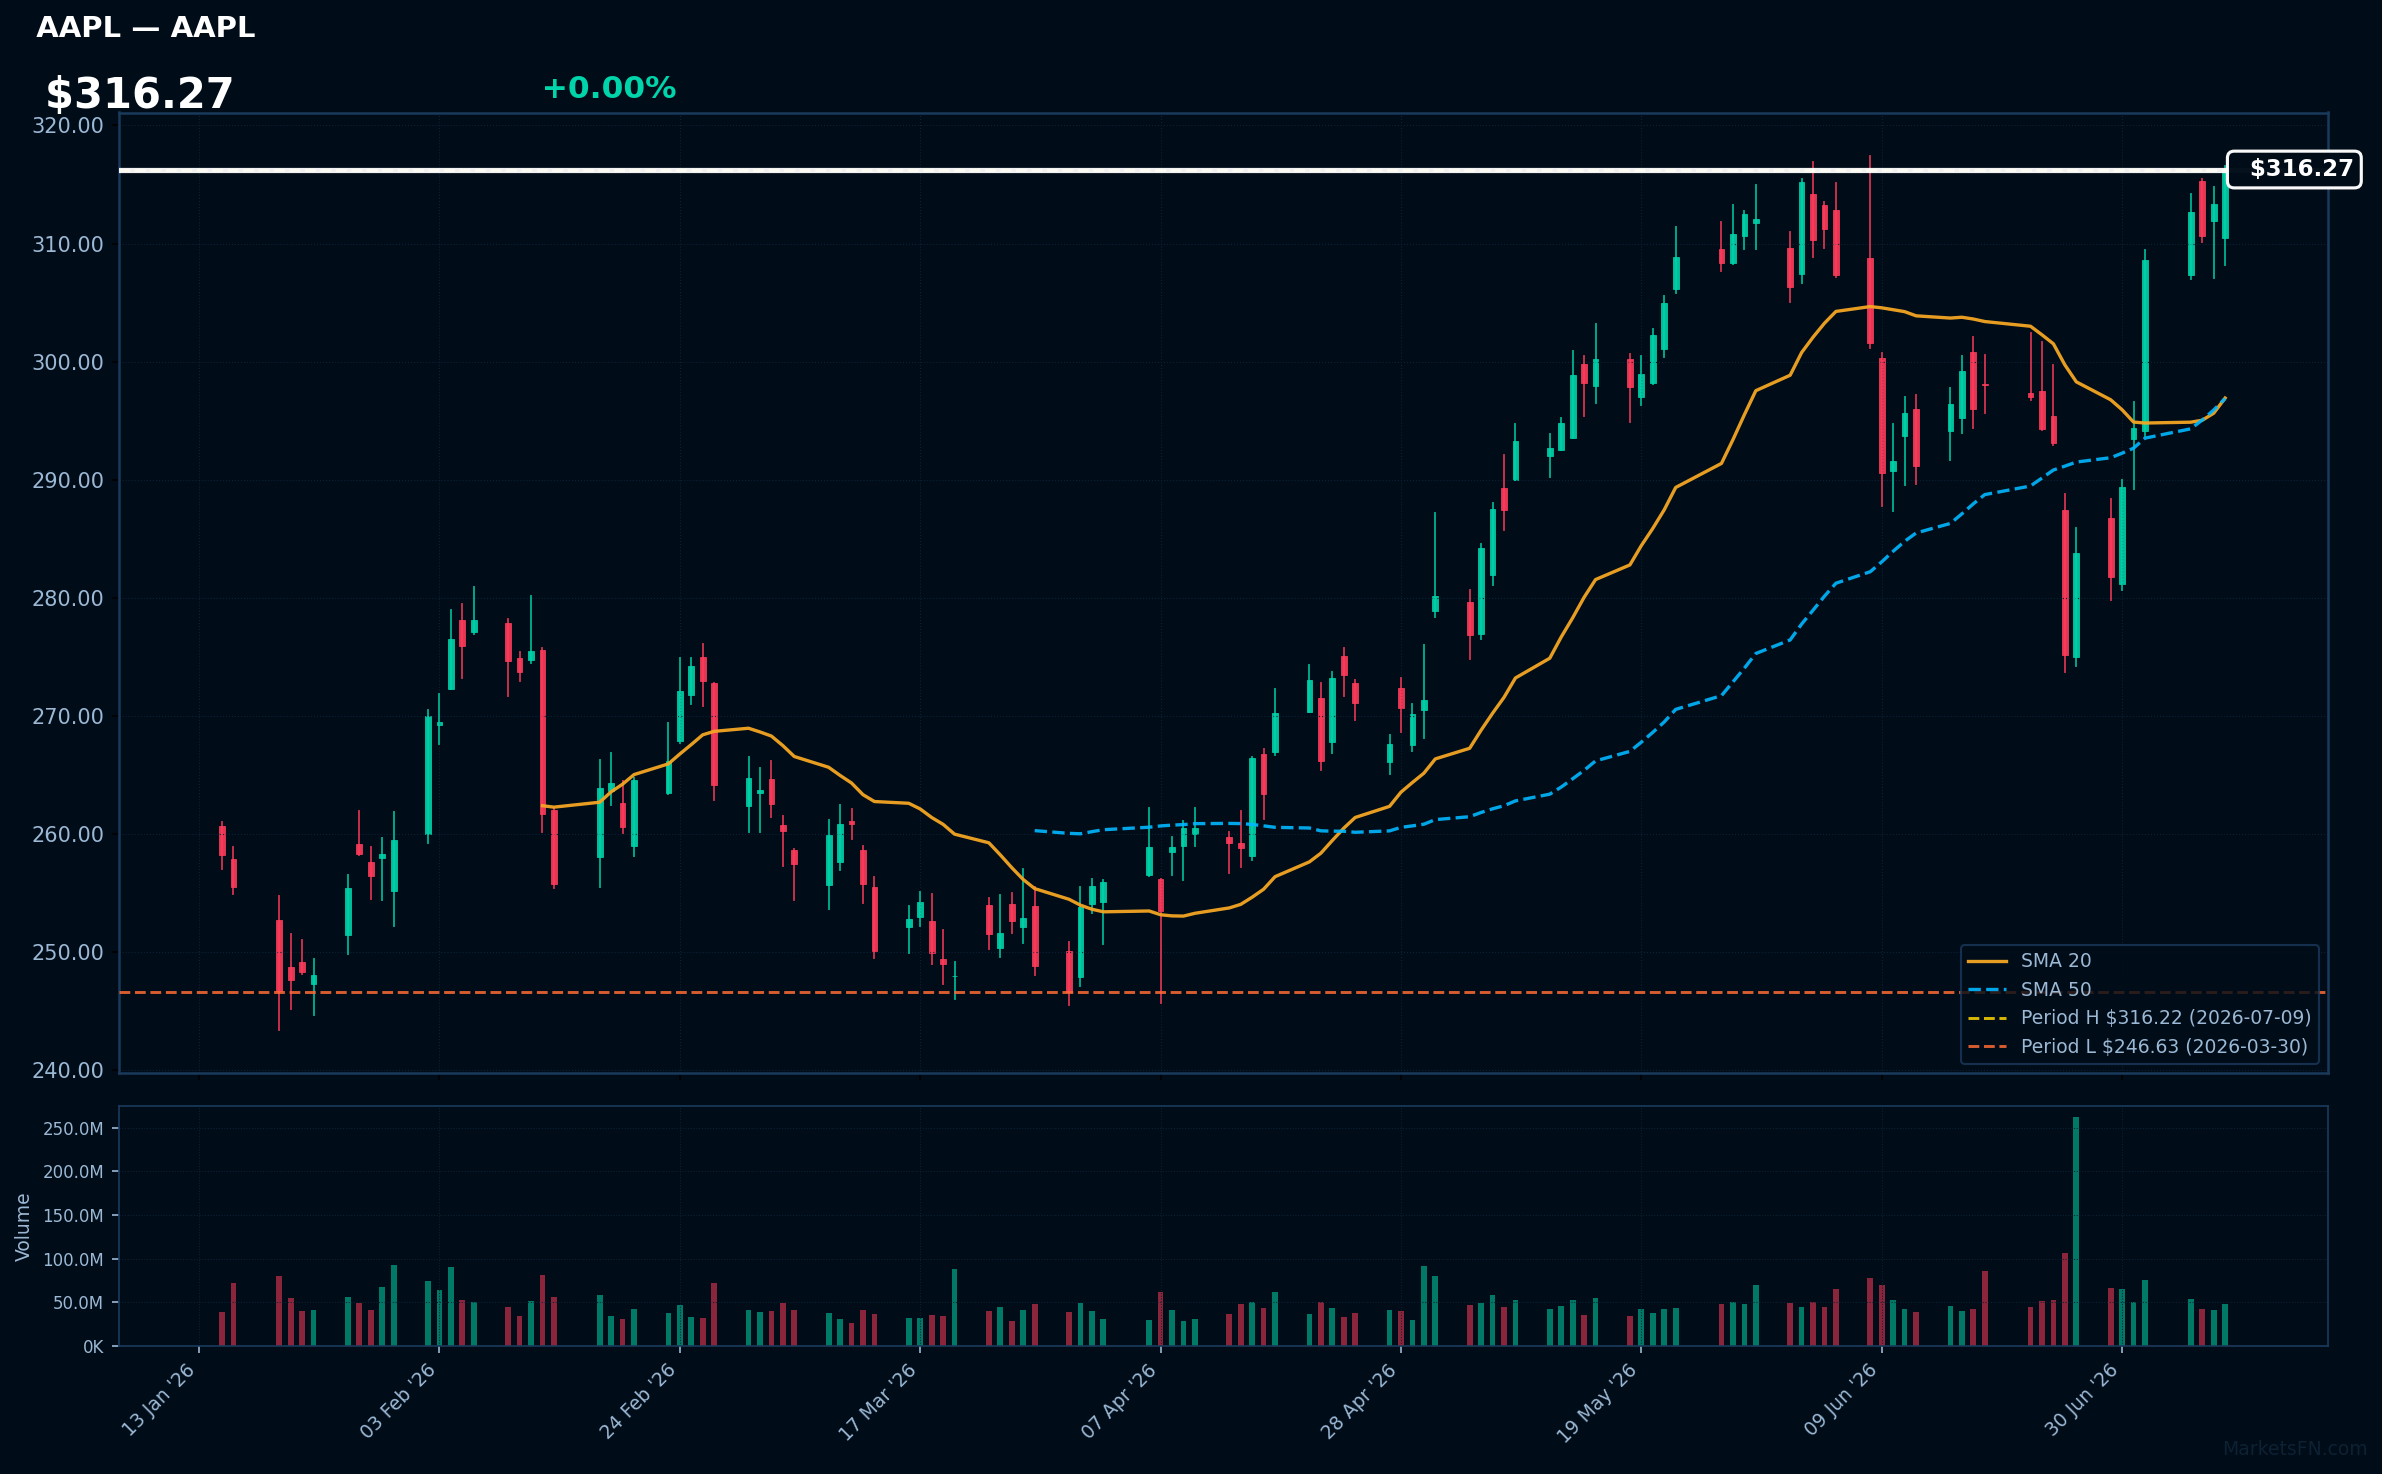
AAPL | Apple Inc | Technology | Price Last: $316.22 | % Realized: +16.68% | RSI: 63.9 | % above MA200: +16.1% | Trend: Above MA20, MA50, MA200
Apple Inc designs, manufactures, and markets consumer electronics, software, and services. Investors care about its innovative product ecosystem, services growth, and profitability. Specific areas of interest include iPhone sales, Services segment expansion, and wearables growth.
AAPL's RSI(14) is 63.9, indicating rising momentum. The MA alignment is bullish with price > MA20 > MA50 > MA200, suggesting a sustained uptrend. The stock is 0.0% below its 2026 YTD high, near a potential breakout.
Related headlines
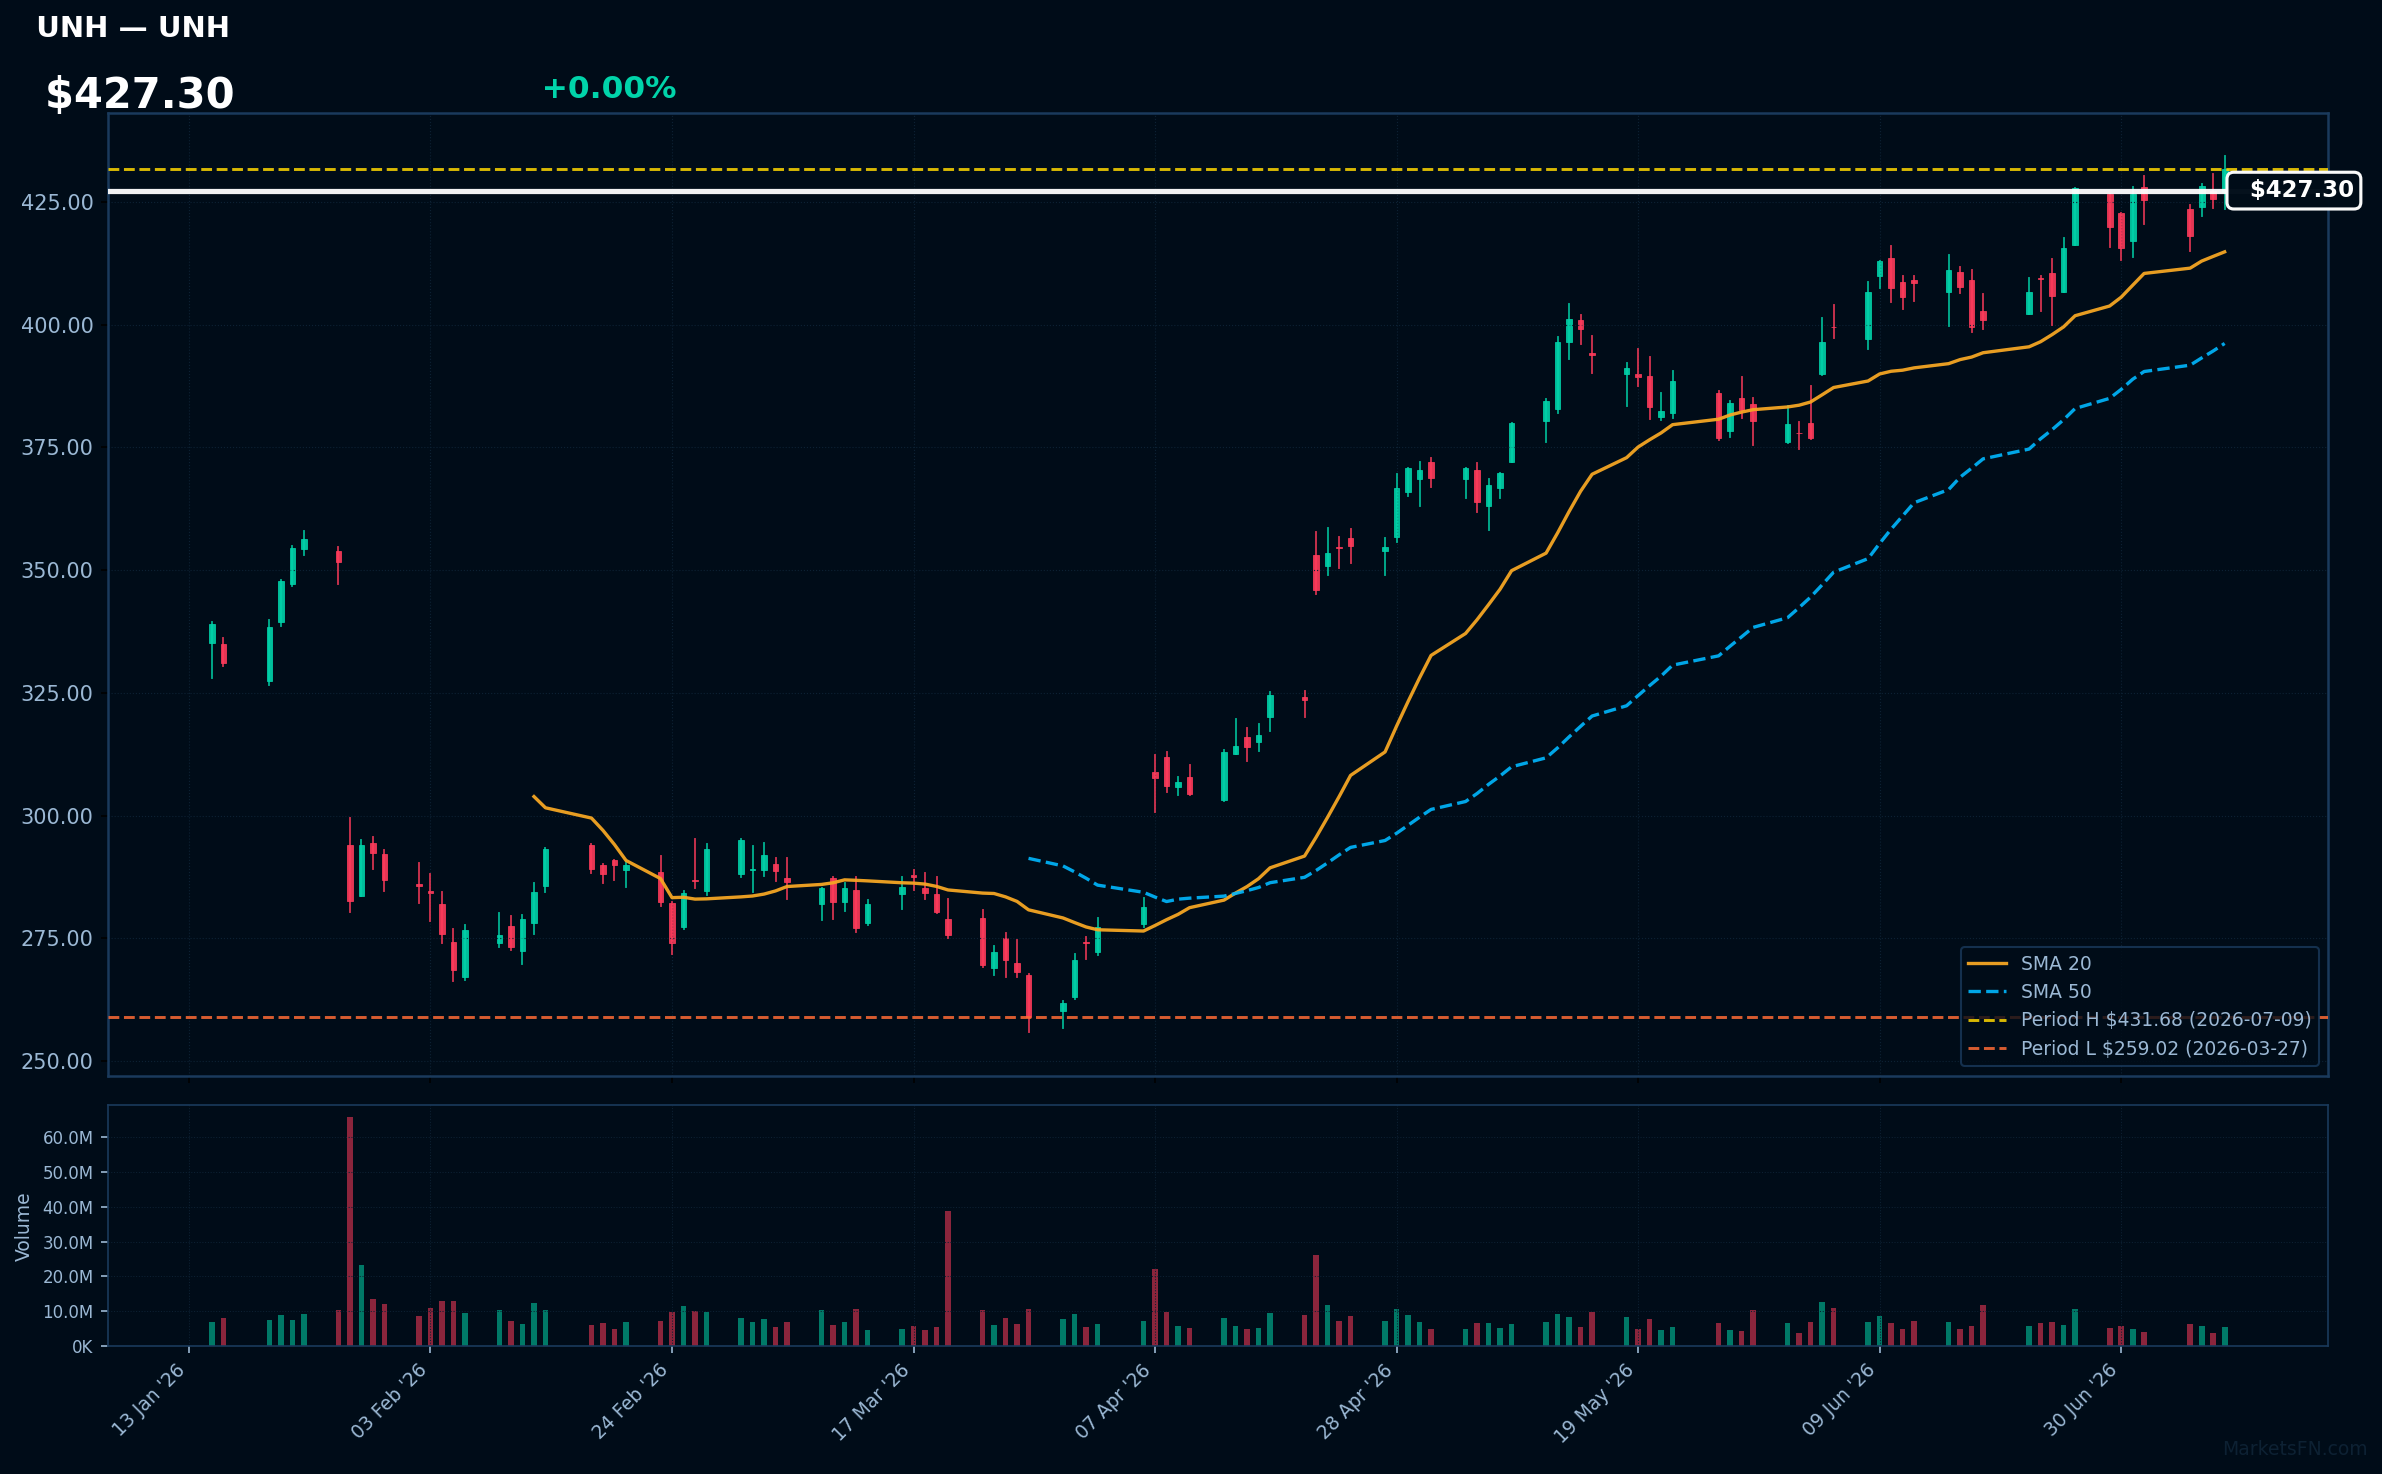
UNH | Unitedhealth Group Inc | Healthcare | Price Last: $431.68 | % Realized: +28.32% | RSI: 61.1 | % above MA200: +27.2% | Trend: Above MA20, MA50, MA200
Unitedhealth Group Inc operates health insurance and healthcare services businesses, with a diversified revenue stream across individual and group markets, Medicare, and Medicaid. Investors should care about its market-leading position and potential for sustained growth in the healthcare sector.
Unitedhealth Group Inc is in a sustained uptrend with price ($427.30) above MA20 > MA50 > MA200. RSI(14) is 61.1, indicating moderate momentum. The stock is 0.0% below its 2026 YTD high, suggesting a potential breakout.
Related headlines
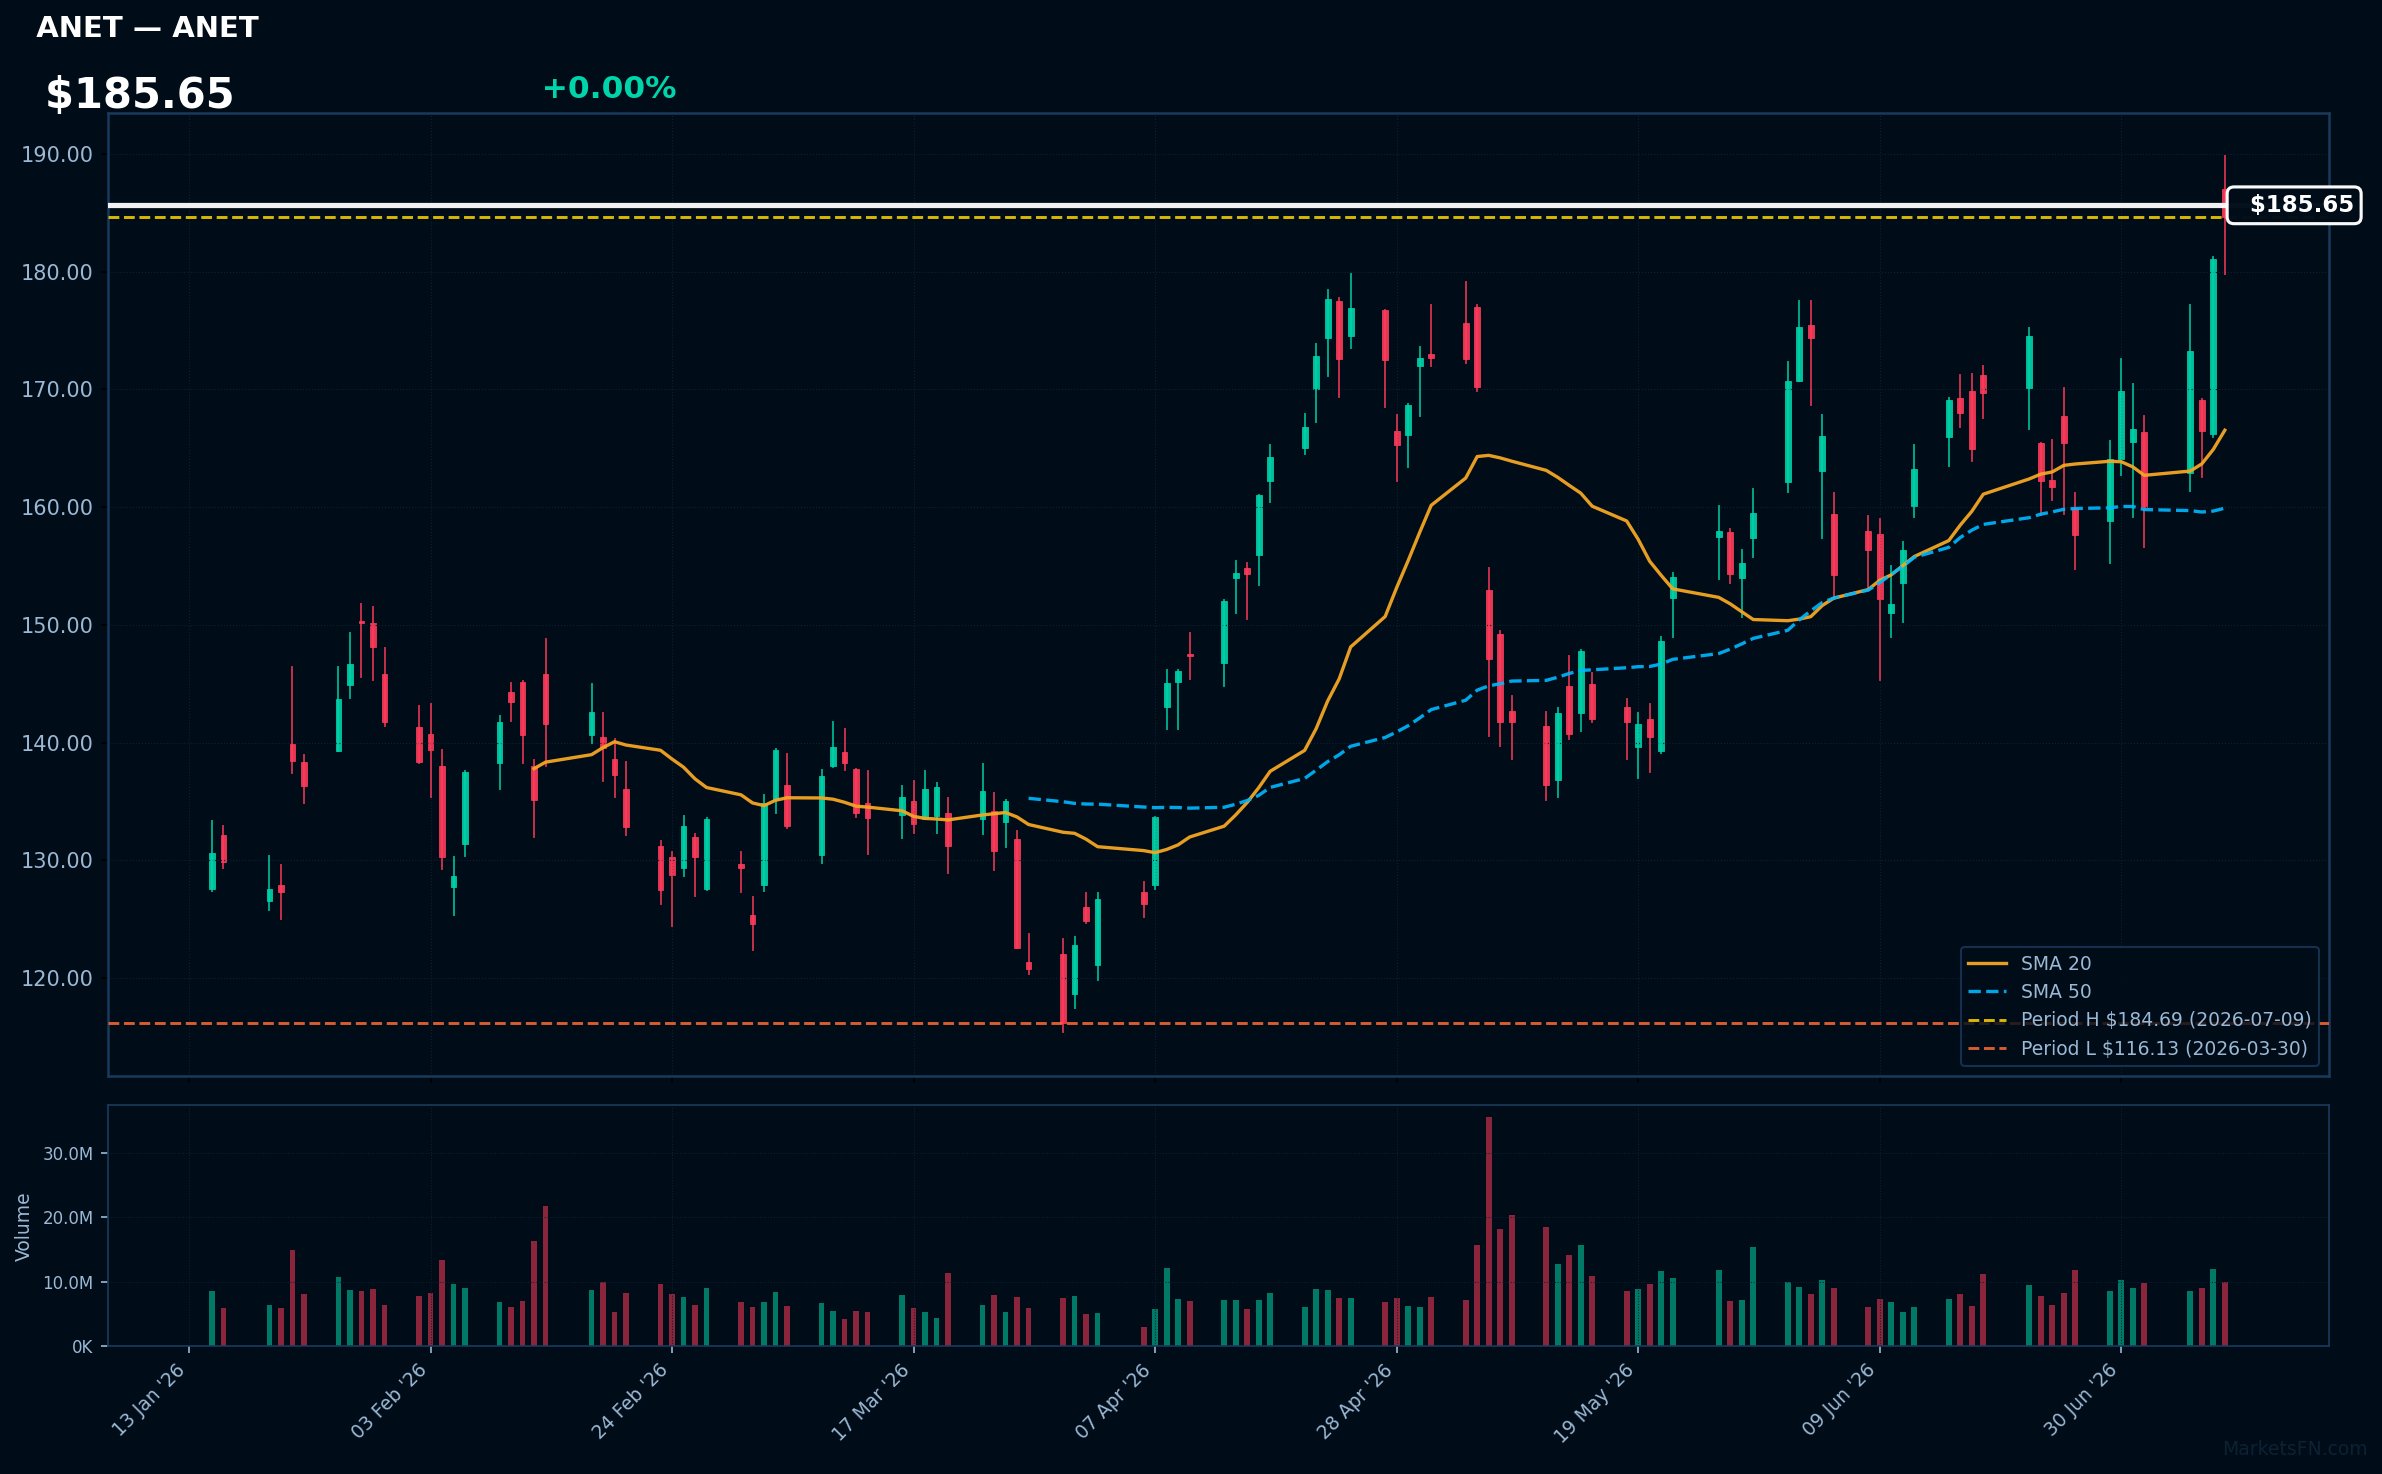
ANET | Arista Networks Inc | Technology | Price Last: $184.69 | % Realized: +38.24% | RSI: 62.3 | % above MA200: +28.3% | Trend: Above MA20, MA50, MA200
Arista Networks Inc is a cloud networking company providing high-performance switching solutions for data centers. Investors should care due to its strong presence in the rapidly growing cloud infrastructure market, driven by increasing demand for high-bandwidth, low-latency networking.
Arista Networks Inc is in a sustained uptrend with price ($185.65) above MA20 > MA50 > MA200. RSI(14) is 62.3, indicating building momentum. The stock is 0.0% below its 2026 YTD high, suggesting a potential breakout, with 38.2% return over the 2026 YTD period.
Related headlines
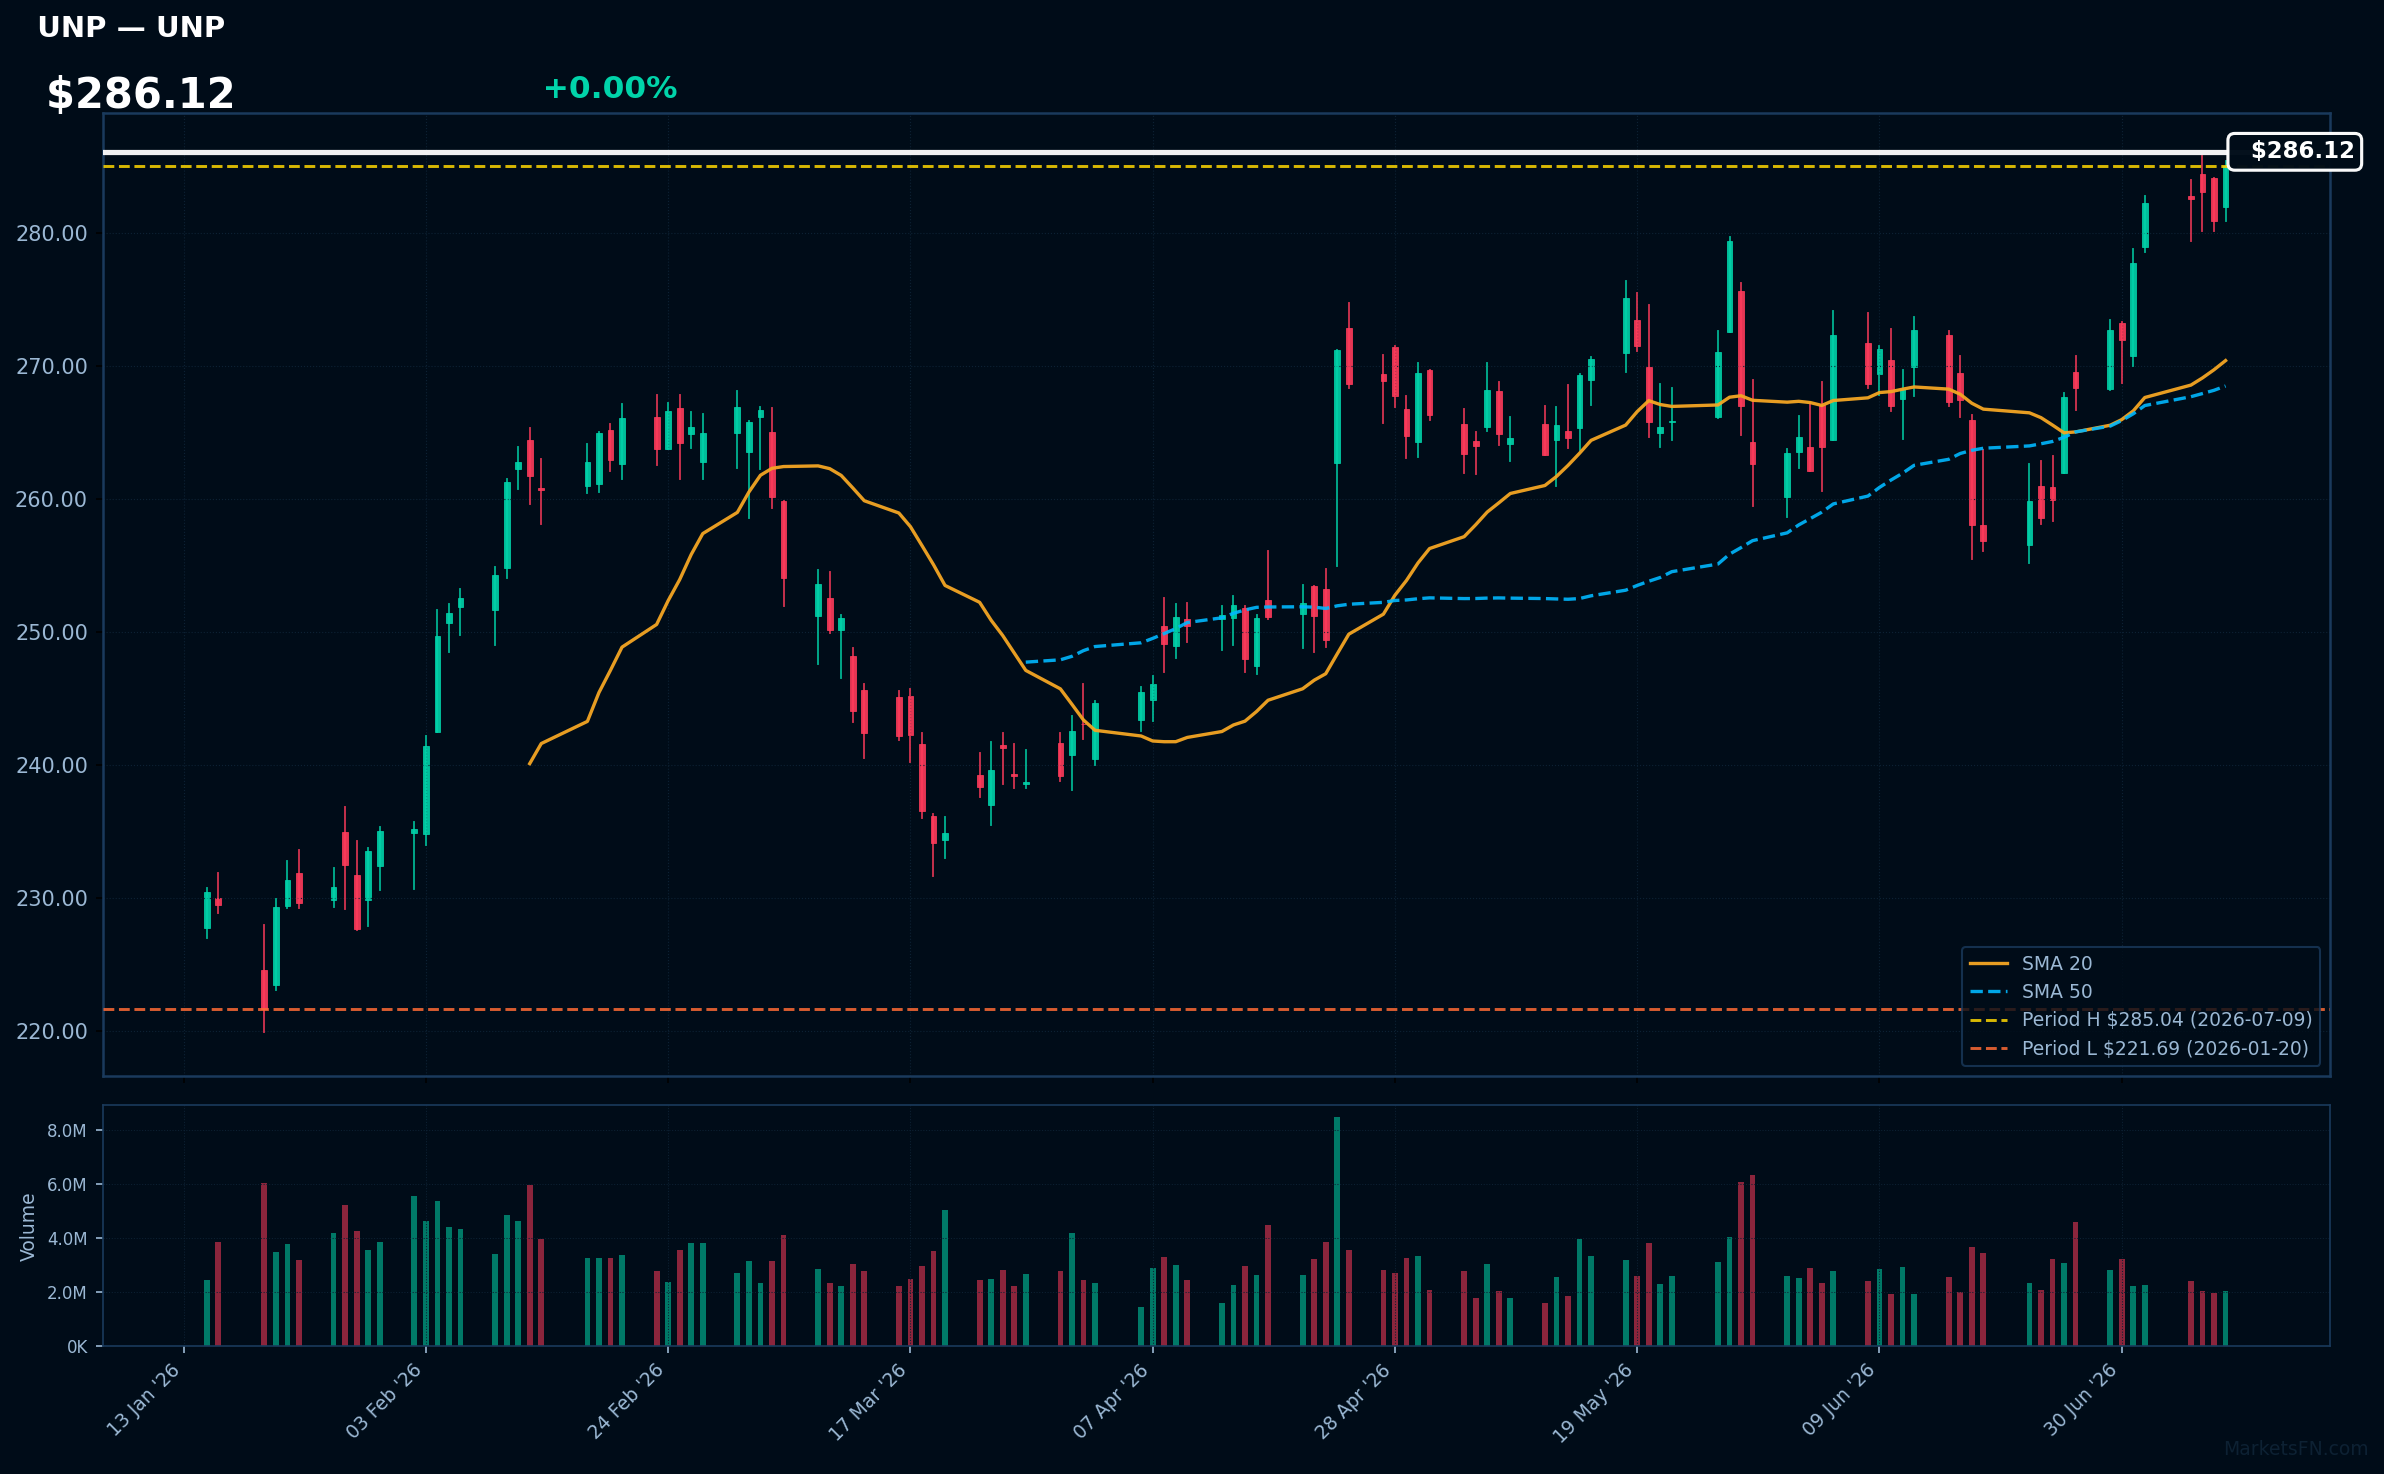
UNP | Union Pacific Corp | Industrials | Price Last: $285.04 | % Realized: +22.91% | RSI: 67.4 | % above MA200: +15.9% | Trend: Above MA20, MA50, MA200
Union Pacific Corp (UNP) operates North America's largest railroad network, transporting goods across 23 states. Investors should care because its performance reflects the overall health of the US economy and supply chain efficiency.
UNP's RSI(14) is 67.4, indicating rising momentum. The MA alignment (price > MA20 > MA50 > MA200) confirms a sustained uptrend. With the stock 0.0% below its 2026 YTD high, it nears a potential breakout level, suggesting continued momentum.
Related headlines
- EXCLUSIVE: Union Pacific, Norfolk Southern CEOs talk about the rail merger that could reshape the U.S. economy
- Union Pacific, Norfolk Southern submit more merger data
- Union Pacific and Norfolk Southern Respond to STB's Request for Supplemental Information, Submitting First Round of Their Responses
- Union Pacific and Norfolk Southern Celebrate Americas 250th Anniversary with Worlds Largest Steam Locomotive in Philadelphia
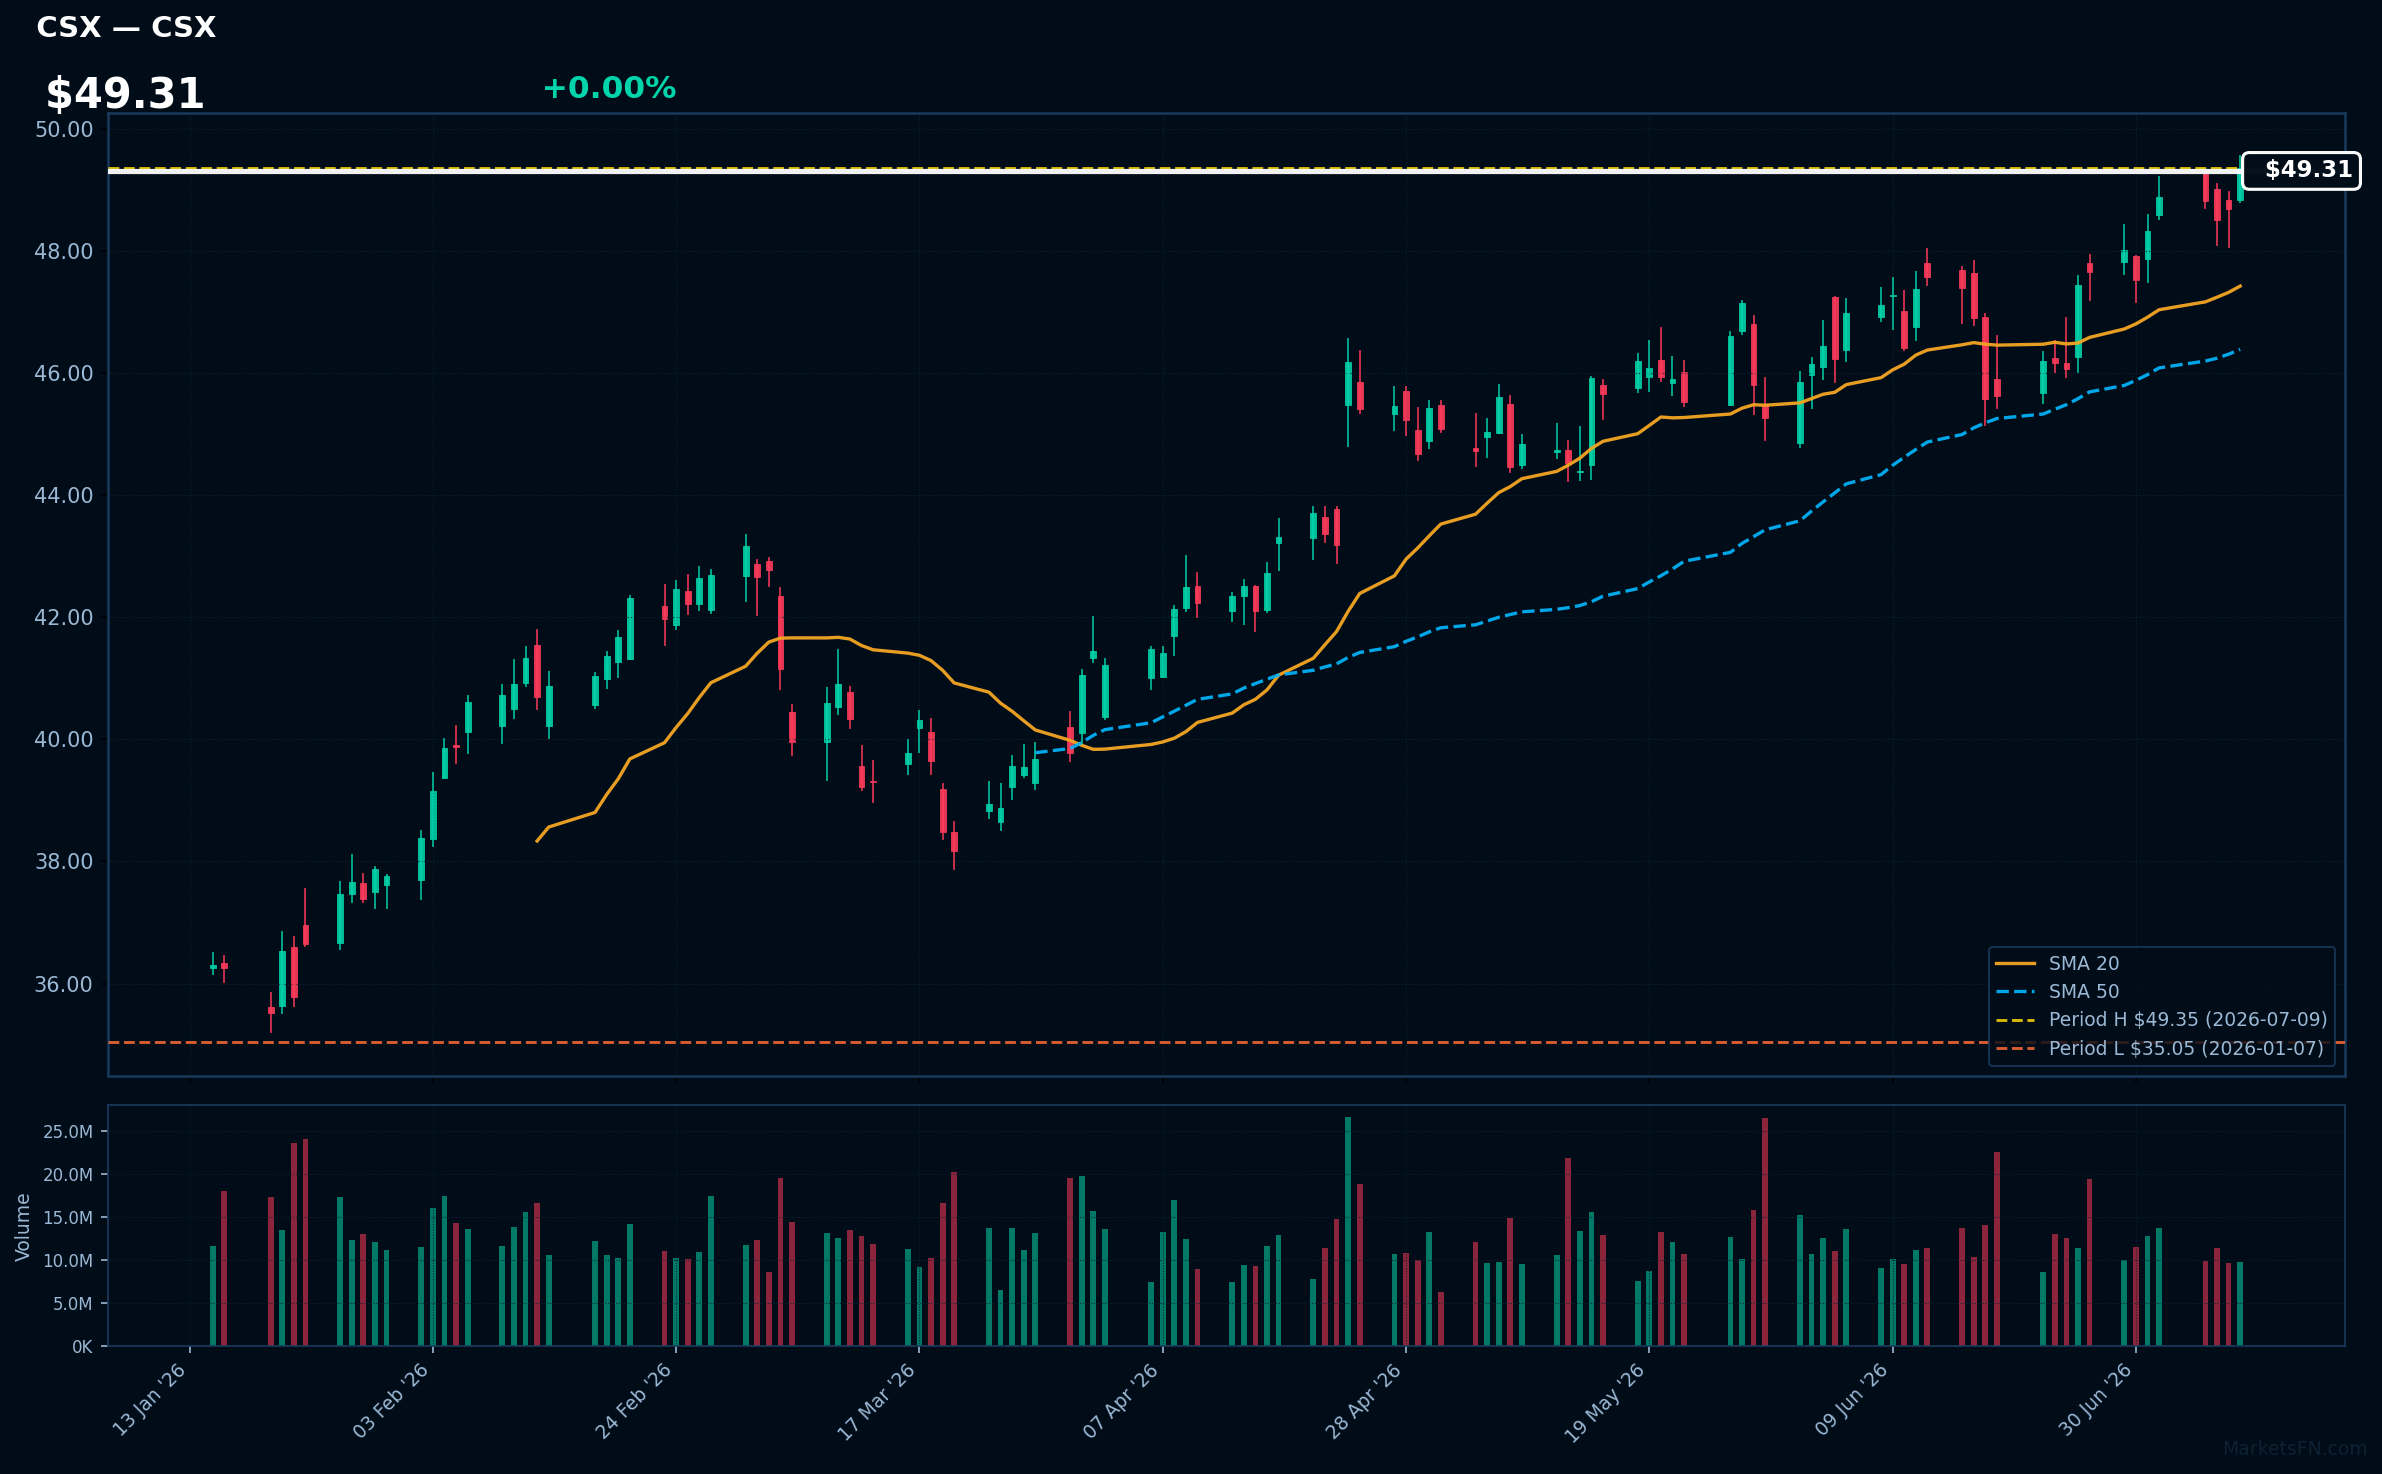
CSX | CSX Corp | Industrials | Price Last: $49.35 | % Realized: +36.06% | RSI: 66.5 | % above MA200: +22.9% | Trend: Above MA20, MA50, MA200
CSX Corp operates a rail network transporting coal, intermodal containers, and automotive goods, making it a key player in North American freight infrastructure; investors should care due to its critical role in supply chains and potential for steady cash flows.
CSX Corp's technicals indicate sustained uptrend with price > MA20 > MA50 > MA200, RSI(14) at 66.5, and 0.0% below its 2026 YTD high, suggesting momentum; the stock is near a potential breakout level with a 36.1% 2026 YTD return.
Related headlines
📉 Nearest to 2026 Low
Sectors represented: Real Estate (2), Basic Materials (1), Consumer Defensive (1), Energy (1)
| Ticker | Company | Sector | Price Last | % Realized | 2026 YTD Low Date | RSI | % above MA200 | Trend |
|---|---|---|---|---|---|---|---|---|
| VICI | VICI Properties Inc | Real Estate | $25.93 | -7.89% | 2026-07-09 | 40.1 | -10.0% | Below MA20, MA50, MA200 |
| ALB | Albemarle Corp | Basic Materials | $128.42 | -10.78% | 2026-07-09 | 29.2 | -14.5% | Below MA20, MA50, MA200 |
| WY | Weyerhaeuser Co | Real Estate | $22.50 | -5.46% | 2026-07-08 | 44.8 | -6.8% | Below MA20, MA50, MA200 |
| HSY | Hershey Company | Consumer Defensive | $171.65 | -5.90% | 2026-06-22 | 39.9 | -11.1% | Below MA20, MA50, MA200 |
| EQT | EQT Corp | Energy | $50.15 | -6.19% | 2026-01-15 | 33.2 | -11.5% | Below MA20, MA50, MA200 |
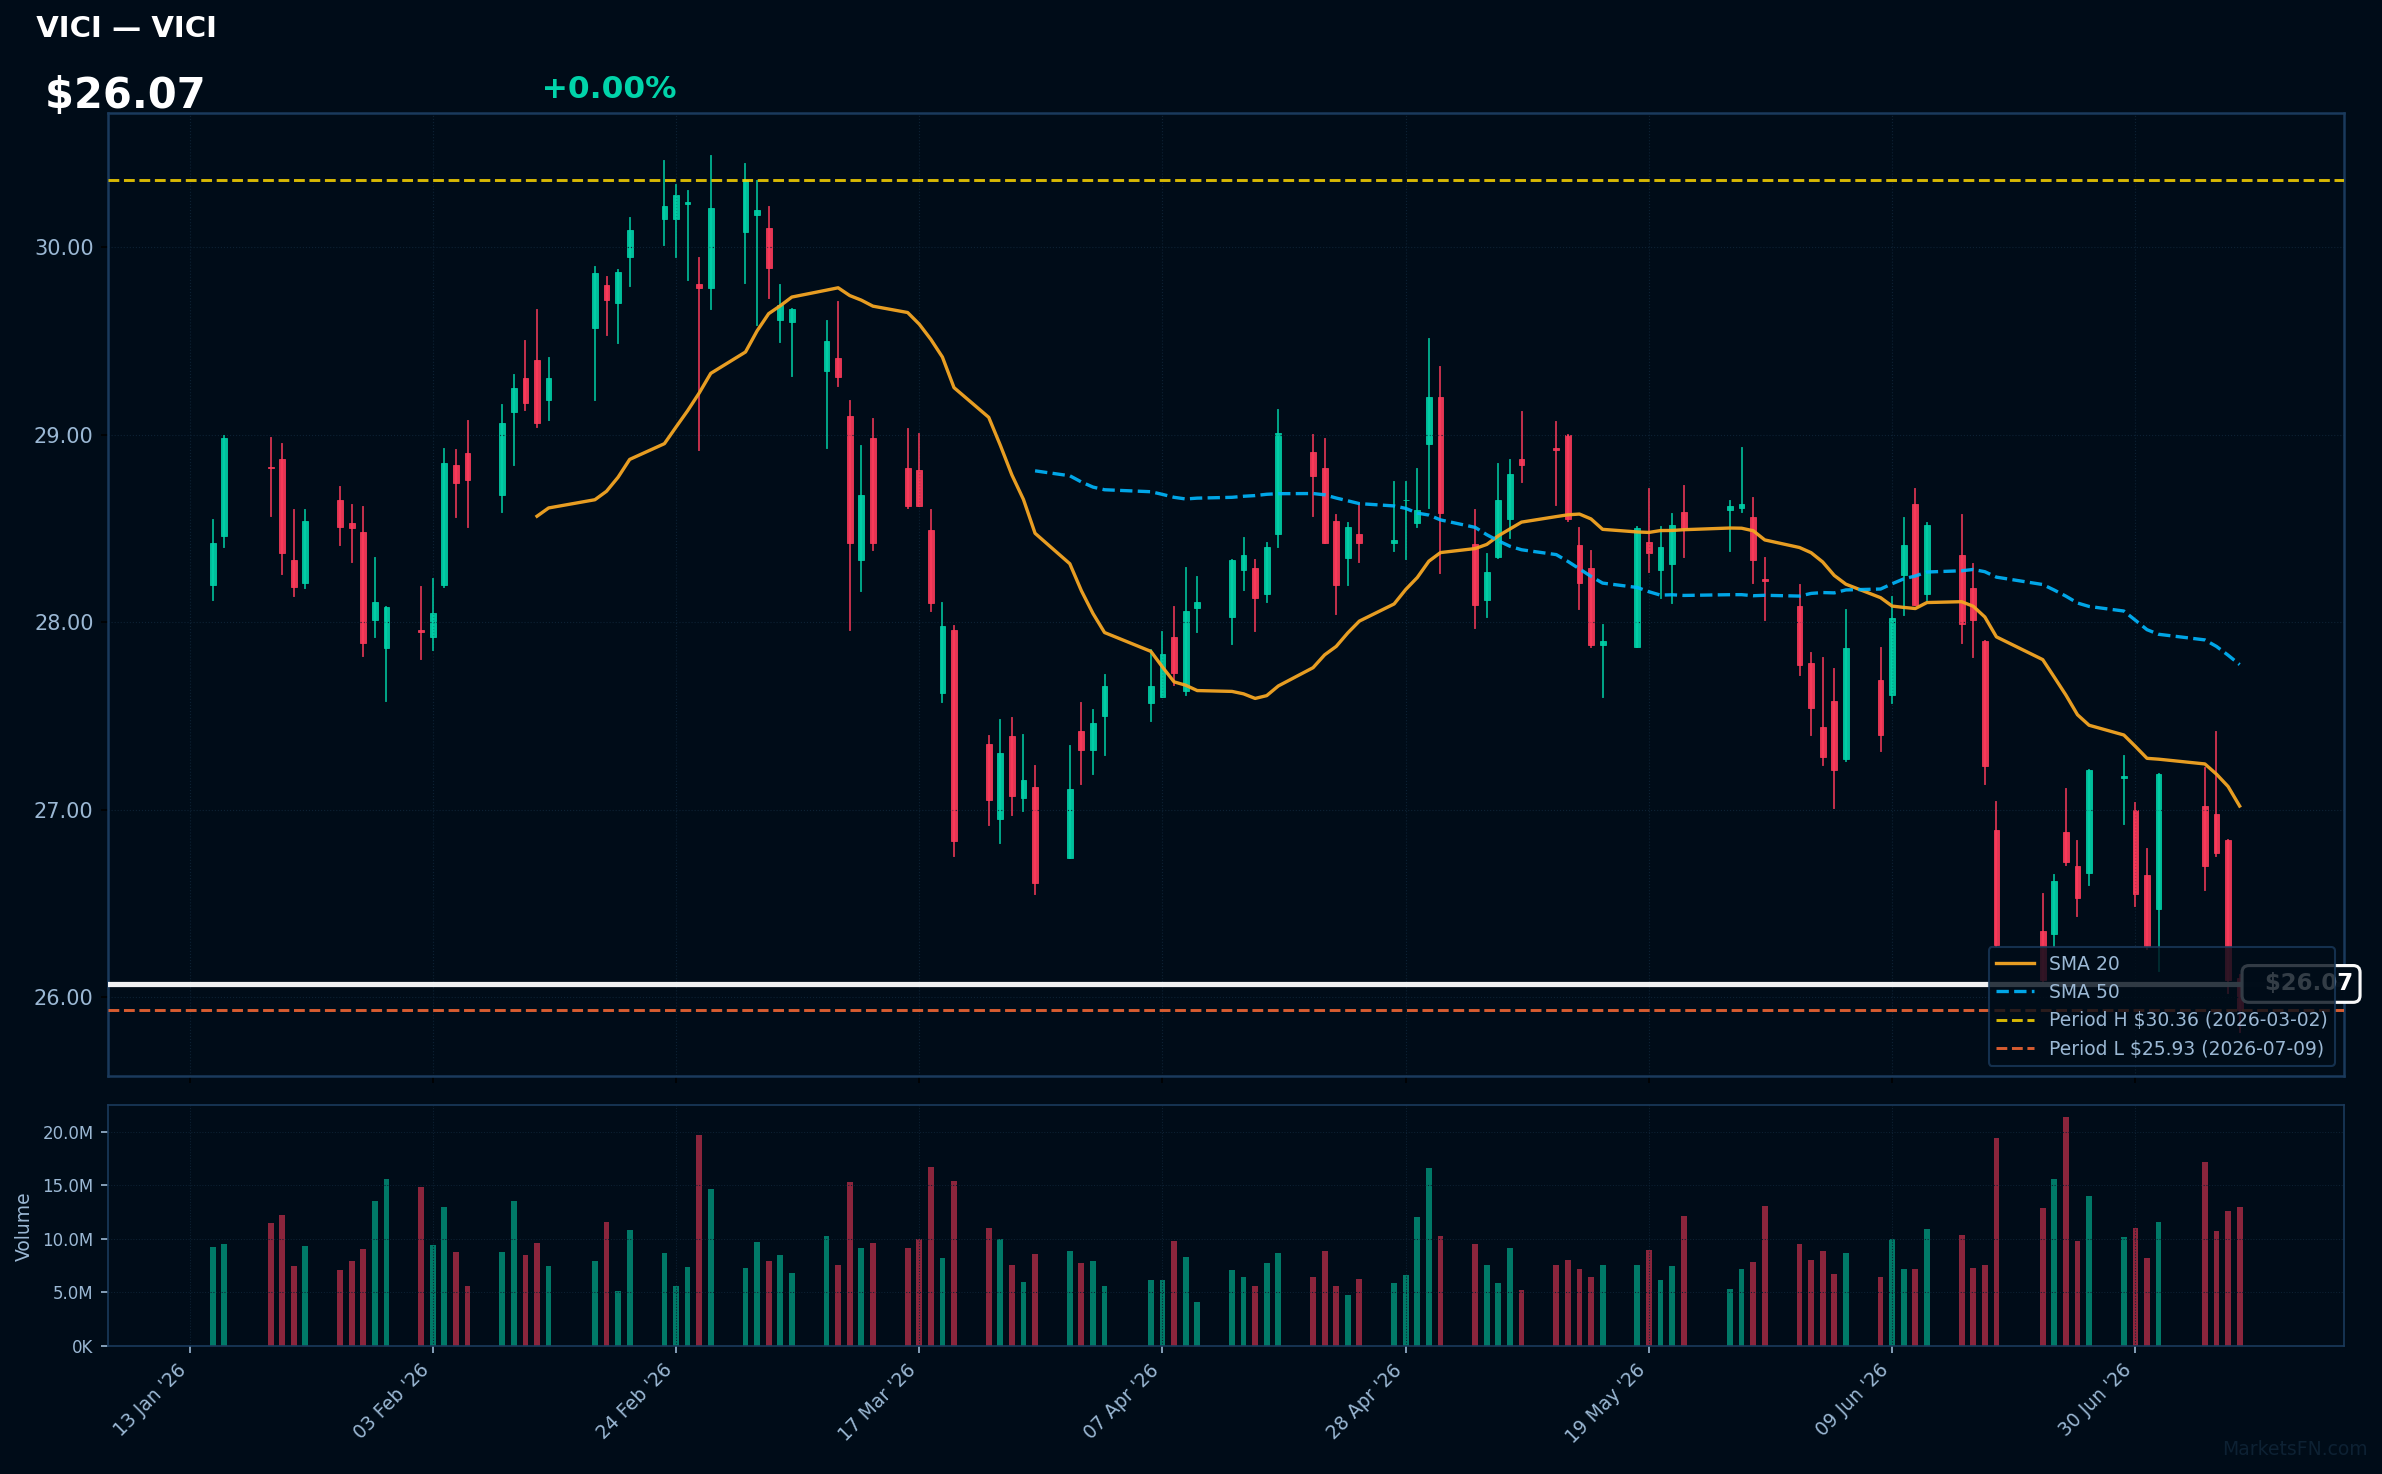
VICI | VICI Properties Inc | Real Estate | Price Last: $25.93 | % Realized: -7.89% | RSI: 40.1 | % above MA200: -10.0% | Trend: Below MA20, MA50, MA200
VICI Properties Inc is a real estate investment trust (REIT) that owns and acquires entertainment, hospitality, and gaming properties. Investors should care because its performance is tied to the recovery and growth of these industries, particularly in the post-pandemic era.
VICI is testing major support at its 2026 YTD low with an RSI(14) of 40.1, indicating bearish momentum. The sustained downtrend is confirmed by bearish MA alignment: price ($26.07) < MA20 < MA50 < MA200, a warning sign for investors.
Related headlines
- VICI Properties Inc. Announces Release Date for Second Quarter 2026 Results
- VICI Properties Inc. Completes Sale-Leaseback of Canadian Portfolio in Connection With Pure Casino Entertainment's Acquisition of Gamehost
- VICI Properties and Club Med Announce Acquisition and Redevelopment of Carambola Beach Resort in St. Croix
- CLUB MED ADVANCES STRATEGIC NORTH AMERICAN EXPANSION WITH THE REDEVELOPMENT OF CARAMBOLA BEACH RESORT IN ST. CROIX IN PARTNERSHIP WITH VICI PROPERTIES
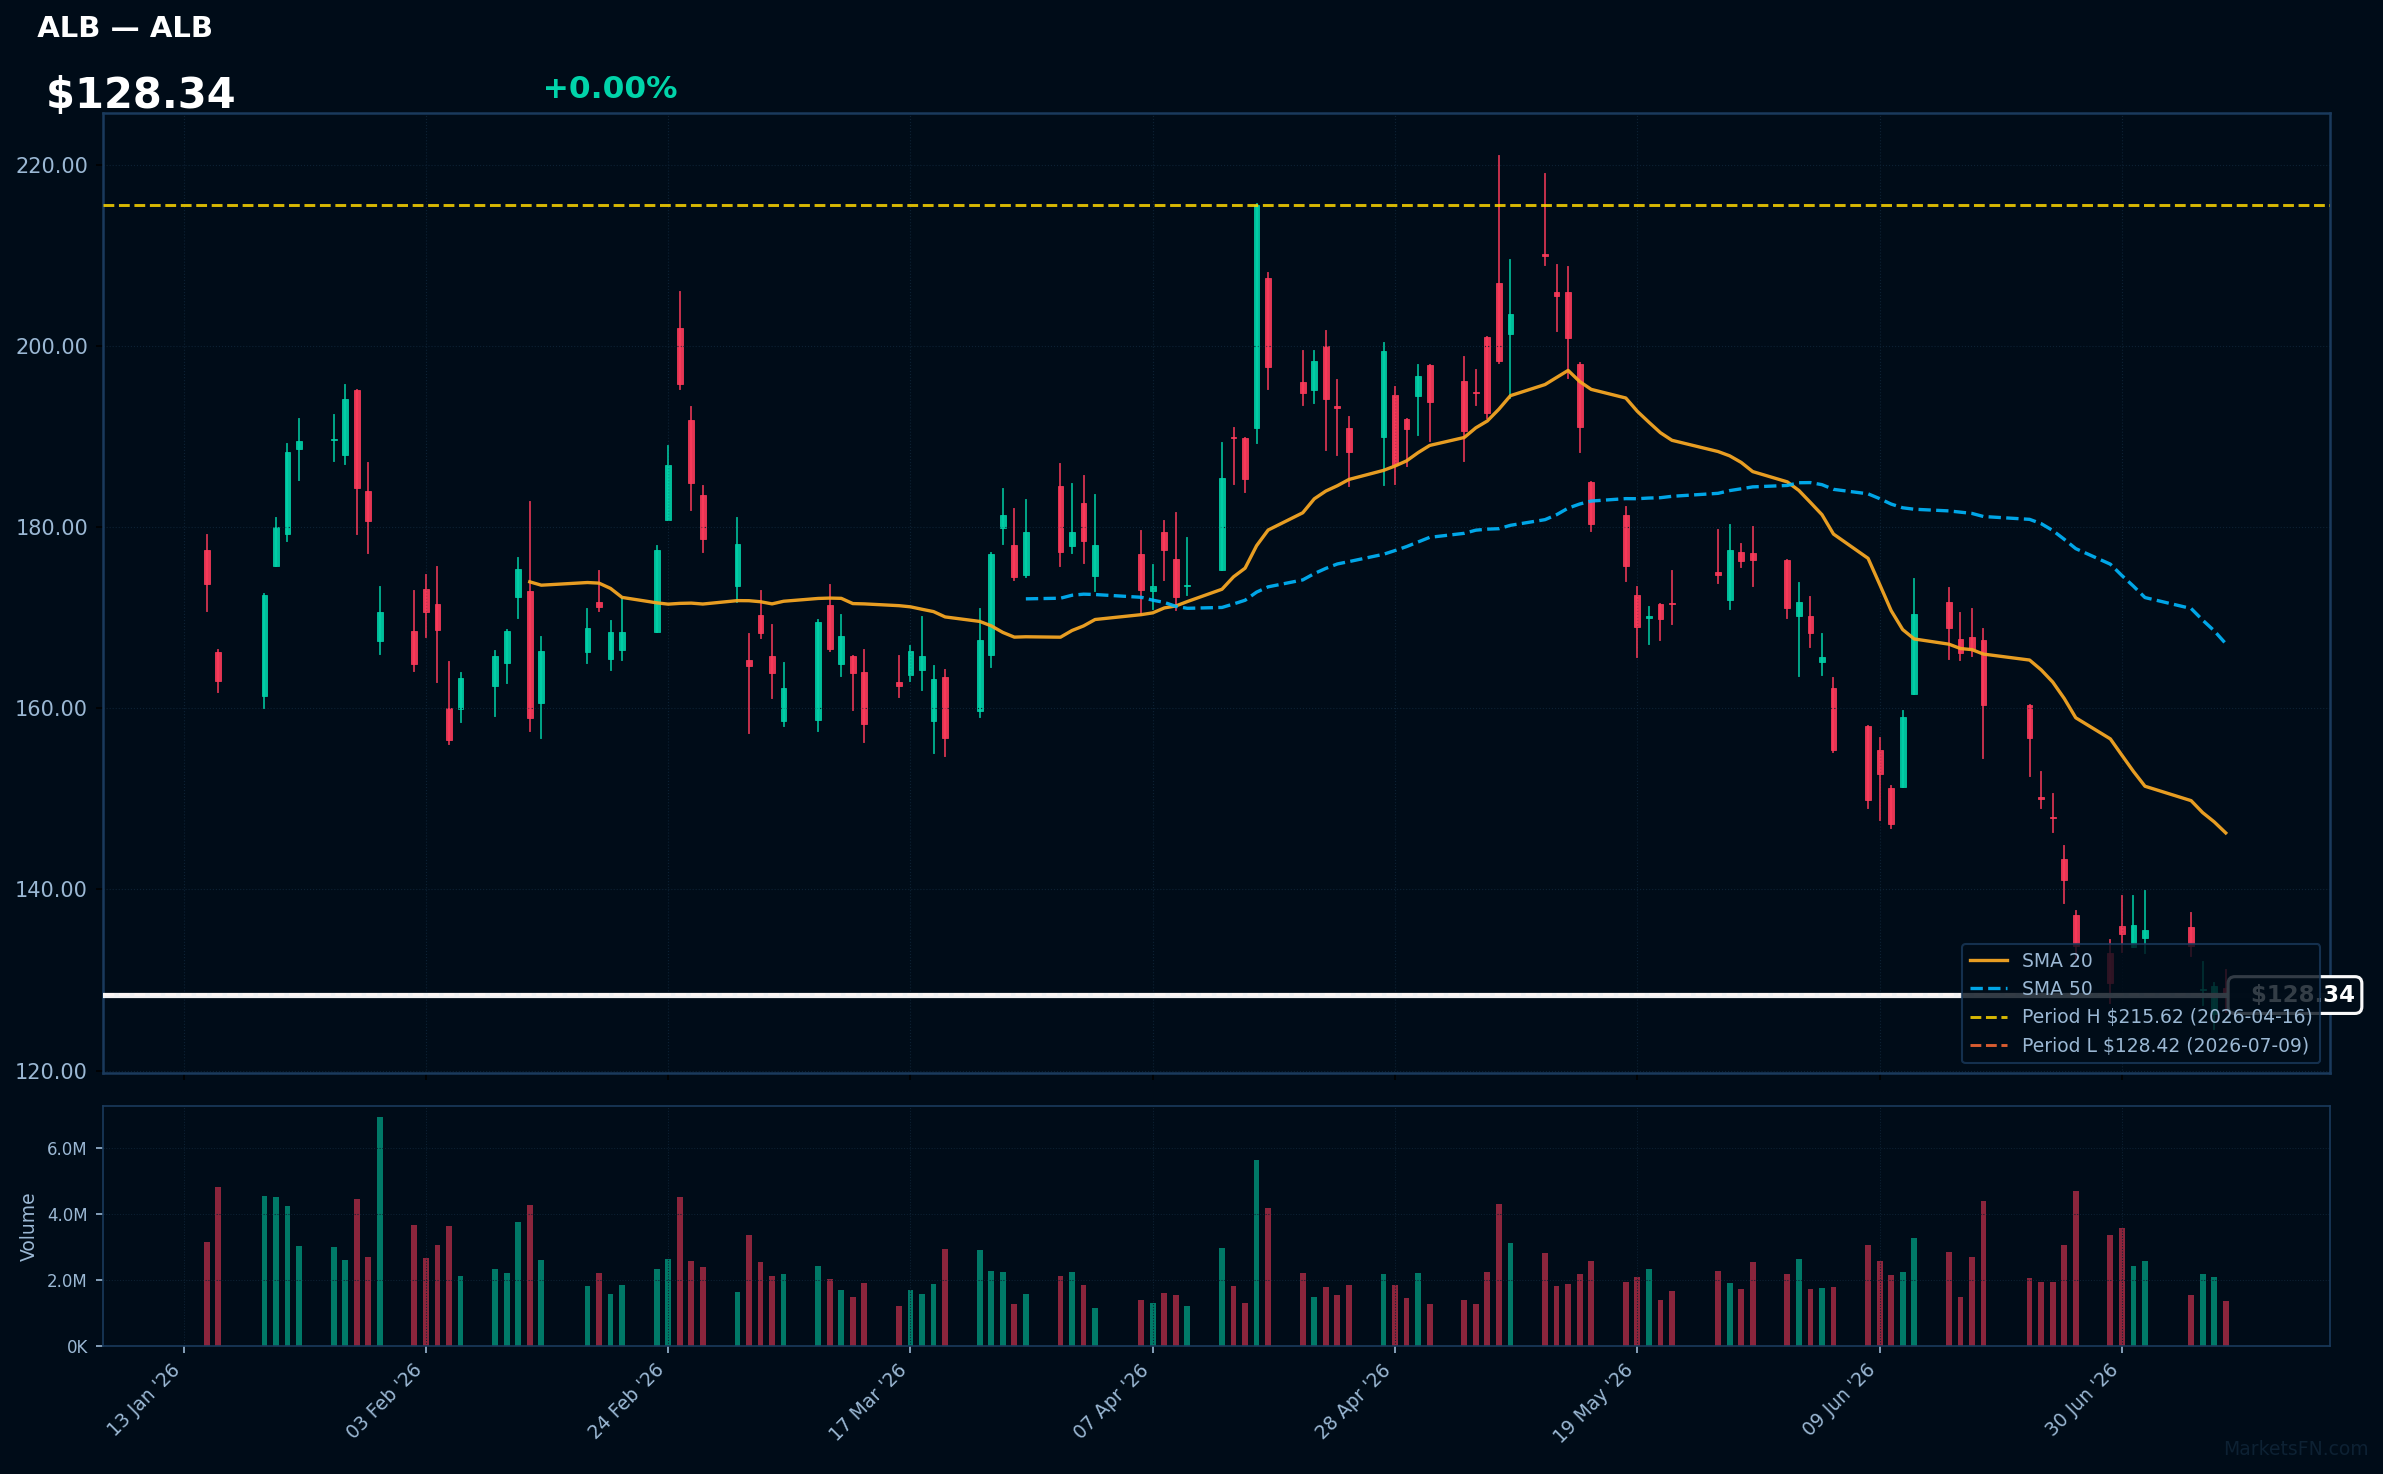
ALB | Albemarle Corp | Basic Materials | Price Last: $128.42 | % Realized: -10.78% | RSI: 29.2 | % above MA200: -14.5% | Trend: Below MA20, MA50, MA200
Albemarle Corp is a leading producer of lithium, bromine, and refining catalysts. Investors care due to its critical role in lithium-ion battery production for electric vehicles, a rapidly growing market driven by global decarbonization efforts.
Albemarle Corp's technical situation indicates a potential warning sign with an RSI(14) of 29.2, suggesting oversold conditions, and the stock price below MA20, MA50, and MA200, showing bearish alignment. It's testing major support at its 2026 YTD low.
Related headlines
- Albemarle Corporation to Release Second Quarter 2026 Earnings Results on Wednesday, August 5, 2026
- Albemarle Corp. stock outperforms competitors on strong trading day
- Albemarle Corp. stock underperforms Friday when compared to competitors
- Albemarle Corp. stock underperforms Thursday when compared to competitors
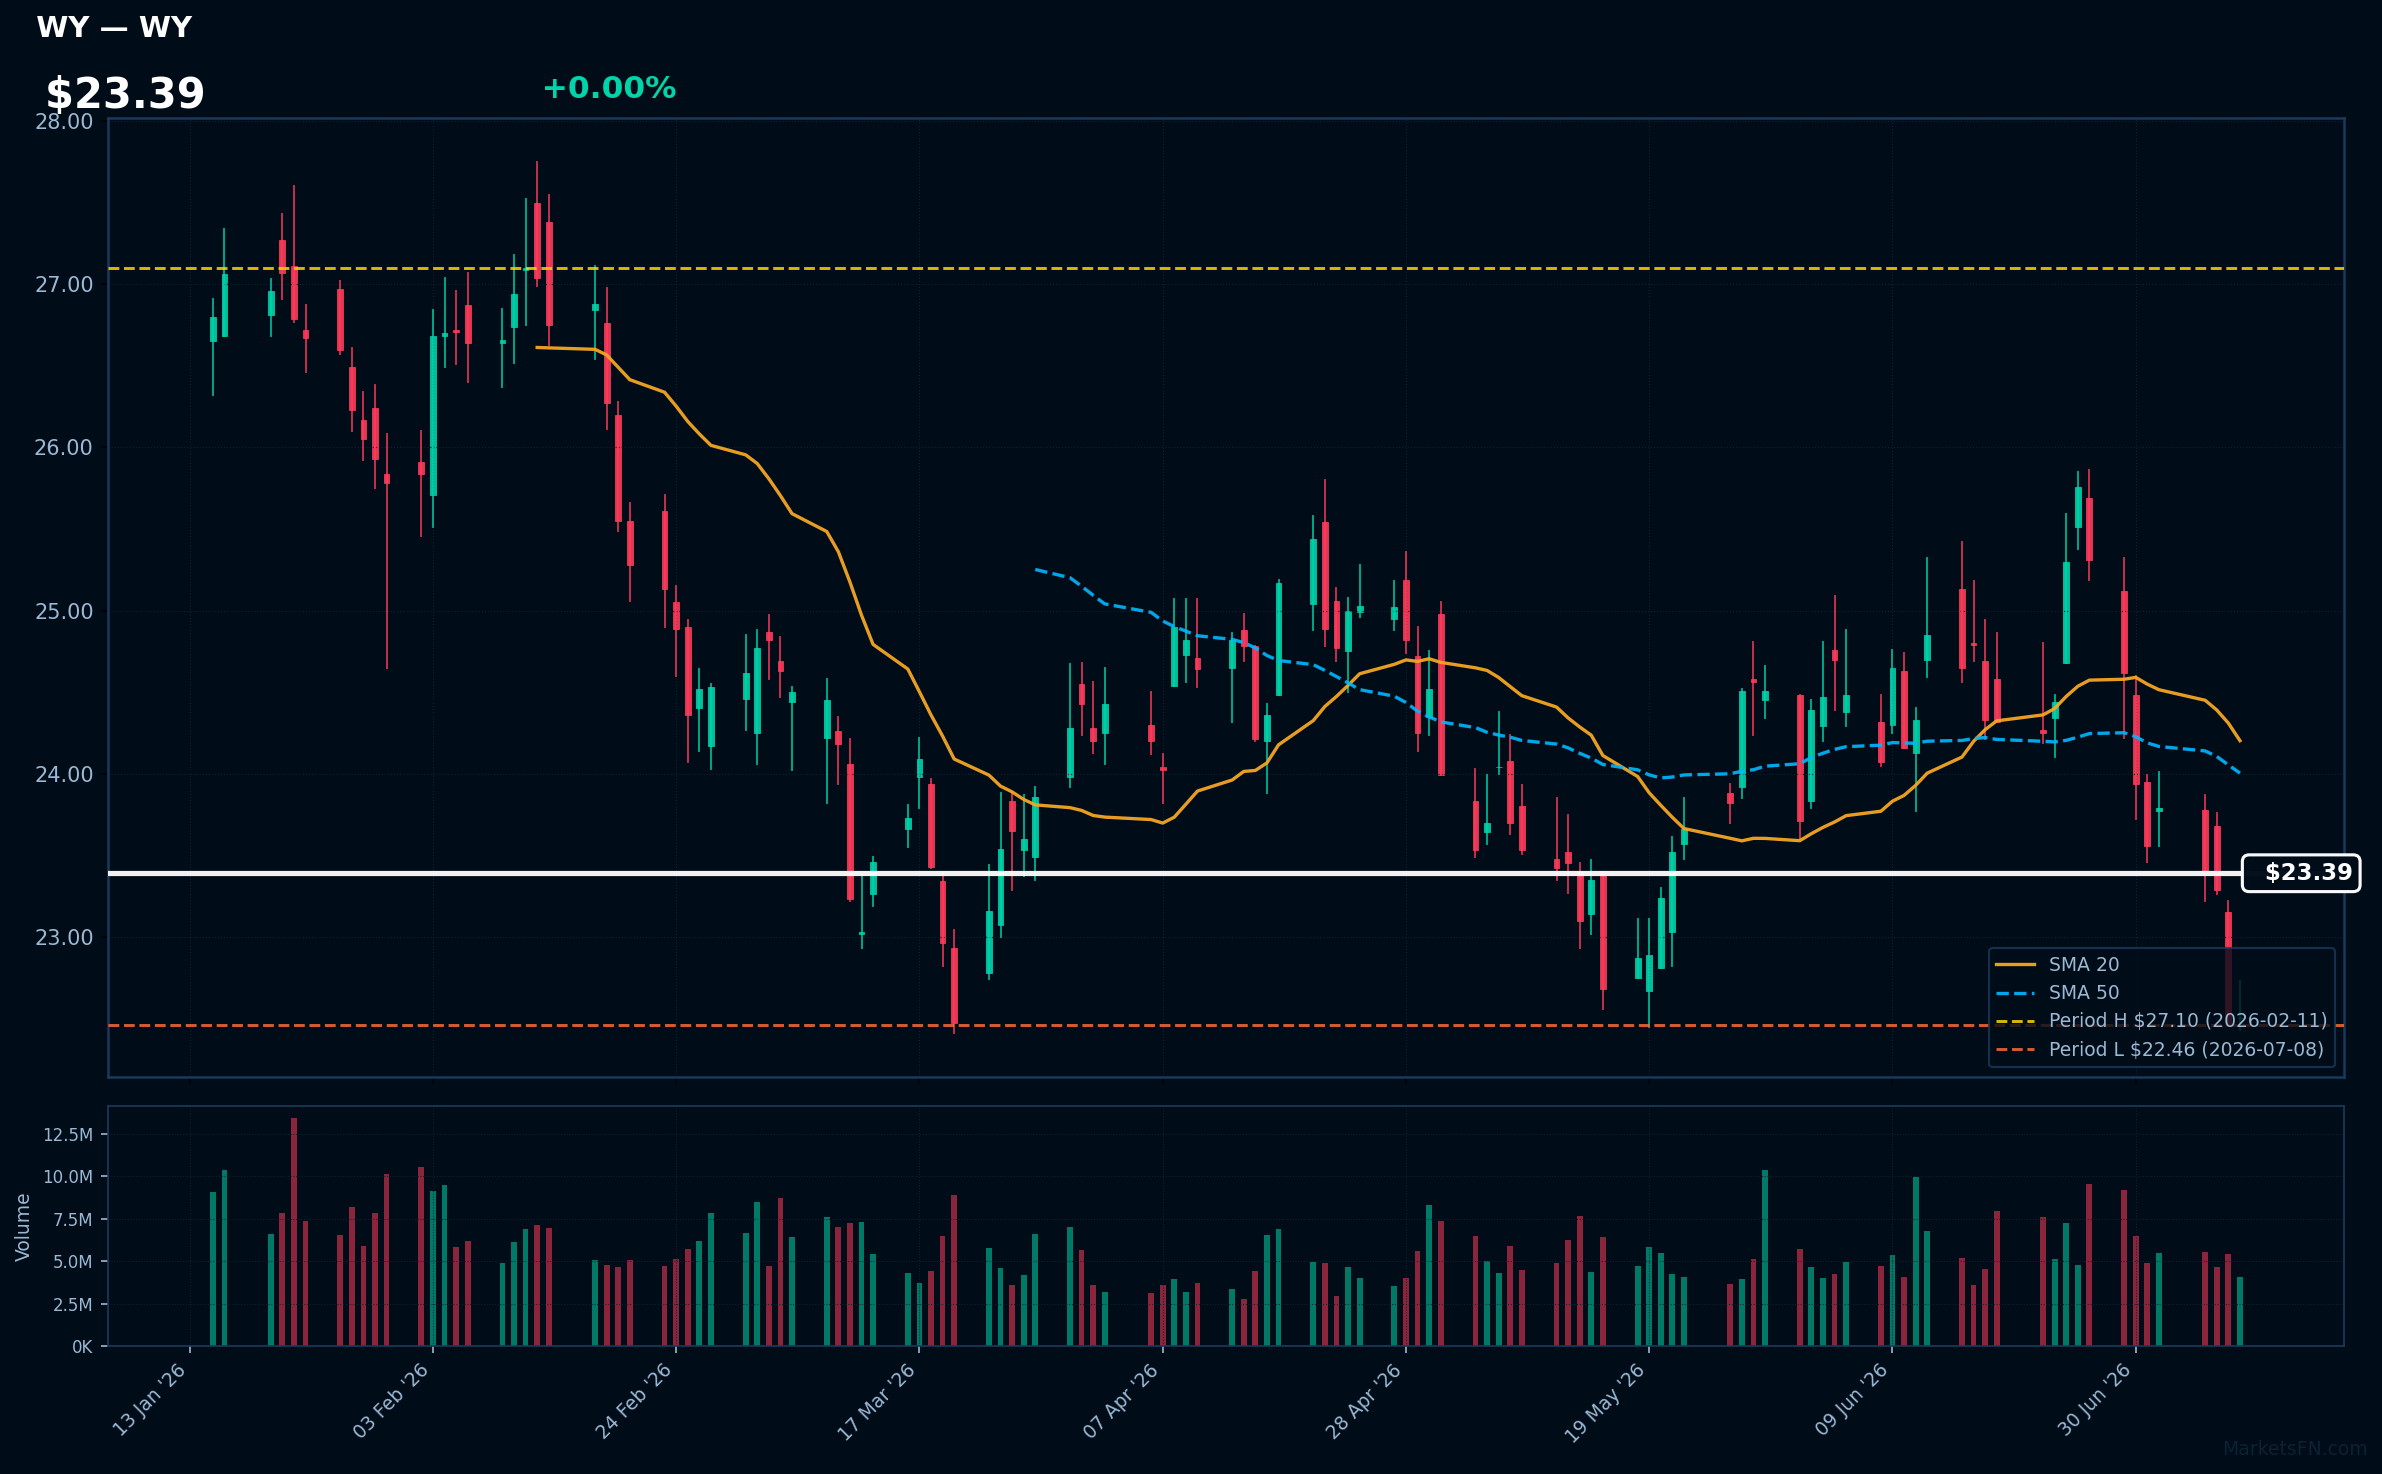
WY | Weyerhaeuser Co | Real Estate | Price Last: $22.50 | % Realized: -5.46% | RSI: 44.8 | % above MA200: -6.8% | Trend: Below MA20, MA50, MA200
Weyerhaeuser Co is a timberlands owner and operator, generating revenue primarily through timber sales, land sales, and real estate development. Investors should care about its ability to balance timber harvesting with land appreciation and navigate demand fluctuations.
Weyerhaeuser Co's technicals indicate a warning sign: RSI(14) is 44.8, below MA20/MA50/MA200 with mixed signals, and the stock is 0.2% above its 2026 YTD low, testing major support after a -5.5% 2026 YTD return.
Related headlines
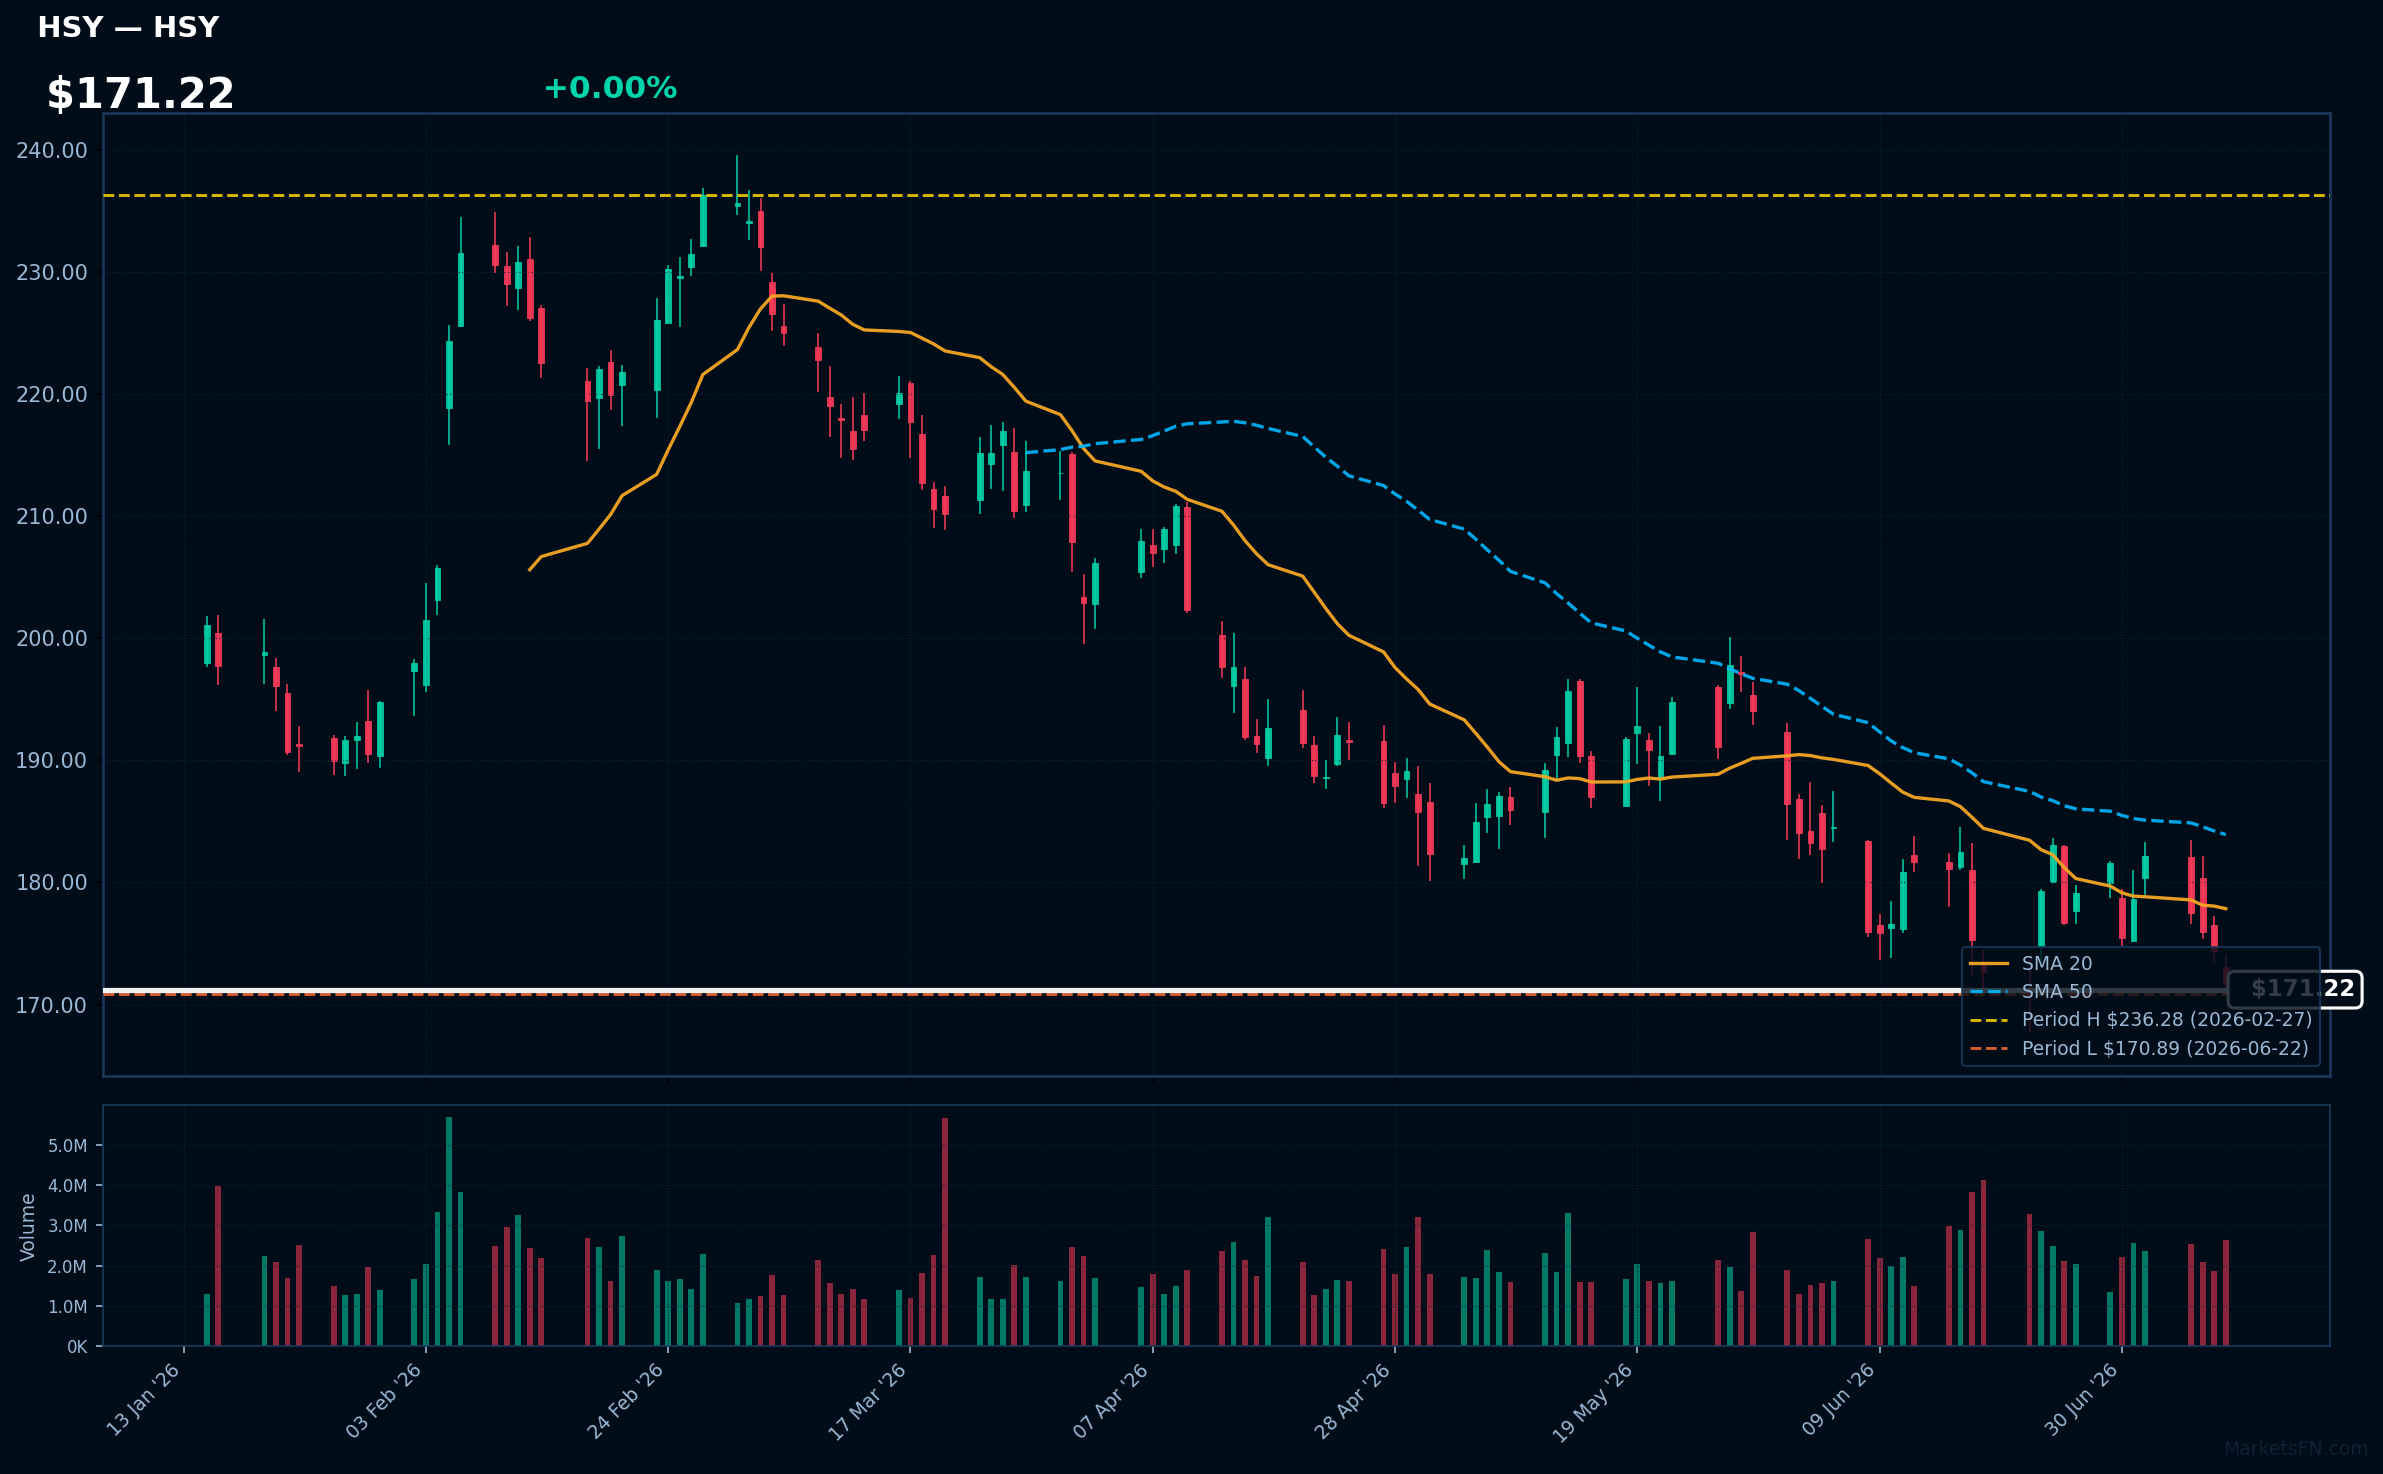
HSY | Hershey Company | Consumer Defensive | Price Last: $171.65 | % Realized: -5.90% | RSI: 39.9 | % above MA200: -11.1% | Trend: Below MA20, MA50, MA200
Hershey Company is a leading manufacturer and distributor of confectionery and snack products, with iconic brands like Reese's and Hershey's Kisses. Investors should care about its ability to maintain market share and navigate changing consumer preferences.
Hershey's current technical situation is bearish, with an RSI(14) of 39.9 indicating weakening momentum. The sustained downtrend is evident in the MA alignment: price ($171.22) < MA20 < MA50 < MA200, and the stock is testing major support near its 2026 YTD low.
Related headlines
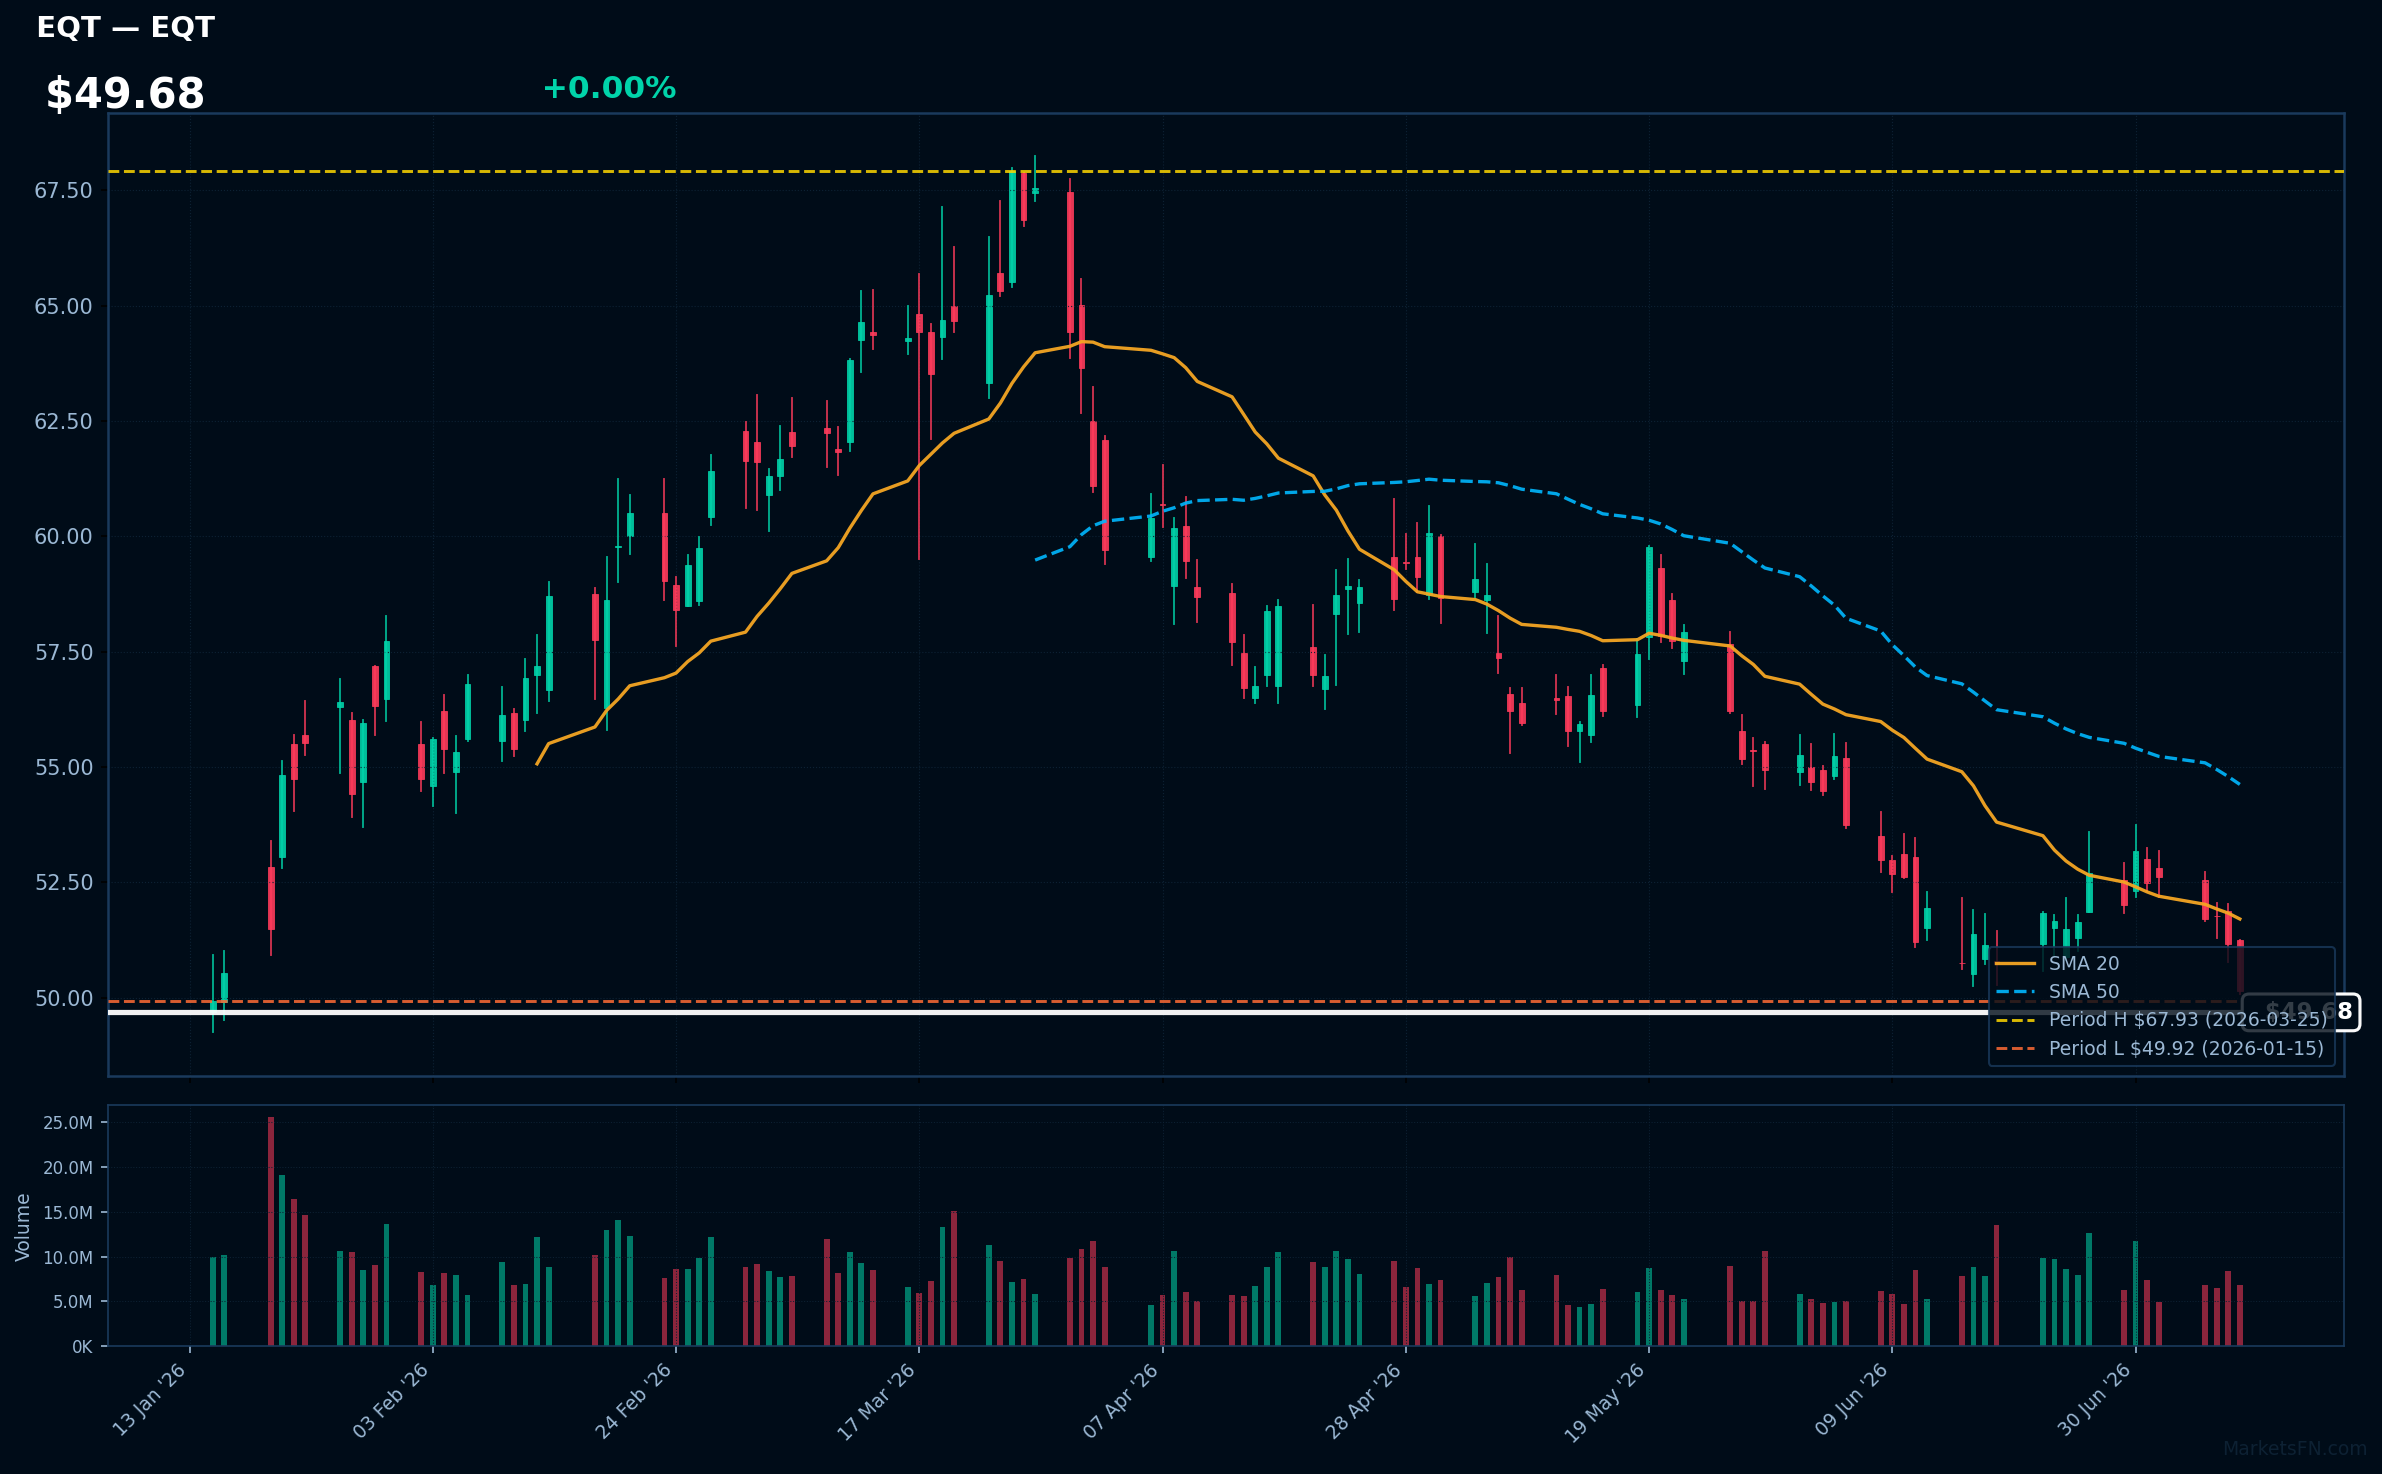
EQT | EQT Corp | Energy | Price Last: $50.15 | % Realized: -6.19% | RSI: 33.2 | % above MA200: -11.5% | Trend: Below MA20, MA50, MA200
EQT Corp is a natural gas producer. Investors should care because its performance is tied to energy demand and commodity prices. As a producer, its operational efficiency and production volumes directly impact revenue.
EQT Corp's technicals indicate a sustained downtrend with price ($49.68) below all MAs (MA20, MA50, MA200) and RSI(14) at 33.2, nearing oversold territory. The stock is 0.5% above its 2026 YTD low, testing major support.
Related headlines
Market Commentary
The S&P 500 stocks listed are near their 2026 year-to-date (YTD) extremes, with some at their highs and others at their lows. Stocks like AAPL, UNH, ANET, UNP, and CSX are at their 2026 YTD highs, indicating strong performance, while VICI, ALB, WY, HSY, and EQT are near their 2026 YTD lows, suggesting weaker performance.
The stocks at their 2026 YTD highs are from diverse sectors, including technology (AAPL, ANET), healthcare (UNH), and industrials (UNP, CSX), indicating broad-based strength. In contrast, the stocks near their 2026 YTD lows are from sectors such as real estate (VICI), materials (ALB), and consumer staples (HSY), which may be facing headwinds. The disparity in performance may be driven by varying market conditions and sector-specific themes.
Investors should monitor these stocks for any changes in their YTD extreme status, as it may signal shifts in market sentiment or sector rotation. Additionally, tracking the underlying factors driving the performance of these stocks, such as earnings reports and industry trends, will be crucial in understanding the broader market dynamics.
Methodology: All 503 S&P 500 constituents screened. Close prices downloaded from 2026-01-01. Period high = highest close since Jan 1 2026; period low = lowest close since Jan 1 2026. Distance = (current price / period extreme − 1) × 100. Technical indicators computed on up to 1 year of daily OHLCV data.
Disclaimer: For informational purposes only. Not investment advice. Past performance is not indicative of future results.

