Nasdaq 100 2026 YTD Highs & Lows Radar: DoorDash (DASH), Trade Desk (TTD) and more
MarketsFN Team

Nasdaq 100 2026 YTD Highs & Lows Radar: DoorDash (DASH), Trade Desk (TTD) and more
Screening all 101 Nasdaq 100 constituents for stocks nearest to their 2026 year-to-date high and their 2026 YTD low. Data as of August 27, 2026. % Realized = total return since Jan 1 2026.
Legend: RSI > 70 = overbought · RSI < 30 = oversold · Green % Realized = positive YTD return · Red = negative.
📈 Nearest to 2026 High
Sectors represented: Consumer Cyclical (2), Communication Services (1), Healthcare (1), Technology (1)
| Ticker | Company | Sector | Price Last | % Realized | 2026 YTD High Date | RSI | % above MA200 | Trend |
|---|---|---|---|---|---|---|---|---|
| DASH | DoorDash Inc | Consumer Cyclical | $236.93 | +7.80% | 2026-08-26 | 69.5 | +26.2% | Above MA20, MA50, MA200 |
| EA | Electronic Arts, Inc | Communication Services | $209.70 | +0.38% | 2026-08-04 | — | — | — |
| SBUX | Starbucks Corp | Consumer Cyclical | $108.49 | +29.20% | 2026-08-13 | 55.9 | +11.8% | Above MA20, MA50, MA200 |
| BIIB | Biogen Inc | Healthcare | $221.07 | +24.32% | 2026-08-19 | 58.0 | +16.8% | Above MA20, MA50, MA200 |
| ADP | Automatic Data Processing Inc | Technology | $281.39 | +11.27% | 2026-08-24 | 66.0 | +19.2% | Above MA20, MA50, MA200 |
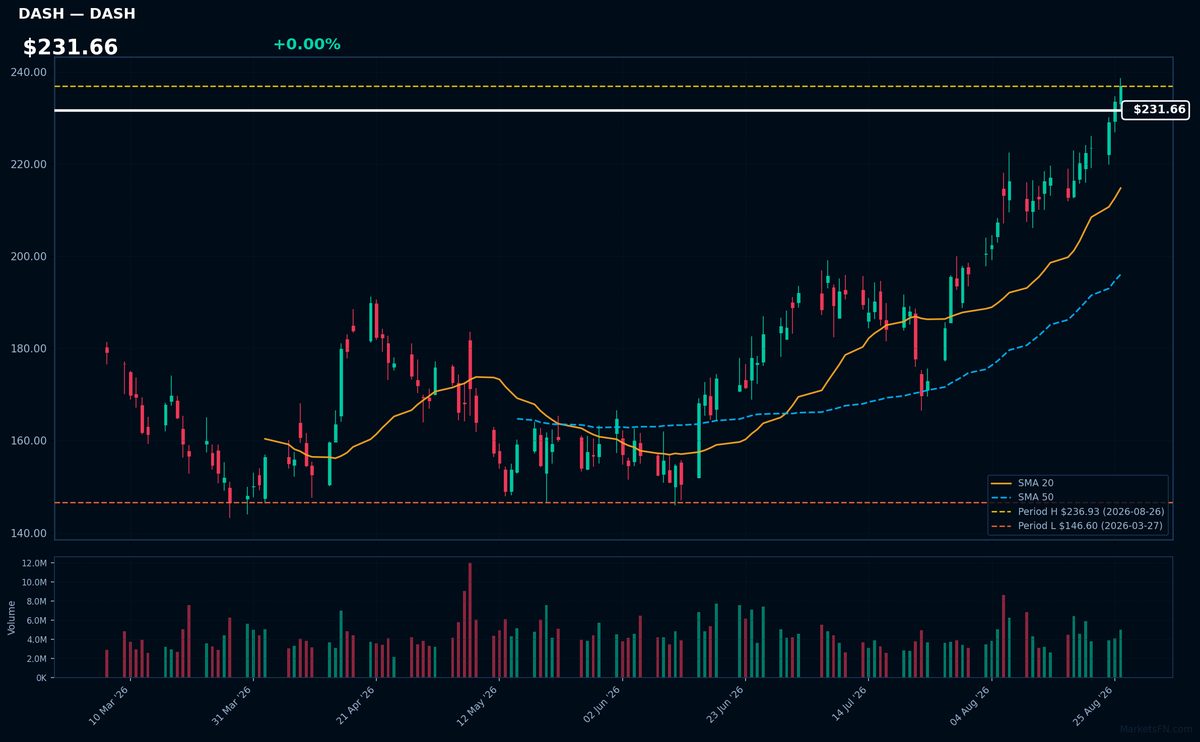
DASH | DoorDash Inc | Consumer Cyclical | Price Last: $236.93 | % Realized: +7.80% | RSI: 69.5 | % above MA200: +26.2% | Trend: Above MA20, MA50, MA200
DoorDash Inc operates a food delivery platform, connecting consumers with local restaurants and stores. Investors should care about its growth potential in the expanding food delivery market and its ability to maintain market share amidst increasing competition.
DoorDash Inc's RSI is 69.5, nearing overbought territory. The MA alignment is bullish with price > MA20 > MA50 > MA200, indicating a sustained uptrend. The stock is 0.0% below its 2026 YTD high, suggesting a potential breakout.
Related headlines
- Amazon, Uber, DoorDash, and Walmart are taking the delivery wars to the skies
- Gap and Gap Factory Land on DoorDash Just in Time for First-Day Fits
- Serve Robotics shares jump as DoorDash and Grubhub partnerships expand
- SERV Stock Rallies On Grubhub Partnership, DoorDash Deal Expansion CEO Calls It 'Clearest Signal Yet Of Where We're Headed'
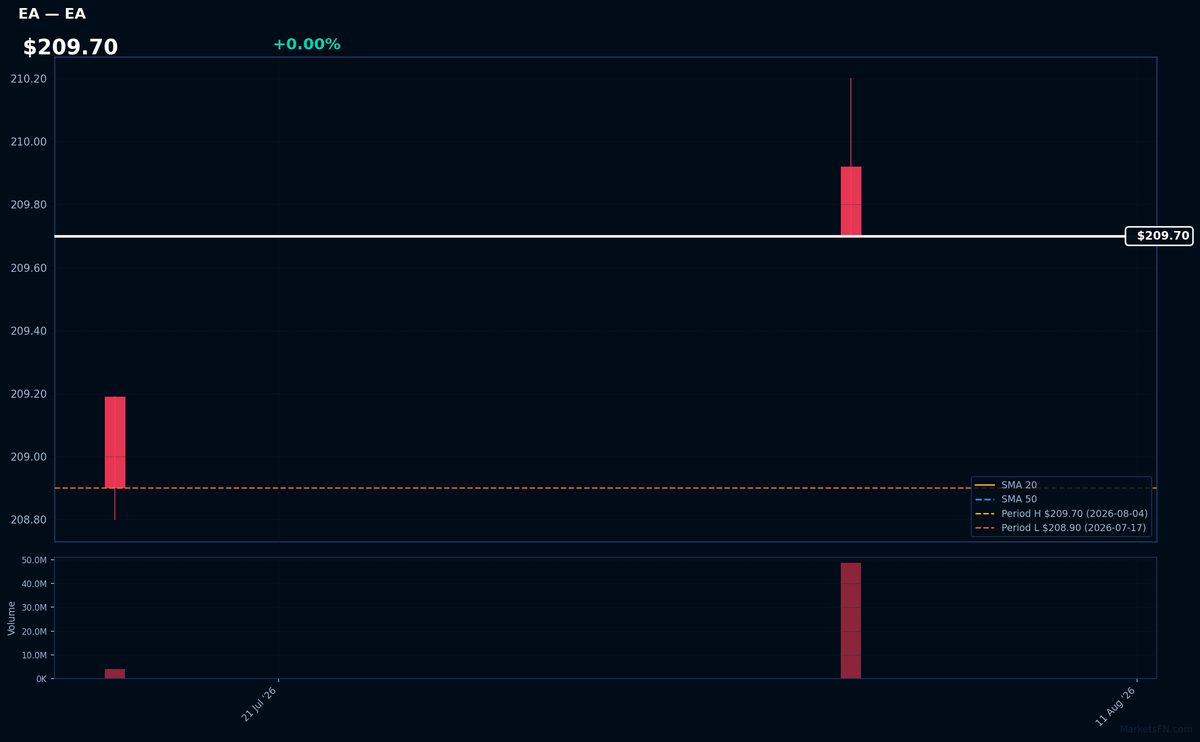
EA | Electronic Arts, Inc | Communication Services | Price Last: $209.70 | % Realized: +0.38% | RSI: — | % above MA200: — | Trend: —
Electronic Arts, Inc (EA) is a video game company that develops and publishes games such as FIFA and Madden NFL. Investors should care because its performance is tied to the gaming industry's growth and popularity of its flagship titles.
The stock is near its 2026 YTD high, up 0.4% YTD. Since MA data is incomplete and RSI(14) is N/A, we cannot assess momentum or MA alignment. The proximity to its YTD high may indicate a potential breakout.
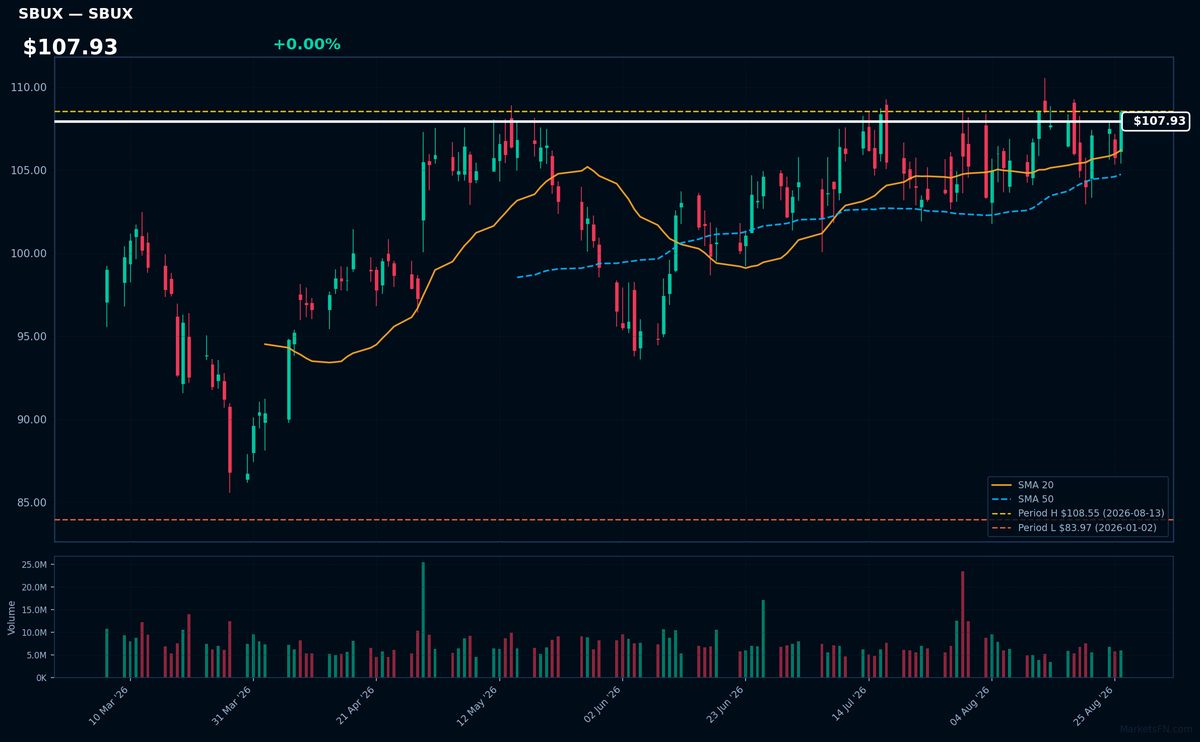
SBUX | Starbucks Corp | Consumer Cyclical | Price Last: $108.49 | % Realized: +29.20% | RSI: 55.9 | % above MA200: +11.8% | Trend: Above MA20, MA50, MA200
Starbucks Corp operates a global chain of coffeehouses, offering a wide range of coffee beverages and food products. Investors should care about its brand strength, global expansion, and ability to maintain premium pricing, driving revenue growth.
Starbucks is near a potential breakout, 0.1% below its 2026 YTD high, with a bullish MA alignment (price > MA20 > MA50 > MA200) and RSI(14) at 55.9, indicating sustained uptrend and moderate momentum, not overbought.
Related headlines
- Starbucks Union Calls for Boycott in Latest Test of Company Turnaround
- Starbucks Workers United Calls For Boycott Why Union Says SBUX Leaves Us With No Other Choice
- Did Starbucks Corporation Insiders Breach their Fiduciary Duties to Shareholders?
- SBUX Stock Has Rallied Nearly 28% This Year: Why Baird Still Sees 15% Upside For Starbucks?
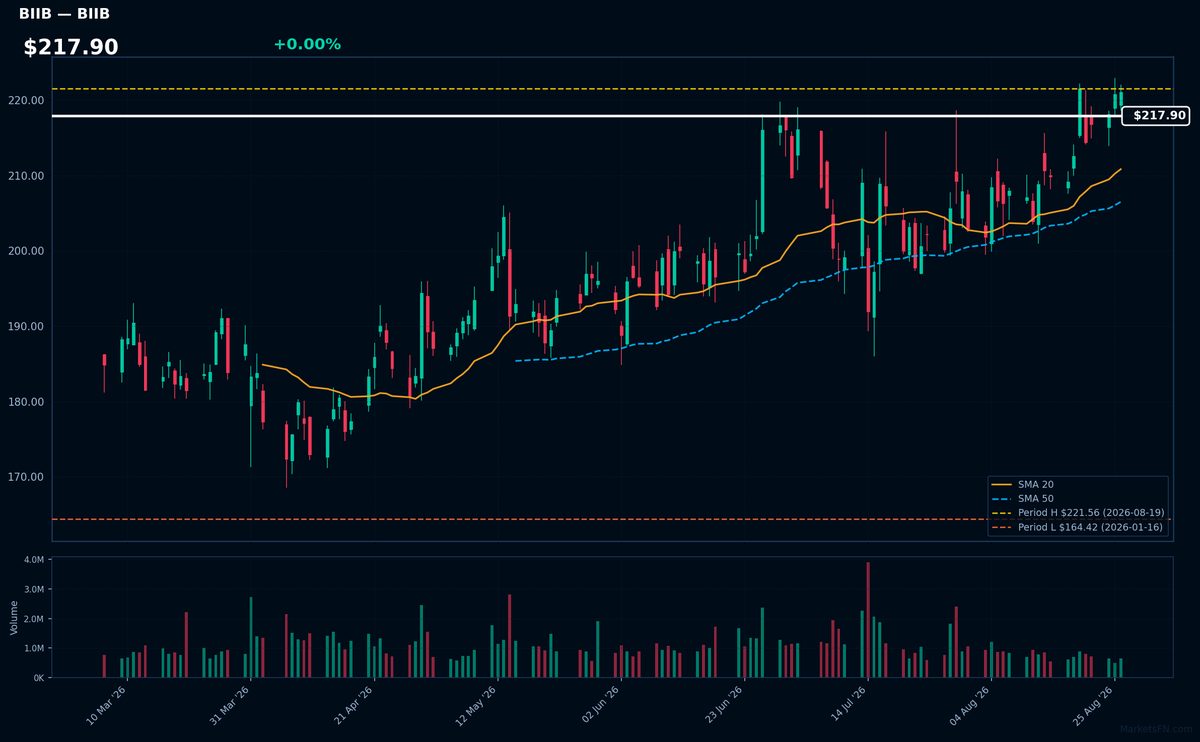
BIIB | Biogen Inc | Healthcare | Price Last: $221.07 | % Realized: +24.32% | RSI: 58.0 | % above MA200: +16.8% | Trend: Above MA20, MA50, MA200
Biogen Inc is a biotechnology company that develops treatments for neurological diseases. Investors should care because its therapies target significant unmet medical needs, potentially driving revenue growth.
Biogen's current technical situation indicates sustained uptrend momentum with price > MA20 > MA50 > MA200, RSI(14) at 58.0, and a 0.2% proximity to its 2026 YTD high, suggesting potential for further breakout.
Related headlines
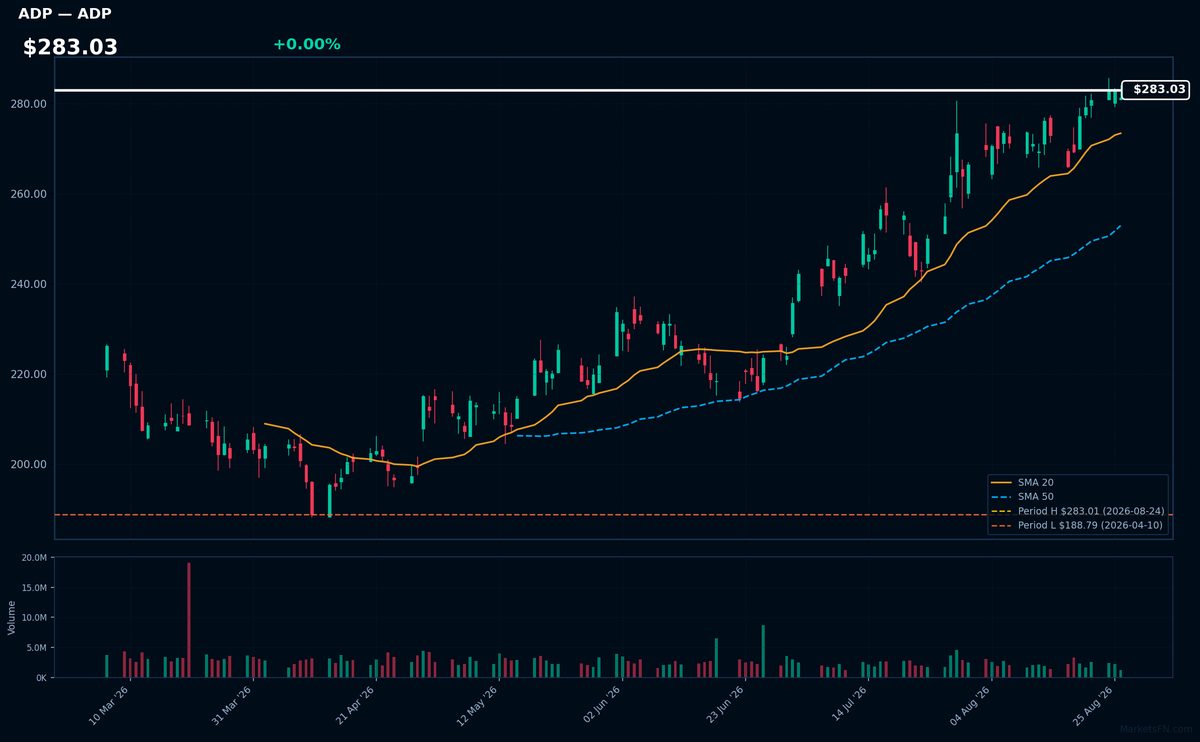
ADP | Automatic Data Processing Inc | Technology | Price Last: $281.39 | % Realized: +11.27% | RSI: 66.0 | % above MA200: +19.2% | Trend: Above MA20, MA50, MA200
Automatic Data Processing Inc provides HR, payroll, and benefits administration services to businesses, processing millions of paychecks and handling employee data. Investors should care because its stable, recurring revenue and market leadership position make it an attractive defensive play.
The stock shows bullish technicals with RSI(14) at 66.0, price above MA20, MA50, and MA200, indicating sustained uptrend. It's 0.6% below its 2026 YTD high, nearing a potential breakout, with 11.3% YTD return, suggesting momentum.
Related headlines
📉 Nearest to 2026 Low
Sectors represented: Communication Services (3), Utilities (1), Consumer Defensive (1)
| Ticker | Company | Sector | Price Last | % Realized | 2026 YTD Low Date | RSI | % above MA200 | Trend |
|---|---|---|---|---|---|---|---|---|
| TTD | Trade Desk Inc | Communication Services | $13.03 | -65.42% | 2026-08-26 | 36.3 | -49.7% | Below MA20, MA50, MA200 |
| EA | Electronic Arts, Inc | Communication Services | $209.70 | +0.38% | 2026-07-17 | — | — | — |
| APP | Applovin Corp | Communication Services | $308.11 | -50.17% | 2026-08-24 | 35.7 | -37.6% | Below MA20, MA50, MA200 |
| EXC | Exelon Corp | Utilities | $44.44 | +1.18% | 2026-01-12 | 35.7 | -3.4% | Below MA20, MA50, MA200 |
| MNST | Monster Beverage Corp | Consumer Defensive | $47.81 | -37.22% | 2026-08-17 | 41.9 | -39.2% | Below MA20, MA50, MA200 |
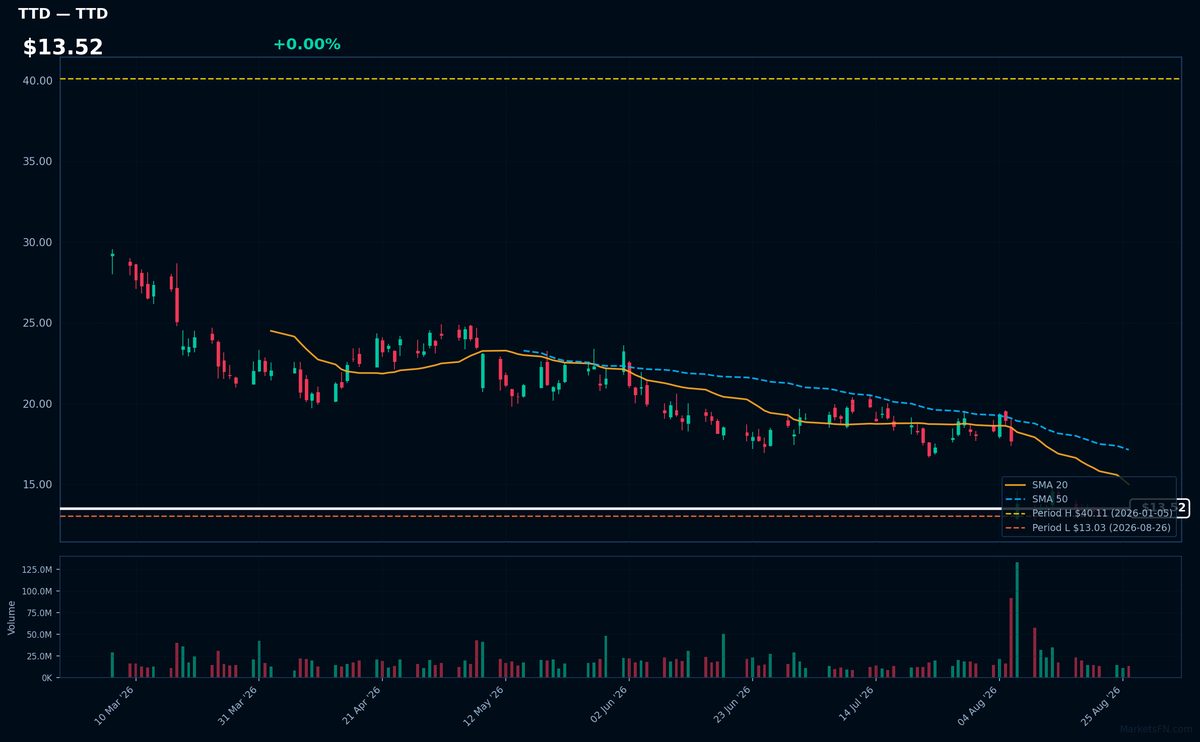
TTD | Trade Desk Inc | Communication Services | Price Last: $13.03 | % Realized: -65.42% | RSI: 36.3 | % above MA200: -49.7% | Trend: Below MA20, MA50, MA200
The Trade Desk Inc operates a demand-side platform enabling advertisers to manage digital ad campaigns across various channels and formats. Investors should care as it reflects the company's role in the digital advertising ecosystem.
Trade Desk Inc's current technical situation is bearish, with an RSI(14) of 36.3 indicating oversold conditions, and a sustained downtrend as price ($13.52) remains below MA20, MA50, and MA200, testing major support at its 2026 YTD low.
Related headlines
EA | Electronic Arts, Inc | Communication Services | Price Last: $209.70 | % Realized: +0.38% | RSI: — | % above MA200: — | Trend: —
Electronic Arts, Inc (EA) is a video game company that develops and publishes games such as FIFA and Madden NFL. Investors should care because its performance is tied to the gaming industry's growth and popularity of its flagship titles.
The stock is near its 2026 YTD high, up 0.4% YTD. Since MA data is incomplete and RSI(14) is N/A, we cannot assess momentum or MA alignment. The proximity to its YTD high may indicate a potential breakout.
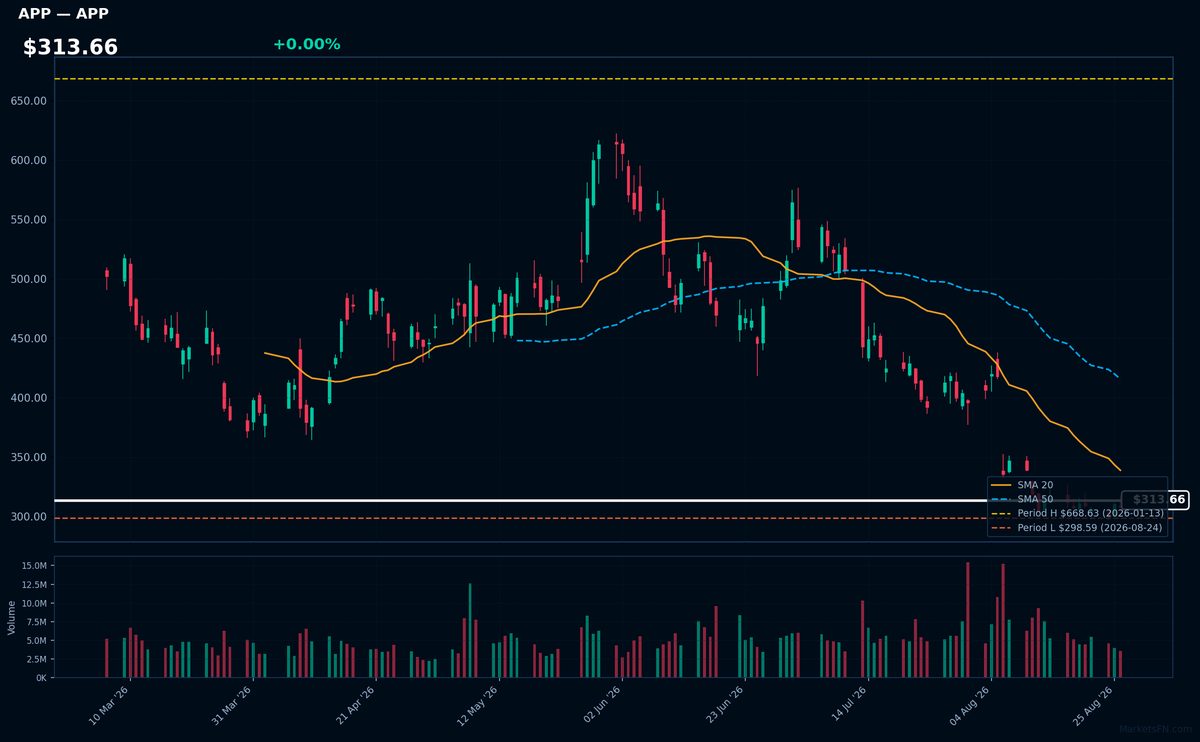
APP | Applovin Corp | Communication Services | Price Last: $308.11 | % Realized: -50.17% | RSI: 35.7 | % above MA200: -37.6% | Trend: Below MA20, MA50, MA200
Applovin Corp is a mobile technology company that enables advertisers to reach their target audiences. Investors should care because its platform connects advertisers with app developers, facilitating a significant portion of mobile advertising spend.
Applovin Corp's current technical situation is bearish, with an RSI(14) of 35.7 indicating oversold conditions, and a sustained downtrend as price ($313.66) remains below MA20, MA50, and MA200, with the stock testing major support 3.2% above its 2026 YTD low.
Related headlines
- Adjust: Shopping App Sessions and Installs Climb in First Half of 2026
- Why Did APP, ARRY, NFE Stocks Slump To 52-Week Lows Today?
- Why Did APP, CMS, MVIS Stocks Plunge To 52-Week Lows Last Week?
- APP Stock Dips Below $300 For First Time In Over A Year Analyst Cuts Target By $60, But Believes Business Remains High Quality
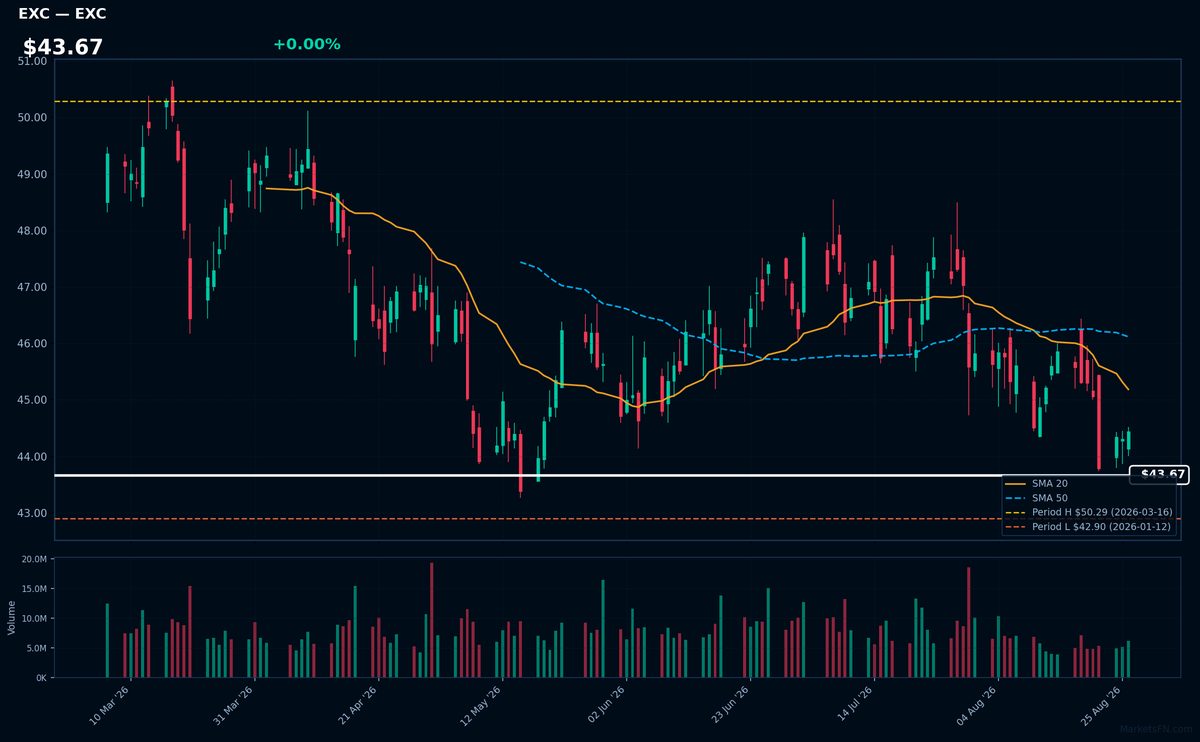
EXC | Exelon Corp | Utilities | Price Last: $44.44 | % Realized: +1.18% | RSI: 35.7 | % above MA200: -3.4% | Trend: Below MA20, MA50, MA200
Exelon Corp is a utility company that generates and distributes electricity, operating nuclear, natural gas, and renewable energy facilities; investors should care due to its significant role in the energy sector and potential for stable returns.
Exelon Corp's current technical situation indicates a potential warning sign with an RSI(14) of 35.7, below MA20/MA50/MA200, and only 3.6% above its 2026 YTD low, suggesting it is testing major support.
Related headlines
- Exelon Announces Key Leadership Position Changes
- Exelon Secures More Than $1 Billion in Customer Protections Through Pioneering Transmission Security Agreements
- Exelon high probability data center load falls 40%
- Exelon Corp (EXC) (Q2 2026) Earnings Call Highlights: Navigating Regulatory Hurdles and Data ...
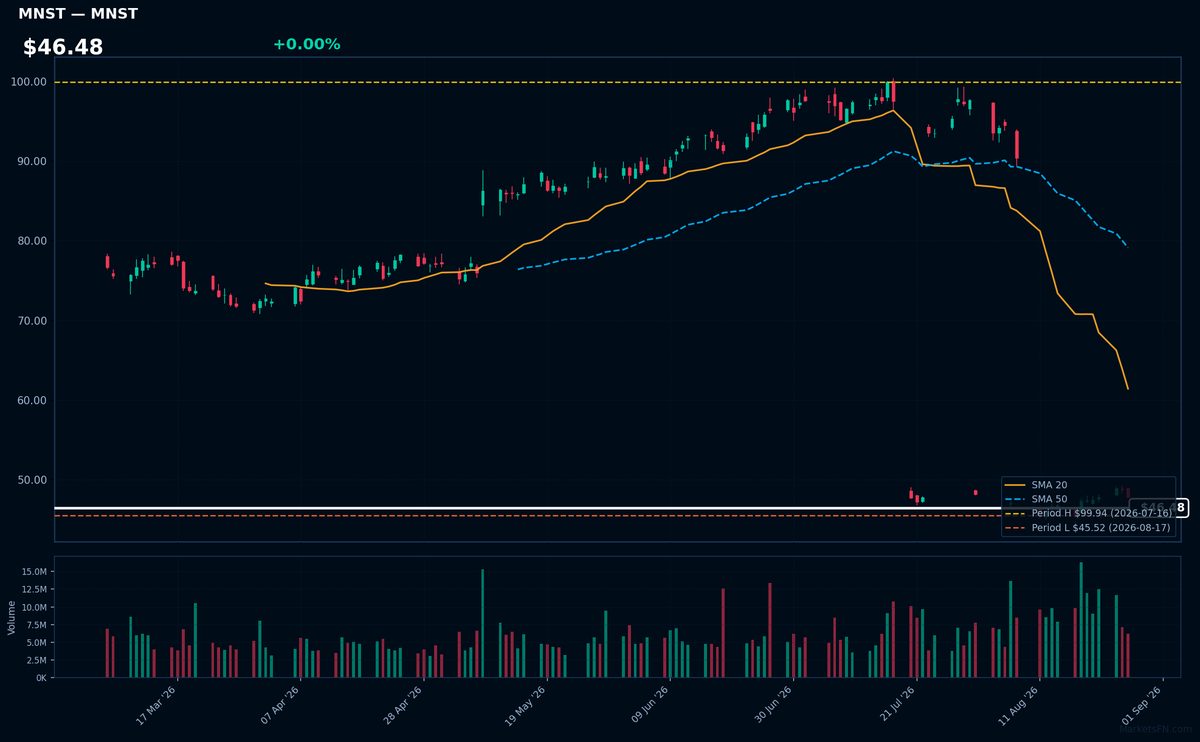
MNST | Monster Beverage Corp | Consumer Defensive | Price Last: $47.81 | % Realized: -37.22% | RSI: 41.9 | % above MA200: -39.2% | Trend: Below MA20, MA50, MA200
Monster Beverage Corp is a leading energy drink manufacturer with popular brands like Monster Energy. Investors should care about its performance as it dominates the energy drink market, and its stock movements can indicate consumer trends and competitive positioning in the beverage industry.
The stock is in a sustained downtrend with price ($46.48) below MA20, MA50, and MA200. RSI(14) is 41.9, nearing oversold territory. The stock is 5.0% above its 2026 YTD low, testing major support, indicating a potential warning sign with a -37.2% return over the 2026 YTD period.
Related headlines
Market Commentary
The provided data indicates that certain Nasdaq 100 stocks are near their 2026 year-to-date (YTD) extremes. Stocks like DASH, EA, and SBUX are close to their 2026 highs, while TTD, EA, and APP are near their 2026 lows. This suggests that these stocks have either reached a peak or trough so far this year.
The technology sector themes driving these moves may be related to the performance of individual companies. For instance, EA appears in both lists, indicating it is near both its 2026 high and low, suggesting significant price volatility. Macro conditions may also be influencing these stocks, although specific factors are not detailed in the provided data.
Investors and traders should monitor the continued performance of these stocks, particularly those that are near extremes, such as DASH and TTD. Watching how these stocks move in relation to their 2026 highs and lows may provide insight into future market trends and sector performance. The proximity of these stocks to their YTD extremes may indicate a turning point or consolidation phase.
Methodology: All 101 Nasdaq 100 constituents screened. Close prices downloaded from 2026-01-01. Period high = highest close since Jan 1 2026; period low = lowest close since Jan 1 2026. Distance = (current price / period extreme − 1) × 100. Technical indicators computed on up to 1 year of daily OHLCV data.
Disclaimer: For informational purposes only. Not investment advice. Past performance is not indicative of future results.