Nasdaq 100 2026 YTD Highs & Lows Radar: Microsoftoration (MSFT), Electronic Arts, (EA) and more
MarketsFN Team

Nasdaq 100 2026 YTD Highs & Lows Radar: Microsoftoration (MSFT), Electronic Arts, (EA) and more
Screening all 101 Nasdaq 100 constituents for stocks nearest to their 2026 year-to-date high and their 2026 YTD low. Data as of August 31, 2026. % Realized = total return since Jan 1 2026.
Legend: RSI > 70 = overbought · RSI < 30 = oversold · Green % Realized = positive YTD return · Red = negative.
📈 Nearest to 2026 High
Sectors represented: Technology (5)
| Ticker | Company | Sector | Price Last | % Realized | 2026 YTD High Date | RSI | % above MA200 | Trend |
|---|---|---|---|---|---|---|---|---|
| MSFT | Microsoft Corporation | Technology | $513.53 | +8.58% | 2026-08-28 | 69.9 | +19.1% | Above MA20, MA50, MA200 |
| PLTR | Palantir Technologies Inc | Technology | $186.29 | +10.98% | 2026-08-28 | 68.9 | +23.1% | Above MA20, MA50, MA200 |
| ADP | Automatic Data Processing Inc | Technology | $287.48 | +13.68% | 2026-08-28 | 67.6 | +21.6% | Above MA20, MA50, MA200 |
| PAYX | Paychex Inc | Technology | $127.04 | +16.98% | 2026-08-28 | 64.3 | +22.4% | Above MA20, MA50, MA200 |
| TEAM | Atlassian Corporation | Technology | $190.41 | +23.04% | 2026-08-28 | 80.5 | +75.5% | Above MA20, MA50, MA200 |
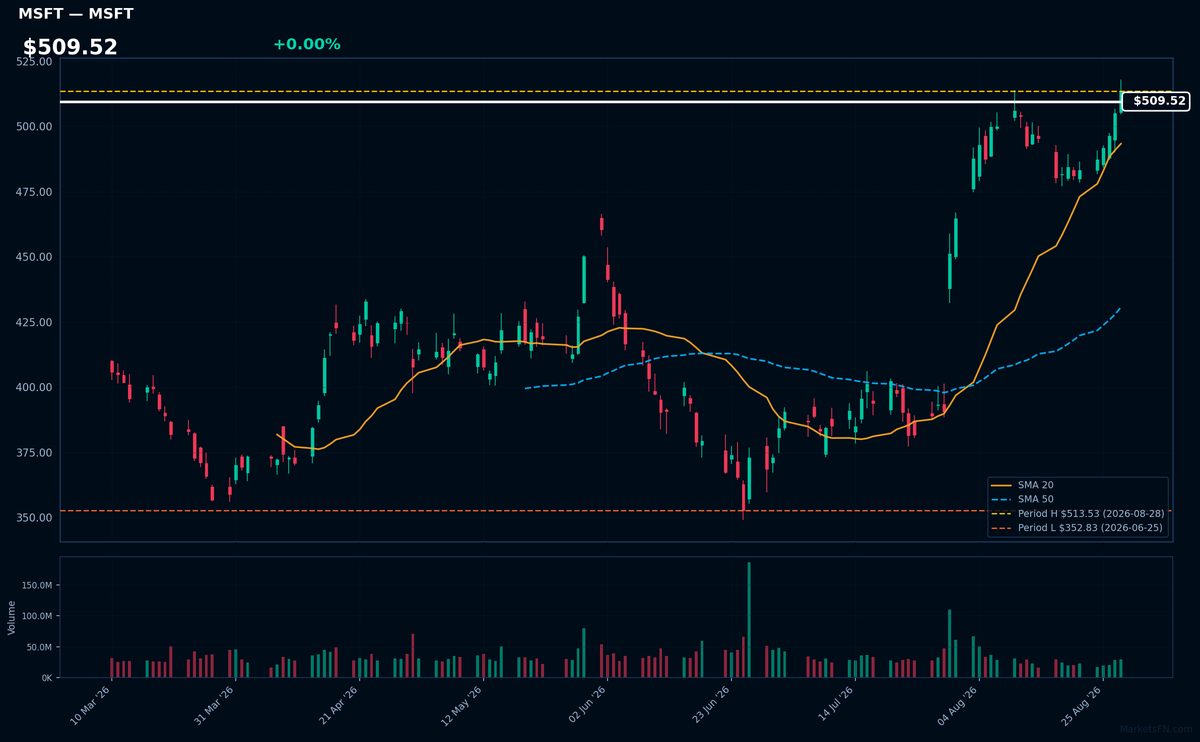
MSFT | Microsoft Corporation | Technology | Price Last: $513.53 | % Realized: +8.58% | RSI: 69.9 | % above MA200: +19.1% | Trend: Above MA20, MA50, MA200
Microsoft Corporation is a technology company that develops, licenses, and supports software, hardware, and services, including Windows, Office, Azure, and Xbox. Investors care about its dominance in productivity software and cloud computing, driving revenue growth.
Microsoft's current technical situation indicates momentum, with RSI(14) at 69.9 and a bullish MA alignment (price > MA20 > MA50 > MA200). The stock is 0.0% below its 2026 YTD high, suggesting a potential breakout.
Related headlines
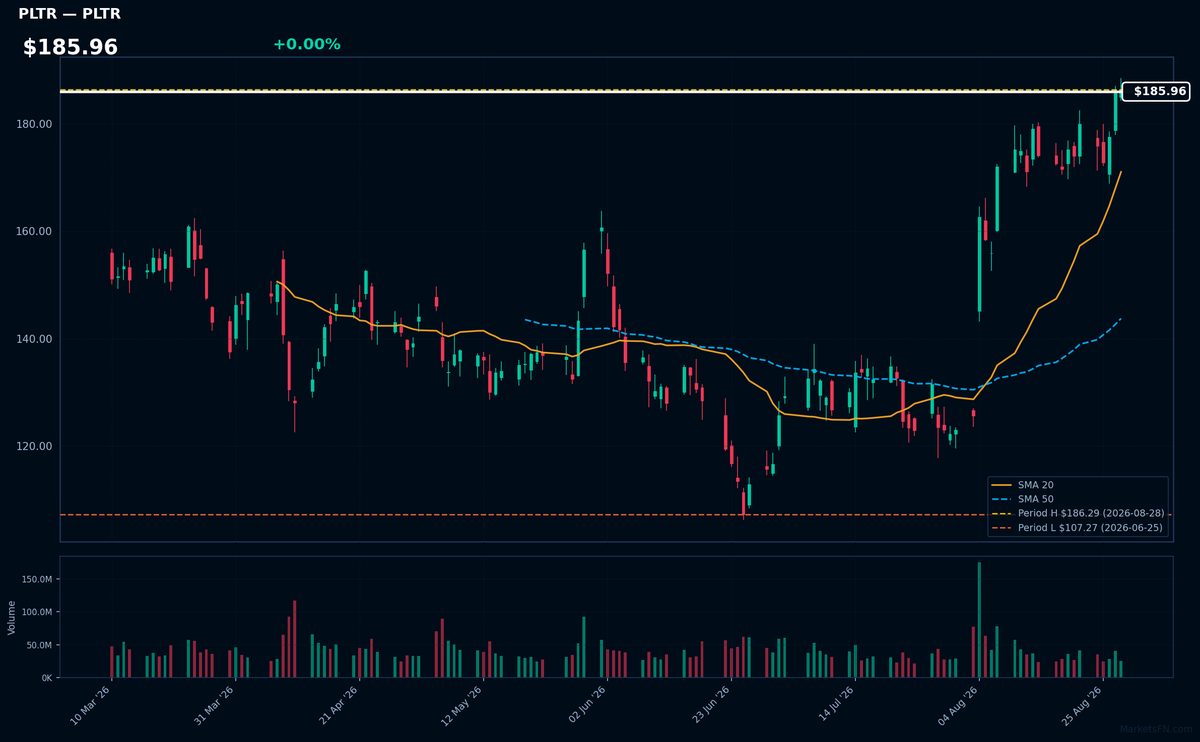
PLTR | Palantir Technologies Inc | Technology | Price Last: $186.29 | % Realized: +10.98% | RSI: 68.9 | % above MA200: +23.1% | Trend: Above MA20, MA50, MA200
Palantir Technologies Inc provides data integration and analytics software to governments and corporations, enabling data-driven decision-making. Investors should care as its software is used in critical applications such as defense, finance, and healthcare, driving growth and potential long-term value.
PLTR's RSI(14) is 68.9, indicating rising momentum. The stock is above MA20, MA50, and MA200, showing a bullish trend. With the stock at its 2026 YTD high, it may be near a breakout level, having returned 11.0% YTD.
Related headlines
- Can PLTR Stock Live Up To Its Multiple?
- As Palantir Stock Jumps, An Income-Generating Trade Aims For A Big Annualized Return
- Meta, Palantir, Paramount Skydance Hedge Trump Ties by Courting Democrats as Midterms Raise Prospect of House Flip: Report
- 3 Reasons Growth Investors Will Love Palantir Technologies (PLTR)
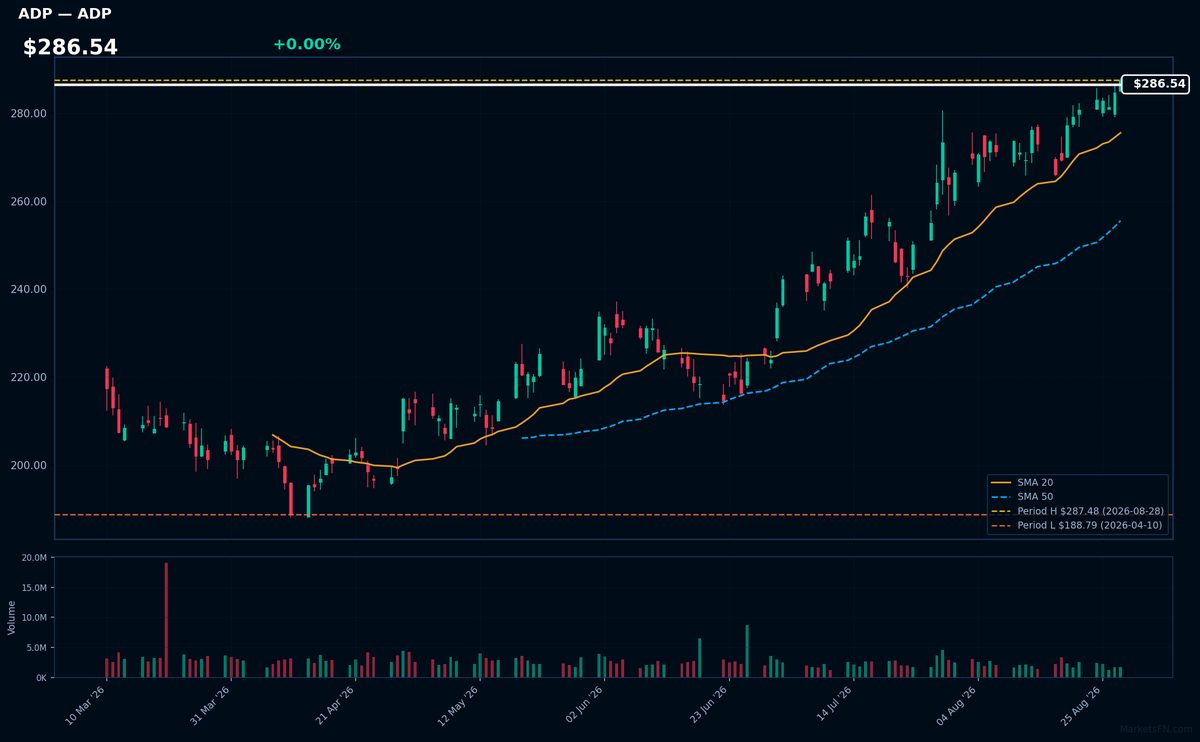
ADP | Automatic Data Processing Inc | Technology | Price Last: $287.48 | % Realized: +13.68% | RSI: 67.6 | % above MA200: +21.6% | Trend: Above MA20, MA50, MA200
Automatic Data Processing Inc provides payroll processing, human capital management, and other workforce management solutions. Investors should care because its services are essential for businesses, generating recurring revenue and providing a relatively stable growth profile.
The stock shows bullish MA alignment with price > MA20 > MA50 > MA200 and RSI(14) at 67.6, indicating sustained uptrend momentum. It's 0.0% below its 2026 YTD high, near a potential breakout level, with 13.7% 2026 YTD return.
Related headlines
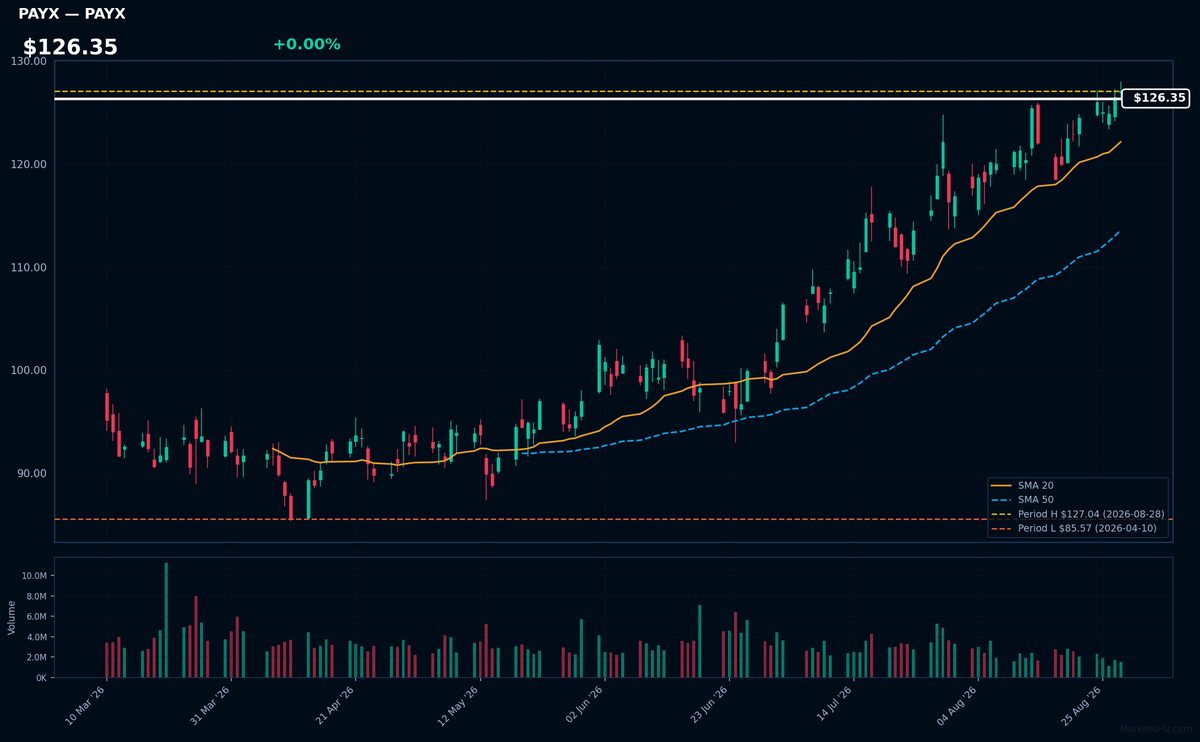
PAYX | Paychex Inc | Technology | Price Last: $127.04 | % Realized: +16.98% | RSI: 64.3 | % above MA200: +22.4% | Trend: Above MA20, MA50, MA200
Paychex Inc provides payroll processing, HR services, and benefits administration to small and medium-sized businesses, generating recurring revenue through subscription-based models. Investors care due to the company's stable cash flows and potential for long-term growth.
Paychex Inc's technicals indicate sustained uptrend with price > MA20 > MA50 > MA200, RSI(14) at 64.3, and 0.0% below its 2026 YTD high, suggesting momentum near a potential breakout level, with 17.0% 2026 YTD return.
Related headlines
- WISE at Work: Early Results Show Paychex AI Is Reducing Payroll Errors and Improving Service Efficiency at Scale
- Paychex Expands Award-Winning Lifestyle Benefits to 2M+ Employees on the Paycor Platform
- Paychex Expands WISE to Deliver Workforce Intelligence Across Business Tools
- Paychex Named One of Selling Power's 60 Best Companies to Sell For
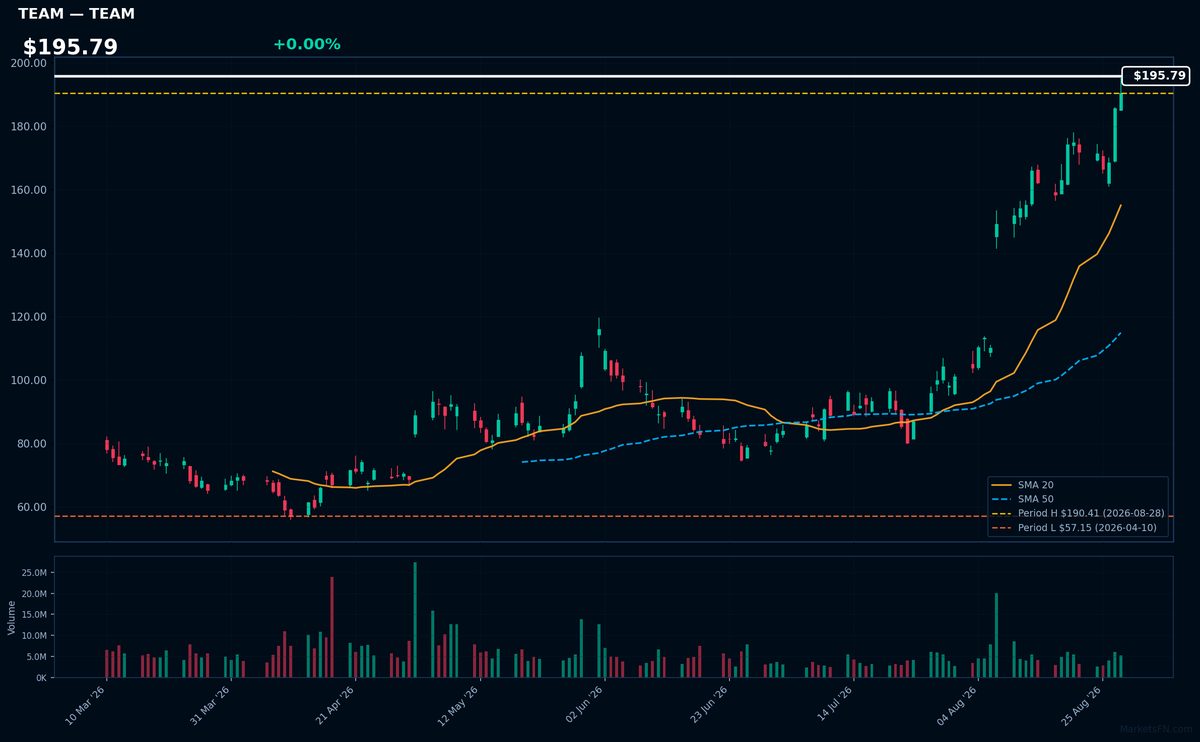
TEAM | Atlassian Corporation | Technology | Price Last: $190.41 | % Realized: +23.04% | RSI: 80.5 | % above MA200: +75.5% | Trend: Above MA20, MA50, MA200
Atlassian Corporation is a software company providing collaboration and productivity tools like Jira and Confluence. Investors should care because its products are integral to software development and IT teams, driving recurring revenue and growth.
Atlassian's technicals indicate strong momentum: RSI(14) is 80.5, nearing overbought territory, with a bullish MA alignment (price > MA20 > MA50 > MA200) and 0.0% below its 2026 YTD high, suggesting a potential breakout.
Related headlines
📉 Nearest to 2026 Low
Sectors represented: Communication Services (2), Utilities (2), Consumer Defensive (1)
| Ticker | Company | Sector | Price Last | % Realized | 2026 YTD Low Date | RSI | % above MA200 | Trend |
|---|---|---|---|---|---|---|---|---|
| EA | Electronic Arts, Inc | Communication Services | $209.70 | +0.38% | 2026-07-17 | — | — | — |
| EXC | Exelon Corp | Utilities | $43.93 | +0.02% | 2026-01-12 | 33.8 | -4.5% | Below MA20, MA50, MA200 |
| MNST | Monster Beverage Corp | Consumer Defensive | $46.86 | -38.47% | 2026-08-17 | 41.8 | -40.2% | Below MA20, MA50, MA200 |
| TTD | Trade Desk Inc | Communication Services | $13.57 | -63.99% | 2026-08-26 | 37.2 | -47.0% | Below MA20, MA50, MA200 |
| XEL | Xcel Energy, Inc | Utilities | $76.45 | +2.37% | 2026-01-07 | 36.4 | -2.9% | Below MA20, MA50, MA200 |
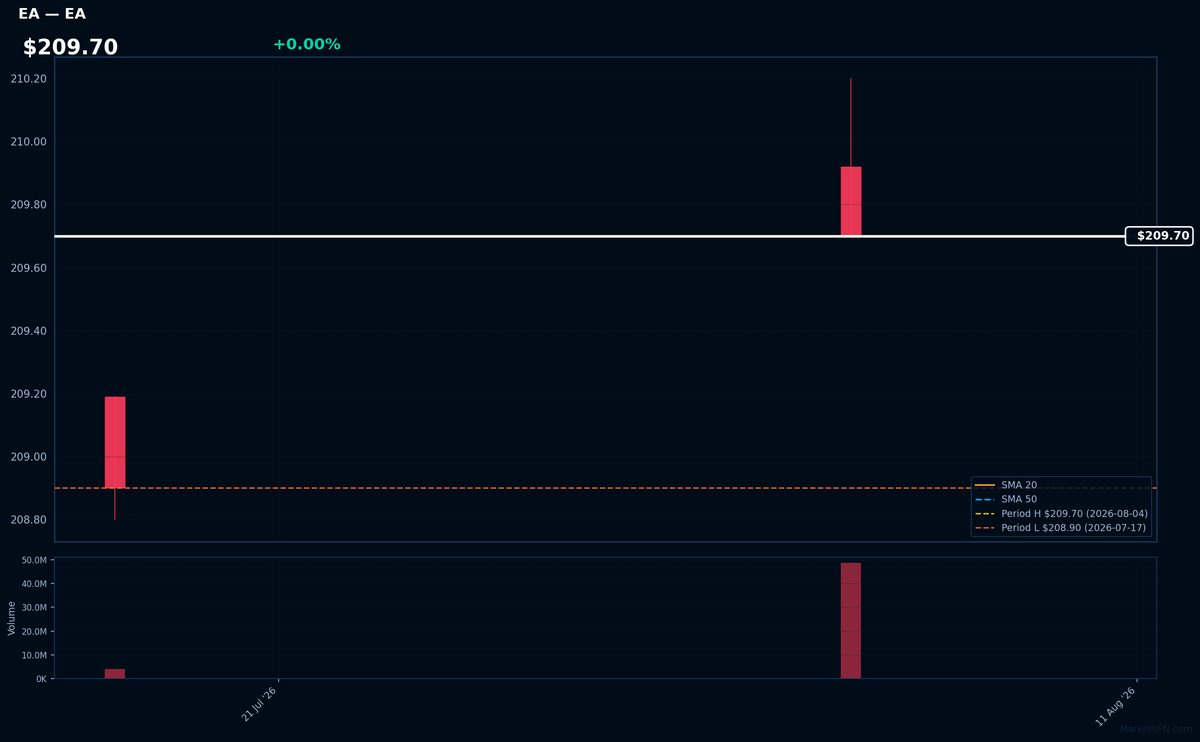
EA | Electronic Arts, Inc | Communication Services | Price Last: $209.70 | % Realized: +0.38% | RSI: — | % above MA200: — | Trend: —
Electronic Arts, Inc (EA) is a video game company that develops and publishes games such as FIFA and Madden NFL. Investors should care because its games have a large and dedicated player base, potentially driving revenue growth.
The stock is near its 2026 YTD high, up 0.4% YTD. Since MA data is incomplete and RSI(14) is N/A, we cannot assess momentum or trend strength. The proximity to its YTD high may indicate a potential breakout.
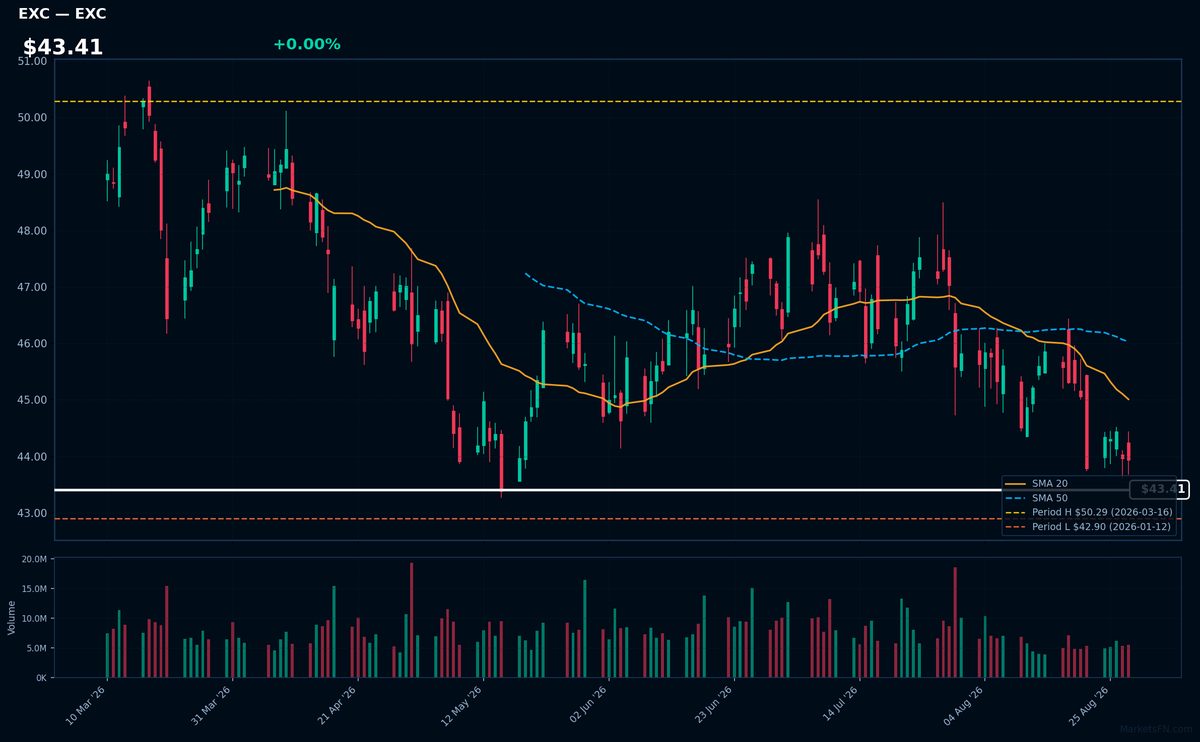
EXC | Exelon Corp | Utilities | Price Last: $43.93 | % Realized: +0.02% | RSI: 33.8 | % above MA200: -4.5% | Trend: Below MA20, MA50, MA200
Exelon Corp is a utility company that generates and distributes electricity, operating nuclear, natural gas, and renewable energy facilities. Investors care about its stable cash flows and dividend yield, given its role in meeting US energy demands.
Exelon Corp's technicals indicate a warning sign: RSI(14) is 33.8, below MA20/MA50/MA200, and the stock is 2.4% above its 2026 YTD low, testing major support with 0.0% return over the 2026 YTD period.
Related headlines
- Exelon Announces Key Leadership Position Changes
- Exelon Secures More Than $1 Billion in Customer Protections Through Pioneering Transmission Security Agreements
- Exelon high probability data center load falls 40%
- Exelon Corp (EXC) (Q2 2026) Earnings Call Highlights: Navigating Regulatory Hurdles and Data ...
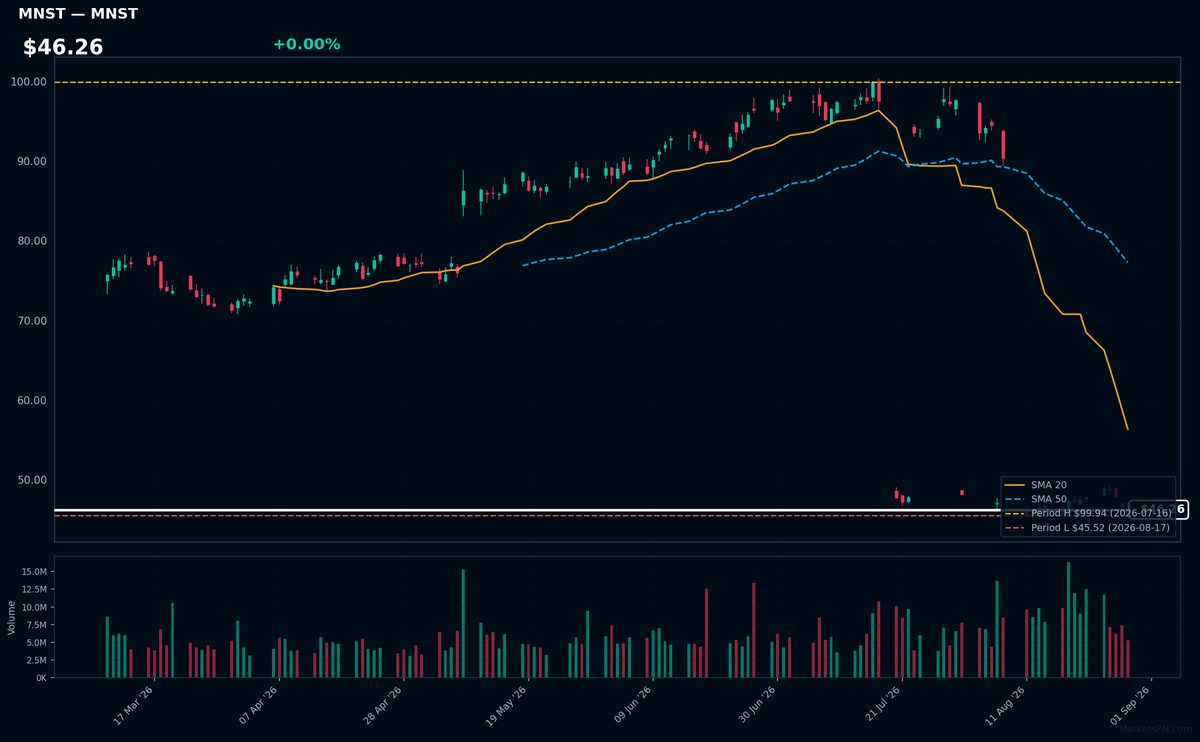
MNST | Monster Beverage Corp | Consumer Defensive | Price Last: $46.86 | % Realized: -38.47% | RSI: 41.8 | % above MA200: -40.2% | Trend: Below MA20, MA50, MA200
Monster Beverage Corp is a leading energy drink manufacturer with a portfolio of brands including Monster Energy. Investors should care about its performance as it operates in a competitive beverage market with shifting consumer preferences.
The stock is in a sustained downtrend with price ($46.26) below MA20, MA50, and MA200. RSI(14) is 41.8, nearing oversold territory. It's testing major support, only 2.9% above its 2026 YTD low, indicating a potential warning sign.
Related headlines
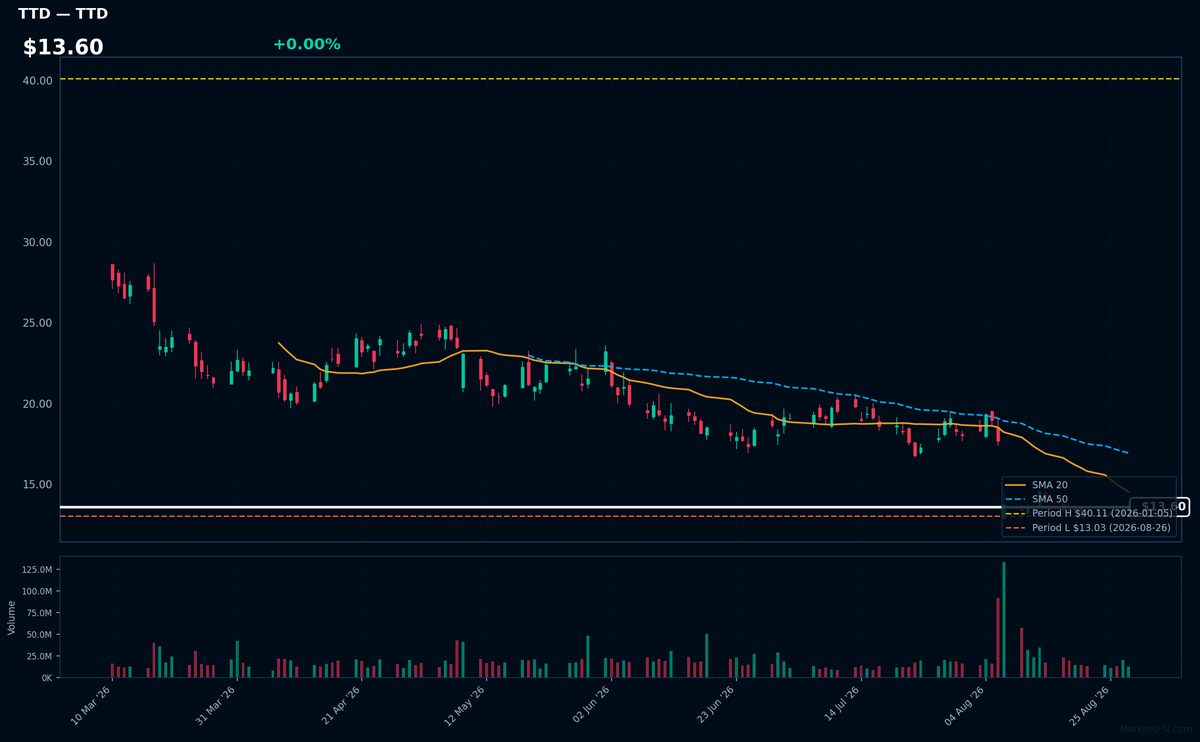
TTD | Trade Desk Inc | Communication Services | Price Last: $13.57 | % Realized: -63.99% | RSI: 37.2 | % above MA200: -47.0% | Trend: Below MA20, MA50, MA200
Trade Desk Inc operates a demand-side platform enabling advertisers to manage digital ad campaigns across various channels and formats; investors should care because its performance reflects the health of the digital advertising market and its competitive positioning within it.
The stock is in a sustained downtrend with price ($13.60) below all MAs (MA20 < MA50 < MA200), RSI(14) at 37.2, and is 4.1% above its 2026 YTD low, indicating a potential support test and warning sign.
Related headlines
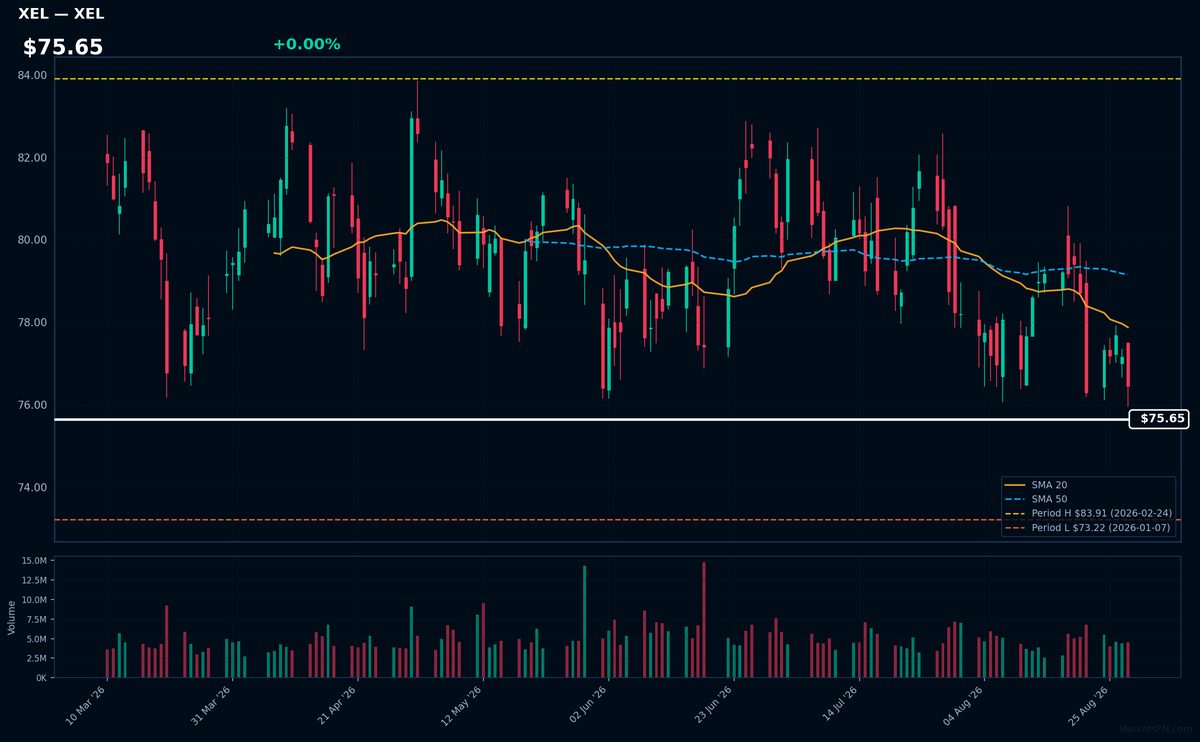
XEL | Xcel Energy, Inc | Utilities | Price Last: $76.45 | % Realized: +2.37% | RSI: 36.4 | % above MA200: -2.9% | Trend: Below MA20, MA50, MA200
Xcel Energy, Inc is an electric and natural gas utility company serving 3.4 million customers. Investors should care about its stable dividend yield and regulated utility business, providing essential services with predictable cash flows.
XEL's RSI(14) is 36.4, indicating oversold conditions. The stock is below MA20, MA50, and MA200, showing mixed signals. It's 4.4% above its 2026 YTD low, testing major support, with a 2.4% return over the 2026 YTD period.
Related headlines
Market Commentary
The Nasdaq 100 stocks listed are near their 2026 year-to-date (YTD) extremes, with some at their highs and others near their lows. Specifically, MSFT, PLTR, ADP, PAYX, and TEAM are at their 2026 YTD highs, while EA, EXC, MNST, TTD, and XEL are near their 2026 YTD lows, ranging from +0.4% to +4.4% above their lows.
The technology sector themes driving these moves include the performance of major tech companies and the overall market conditions. The stocks at their 2026 YTD highs are primarily software and data processing companies, indicating strong demand for their services. In contrast, the stocks near their 2026 YTD lows are a mix of technology, energy, and consumer goods companies, suggesting varying degrees of sector-specific challenges.
Investors and traders should watch the next market developments, particularly how these stocks react to future market conditions and earnings reports. Monitoring the percentage changes from their YTD extremes will provide insights into the ongoing trends and potential shifts in the technology sector and broader market.
Methodology: All 101 Nasdaq 100 constituents screened. Close prices downloaded from 2026-01-01. Period high = highest close since Jan 1 2026; period low = lowest close since Jan 1 2026. Distance = (current price / period extreme − 1) × 100. Technical indicators computed on up to 1 year of daily OHLCV data.
Disclaimer: For informational purposes only. Not investment advice. Past performance is not indicative of future results.