Nasdaq 100 52-Week Highs & Lows Radar: Apple (AAPL), PepsiCo (PEP) and more
MarketsFN Team

Nasdaq 100 52-Week Highs & Lows Radar: Apple (AAPL), PepsiCo (PEP) and more
Screening all 101 Nasdaq 100 constituents for stocks nearest to their 52-week high and their 52-week low. Data as of September 28, 2026. % Realized = 52-week total return.
Legend: RSI > 70 = overbought · RSI < 30 = oversold · Green % Realized = positive 52W return · Red = negative.
📈 Nearest to 52-Week High
Sectors represented: Technology (3), Healthcare (1), Communication Services (1)
| Ticker | Company | Sector | Price Last | % Realized | 52-Week High Date | RSI | % above MA200 | Trend |
|---|---|---|---|---|---|---|---|---|
| AAPL | Apple Inc | Technology | $342.16 | +34.48% | 2026-09-28 | 66.5 | +18.8% | Above MA20, MA50, MA200 |
| BIIB | Biogen Inc | Healthcare | $228.62 | +65.04% | 2026-09-28 | 63.8 | +17.7% | Above MA20, MA50, MA200 |
| WBD | Warner Bros. Discovery Inc | Communication Services | $30.84 | +63.55% | 2026-09-25 | 75.1 | +11.6% | Above MA20, MA50, MA200 |
| NVDA | NVIDIA Corp | Technology | $231.23 | +27.15% | 2026-05-14 | 60.5 | +15.8% | Above MA20, MA50, MA200 |
| AMD | Advanced Micro Devices Inc | Technology | $613.23 | +280.04% | 2026-09-25 | 67.2 | +67.2% | Above MA20, MA50, MA200 |
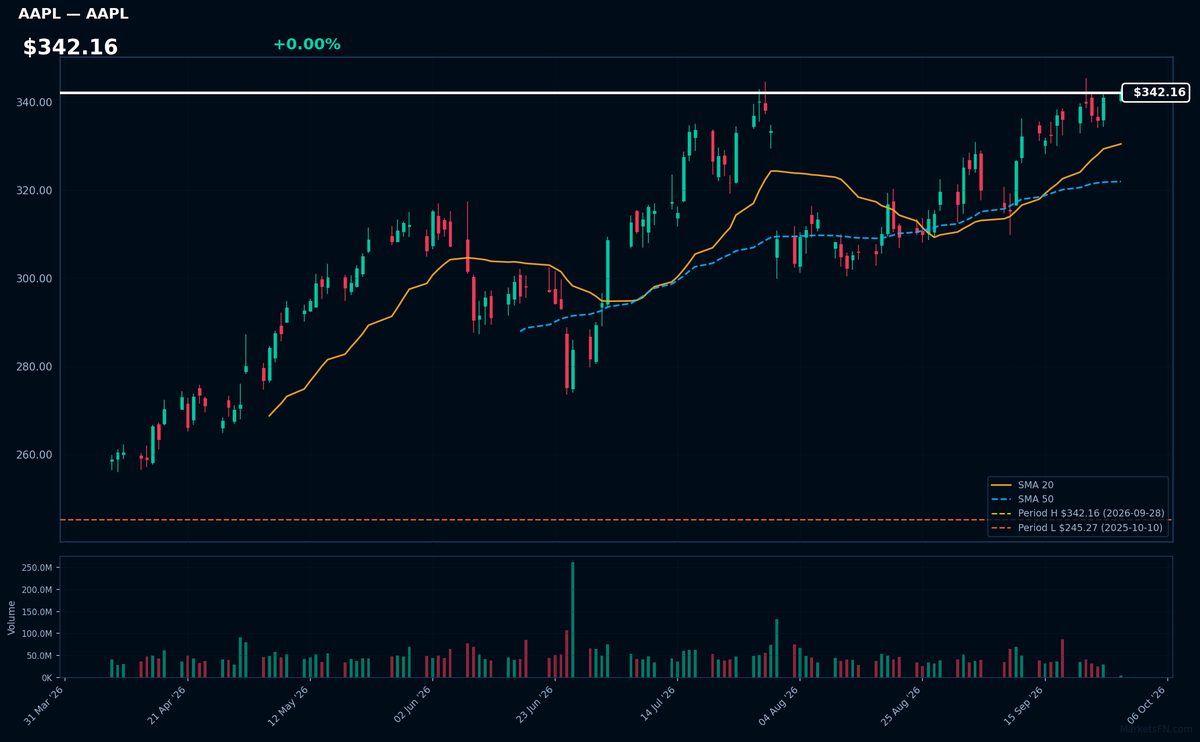
AAPL | Apple Inc | Technology | Price Last: $342.16 | % Realized: +34.48% | RSI: 66.5 | % above MA200: +18.8% | Trend: Above MA20, MA50, MA200
Apple Inc designs, manufactures, and markets consumer electronics, software, and services. Investors care about its innovative product ecosystem, services growth, and profitability. Its flagship products like iPhones drive revenue, while services like Apple Music and iCloud contribute to profitability.
AAPL's RSI(14) is 66.5, indicating rising momentum. The MA alignment is bullish with price > MA20 > MA50 > MA200, and it's 0.0% below its 52-Week high, suggesting a potential breakout. The 34.5% 52-Week return reinforces the uptrend.
Related headlines
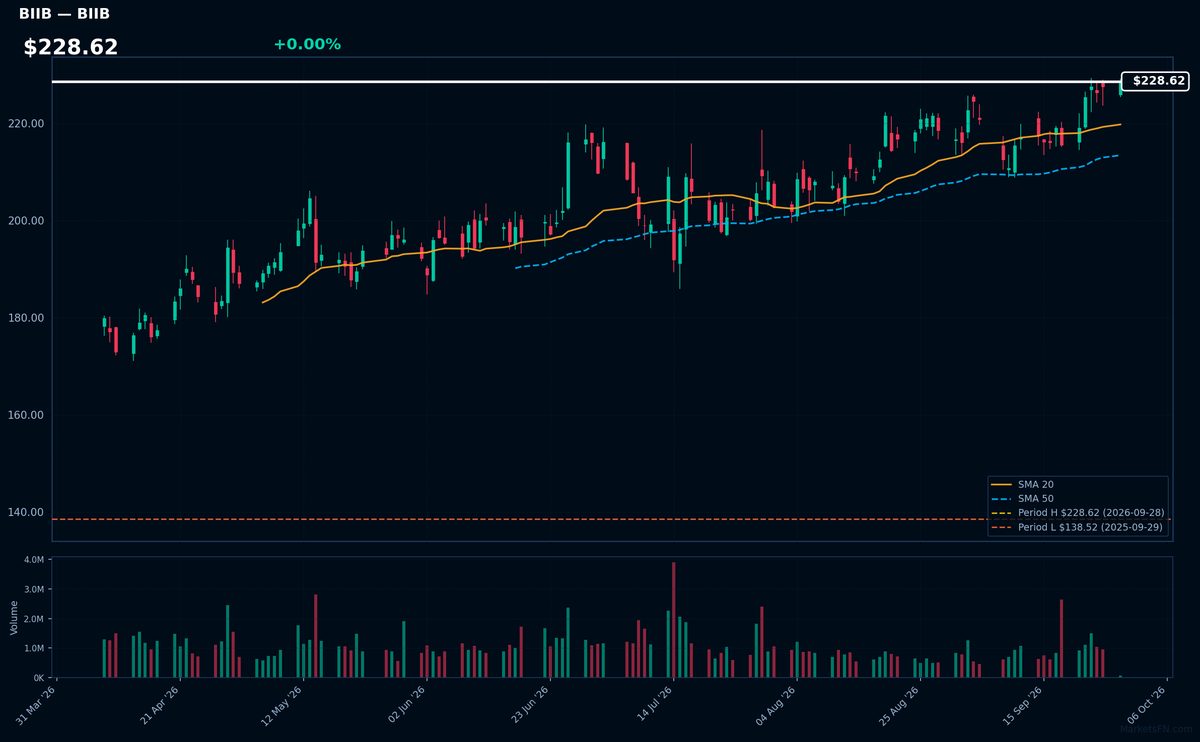
BIIB | Biogen Inc | Healthcare | Price Last: $228.62 | % Realized: +65.04% | RSI: 63.8 | % above MA200: +17.7% | Trend: Above MA20, MA50, MA200
Biogen Inc is a biotechnology company that develops treatments for neurological and neurodegenerative diseases. Investors should care because its therapies for conditions like multiple sclerosis have significant market potential and the company's pipeline impacts its growth prospects.
Biogen's current technical situation indicates strong momentum: RSI(14) is 63.8, and the stock is in a sustained uptrend with price > MA20 > MA50 > MA200. It's 0.0% below its 52-Week high, nearing a potential breakout after a 65.0% 52-Week return.
Related headlines
- Stoke Therapeutics and Biogen Present Long-Term Clinical Data that Support the Disease-Modifying Potential of Zorevunersen, an Investigational Medicine for the Treatment of Dravet Syndrome, at the 16th European Epilepsy Congress (EEC)
- Stoke Therapeutics and Biogen to present four-year zorevunersen data at epilepsy congress
- Stoke Therapeutics and Biogen Announce Presentations of Clinical Data from Studies of Zorevunersen, an Investigational Medicine for the Treatment of Dravet Syndrome, at the 16th European Epilepsy Congress (EEC)
- Wolfe Research upgrades Biogen, AbbVie on pipeline strength and valuation
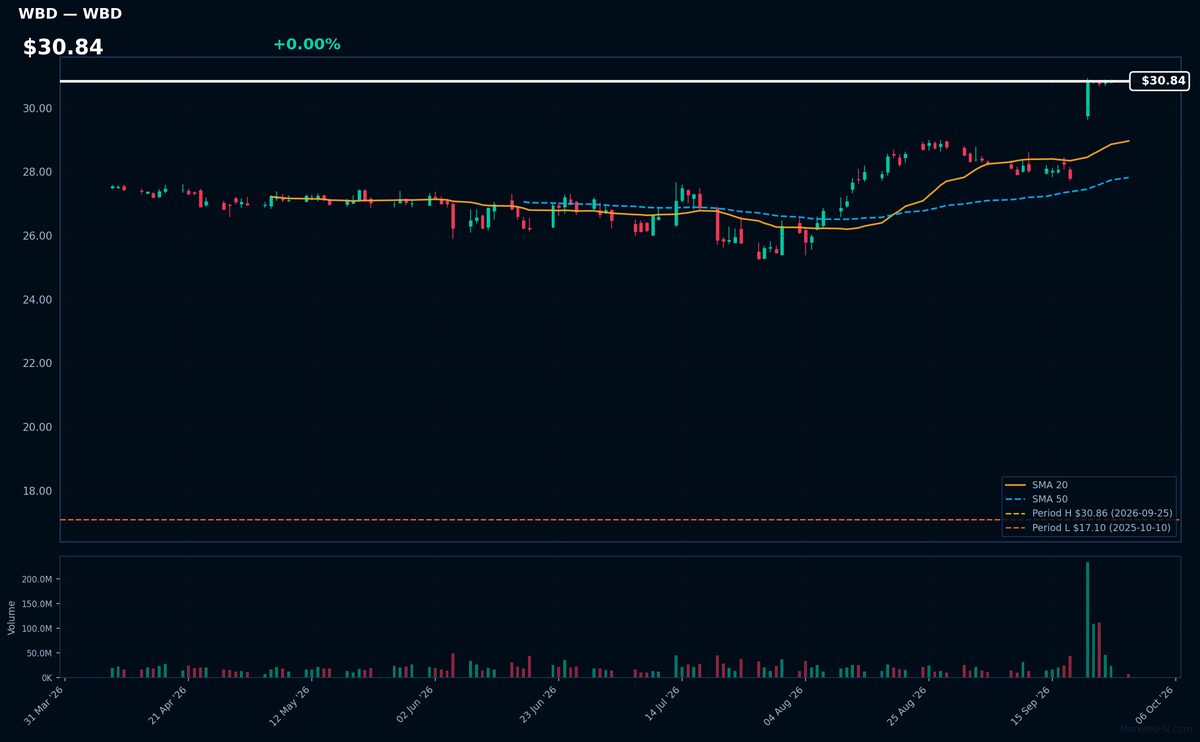
WBD | Warner Bros. Discovery Inc | Communication Services | Price Last: $30.84 | % Realized: +63.55% | RSI: 75.1 | % above MA200: +11.6% | Trend: Above MA20, MA50, MA200
Warner Bros. Discovery Inc is a media conglomerate owning major entertainment brands like HBO, Warner Bros., and Discovery Channel, generating revenue through content creation, distribution, and advertising. Investors care about its content library and streaming growth potential.
WBD's RSI(14) is 75.1, indicating strong momentum. The stock is in a sustained uptrend with price > MA20 > MA50 > MA200. It's 0.0% below its 52-Week high, suggesting a potential breakout, with a 63.5% 52-Week return.
Related headlines
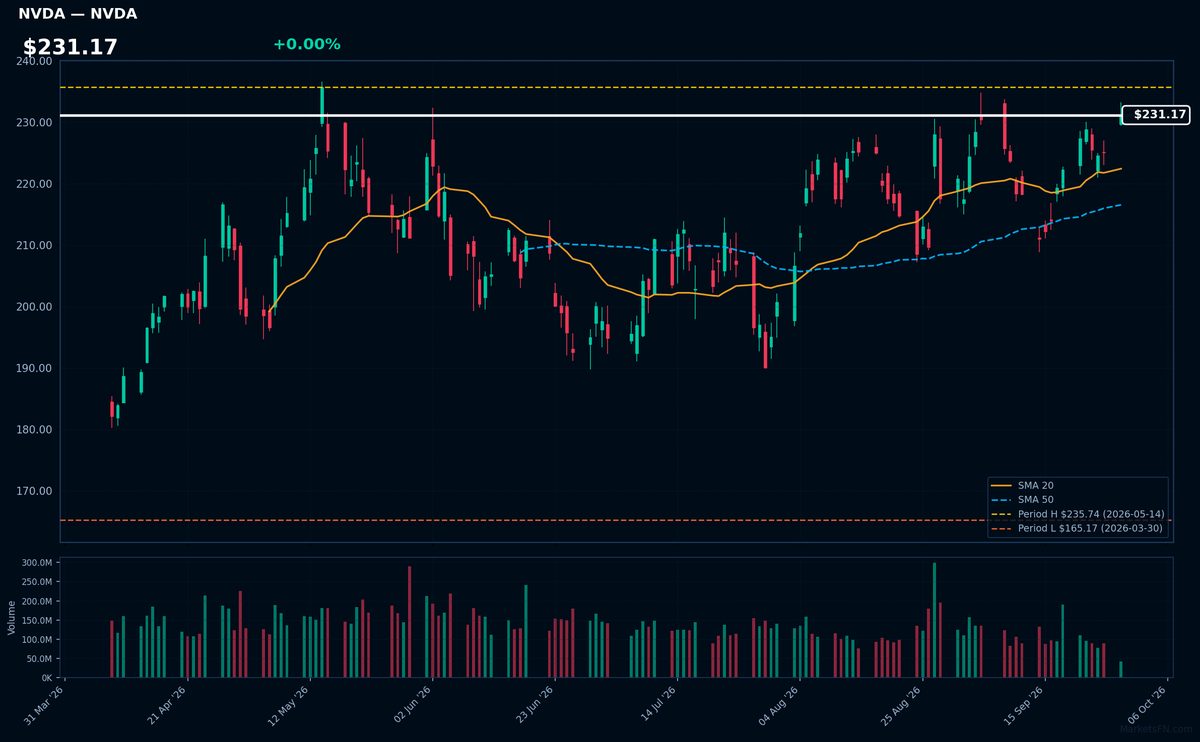
NVDA | NVIDIA Corp | Technology | Price Last: $231.23 | % Realized: +27.15% | RSI: 60.5 | % above MA200: +15.8% | Trend: Above MA20, MA50, MA200
NVIDIA Corp is a leader in GPU technology and AI computing, driving growth in gaming, professional visualization, datacenter, and automotive markets. Investors care due to its dominance in high-growth areas and potential for continued innovation.
NVIDIA Corp shows a bullish MA alignment with price > MA20 > MA50 > MA200, RSI(14) at 60.5, and is 1.9% below its 52-Week high, indicating sustained uptrend and potential breakout momentum, not a warning sign.
Related headlines
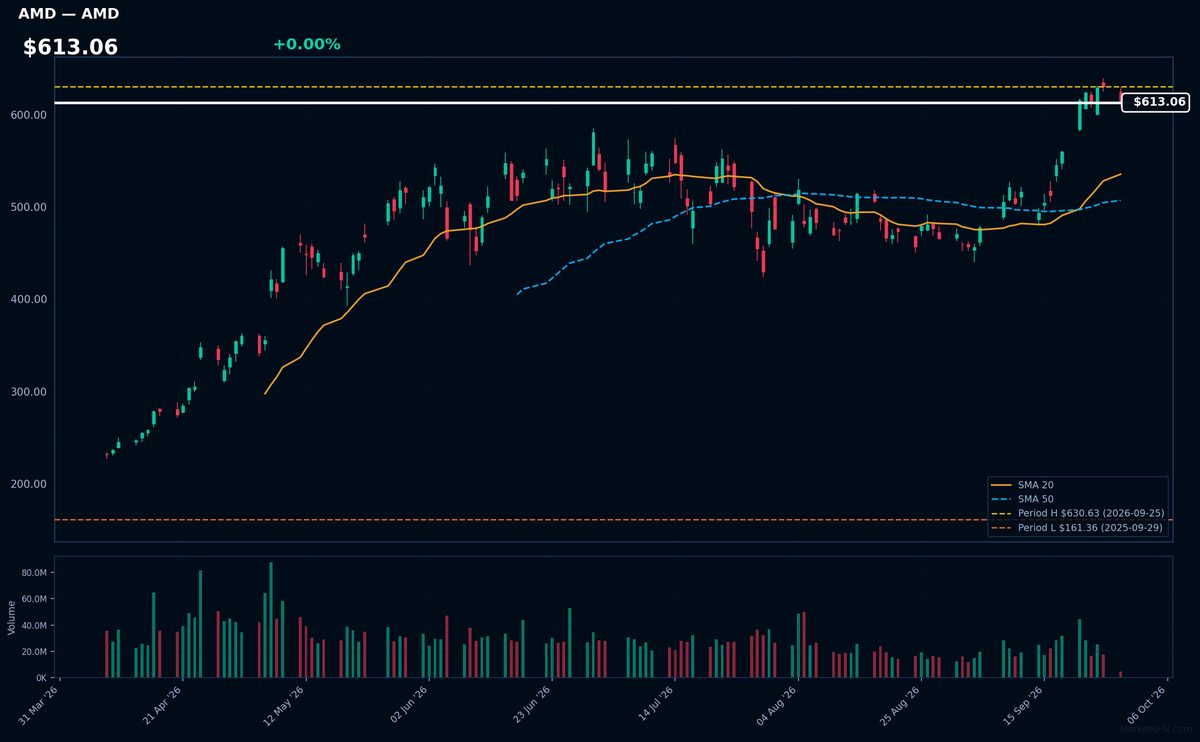
AMD | Advanced Micro Devices Inc | Technology | Price Last: $613.23 | % Realized: +280.04% | RSI: 67.2 | % above MA200: +67.2% | Trend: Above MA20, MA50, MA200
Advanced Micro Devices Inc designs and manufactures high-performance computing and graphics processing units, crucial for gaming PCs, data centers, and AI applications, making it a key player in the semiconductor industry with significant growth potential.
AMD's current technical situation indicates strong momentum: RSI(14) is 67.2, with a bullish MA alignment (price > MA20 > MA50 > MA200) and the stock is 2.8% below its 52-Week high, suggesting a potential breakout.
Related headlines
- CEO Predicts: Demand Will Continue to Rise as AMD and Intel Soar up to 17% Thanks to Muse
- INTC, AMD, AVGO: Chip Stocks Lead Slide As Tech Gets Hammered Amid Renewed U.S.-Iran Tensions
- Why Did AMD, HPE, MRNA Stocks Surge To 52-Week Highs Last Week?
- AMD Just Hit $1 Trillion After A Blistering 194% Surge YTD Beth Kindig Says The Dark Horse Still Has Room To Run
📉 Nearest to 52-Week Low
Sectors represented: Utilities (2), Consumer Defensive (1), Communication Services (1), Industrials (1)
| Ticker | Company | Sector | Price Last | % Realized | 52-Week Low Date | RSI | % above MA200 | Trend |
|---|---|---|---|---|---|---|---|---|
| PEP | PepsiCo Inc | Consumer Defensive | $127.51 | -9.03% | 2026-09-28 | 26.9 | -13.7% | Below MA20, MA50, MA200 |
| CMCSA | Comcast Corp | Communication Services | $21.82 | -26.07% | 2026-09-28 | 27.0 | -18.6% | Below MA20, MA50, MA200 |
| CPRT | Copart, Inc | Industrials | $27.14 | -39.16% | 2026-09-28 | 30.0 | -19.6% | Below MA20, MA50, MA200 |
| EXC | Exelon Corp | Utilities | $40.17 | -9.26% | 2026-09-28 | 23.1 | -12.1% | Below MA20, MA50, MA200 |
| XEL | Xcel Energy, Inc | Utilities | $69.42 | -13.28% | 2026-09-28 | 26.2 | -11.2% | Below MA20, MA50, MA200 |
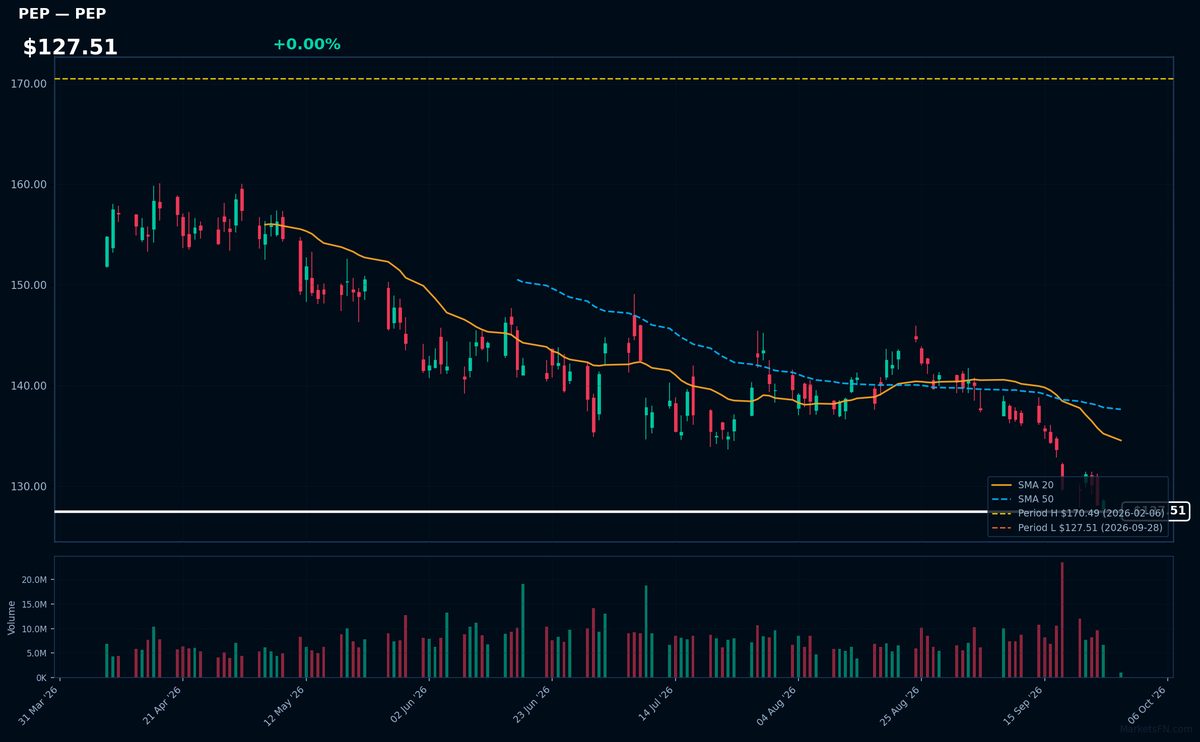
PEP | PepsiCo Inc | Consumer Defensive | Price Last: $127.51 | % Realized: -9.03% | RSI: 26.9 | % above MA200: -13.7% | Trend: Below MA20, MA50, MA200
PepsiCo Inc is a diversified food and beverage company with brands like Pepsi, Lay's, and Gatorade, generating revenue through beverage sales, snack foods, and other consumer products, making it a significant player in the consumer staples sector.
PepsiCo's current technical situation is bearish, with an RSI(14) of 26.9 indicating oversold conditions, and a sustained downtrend as price ($127.51) remains below MA20, MA50, and MA200, with the stock testing major support at its 52-Week low.
Related headlines
- Deutsche Bank lowers PepsiCo rating as turnaround now more complicated
- PEP Stock Faces Fresh Test: Deutsche Bank Flags Concerns Over PepsiCos North America Recovery
- PEP Stock Heads For Worst Month Since May: PepsiCo Commits $1B To Colombia Expansion, Targets Higher Prices Ahead Of Q3 Earnings
- Why Did NKE, PEP, FRMI Stocks Dip To 52-Week Lows Last Week?
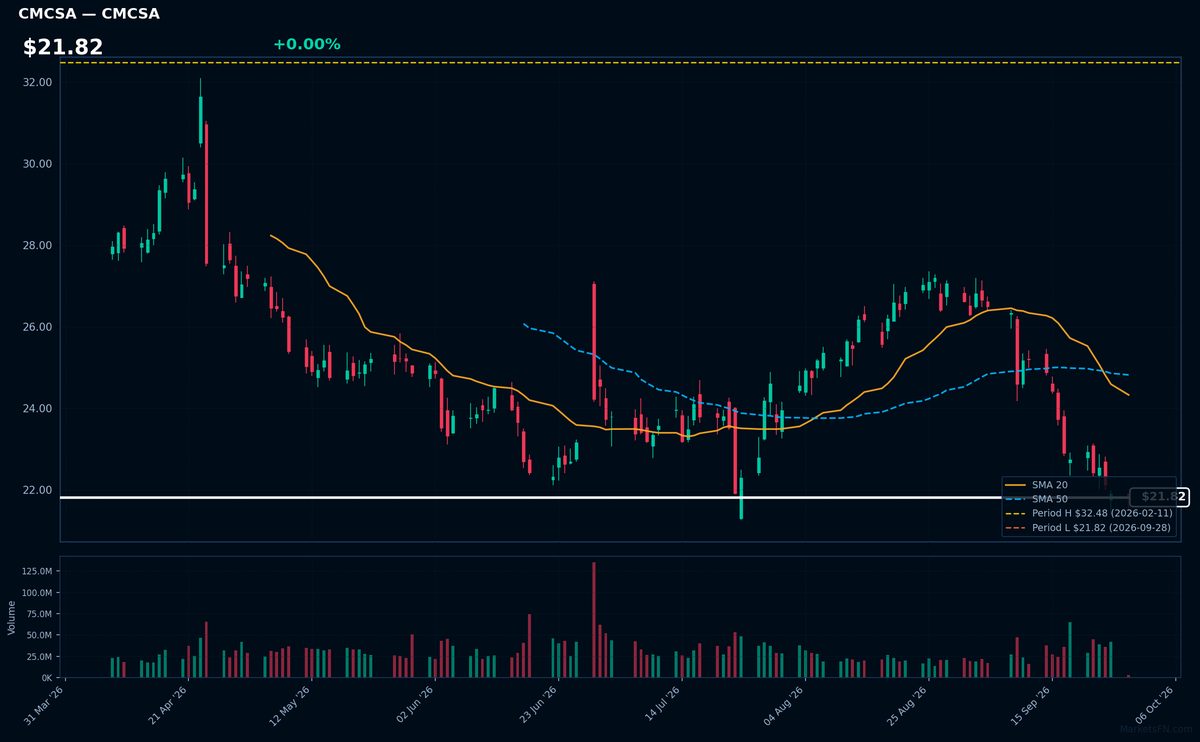
CMCSA | Comcast Corp | Communication Services | Price Last: $21.82 | % Realized: -26.07% | RSI: 27.0 | % above MA200: -18.6% | Trend: Below MA20, MA50, MA200
Comcast Corp is a media and telecommunications conglomerate providing cable television, internet, and phone services, as well as owning NBCUniversal, a major media company with film, television, and theme park assets, making it a significant player in both consumer connectivity and entertainment content.
Comcast Corp's current technical situation is bearish, with an RSI(14) of 27.0 indicating oversold conditions, and a bearish MA alignment (price < MA20 < MA50 < MA200), with the stock at its 52-Week low, suggesting a sustained downtrend and potential further downside.
Related headlines
- Xfinity and Comcast Business High-Speed Internet Now Available to More Than 2,300 Homes and Businesses in Clay County, Florida
- Comcast Completes Washington County, Pennsylvania Expansion Connecting Thousands to High-Speed Internet for the First Time
- KeyBanc Revamps Comcast Stock Price Target for Rest of 2026
- KeyBanc gets bearish on Comcast as broadband competition intensifies
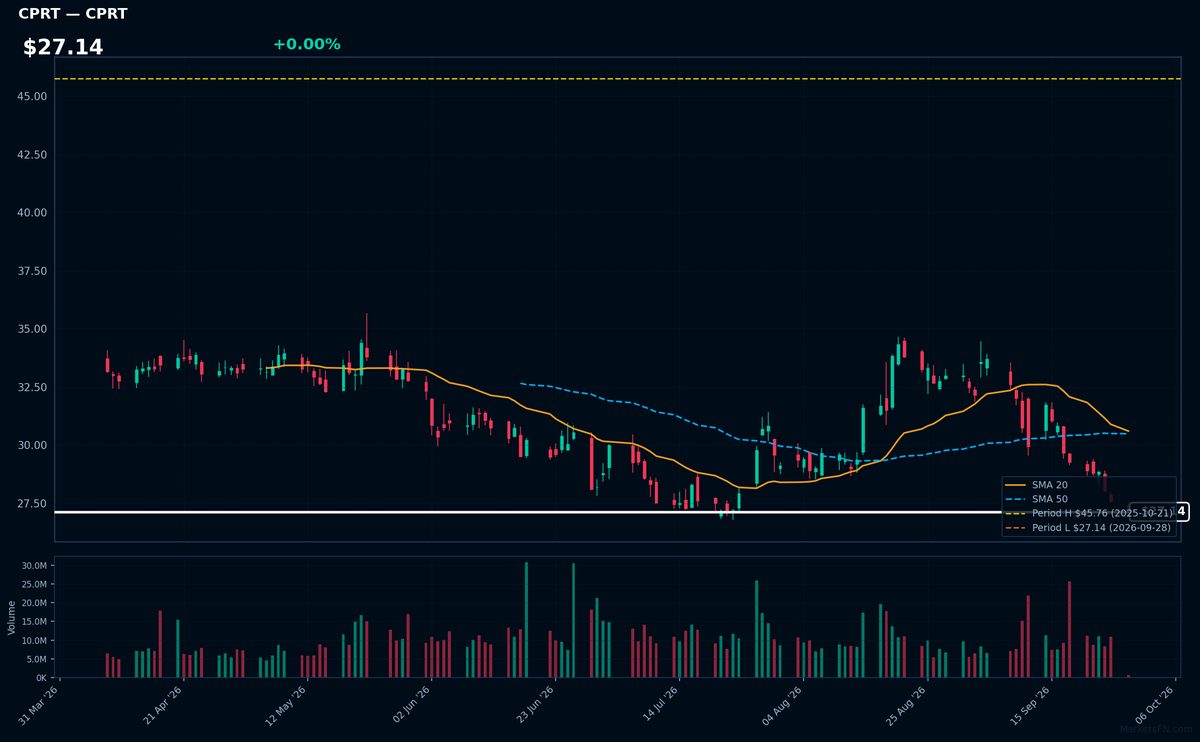
CPRT | Copart, Inc | Industrials | Price Last: $27.14 | % Realized: -39.16% | RSI: 30.0 | % above MA200: -19.6% | Trend: Below MA20, MA50, MA200
Copart, Inc is a provider of online vehicle auction and remarketing services, enabling buyers and sellers to transact efficiently. Investors should care because its platform's scale and efficiency drive revenue growth, influenced by the volume of vehicles sold and auction fees.
Copart's technicals indicate a warning sign: RSI(14) is 30.0, nearing oversold territory, and the stock is below MA20, MA50, and MA200 with a 52-Week return of -39.2%, testing major support at its 52-Week low.
Related headlines
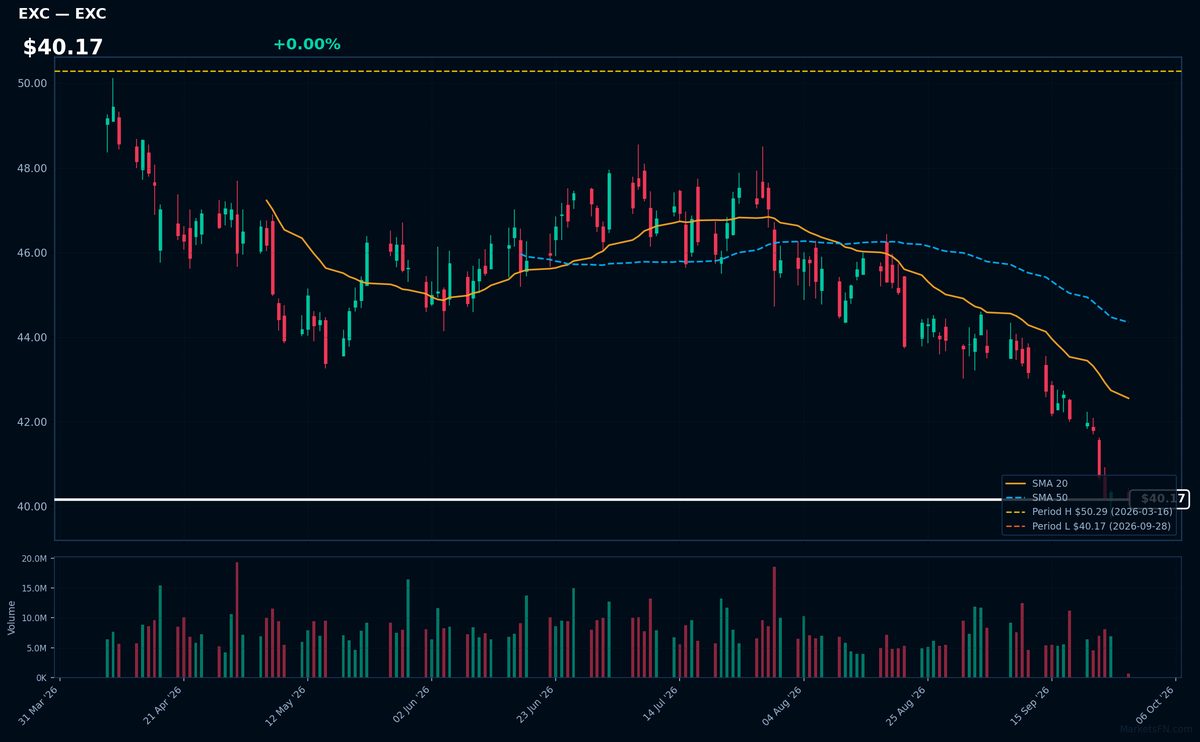
EXC | Exelon Corp | Utilities | Price Last: $40.17 | % Realized: -9.26% | RSI: 23.1 | % above MA200: -12.1% | Trend: Below MA20, MA50, MA200
Exelon Corp is a utility company that generates and distributes electricity, operating nuclear, natural gas, and renewable energy facilities. Investors care about its stable cash flows and dividend yield, given its role in meeting energy demands.
Exelon Corp's technicals indicate a sustained downtrend with price ($40.17) below MA20, MA50, and MA200. The RSI(14) is 23.1, nearing oversold territory, and the stock is 0.0% above its 52-Week low, testing major support, potentially a warning sign.
Related headlines
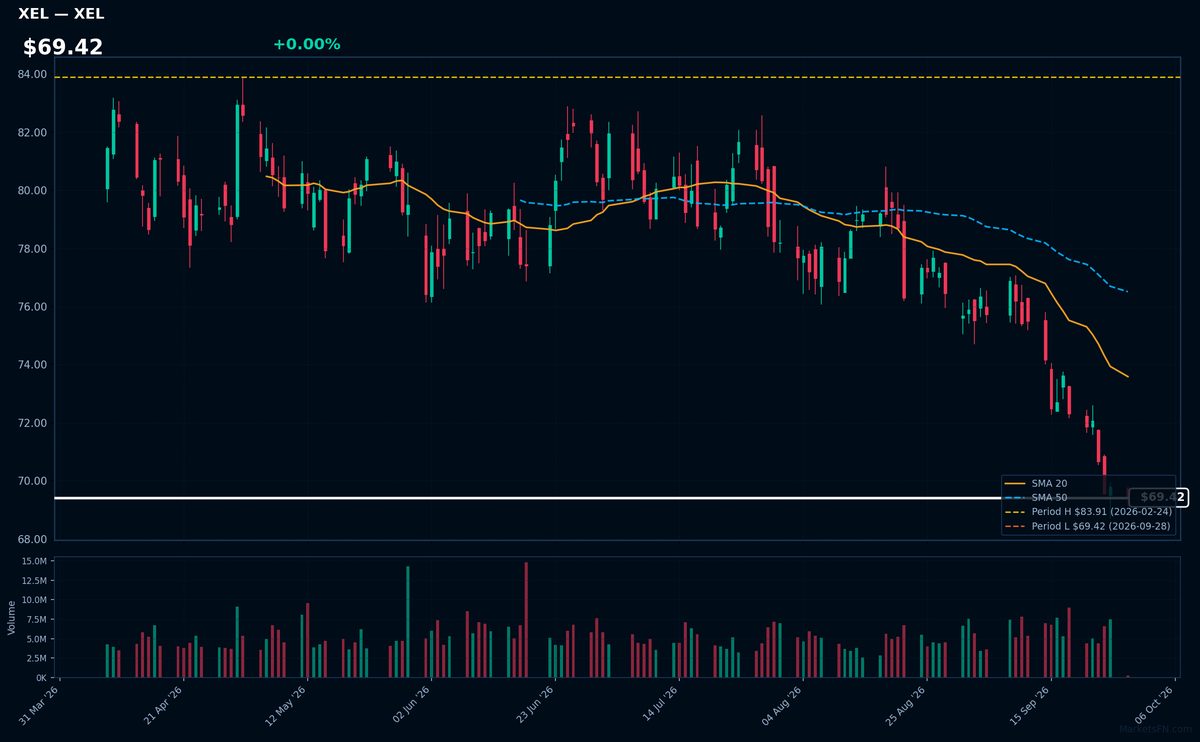
XEL | Xcel Energy, Inc | Utilities | Price Last: $69.42 | % Realized: -13.28% | RSI: 26.2 | % above MA200: -11.2% | Trend: Below MA20, MA50, MA200
Xcel Energy, Inc is a major electric and natural gas utility company serving 3.4 million customers across eight states, generating and distributing electricity from a diverse mix of sources including wind, solar, and natural gas, making it relevant to investors seeking stable, regulated energy exposure.
Xcel Energy's current technical situation indicates a warning sign with an RSI(14) of 26.2, suggesting oversold conditions, and a bearish MA alignment (price < MA20 < MA50 < MA200), indicating a sustained downtrend, with the stock testing major support at its 52-Week low.
Related headlines
Market Commentary
The Nasdaq 100 stocks are currently trading near 52-week extremes, with some stocks like AAPL, BIIB, and WBD at their 52-week highs, while others like PEP, CMCSA, and CPRT are at their 52-week lows. This indicates a significant shift in market sentiment, with stocks either reaching new highs or struggling to rebound from recent lows.
The technology sector is driving the highs, with NVDA and AMD near their 52-week highs, albeit slightly below. This suggests that the sector is still experiencing momentum, potentially driven by macro themes such as advancements in AI and semiconductor demand. Conversely, stocks at 52-week lows are largely from the consumer staples and utilities sectors, indicating a potential rotation away from defensive plays.
Key levels to watch include the 52-week extremes, as a breakout or breakdown could signal further market direction. For stocks near highs like NVDA and AMD, a breakout above their current levels could indicate continued sector strength. Conversely, a breakdown below the 52-week lows for stocks like PEP and CMCSA could signal further weakness in their respective sectors.
Methodology: All 101 Nasdaq 100 constituents screened. 52-week high = highest daily close over the past 252 trading days (approx. 1 year). 52-week low = lowest daily close over the same period. Distance = (current price / extreme − 1) × 100. Technical indicators computed on up to 1 year of daily OHLCV data.
Disclaimer: For informational purposes only. Not investment advice. Past performance is not indicative of future results.