Nasdaq 100 52-Week Highs & Lows Radar: Broadcom (AVGO), O'Reilly Automotive, (ORLY) and more
· Stocks · MarketsFN Team
Nasdaq 100 52-Week Highs & Lows Radar: Broadcom (AVGO), O'Reilly Automotive, (ORLY) and more
Screening all 101 Nasdaq 100 constituents for stocks nearest to their 52-week high and their 52-week low. Data as of June 01, 2026. % Realized = 52-week total return.
Legend: RSI > 70 = overbought · RSI < 30 = oversold · Green % Realized = positive 52W return · Red = negative.
📈 Nearest to 52-Week High
Sectors represented: Technology (5)
| Ticker | Company | Sector | Price Last | % Realized | 52-Week High Date | RSI | % above MA200 | Trend |
|---|---|---|---|---|---|---|---|---|
| AVGO | Broadcom Inc | Technology | $449.14 | +80.59% | 2026-06-01 | 66.7 | +27.2% | Above MA20, MA50, MA200 |
| ARM | Arm Holdings plc. ADR | Technology | $385.42 | +205.75% | 2026-06-01 | 80.7 | +153.5% | Above MA20, MA50, MA200 |
| MU | Micron Technology Inc | Technology | $1022.42 | +941.38% | 2026-06-01 | 80.2 | +197.9% | Above MA20, MA50, MA200 |
| PANW | Palo Alto Networks Inc | Technology | $287.73 | +47.66% | 2026-06-01 | 81.7 | +51.5% | Above MA20, MA50, MA200 |
| CRWD | Crowdstrike Holdings Inc | Technology | $753.41 | +57.23% | 2026-06-01 | 85.2 | +59.7% | Above MA20, MA50, MA200 |
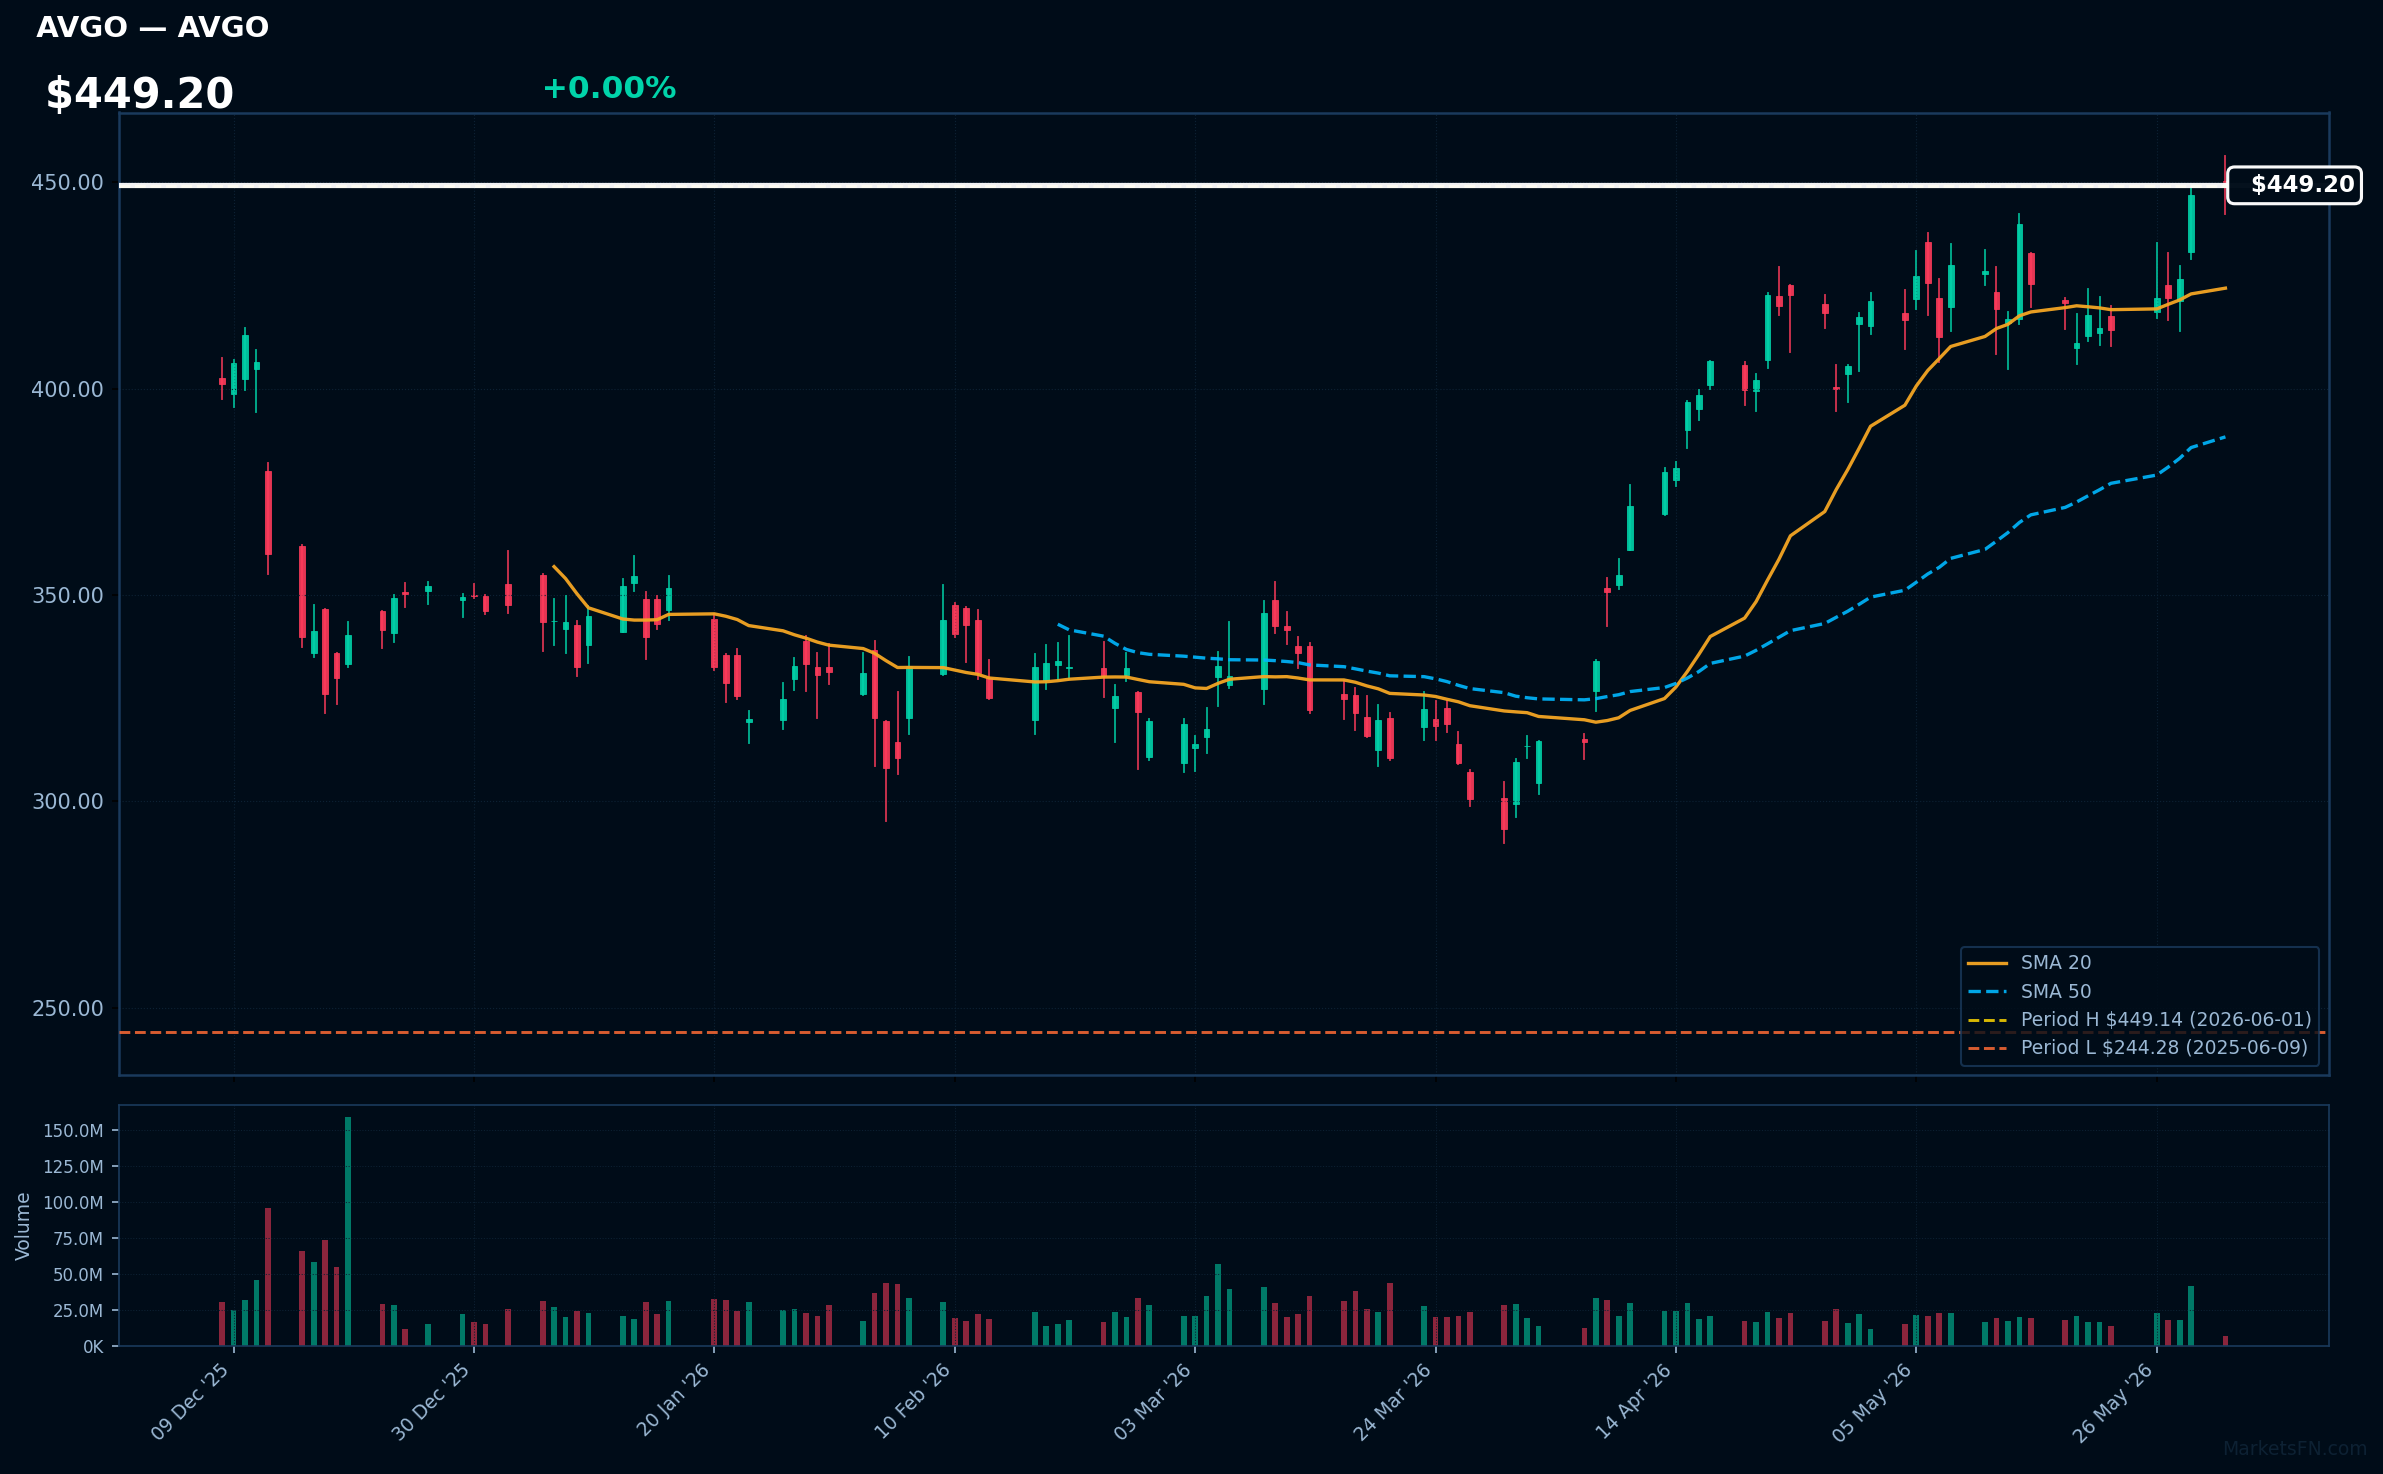
AVGO | Broadcom Inc | Technology | Price Last: $449.14 | % Realized: +80.59% | RSI: 66.7 | % above MA200: +27.2% | Trend: Above MA20, MA50, MA200
Broadcom Inc (AVGO) is a semiconductor and infrastructure software company. Investors should care because its semiconductor solutions enable data center, enterprise, and industrial applications, while its software segment provides networking and cybersecurity solutions, driving growth in high-demand tech sectors.
AVGO's technicals indicate sustained uptrend with price > MA20 > MA50 > MA200. RSI(14) is 66.7, nearing overbought territory. The stock is 0.0% below its 52-Week high, suggesting potential breakout momentum, supported by an 80.6% 52-Week return.
Related headlines
- Broadcom Reports Earnings Wednesday. Here's How Much Traders Expect the Stock to Move
- Jobs, Broadcom, CrowdStrike, Planet Labs, Macy's, and More to Watch This Week
- Broadcom Stock, Fiber Optic Leader Ciena Lead Another AI Earnings Bonanza
- Strong Q1 Says Marvell Is Becoming Broadcom's Most Credible Rival
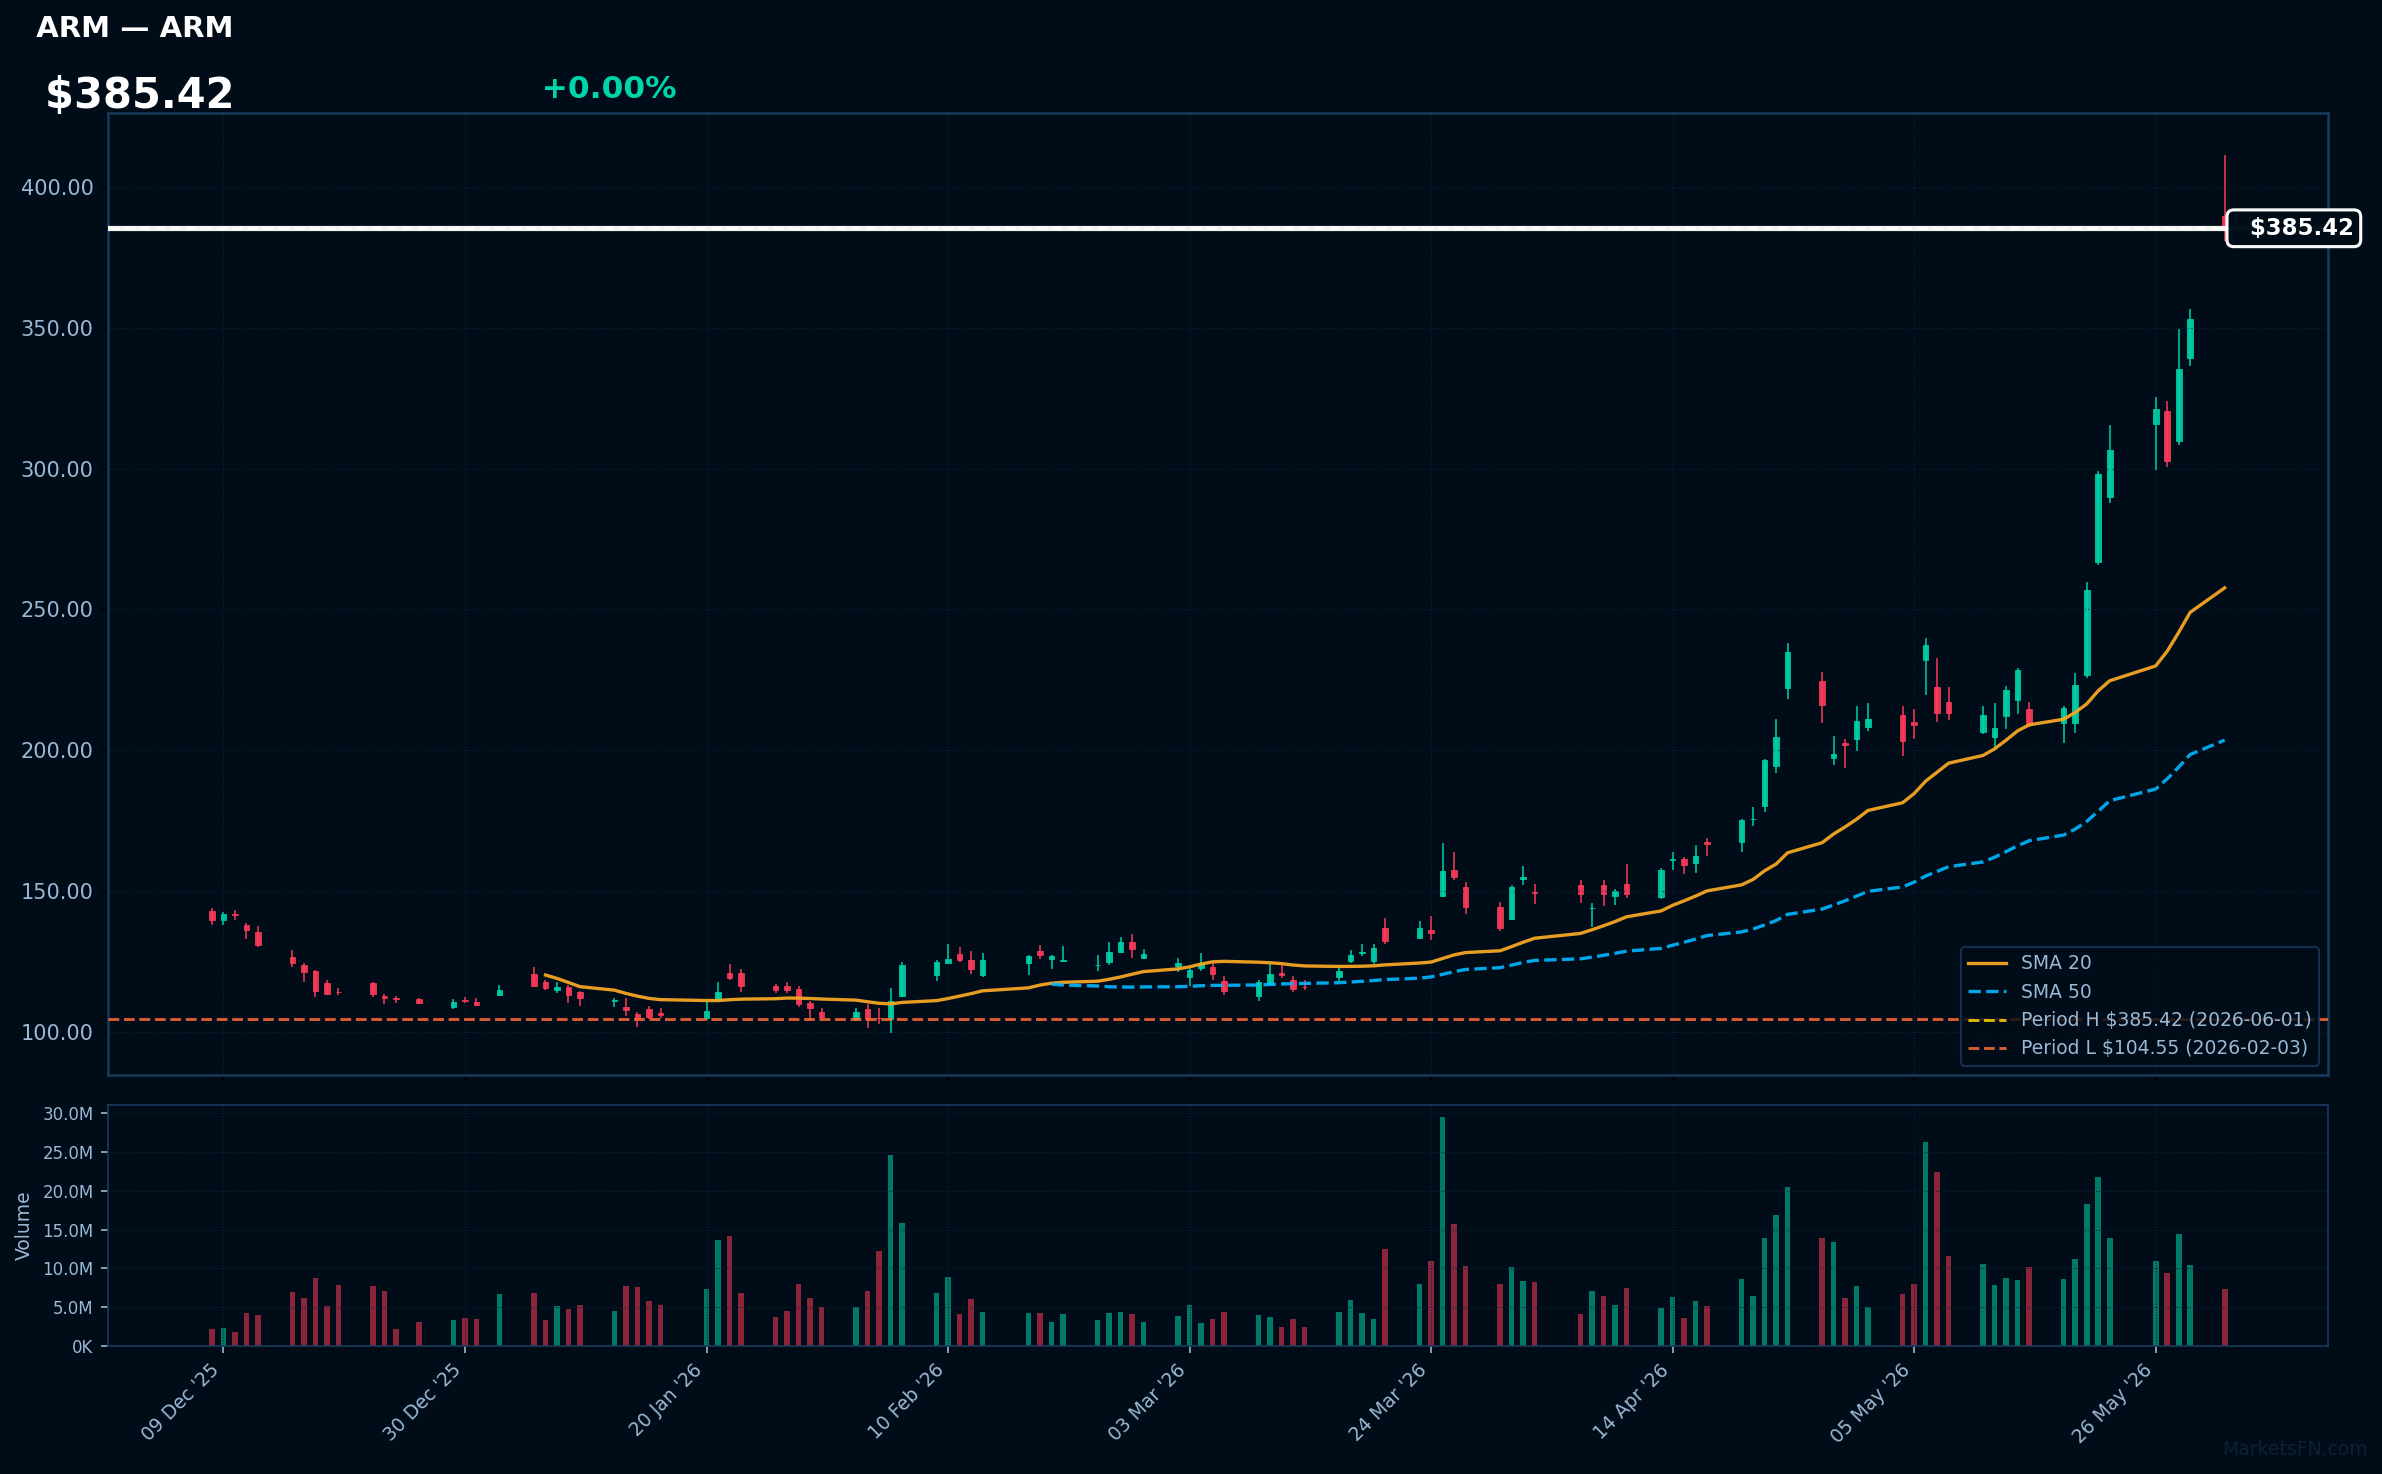
ARM | Arm Holdings plc. ADR | Technology | Price Last: $385.42 | % Realized: +205.75% | RSI: 80.7 | % above MA200: +153.5% | Trend: Above MA20, MA50, MA200
Arm Holdings plc. ADR designs and licenses semiconductor intellectual property, enabling the development of power-efficient processors used in smartphones, PCs, and emerging AI applications, making it a crucial player in the tech ecosystem.
ARM is in a sustained uptrend with price > MA20 > MA50 > MA200, RSI(14) at 80.7, indicating strong momentum; it's 0.0% below its 52-Week high, suggesting a potential breakout.
Related headlines
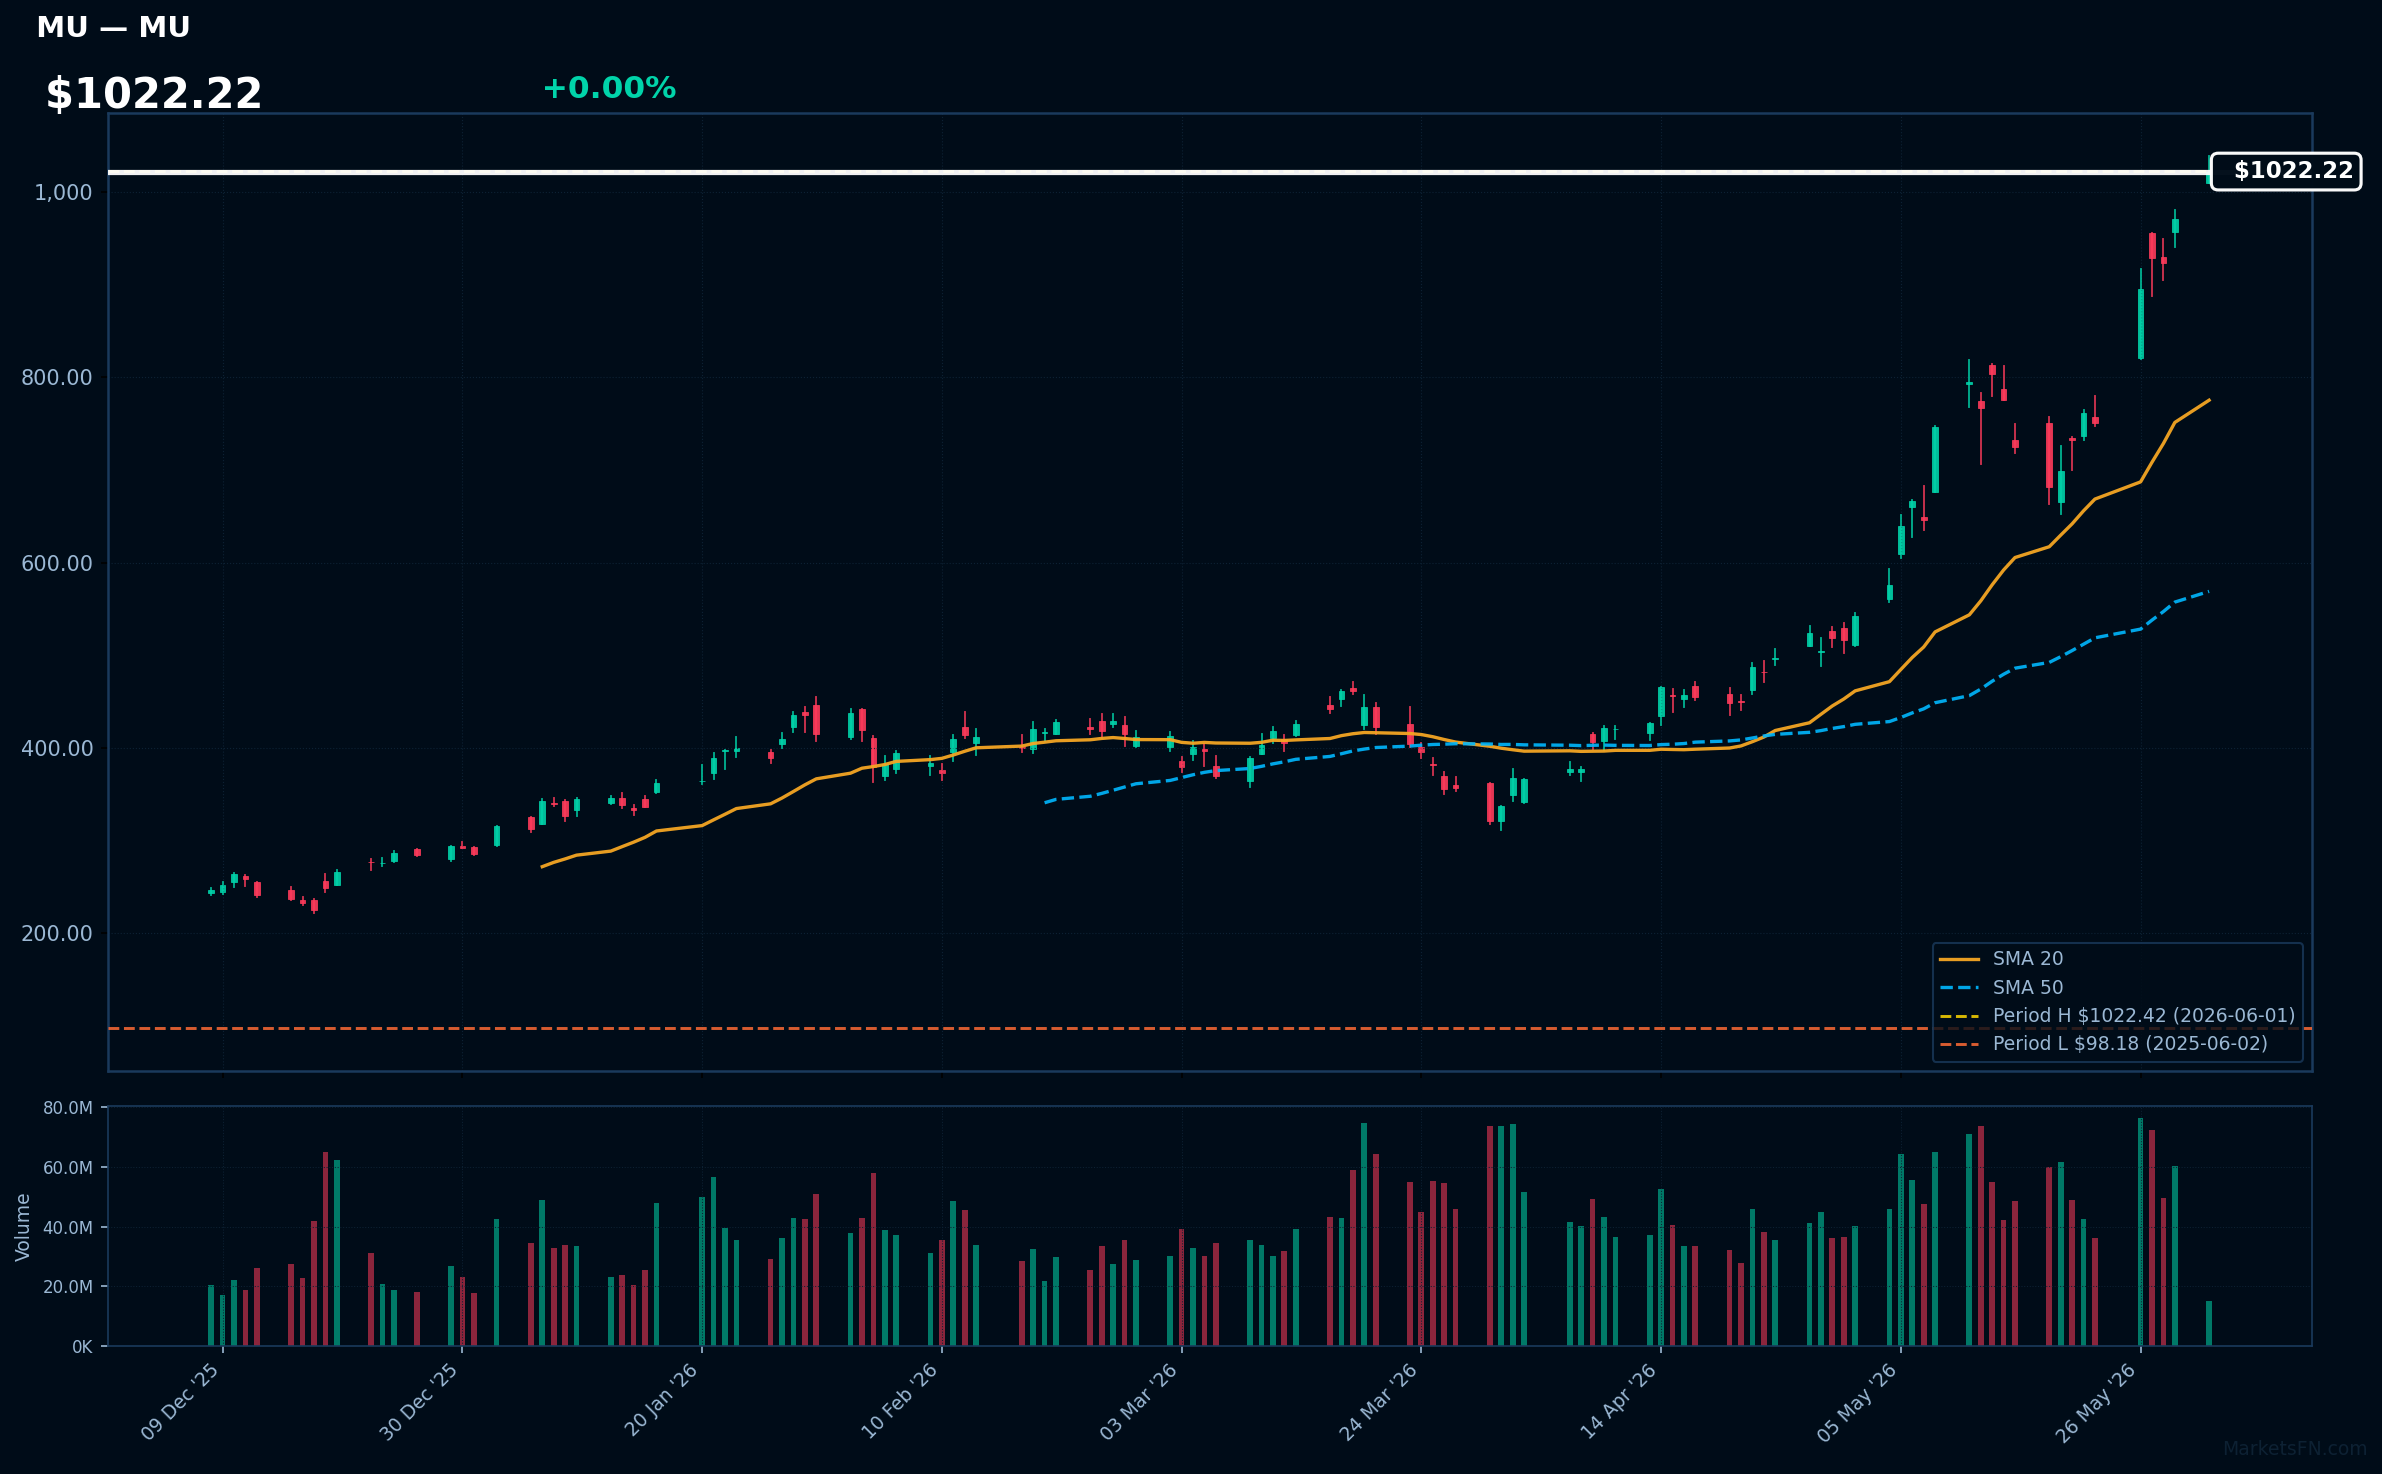
MU | Micron Technology Inc | Technology | Price Last: $1022.42 | % Realized: +941.38% | RSI: 80.2 | % above MA200: +197.9% | Trend: Above MA20, MA50, MA200
Micron Technology Inc designs and manufactures memory and storage products, including DRAM and NAND flash memory, used in various applications such as data centers, PCs, and mobile devices, making it a crucial component supplier to the tech industry.
Micron Technology Inc is in a sustained uptrend with price > MA20 > MA50 > MA200, RSI(14) at 80.2, indicating strong momentum; it's 0.0% below its 52-Week high, suggesting a potential breakout, but the high RSI may be a warning sign of overbought conditions.
Related headlines
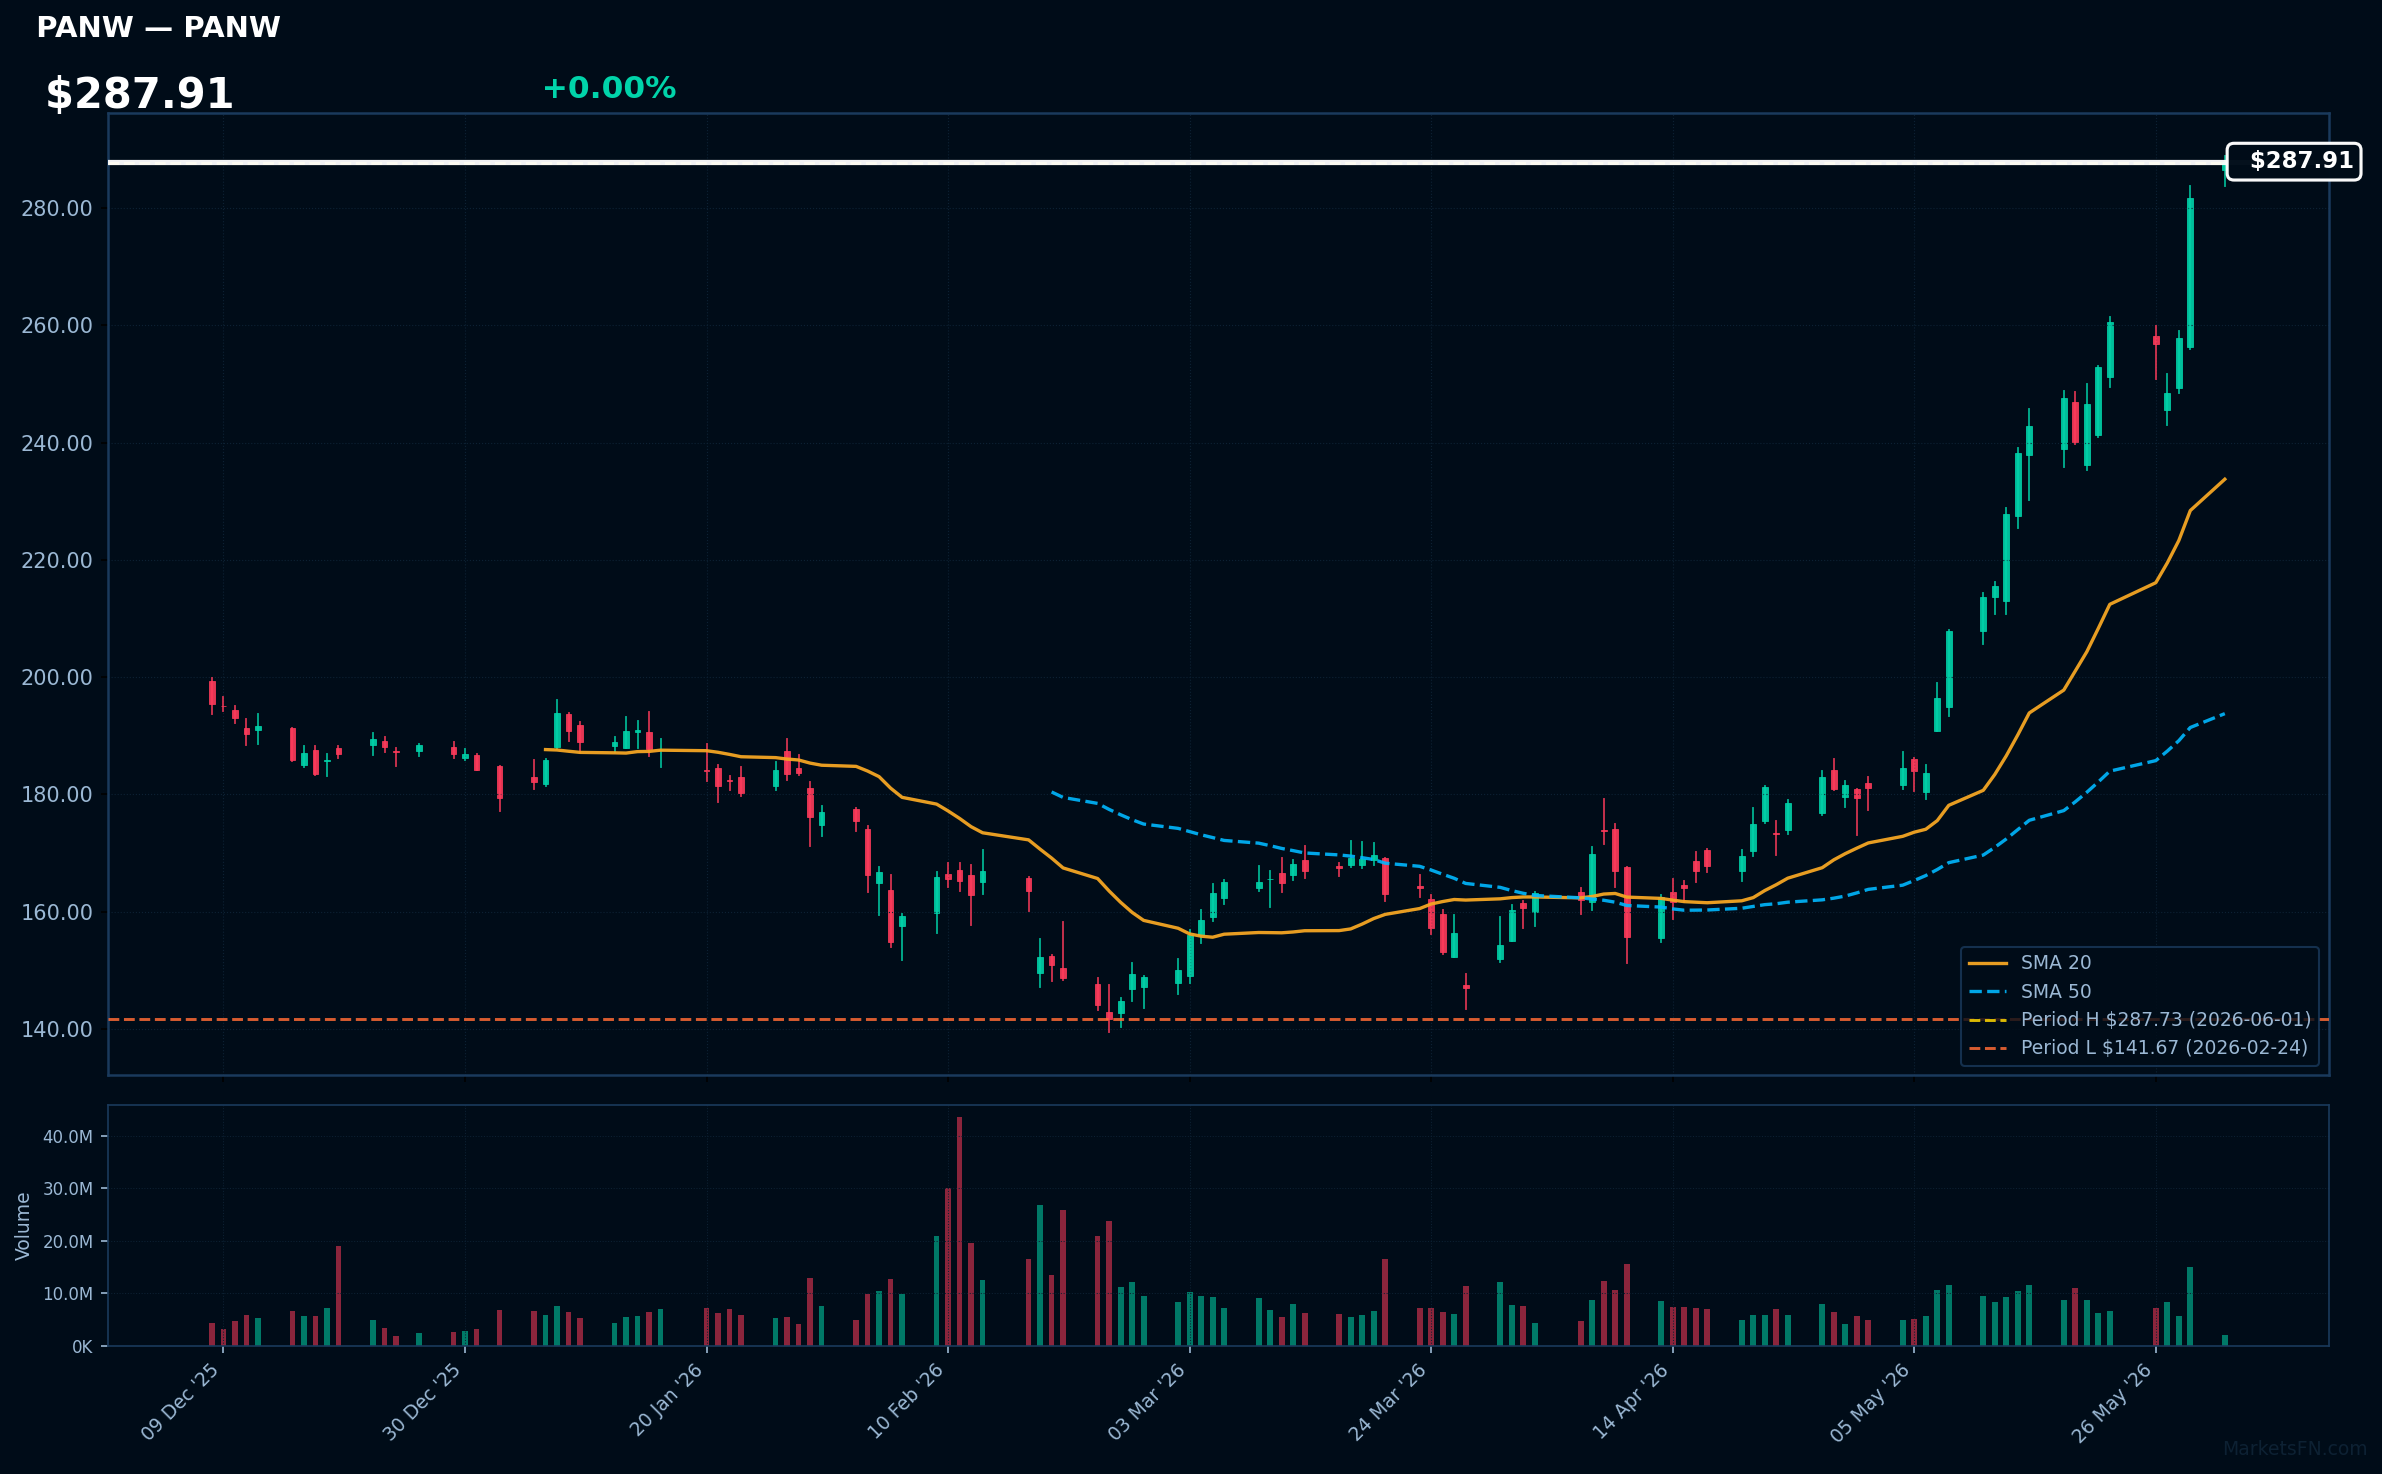
PANW | Palo Alto Networks Inc | Technology | Price Last: $287.73 | % Realized: +47.66% | RSI: 81.7 | % above MA200: +51.5% | Trend: Above MA20, MA50, MA200
Palo Alto Networks Inc is a cybersecurity company providing advanced threat prevention and security solutions. Investors should care due to its strong growth prospects driven by increasing demand for robust cybersecurity measures in a digitally transforming world.
Palo Alto Networks Inc is in a sustained uptrend with price at $287.91, RSI(14) at 81.7, and MA alignment: price > MA20 > MA50 > MA200. The stock is 0.0% below its 52-Week high, indicating potential breakout momentum.
Related headlines
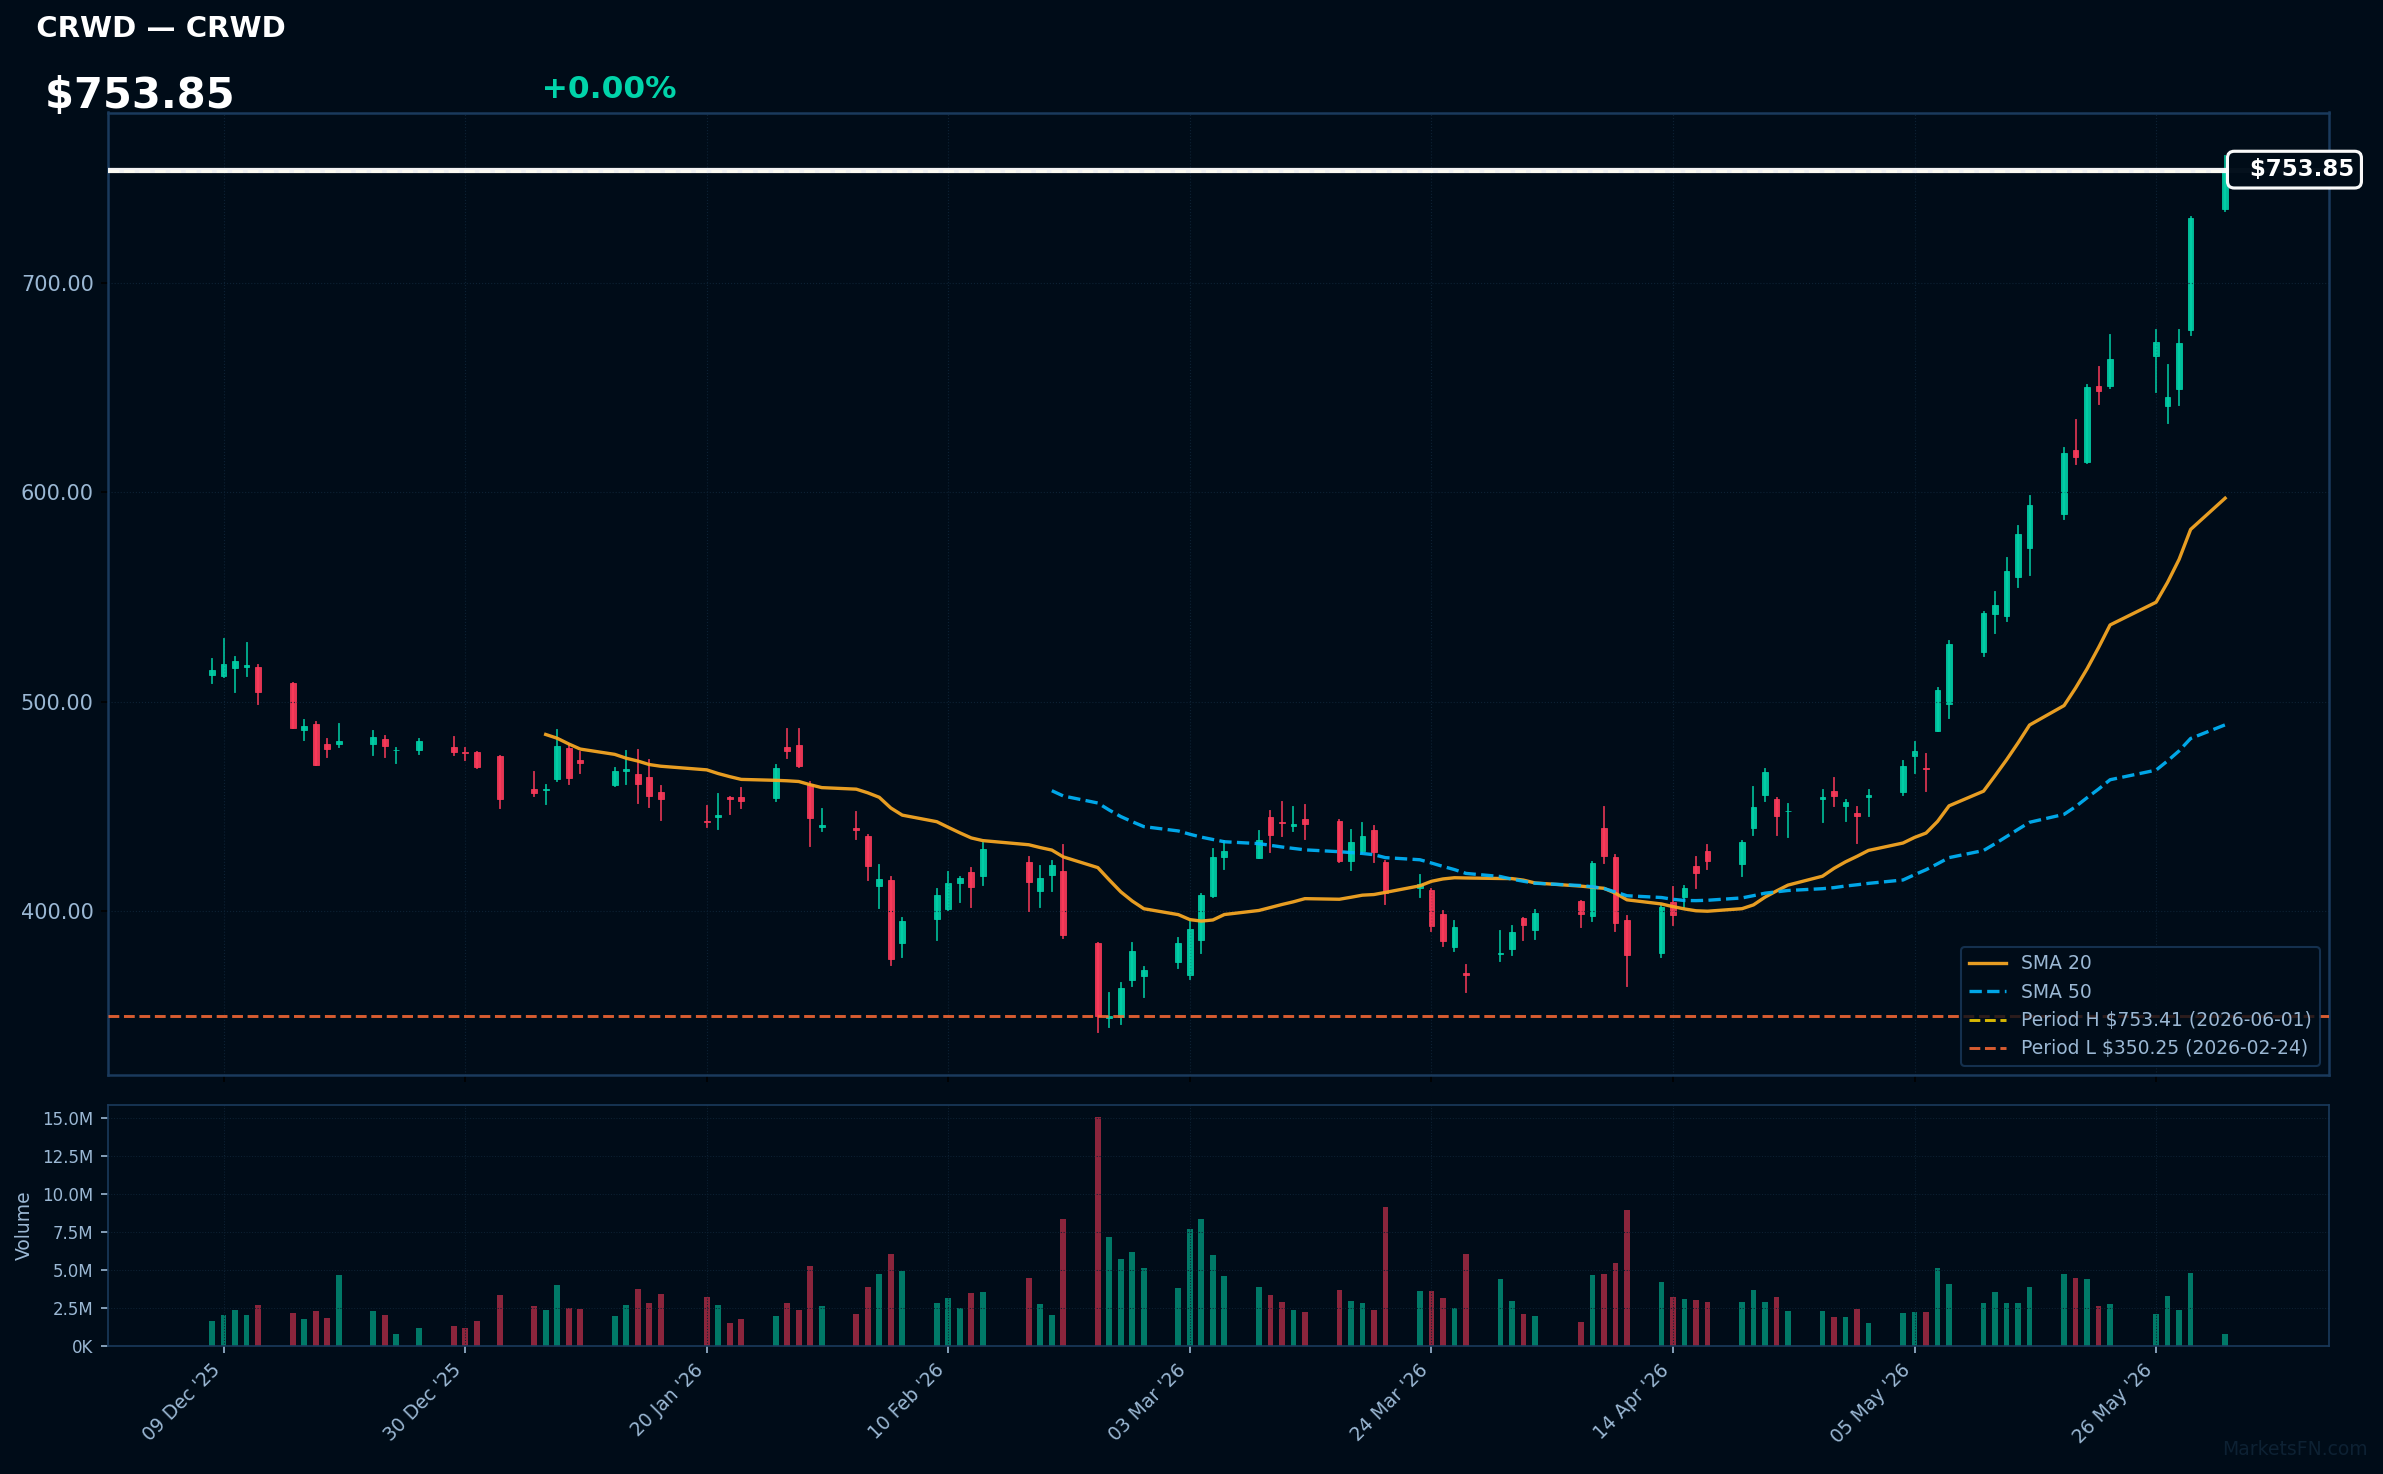
CRWD | Crowdstrike Holdings Inc | Technology | Price Last: $753.41 | % Realized: +57.23% | RSI: 85.2 | % above MA200: +59.7% | Trend: Above MA20, MA50, MA200
Crowdstrike Holdings Inc provides cloud-delivered endpoint security solutions, protecting enterprises from cyber threats. Investors should care as its innovative Falcon platform has driven significant growth, capitalizing on the increasing demand for robust cybersecurity measures in a digitally driven economy.
Crowdstrike's technicals indicate strong momentum: RSI(14) is 85.2, nearing overbought territory. The MA alignment is bullish with price > MA20 > MA50 > MA200, and the stock is 0.0% below its 52-Week high, suggesting a potential breakout.
Related headlines
- What to Expect From CrowdStrike Earnings After a 98% Rally
- Jobs, Broadcom, CrowdStrike, Planet Labs, Macy's, and More to Watch This Week
- CrowdStrike Holdings Inc. Cl A stock rises Friday, outperforms market
- CrowdStrike Named a Leader in the 2026 Gartner Magic Quadrant for Endpoint Protection for Seventh Consecutive Time
📉 Nearest to 52-Week Low
Sectors represented: Communication Services (2), Consumer Cyclical (1), Healthcare (1), Industrials (1)
| Ticker | Company | Sector | Price Last | % Realized | 52-Week Low Date | RSI | % above MA200 | Trend |
|---|---|---|---|---|---|---|---|---|
| ORLY | O'Reilly Automotive, Inc | Consumer Cyclical | $87.20 | -4.57% | 2026-05-29 | 36.3 | -9.6% | Below MA20, MA50, MA200 |
| CMCSA | Comcast Corp | Communication Services | $24.86 | -22.73% | 2026-05-15 | 34.7 | -12.5% | Below MA20, MA50, MA200 |
| ISRG | Intuitive Surgical Inc | Healthcare | $421.04 | -23.90% | 2026-05-27 | 38.5 | -14.9% | Below MA20, MA50, MA200 |
| CPRT | Copart, Inc | Industrials | $32.58 | -35.86% | 2026-05-15 | 43.5 | -17.5% | Below MA20, MA50, MA200 |
| CHTR | Charter Communications Inc | Communication Services | $143.84 | -63.56% | 2026-05-15 | 34.1 | -34.7% | Below MA20, MA50, MA200 |
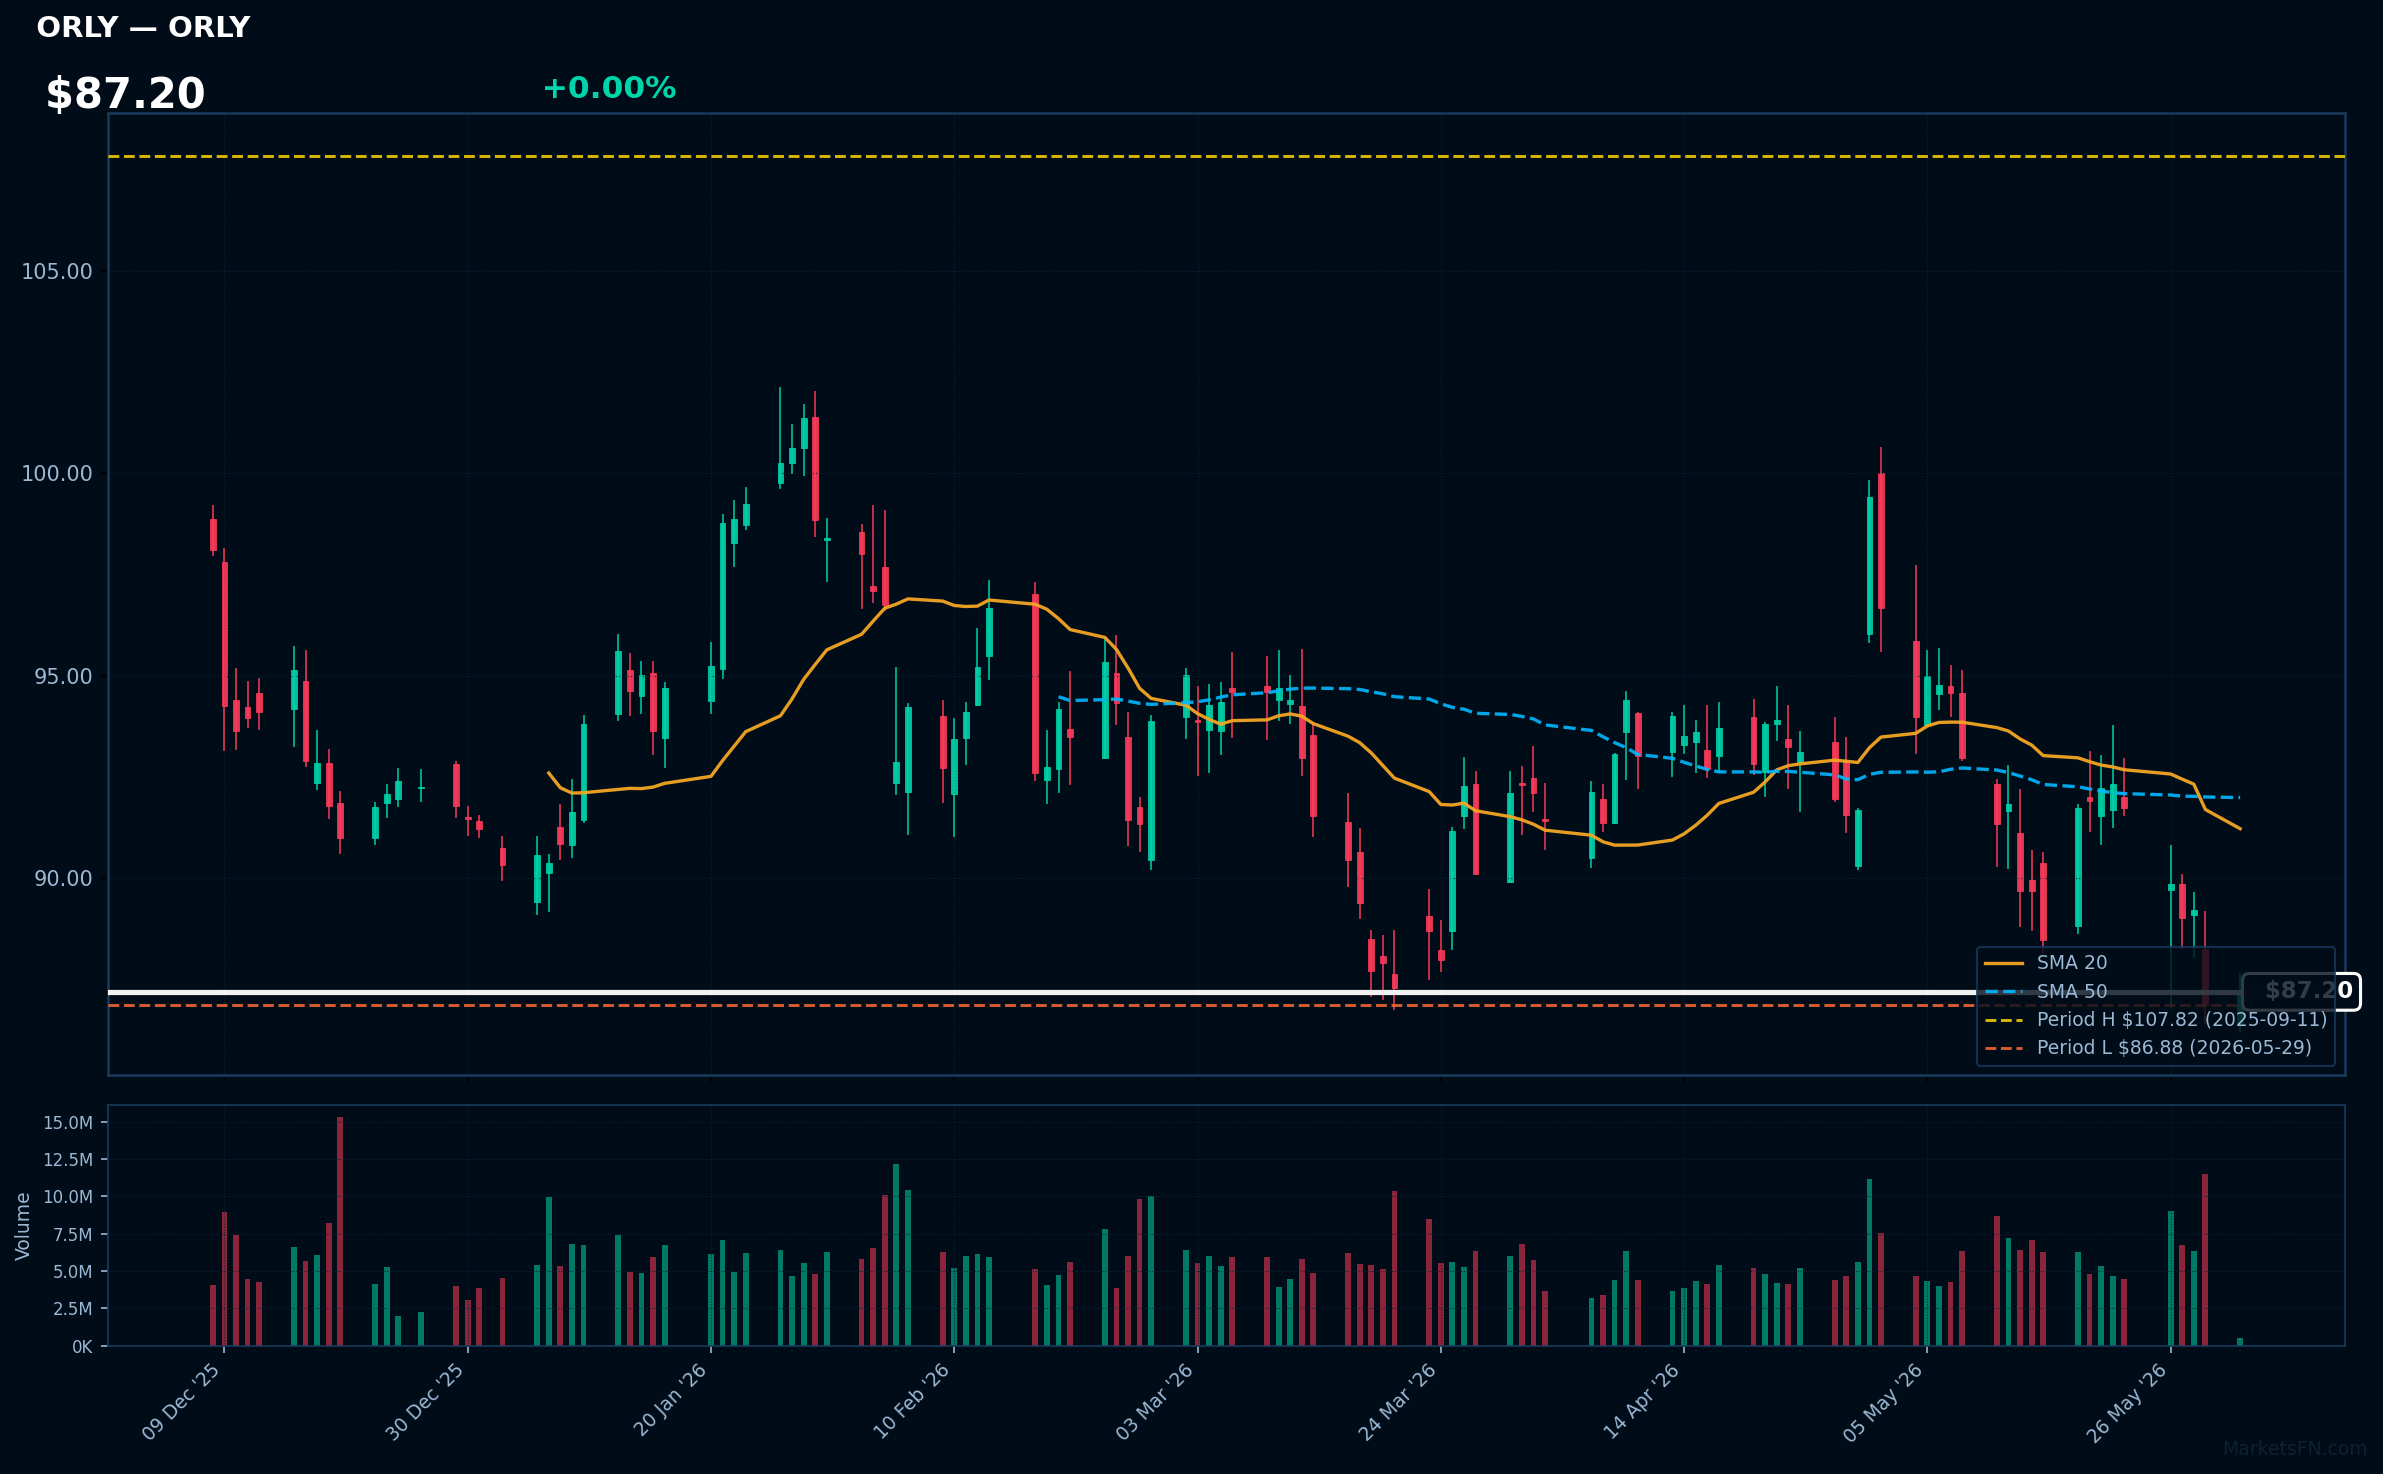
ORLY | O'Reilly Automotive, Inc | Consumer Cyclical | Price Last: $87.20 | % Realized: -4.57% | RSI: 36.3 | % above MA200: -9.6% | Trend: Below MA20, MA50, MA200
O'Reilly Automotive, Inc is a leading auto parts retailer with a vast store network. Investors should care about its performance as it reflects the health of the automotive aftermarket industry and the company's ability to navigate market trends.
ORLY's technicals indicate a warning sign: RSI(14) is 36.3, and the stock is in a sustained downtrend with price < MA20 < MA50 < MA200. It's testing major support, only 0.4% above its 52-Week low.
Related headlines
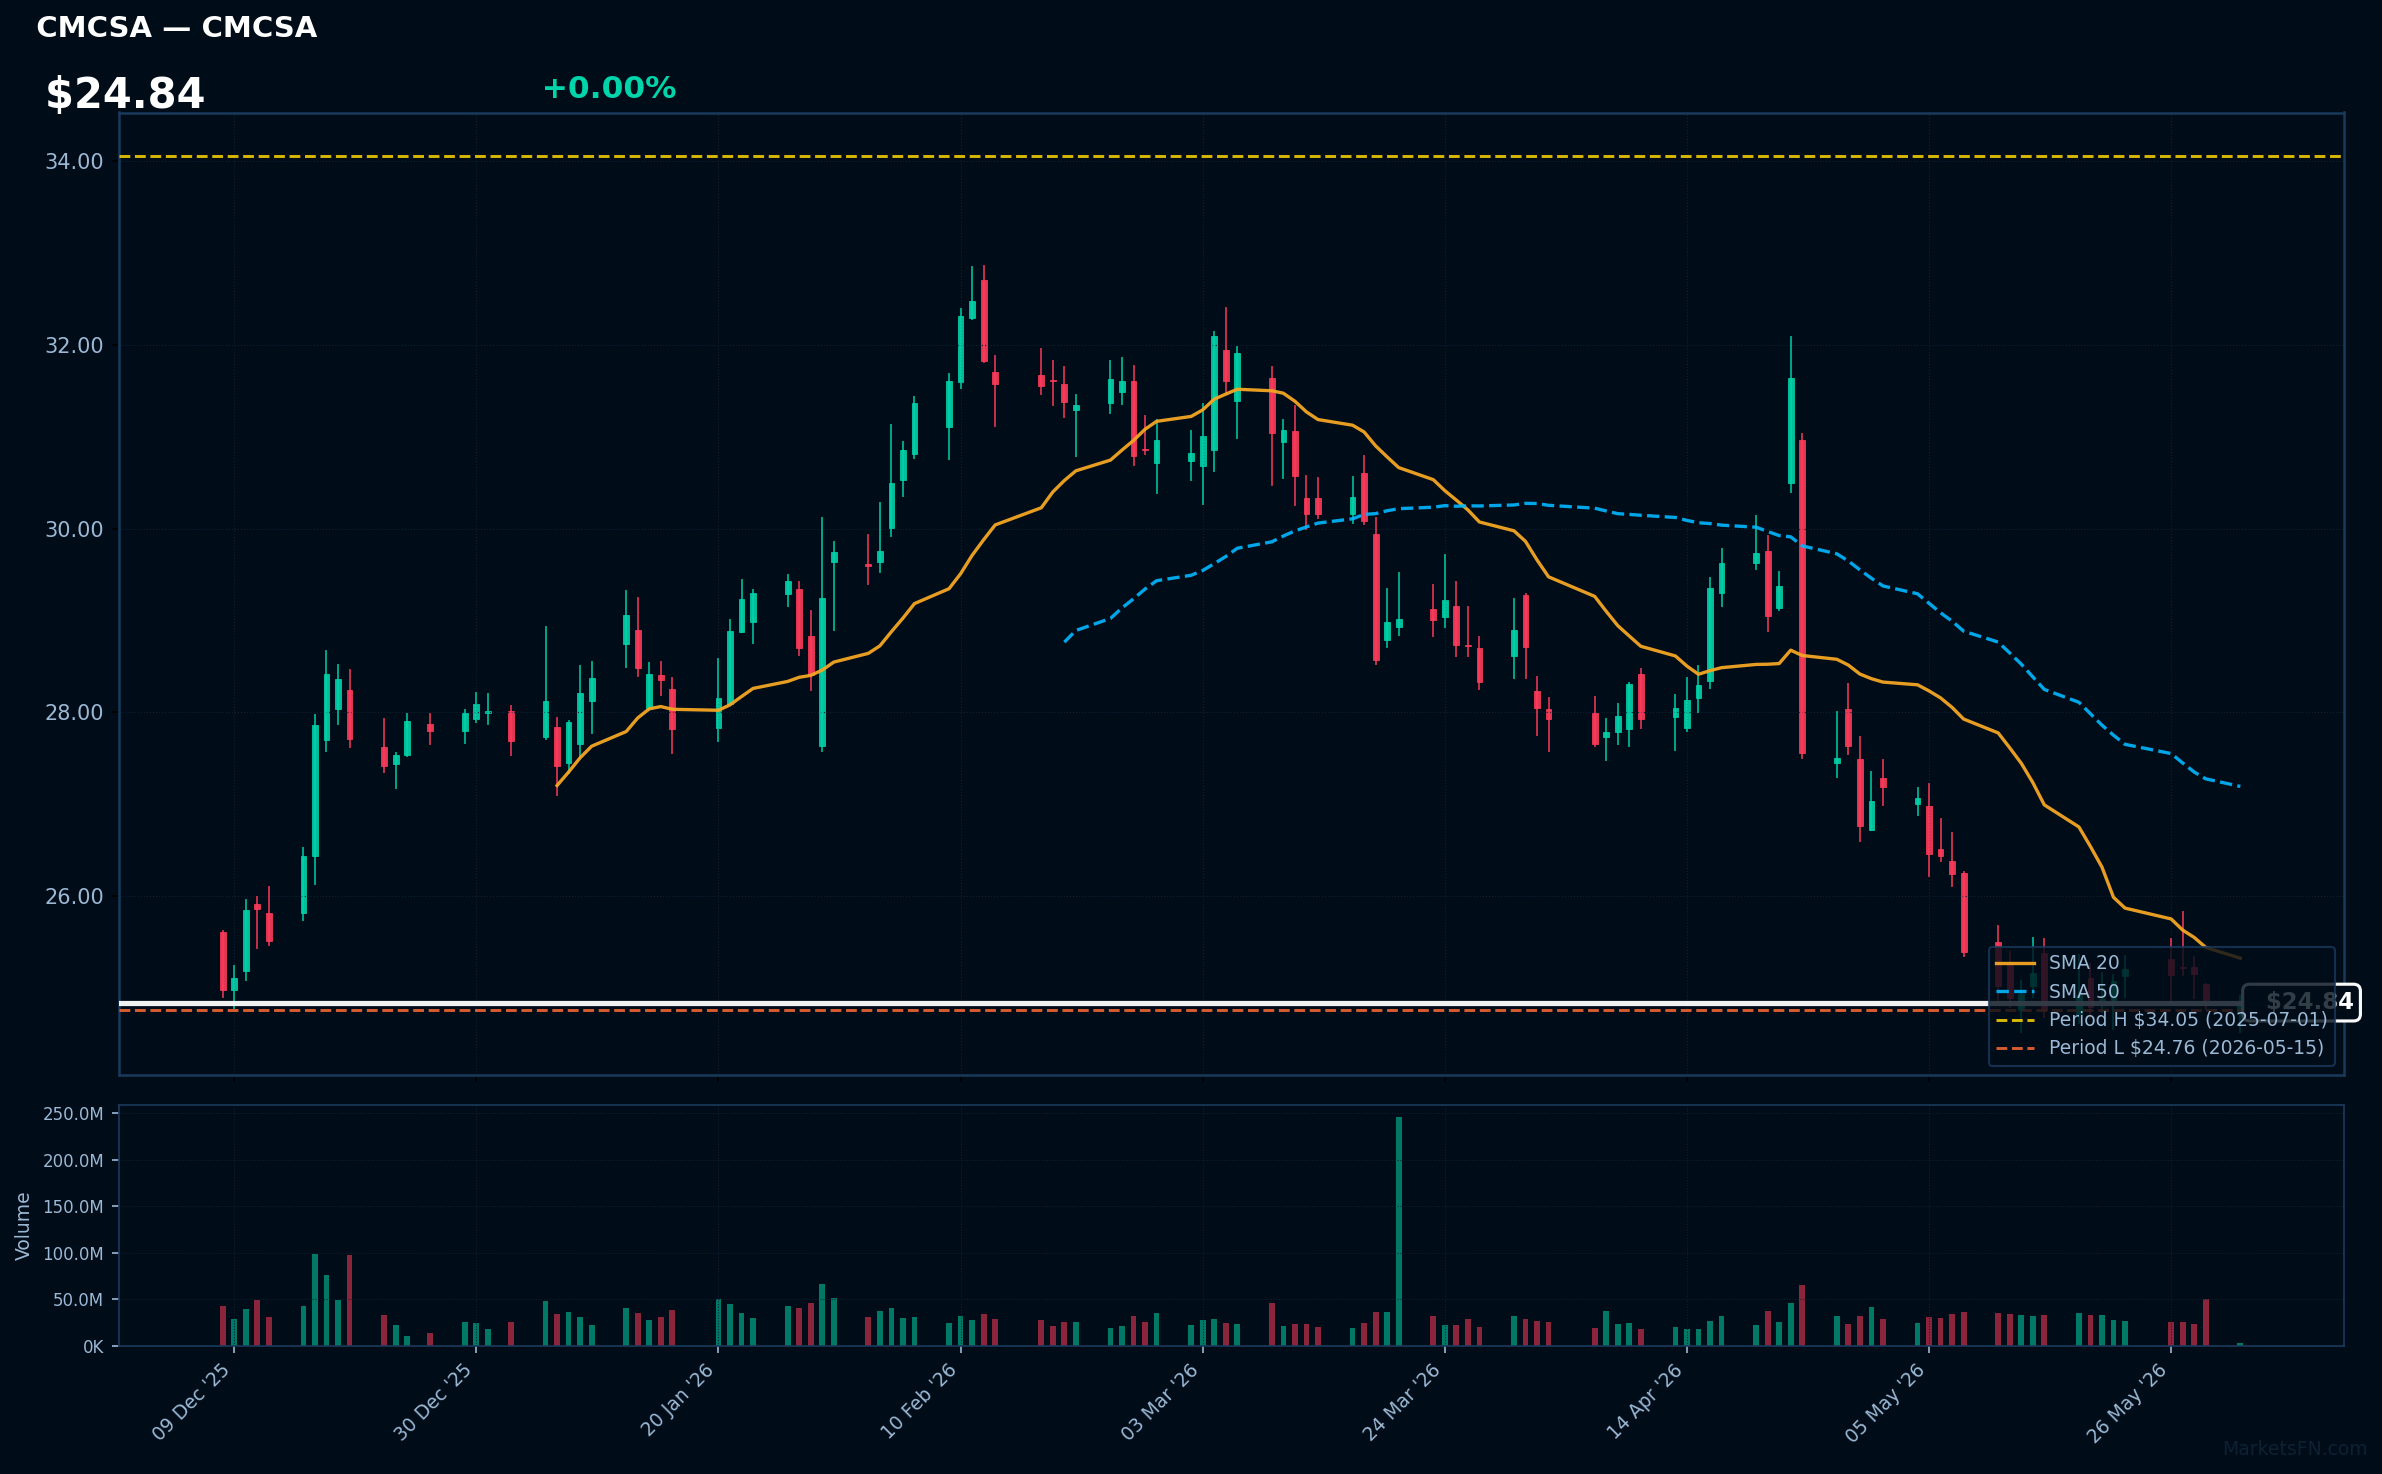
CMCSA | Comcast Corp | Communication Services | Price Last: $24.86 | % Realized: -22.73% | RSI: 34.7 | % above MA200: -12.5% | Trend: Below MA20, MA50, MA200
Comcast Corp is a media and telecommunications conglomerate providing cable television, internet, and phone services, as well as owning NBCUniversal, a major media company with film, television, and theme park assets, making it a significant player in both consumer connectivity and entertainment.
Comcast Corp's technical situation is bearish, with an RSI(14) of 34.7 indicating oversold conditions, price below all key MAs (MA20, MA50, MA200), and a 52-Week low proximity of 0.4%, suggesting a sustained downtrend and testing major support, potentially a warning sign.
Related headlines
- Comcast Opens 20-Acre Kids Resort As Parks Push Expands
- Comcast's Universal Brings More Competition to Regional Parks
- Comcast Business Delivers Advanced Technology Infrastructure at Levis Stadium, Powering the Fan Experience and Stadium Operations
- Bellas Bites Serves Up Family-Inspired Flavor Powered by Comcast Business
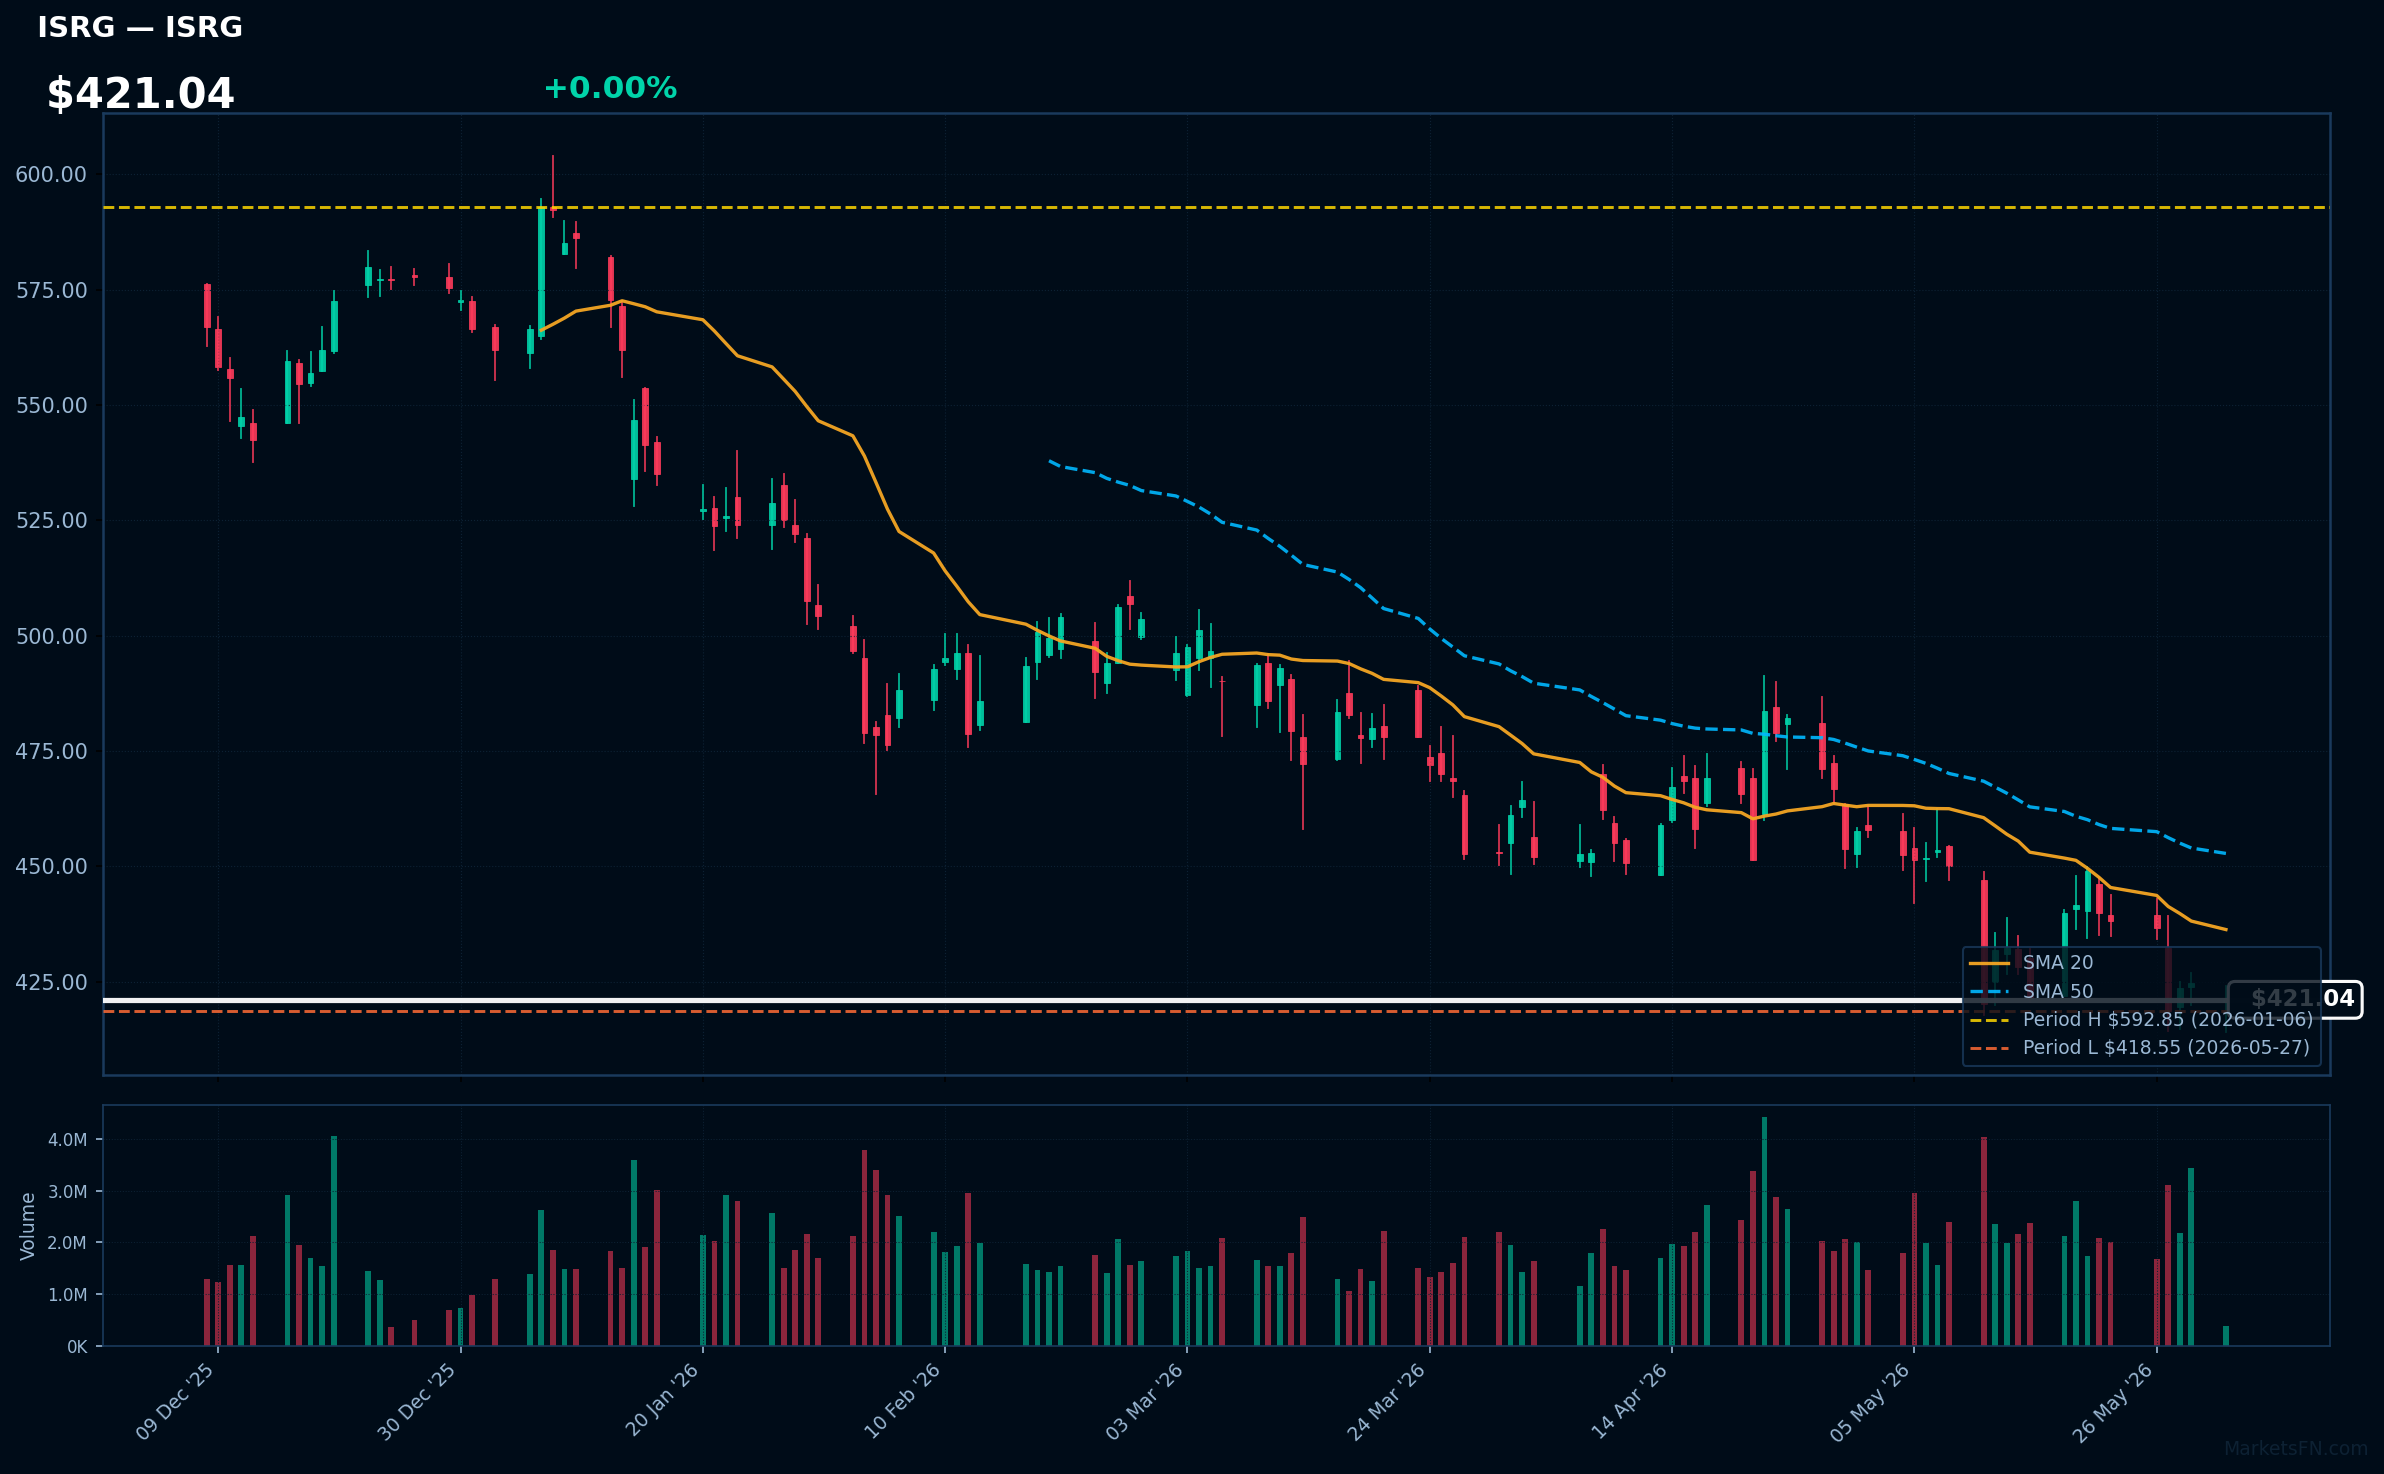
ISRG | Intuitive Surgical Inc | Healthcare | Price Last: $421.04 | % Realized: -23.90% | RSI: 38.5 | % above MA200: -14.9% | Trend: Below MA20, MA50, MA200
Intuitive Surgical Inc develops and markets robotic-assisted surgical systems, primarily the da Vinci Surgical System, enhancing precision and minimally invasive procedures. Investors care due to its dominance in robotic surgery and potential for growth in surgical procedures.
ISRG's technical situation is bearish, with RSI(14) at 38.5, indicating oversold conditions, and a sustained downtrend as price ($421.04) < MA20 < MA50 < MA200. The stock is 0.6% above its 52-Week low, testing major support, with a -23.9% 52-Week return.
Related headlines
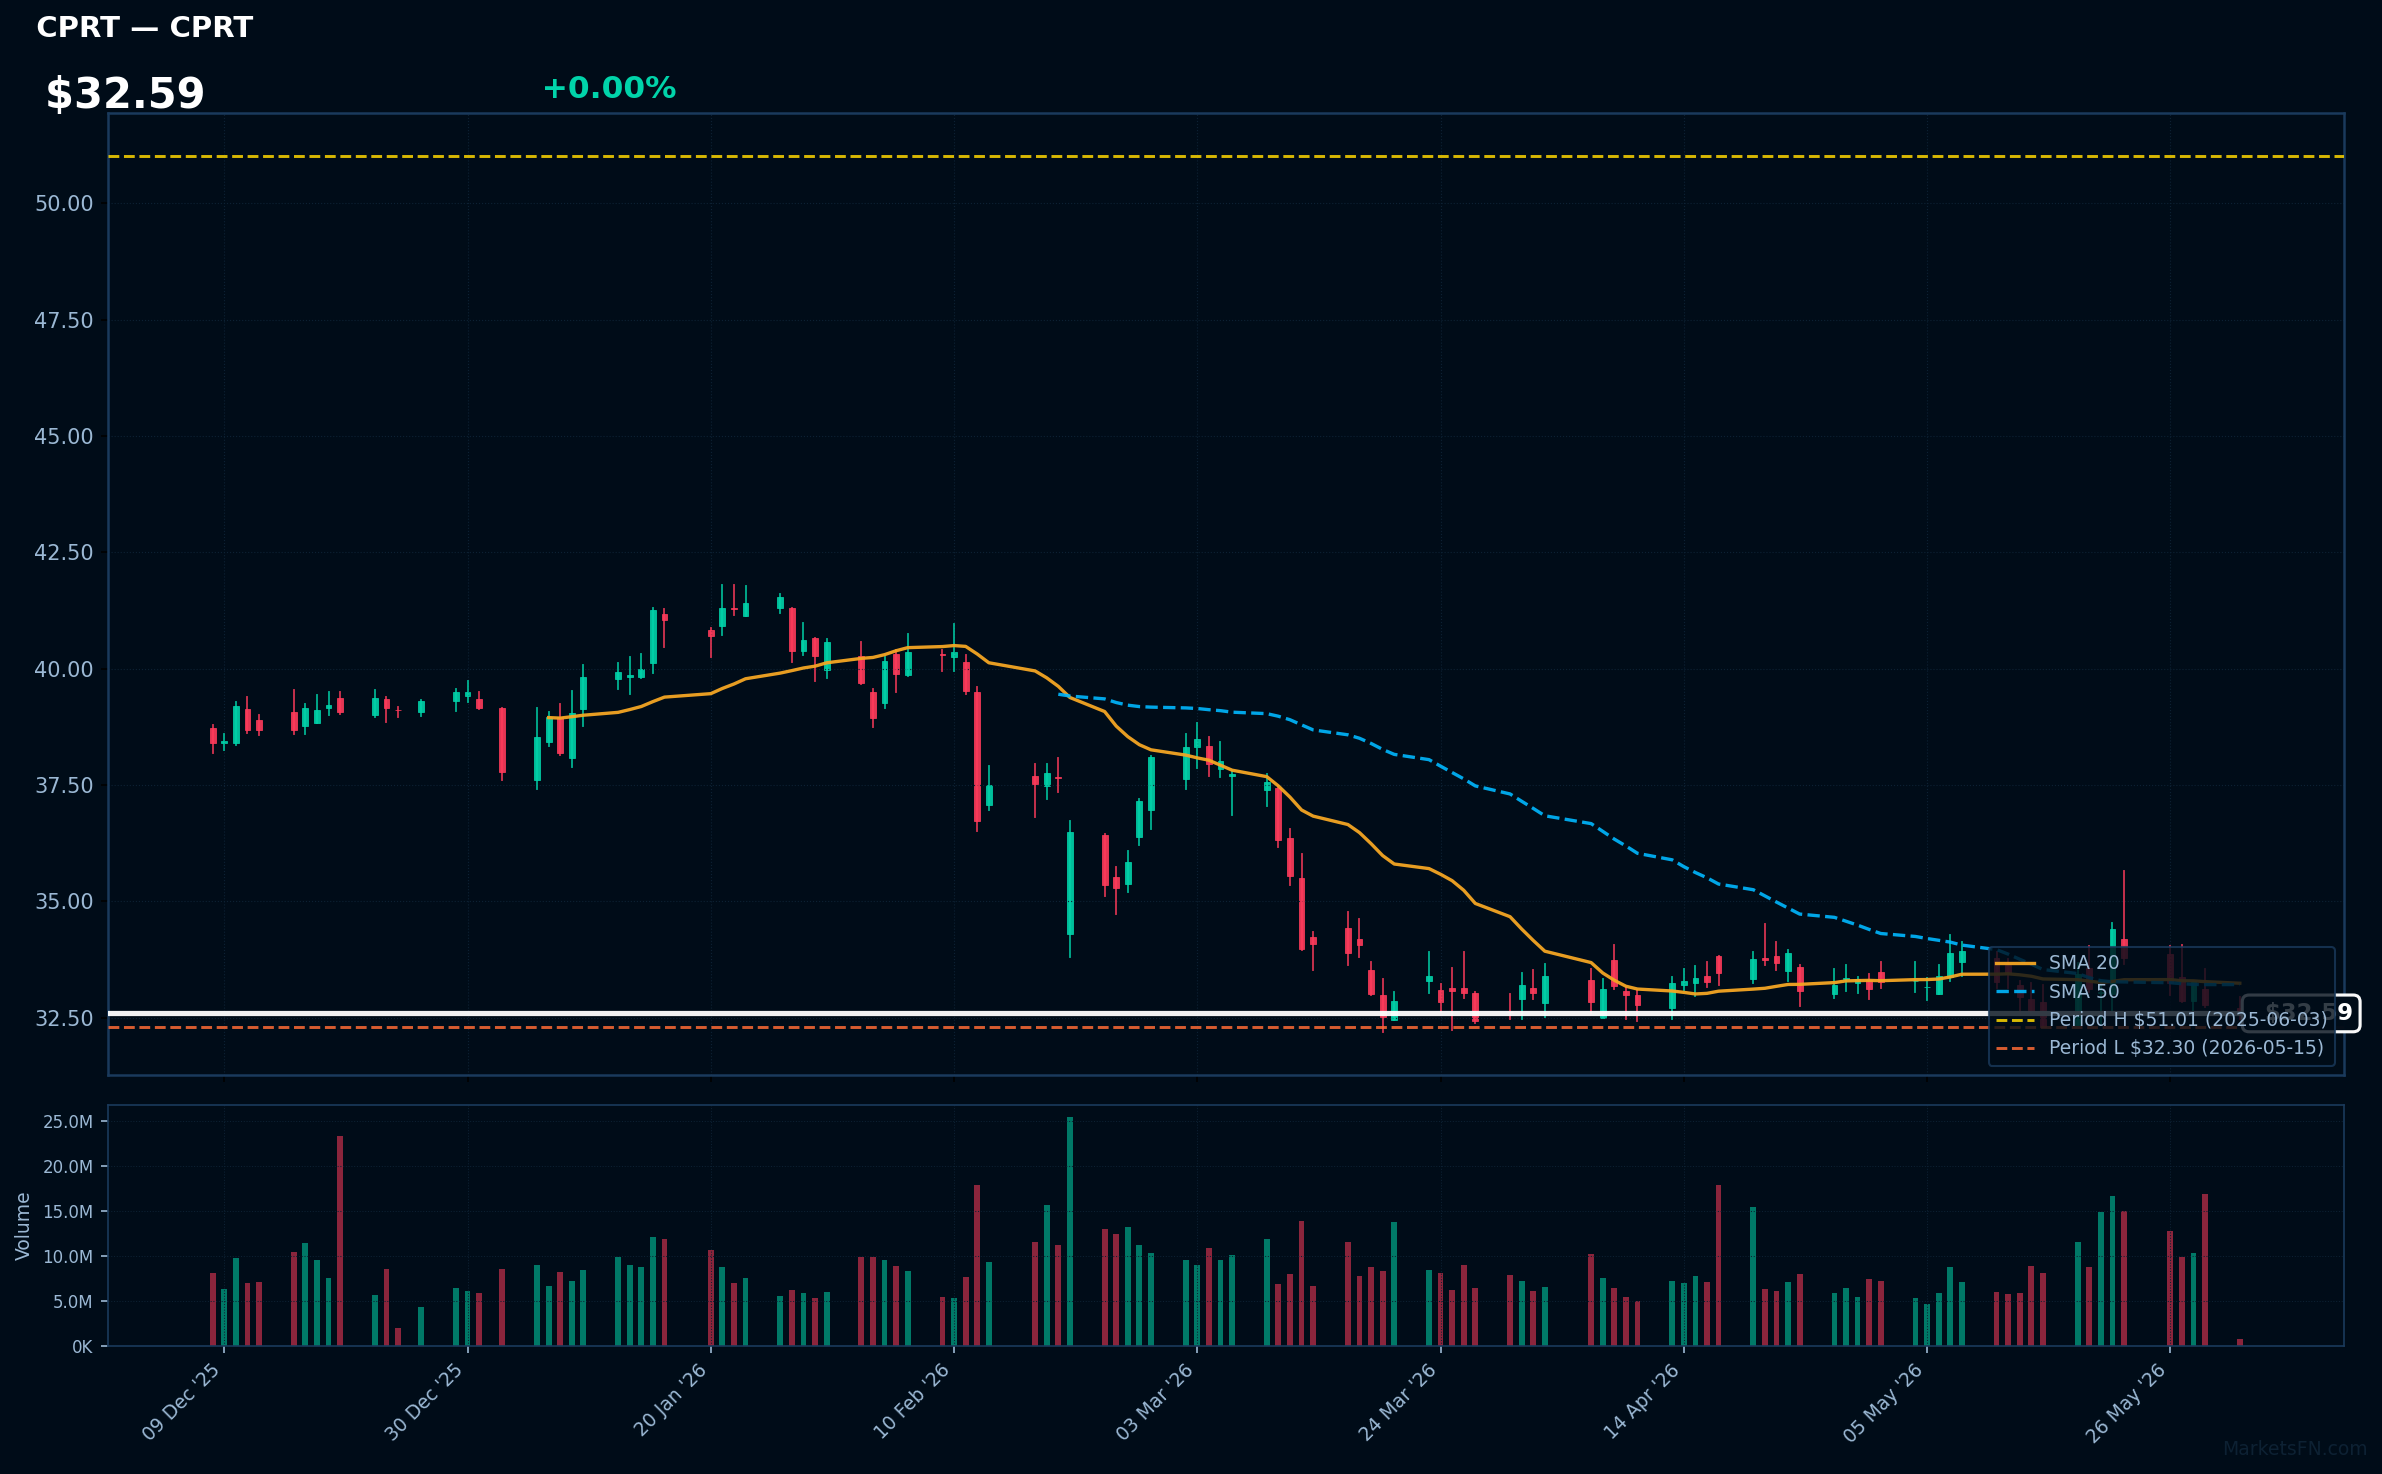
CPRT | Copart, Inc | Industrials | Price Last: $32.58 | % Realized: -35.86% | RSI: 43.5 | % above MA200: -17.5% | Trend: Below MA20, MA50, MA200
Copart, Inc (CPRT) operates online vehicle auction platforms, connecting buyers and sellers of used and salvage vehicles. Investors should care because CPRT's market dominance and fee-based revenue model provide a relatively stable source of income amidst fluctuating vehicle supply.
CPRT's technicals indicate a warning sign: RSI(14) is 43.5, below MA20/MA50/MA200, and the stock is 0.9% above its 52-Week low, testing major support after a -35.9% 52-Week return, signaling potential further downside.
Related headlines
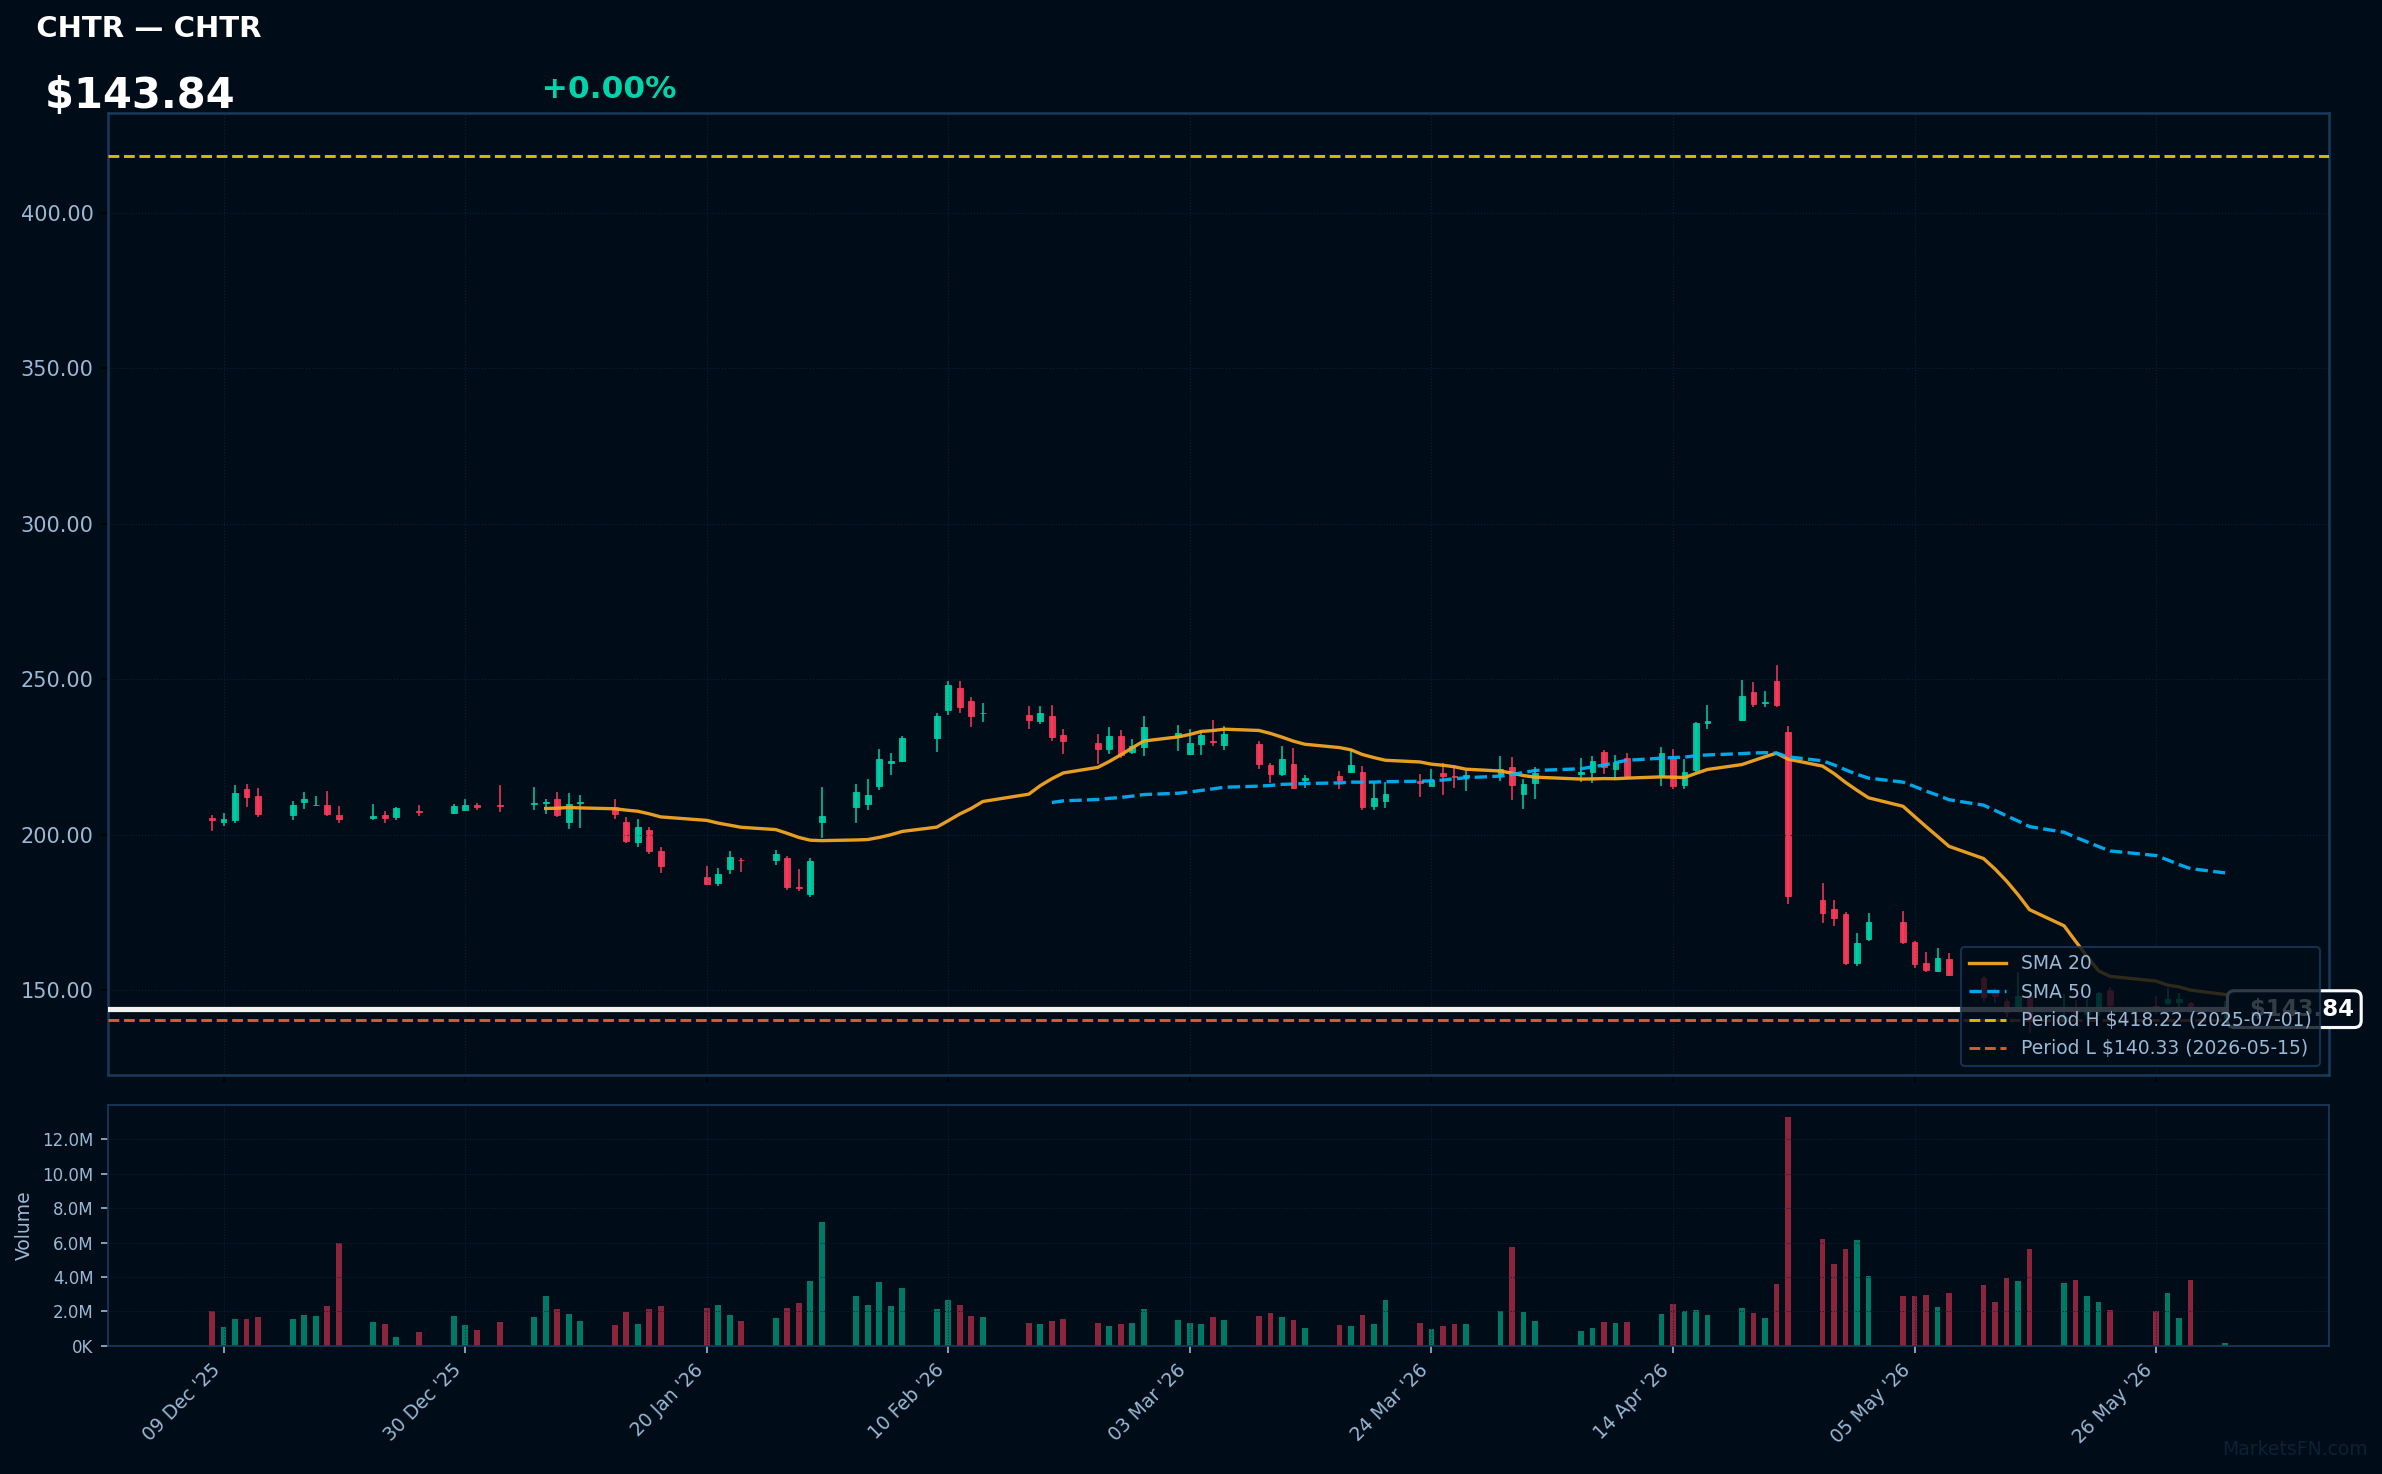
CHTR | Charter Communications Inc | Communication Services | Price Last: $143.84 | % Realized: -63.56% | RSI: 34.1 | % above MA200: -34.7% | Trend: Below MA20, MA50, MA200
Charter Communications Inc is a broadband connectivity company providing cable television, internet, and phone services to residential and commercial customers. Investors should care about its ability to maintain subscriber growth and navigate the competitive landscape.
The stock is in a sustained downtrend with price ($143.84) below MA20, MA50, and MA200. RSI(14) is 34.1, near oversold territory, and the stock is 2.5% above its 52-Week low, testing major support after a -63.6% 52-Week return.
Related headlines
- Charter Communications Inc. Cl A stock underperforms Friday when compared to competitors
- Charter to Participate in J.P. Morgan Global Technology, Media and Communications Conference
- Charter to Participate in MoffettNathanson Media, Internet & Communications Conference
- Stop Valuing CHTR Stock Like It Is Going Out Of Business
Market Commentary
The Nasdaq 100 stocks listed are currently near 52-week extremes, with some at all-time highs and others near their lowest levels over the past year. Stocks like AVGO, ARM, MU, PANW, and CRWD are at their 52-week highs, indicating strong performance, while ORLY, CMCSA, ISRG, CPRT, and CHTR are near their 52-week lows, suggesting potential weakness.
The technology sector is driving these price levels, with companies like Broadcom, Arm Holdings, and Micron Technology reaching new highs, potentially due to strong demand for their products and services. Conversely, companies like Comcast and Charter Communications are near their 52-week lows, possibly due to macro themes such as changing consumer behavior and increased competition.
Key levels to watch include the current prices of these stocks, as a breakout or breakdown could be triggered by various catalysts, such as earnings reports or industry trends. For the stocks near 52-week highs, a continued upward trend could be driven by sustained demand, while for those near 52-week lows, a rebound could be sparked by positive news or a shift in market sentiment.
Methodology: All 101 Nasdaq 100 constituents screened. 52-week high = highest daily close over the past 252 trading days (approx. 1 year). 52-week low = lowest daily close over the same period. Distance = (current price / extreme − 1) × 100. Technical indicators computed on up to 1 year of daily OHLCV data.
Disclaimer: For informational purposes only. Not investment advice. Past performance is not indicative of future results.